Article

Chiral Pyrazolo[4,3-e][1,2,4]triazine Sulfonamides—Their Biological Activity, Lipophilicity, Protein Affinity, and Metabolic Transformations

1
Department of Chemistry, Siedlce University of Natural Sciences and Humanities, 3-go Maja 54, 08-110 Siedlce, Poland
2
Department of Pharmaceutical Technology and Biochemistry, Gdansk University of Technology, 80-233 Gdańsk, Poland
3
Department of Chemistry, University of Life Sciences, Akademicka 15, 20-950 Lublin, Poland
4
Department of Histology, Embriology and Cytophysiology, Medical University of Lublin, Radziwiłłowska 11, (Collegium Medicum), 20-080 Lublin, Poland
*
Author to whom correspondence should be addressed.
Appl. Sci. 2021, 11(6), 2660; https://doi.org/10.3390/app11062660
Submission received: 6 February 2021 / Revised: 3 March 2021 / Accepted: 5 March 2021 / Published: 16 March 2021

Abstract

:
Referring to our previous laboratory results related to the tyrosinase and urease inhibition by pyrazolo[4,3-e][1,2,4]triazine sulfonamides, we examined here in silico the mechanism of action at the molecular level of the investigated pyrazolotriazine sulfonamides by the molecular docking method. The studied compounds being evaluated for their cytotoxic effect against cancer cell lines (MCF-7, K-562) and for recombinant Abl and CDK2/E kinase inhibitory potency turned out to be inactive in these tests. The pyrazolotriazines were also investigated with respect to their lipophilicity and plasma protein binding using HPLC chromatography in isocratic conditions. The observed small affinity for plasma proteins could be advantageous in the potential in vivo studies. Moreover, the compounds were sensitive to metabolic transformations with phase I enzymes, which led to the hydroxylation and dealkylation products, whereas phase II transformations did not occur.

1. Introduction

Among 1,2,4-triazines condensed with a five-membered heterocycle, the pyrazolo [4,3-e][1,2,4]triazine system is a novel scaffold and important source for the construction of bioactive molecules. Moreover, it has been studied less in comparison with the other fused pyrazolotriazines. Its natural derivatives, such as pseudoiodinine, nostocine A and fluviols A-E, have been indicated in the extracellular metabolites of cyanobacterium of the class Pseudomonas fluorescens var. pseudoiodinine [1] and Nostoc spongiaeforme [2]. These compounds inhibit the growth of gram-positive and gram-negative bacteria and exhibit antitumor activity [3]. The lack of significant biological properties in the group of simple substituted pyrazolotriazine derivatives forced further functionalization of the heterocyclic core. The combination of the naturally occurring pyrazolo[4,3-e][1,2,4]triazine ring system with pharmacophore groups enabled the design of higher potential biological activity for new derivatives. An important group among pharmacophores is a sulfonamide moiety characteristic for many chemical compounds used in medicine [4,5]. Its importance stems from the diverse biological activity of such substituted compounds, which includes antibacterial, antimalarial, hypotensive, diuretic, hypoglycemic, antithyroid, antiparasitic, anti-inflammatory and antiglaucomatous properties [6]. The literature reports show that sulfonamides can act as inhibitors of enzymes such as phosphodiesterase type 5 (PDE5) [7], carbonic anhydrase [8,9], tyrosinase [10,11] or cyclin-dependent kinases (CDKs) [12,13]. Furthermore, studies have shown that sulfonamides may exhibit a cytotoxic effect by inhibiting the activity of carbonic anhydrase in tumor cells (CA; EC 4.2.1.1) [14,15,16]. It has been shown that two isoenzymes of carbonic anhydrase, such as CA IX and CA XII, are clearly associated with significant overexpression in many tumors [17,18], and they are involved in key processes associated with the tumor progression and the response to treatment [19].
In order to characterize the structural and electronic parameters—as well as the reactivity and stability parameters—of all investigated compounds 8am, theoretical calculations at the DFT level were performed. Our previous pharmacological studies showed that all chiral sulphonamides 8aj exhibited significant inhibitory activity on mushroom tyrosinase and jack bean urease [20]. Therefore, molecular docking studies were carried out to investigate in silico the affinity for the active sites of protein enzymes selected from the PDB database.
Adsorption distribution and other pharmacokinetic properties of the molecules were considered in the next step of the drug discovery process. The high throughput measurements of membrane interactions and plasma protein binding (PPB) are performed using different chromatography techniques. Reversed phase chromatography on octadecyl (C-18), cholesterol or phosphatidylcholine (immobilized artificial membrane (IAM)) in a stationary phase are used for lipophilicity determination [21]. To evaluate the extent of compound-to-plasma protein binding, HPLC affinity chromatography with immobilized human serum albumin (HSA) and α1-glycoprotein (AGP) is applied [21]. Continuing our research on the chiral pyrazolo[4,3-e][1,2,4]triazine sulfonamides [22], here we will discuss their biological activity, lipophilicity and metabolic transformations. The isocratic HPLC chromatography studies include the assessment of the compounds’ lipophilicity using octadecyl (C-18) and IAM stationary phases, while the extent of compound-to-protein binding was determined in the relation to the human serum albumin (HSA) and α1-glycoprotein (AGP). Moreover, the characterization of molecular structures and electronic parameters of the molecules of all investigated compounds was carried out using the theoretical calculations at the DFT/B3LYP/311++G(d,p) level. Virtual screening by the molecular docking method was performed based on the obtained results of biological tests for analyzed sulfonamides.

2. Results and Discussion
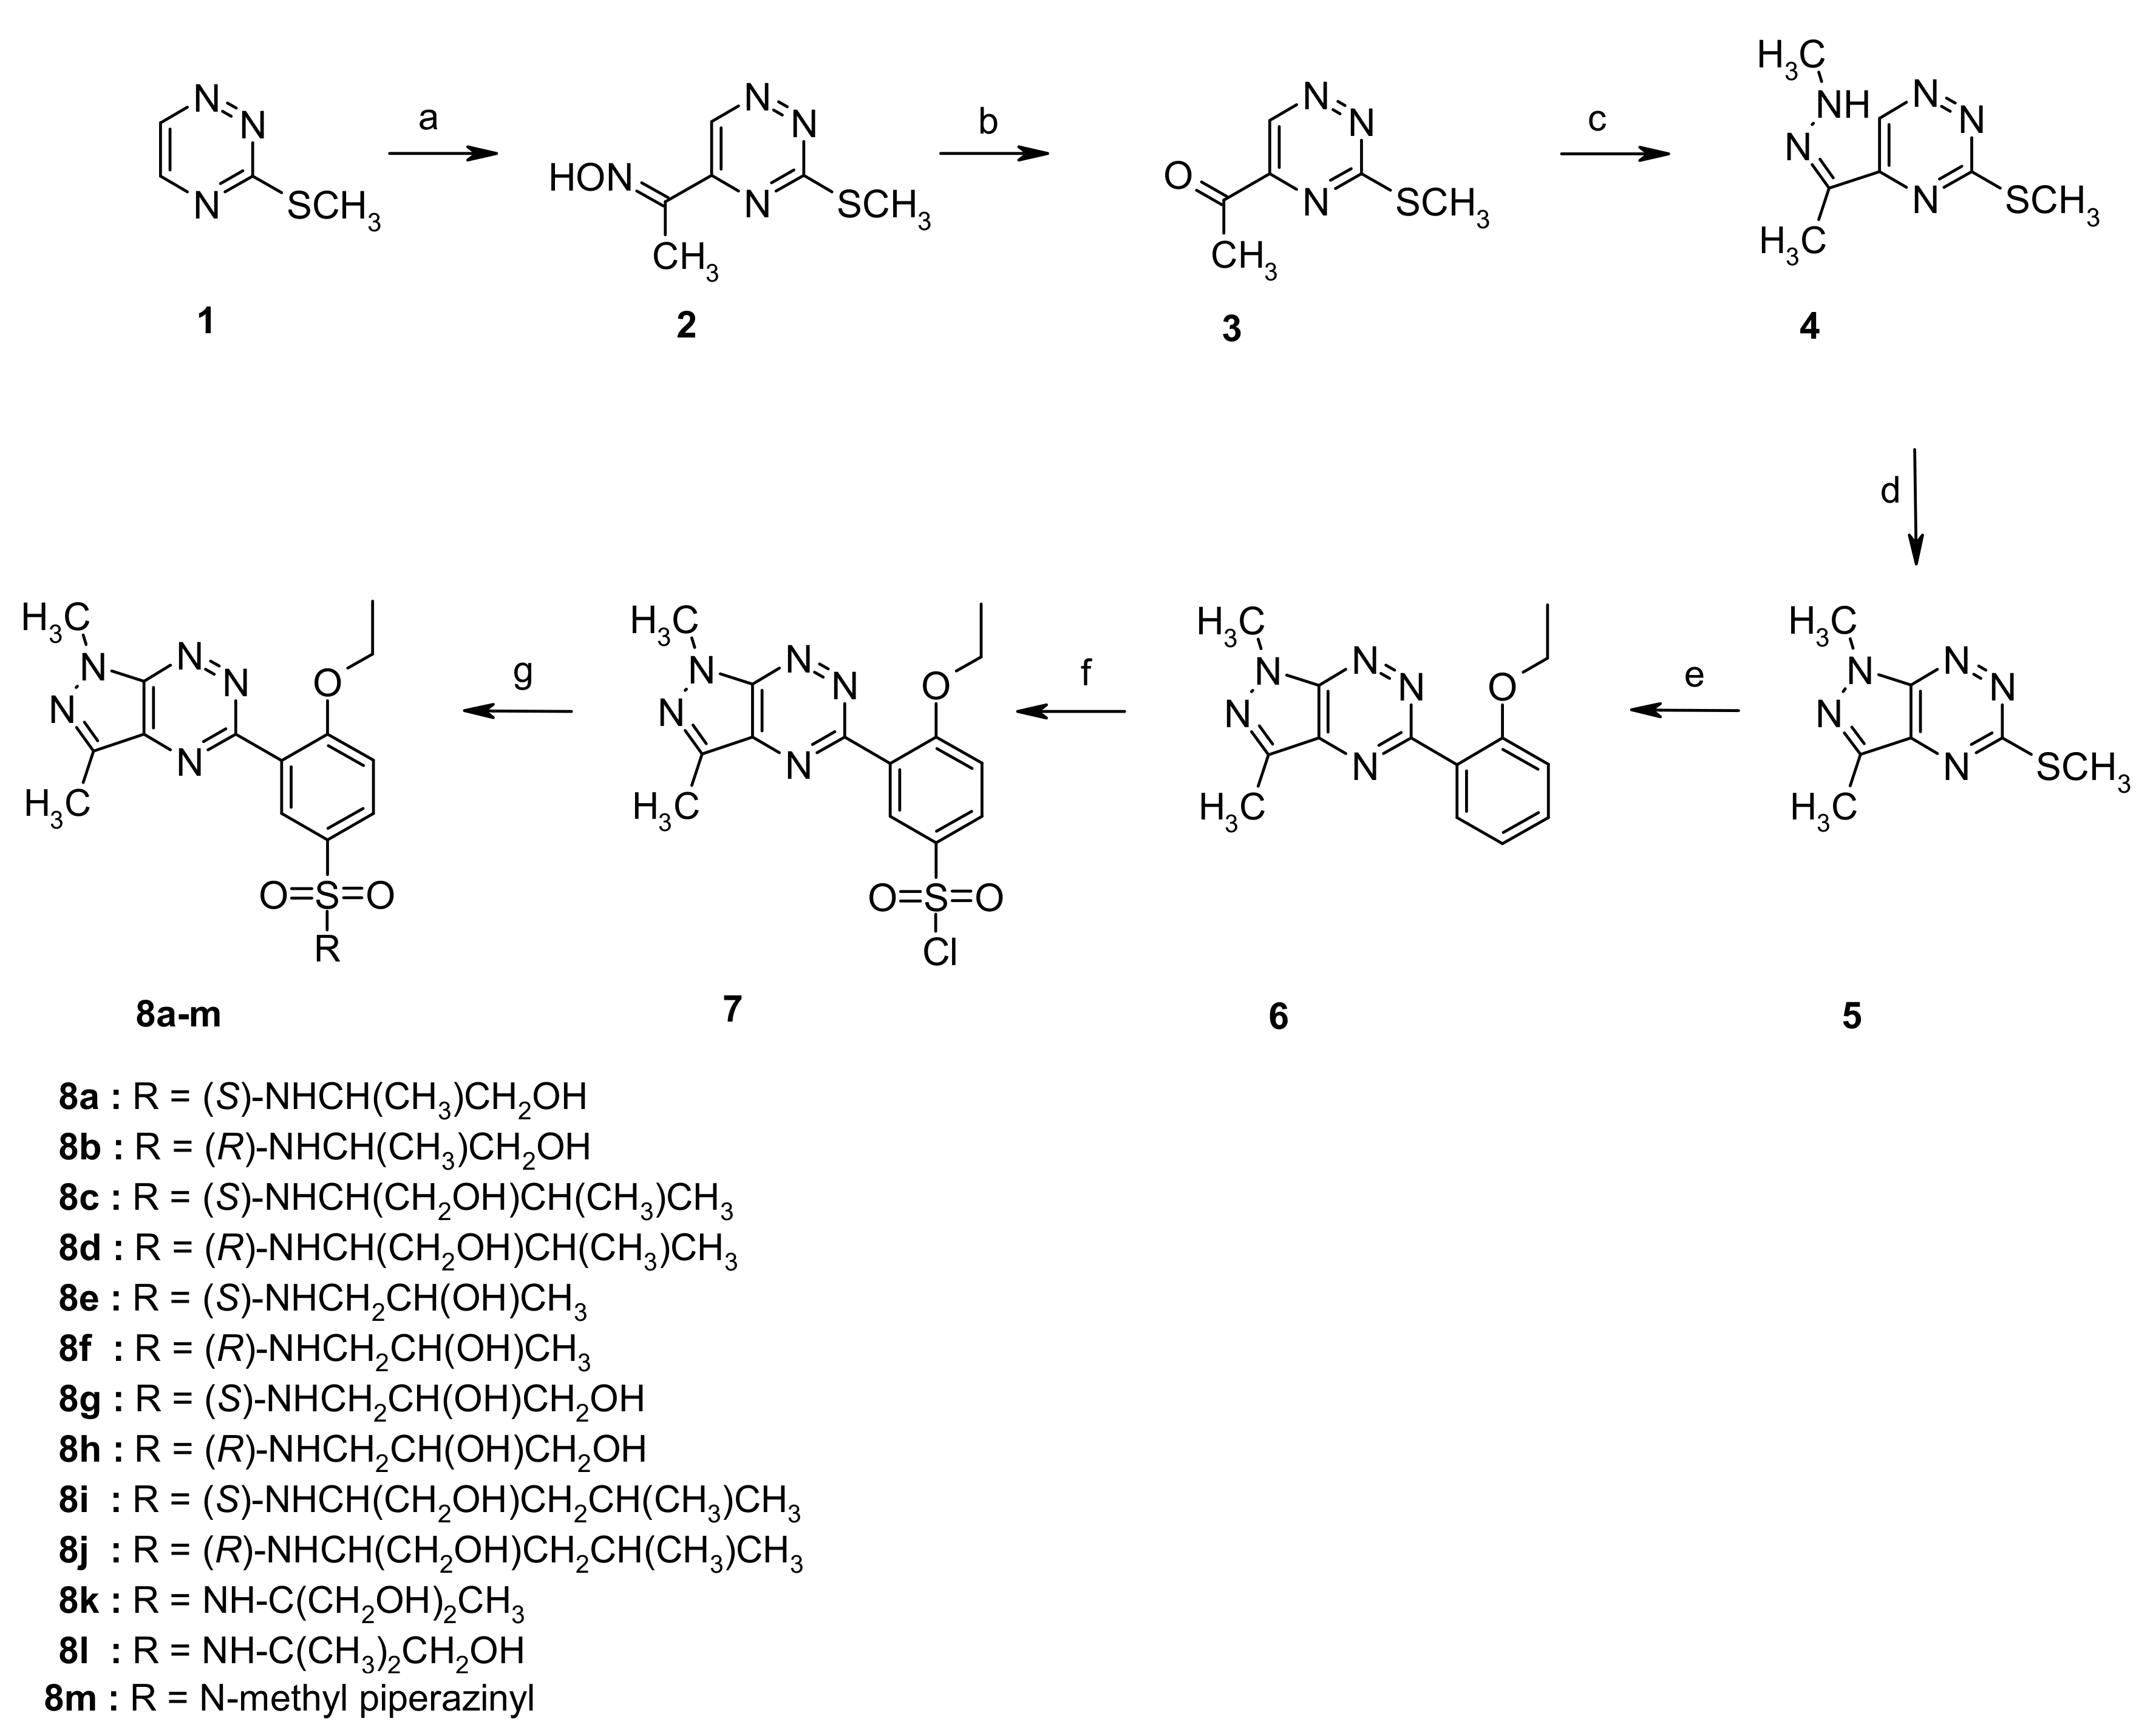
2.1. Chemistry

The multistep synthesis of the target sulfonamides 8am is presented in Scheme 1. Briefly, in the first step, oxime 2 was obtained and readily transformed into ketone 3 in a good yield [23,24]. Next, the appropriate hydrazone 4 was prepared as a key intermediate for the preparation of 1H-pyrazolo[4,3-e][1,2,4]triazine 5. The hydrazone 4 could be converted into derivative 5 under conventional heating (10% HCl, EtOH, reflux, 1 h) [25] or under solvent-free reaction conditions, according to our previously published procedure [26]. In the next step, using palladium-catalyzed cross-coupling reaction conditions and 2-ethoxyphenylboronic acid in the presence of copper (I) 3-methylsalicylate derivative 6 furnished in an excellent yield [27]. The chlorosulfonylation reaction of compound 6 in neat chlorosulfonic acid at 0 °C proceeded smoothly and selectively at the 5′-position of the phenyl ring to give the desired product 7 [28] as a key intermediate for the synthesis of the final sulfonamides 8am in a high yield.

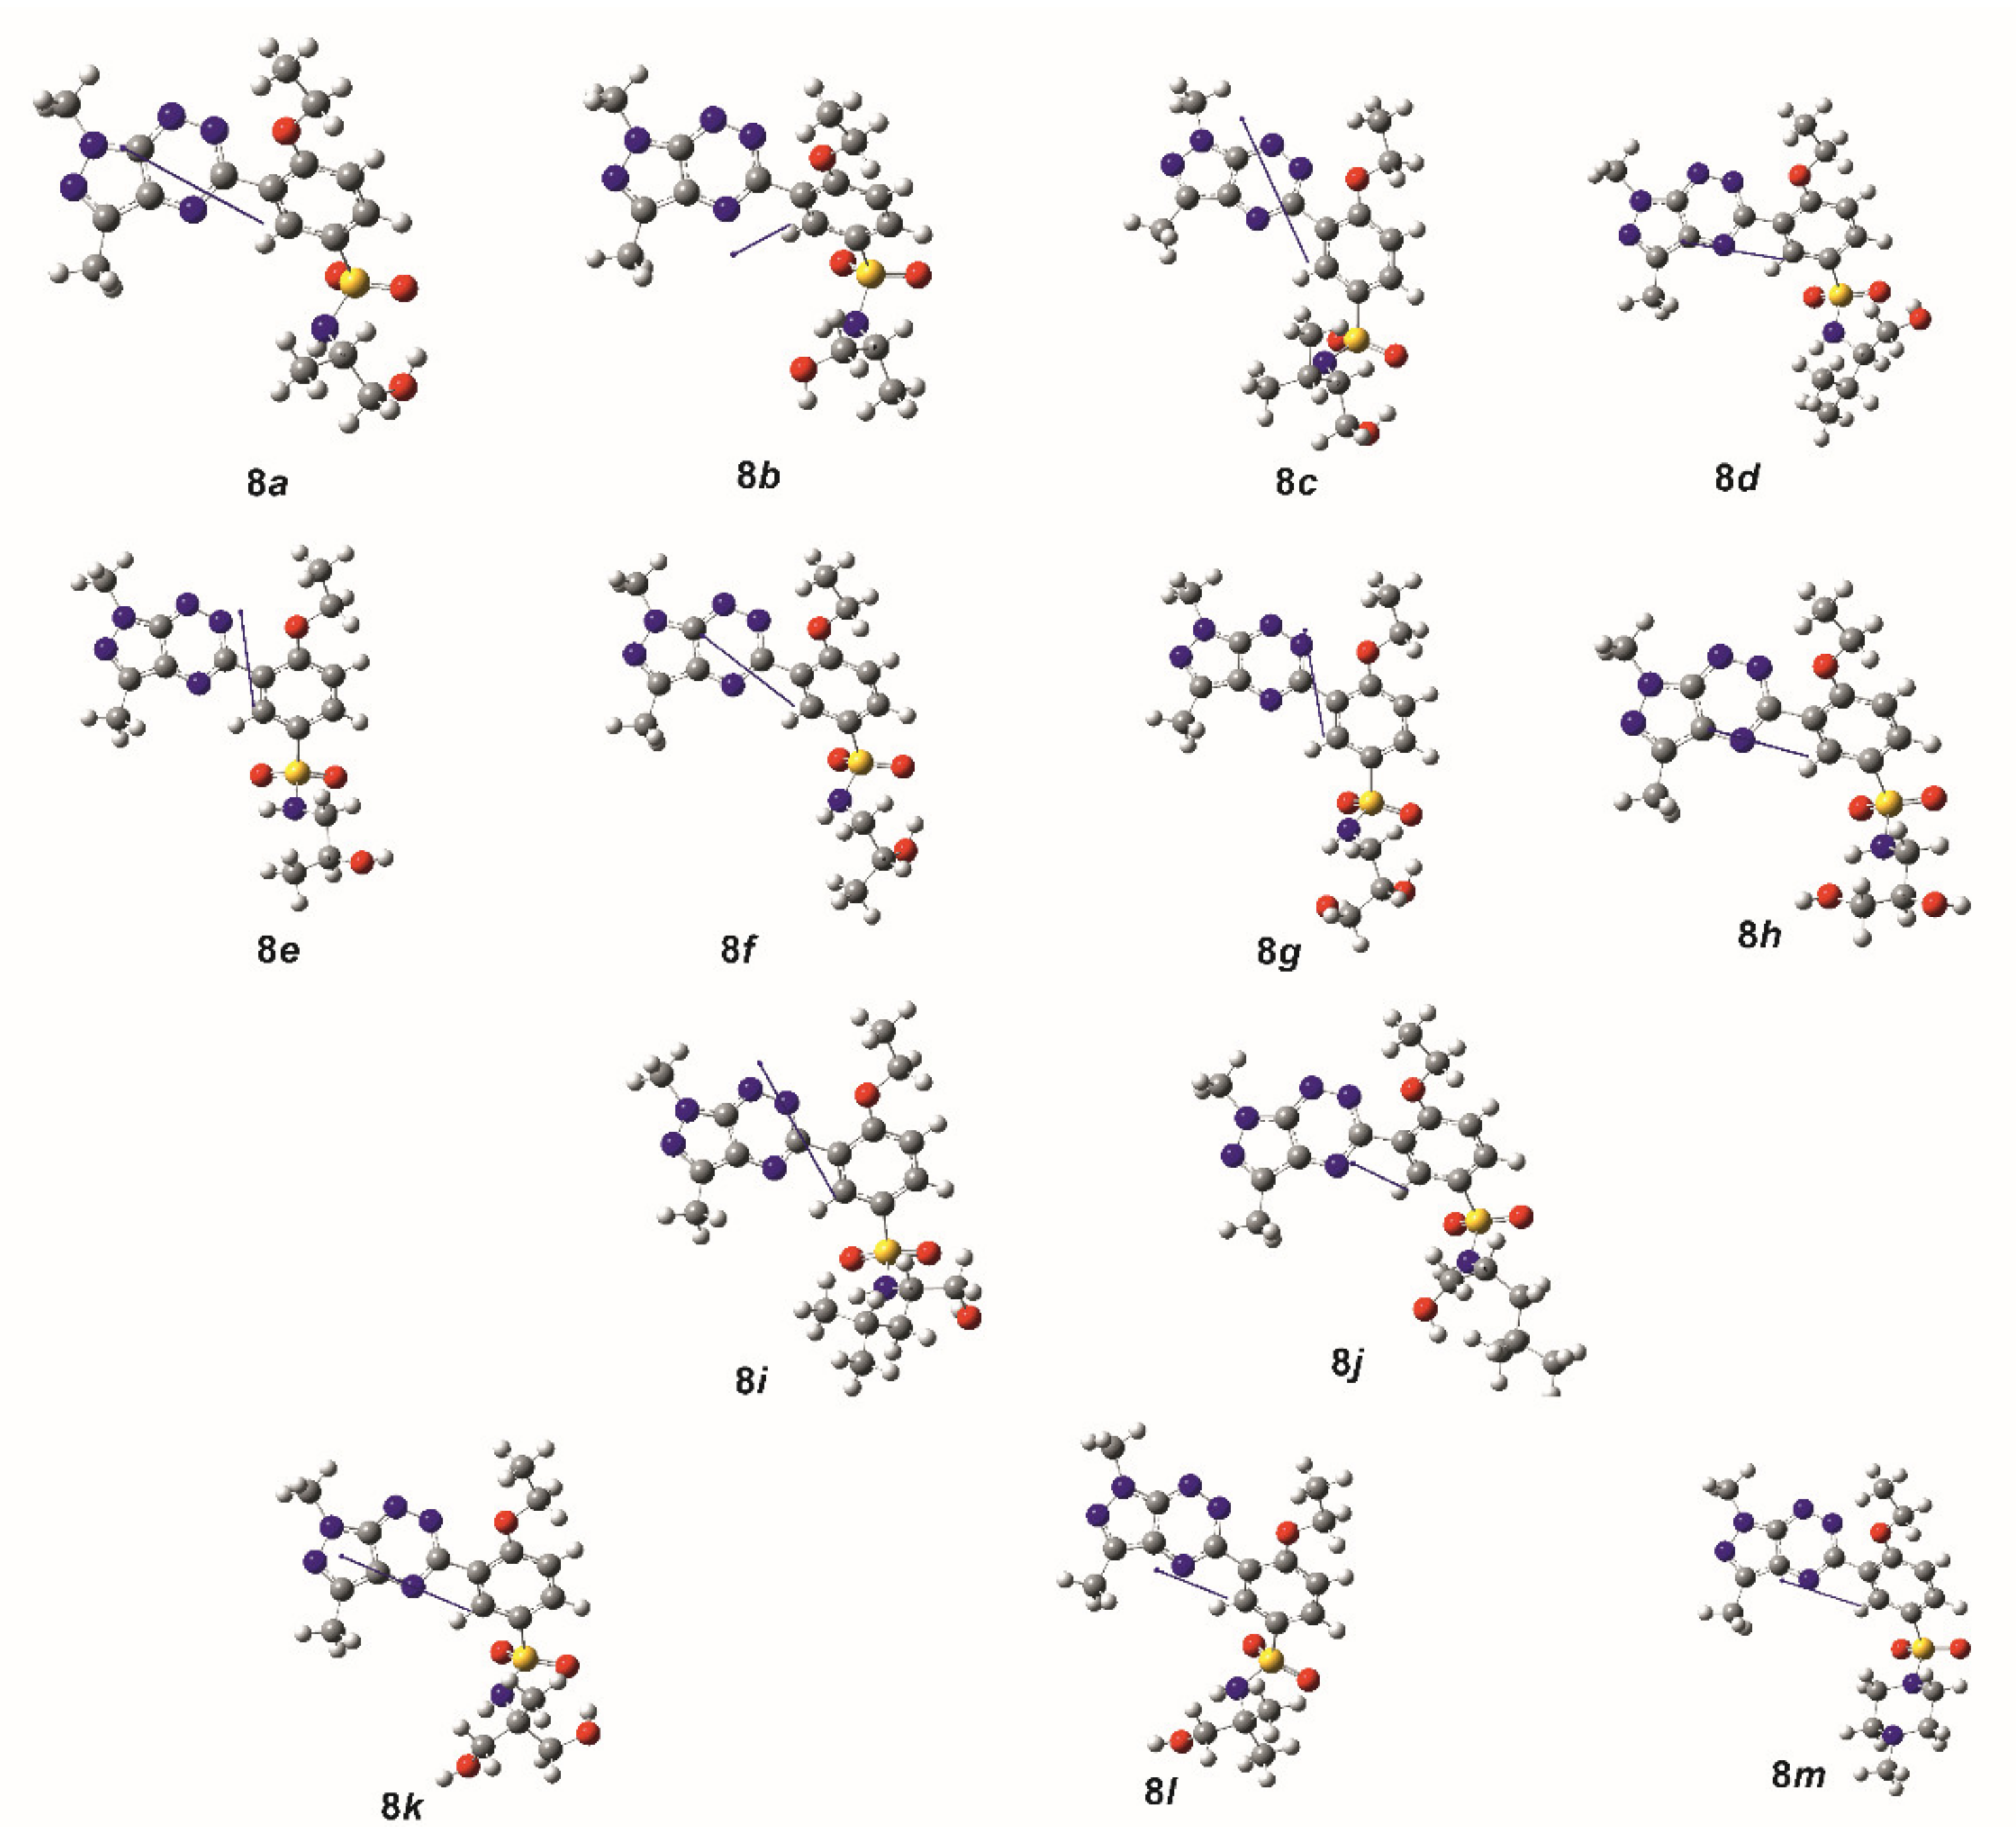
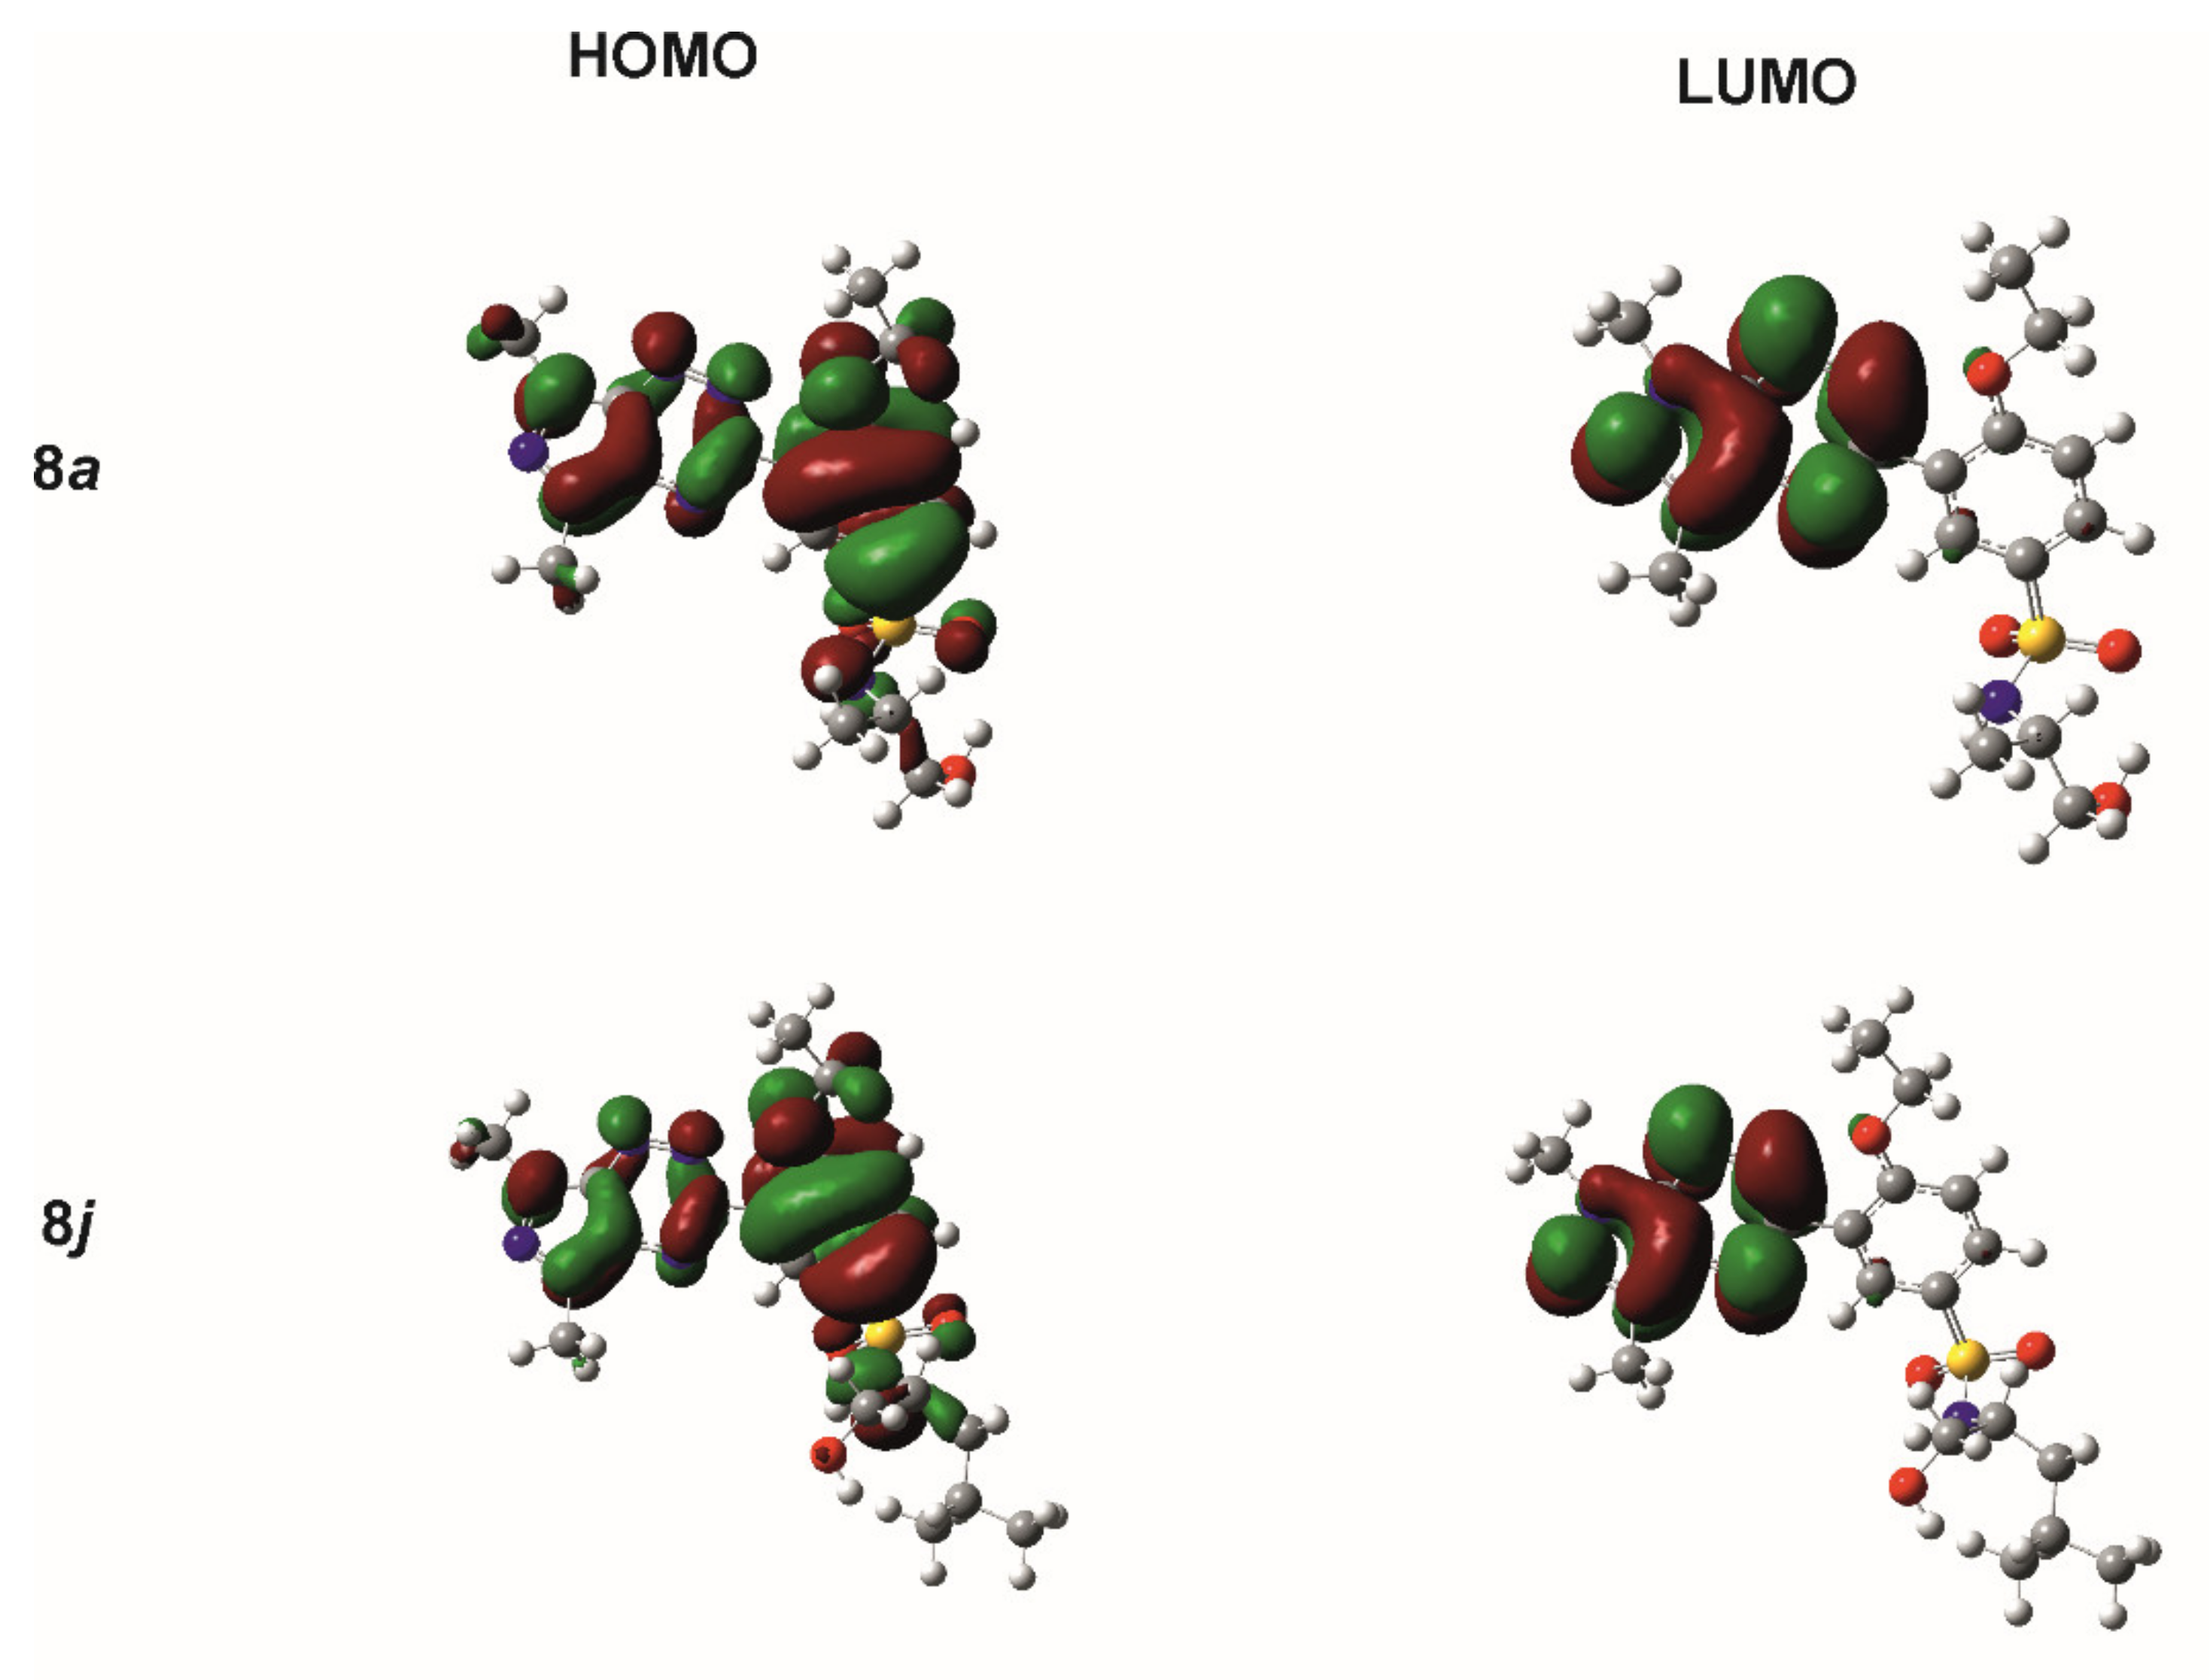
2.2. Theoretical Calculations

The theoretical calculations at the DFT/B3LYP/311++G(d,p) level for all investigated sulfonamides were carried out in order to characterize the molecular structures and electronic parameters of molecules 8am. In addition, theoretical calculations provided the molecular structures of the analyzed molecules for the molecular docking study. The view of molecules 8am in conformation obtained after energy minimization and geometric parameter optimization with the vector’s dipole moment is shown in Figure 1.
The conformation of the common pyrazolo[4,3-e][1,2,4]triazine-ethoxybenzene-sulfonamide structural part of the molecules was described by five torsion angles: φ1 = N2–C3–C12–C13, φ2 = C12–C13–O18–C19, φ3 = C13–O18–C19–C20, φ4 = C17–C16–S21–N24 and φ5 = C16–S21–N24–X (Figure 2). The values of these torsion angles are presented in Table 1.
The torsion angle φ1 shows that the pyrazolotriazine and benzene rings were twisted to each other, adopting the gauche conformation for all molecules. The ethoxy substituent of the benzene ring had transtrans conformation, as shown by the torsion angles φ2 and φ3. The sulfonamide part of molecules 8am adopted gauche–gauche conformation, confirmed by torsion angles φ4 and φ5. It should be noted that in all molecules, a very similar conformation of their common structural part was observed, with greater differentiation being observed in the conformation of the sulfonamide fragment, where the torsion angles φ4 and φ5 varied within a range of 33° and 53°, respectively. Moreover, this conformation did not depend on the type of sulfonamide substituent and its chirality. It should be noted that the conformations of 8am obtained from theoretical calculations were similar to that observed in the crystalline state for the structurally similar 3-(1,3-dimethyl-1H-pyrazolo[4,3-e][1,2,4]triazin-5-yl)-4-ethoxybenzene-sulfonamide, where the torsion angles φ1, φ2, φ3 and φ4 were 38.1(3)°, 172.94(17)°, 178.53(18)° and −109.85(19)°, respectively [29].
The electronic parameters theoretically calculated for compounds 8am in the conformation of the molecules obtained in their minimum energy are presented in Table 2.
For the reactivity and stability descriptors of molecules 8am, the frontier orbitals HOMO and LUMO were used. The energies of the HOMO and LUMO orbitals were very similar for all investigated compounds, changing in the range of 9.124 and 2.253 kcal/mol for EHOMO and ELUMO, respectively. It is worth noting that the lowest value of ionization potential of 145.160 kcal/mol and the lowest energy gap ΔE = ELUMOEHOMO of 82.304 kcal/mol had a compound 8m, while for the other compounds, the energy gap varied within a narrow range from 87.355 kcal/mol for 8l to 89.927 kcal/mol for 8a. The graphical representation of the wave functions of the HOMO and LUMO orbitals for compounds 8a and 8j, exhibiting the highest inhibitory activity among the tested compounds on mushroom tyrosinase and jack bean urease, respectively, is shown in Figure 3. For both molecules, the HOMO orbital was concentrated practically on the pyrazolo[4,3-e][1,2,4]triazine-ethoxybenzenesulfonamide system, while the LUMO orbital was distributed on the atoms of the pyrazolo[4,3-e][1,2,4]triazine ring. A similar distribution of frontier orbitals was observed in the molecules of other compounds. This indicated the clearly similar reactivity and stability of the investigated compounds and their similar behavior under physiological conditions.
Theoretical calculations showed that all molecules were polar with the dipole moment values changing from 6.287 D for 8e to 8.453 D for 8i. The dipole moment vectors were directed in most cases from the ethoxybenzenesulfonamide substituent to the pyrazolo[4,3-e][1,2,4]triazine system (Figure 1). The value and spatial orientation of the dipole moment vector is strictly connected with the net charge distribution on the atoms. The net atomic charges calculated using the NBO method are presented for selected atoms in Table 3. As expected, relatively large negative charges were observed at the nitrogen and oxygen atoms of the pyrazolo[4,3-e][1,2,4]triazine and sulfonamide systems, while the largest positive charge was observed at the sulphur atom. It can be seen that the atomic charges were very similar in all analyzed molecules; however, slight differences were observed in the charge value on the amine nitrogen atom N24, depending on the type of substituent of the sulfonamide group.

2.3. Antiproliferative Activity against Tumor Cell Lines

Scientific reports indicated that some pyrazolo[4,3-e][1,2,4]triazine sulfonamides showed moderate anti-cancer properties and represented new scaffolds of protein kinase inhibitors, which are still of interest for oncological drug discovery, especially because of the emerging resistance to currently used drugs [30,31]. Therefore, cytotoxic activity was suspected for these molecules. We examined the effect of compounds 8al on the viability of breast (MCF-7) and leukemia (K-562) cancer cells, the inhibitory potency against protein kinases Abl and CDK2/cyclin E, as well as protein p53 as a tumor suppressor that triggers apoptosis via multiple pathways, including cell cycle arrest and the regulation of autophagy through transactivating proapoptotic genes and repressing antiapoptotic genes. The obtained results are presented in Table 4 as IC50. Unfortunately, none of the compounds expressed cytotoxicity within the tested concentration range.

2.4. Lipophilicity and Protein Affinity

Considering the lack of cytotoxicity against the selected tumor cell lines and against several in vitro tests we undertook for the studies presented above, which were expected to explain the reason for these results, we undertook studies on the detailed analysis of the physicochemical properties of our compound as lipophilicity and protein affinity.
At the beginning, the UV-Vis spectra of compound 8g were made to find out the influence of a pH solution on the electronic structure of the compound and its retention in the chromatographic system. The lack of influence of the pH solution on the electron structure of the compounds was demonstrated. As a pH = 7.4 was recommended for the IAM chromatographic studies, C-18 chromatography evaluation was made at this physiological pH. There were regular changes in the retention of compounds in a function of the organic modifier (MeOH, ACN) content in the mobile phase for both chromatographic systems. That relationship is described by the Soczewiński–Wachtmeister equation [32]:
log k = log kw + S φ
where φ is the volume fraction of the organic modifier in the mobile phase, log kw is the intercept and S is the slope of the regression curve. Log kw refers to the retention parameter of a compound with pure water as the mobile phase. The S and log kw quantities, estimated by the extrapolation procedure, are commonly applied as lipophilicity descriptors [33,34,35]. The obtained data are presented in Table 5. The estimated log kw values for both phases were significantly different, but they were highly correlated. The relationship between the log kw values is expressed by the following equation:
log kw(IAM) = 0.7821(±0.0545) log kw(RP-18) − 0.6026 (±0.1461)   n = 13, r2 = 0.9493, s = 0.127
The differences between the log kw(RP-18) and log kw(IAM) values were the result of various interactions of considered pyrazolo[4,3-e][1,2,4]triazine sulfonamides on the octadecyl and IAM phases. Ong and Pidgeon assumed that partitioning was the principal retention mechanism in IAM retention, including both hydrophobic and polar interactions with the solvated layer(s) of the stationary phases and ionizable groups of immobilized phospholipids [36]. The studies showed that the compounds were characterized by weaker affinity to the immobilized phospholipids than to the octadecyl phase. Significant electrostatic interactions with the IAM phase resulted in different retention of compounds and different values of log kw in the IAM phase compared with those obtained using the C-18 one. A similar trend was observed for other pyrazolo[4,3-e][1,2,4]triazines [37]. A significant though relatively stable difference between the log kw values for both phases (Δ log kw in the range of 1–1.3) may suggest that these were the result of mainly heterocycling-sulphonamide moiety interactions (unmodified element of the considered compounds) (Table 5).
The molar refractivity (MR) and the polar surface area (tPSA) were estimated according to the fragmentation method introduced by Crippen [38]. ACD log P was calculated using ACD/Labs methodology [39]. C log P and M log P were estimated for comparison (Table 6). Using the selected methods, the calculated log P values proved to be significantly different but colinear (correlation coefficient r was in the range of 0.93–0.98). Particularly, the Moriguchi estimation of the log P values gave low values. The obtained log P values expressed the lipophilicity changes of the studied set of compounds, but they did not describe the actual octanol-water coefficient distribution value. This phenomenon was observed in some groups of new synthesized and studied compounds as well as applied drugs [40]. The results depended on the algorithm and base data used in the log P calculation [41]. In this group of compounds, the differences were particularly pronounced.
The log P values obtained by the numerical methods C log P and M log P were smaller than log kw—obtained by RP C18 HPLC or IAM chromatography—but they were colinear, which was observed for some groups of compounds [42]. The relationship between log kw and C log P is expressed by the following equation:
Log kw = 0.50818(±0.0539)Clog P + 2.3107 (0.0504)   n = 13, r2 = 0.8898, s = 0.1238
The obtained chromatographic and numerical data indicated that the lipophilicity of the compounds increased with the increase of the alkyl chain of the substituent at the -SO2N- group. The highest lipophilicity expressed by the chromatographic as well as computational descriptors for the compounds with the leucine moiety was found. Slightly weaker lipophilic character was exhibited by the compounds with the 2-amino-3-methyl-1-hydroxybutyl substituent. The lowest lipophilicity was found for the compounds with amine and two hydroxyl groups (8g, 8h and 8k). Their properties were the result of large polar surface areas (tPSAs) (Table 6). The compounds being the pairs of enantiomers had the identical lipophilic-hydrophilic characterization. The tPSAs of the compounds were on the borderline or above the range indicated as beneficial for potential drugs [43].
The plasma protein affinity of the compounds was analyzed using immobilized human serum albumin (HSA) and α1-glycoprotein (AGP), which are the main blood proteins. Measurements were performed under the isocratic conditions using the propan-2-ol/acetate ammonium buffer at pH = 7.4 (15:85, v/v) as the mobile phase. The log k values of all compounds are presented in Table 7. Based on the calibration curve log K = f(log k) (Equations (4) and (5)) of a set of drugs of the known percentage of protein binding, the log K values of the compounds were calculated. Next, they were converted to a percentage of protein plasma binding (% PPB) [44]. The results are presented in Table 7. They show that the compounds bound poorly to the plasma proteins, particularly to AGP. The calculated pKa values of the compounds and the analysis of various microspecies distributions indicated the molecular forms of the compounds at pH = 7.4 and, therefore, they bound poorly to the proteins [45,46]. In the case of only compound 8m, 4% of the cationic form was found at pH = 7.4. This was associated with the piperazine ring protonation. This was revealed by the greater extent of compound-to-AGP binding. Thus, this confirms a general trend that glicoproteins bind bases better than the other microspecies. The quantitative structure-binding relationship analysis confirmed the positive contribution of lipophilicity in the HSA binding. The compounds of the highest lipophilicity exhibited the strongest affinity for HSA (compounds 8i, 8j and 8m) [46]. The HSA and AGP binding was also largely correlated with the molar refractivity (MR) of the compounds.
Summing up, the above-described chromatographic studies (IAM and RP-18) and the calculated in silico log P values gave very different values of log kw and log P, but they were collinear and described well the lipophilicity changes in the test series of compounds. The studied compounds were characterized by a small affinity for plasma proteins, which could be advantageous in potential in vivo studies.

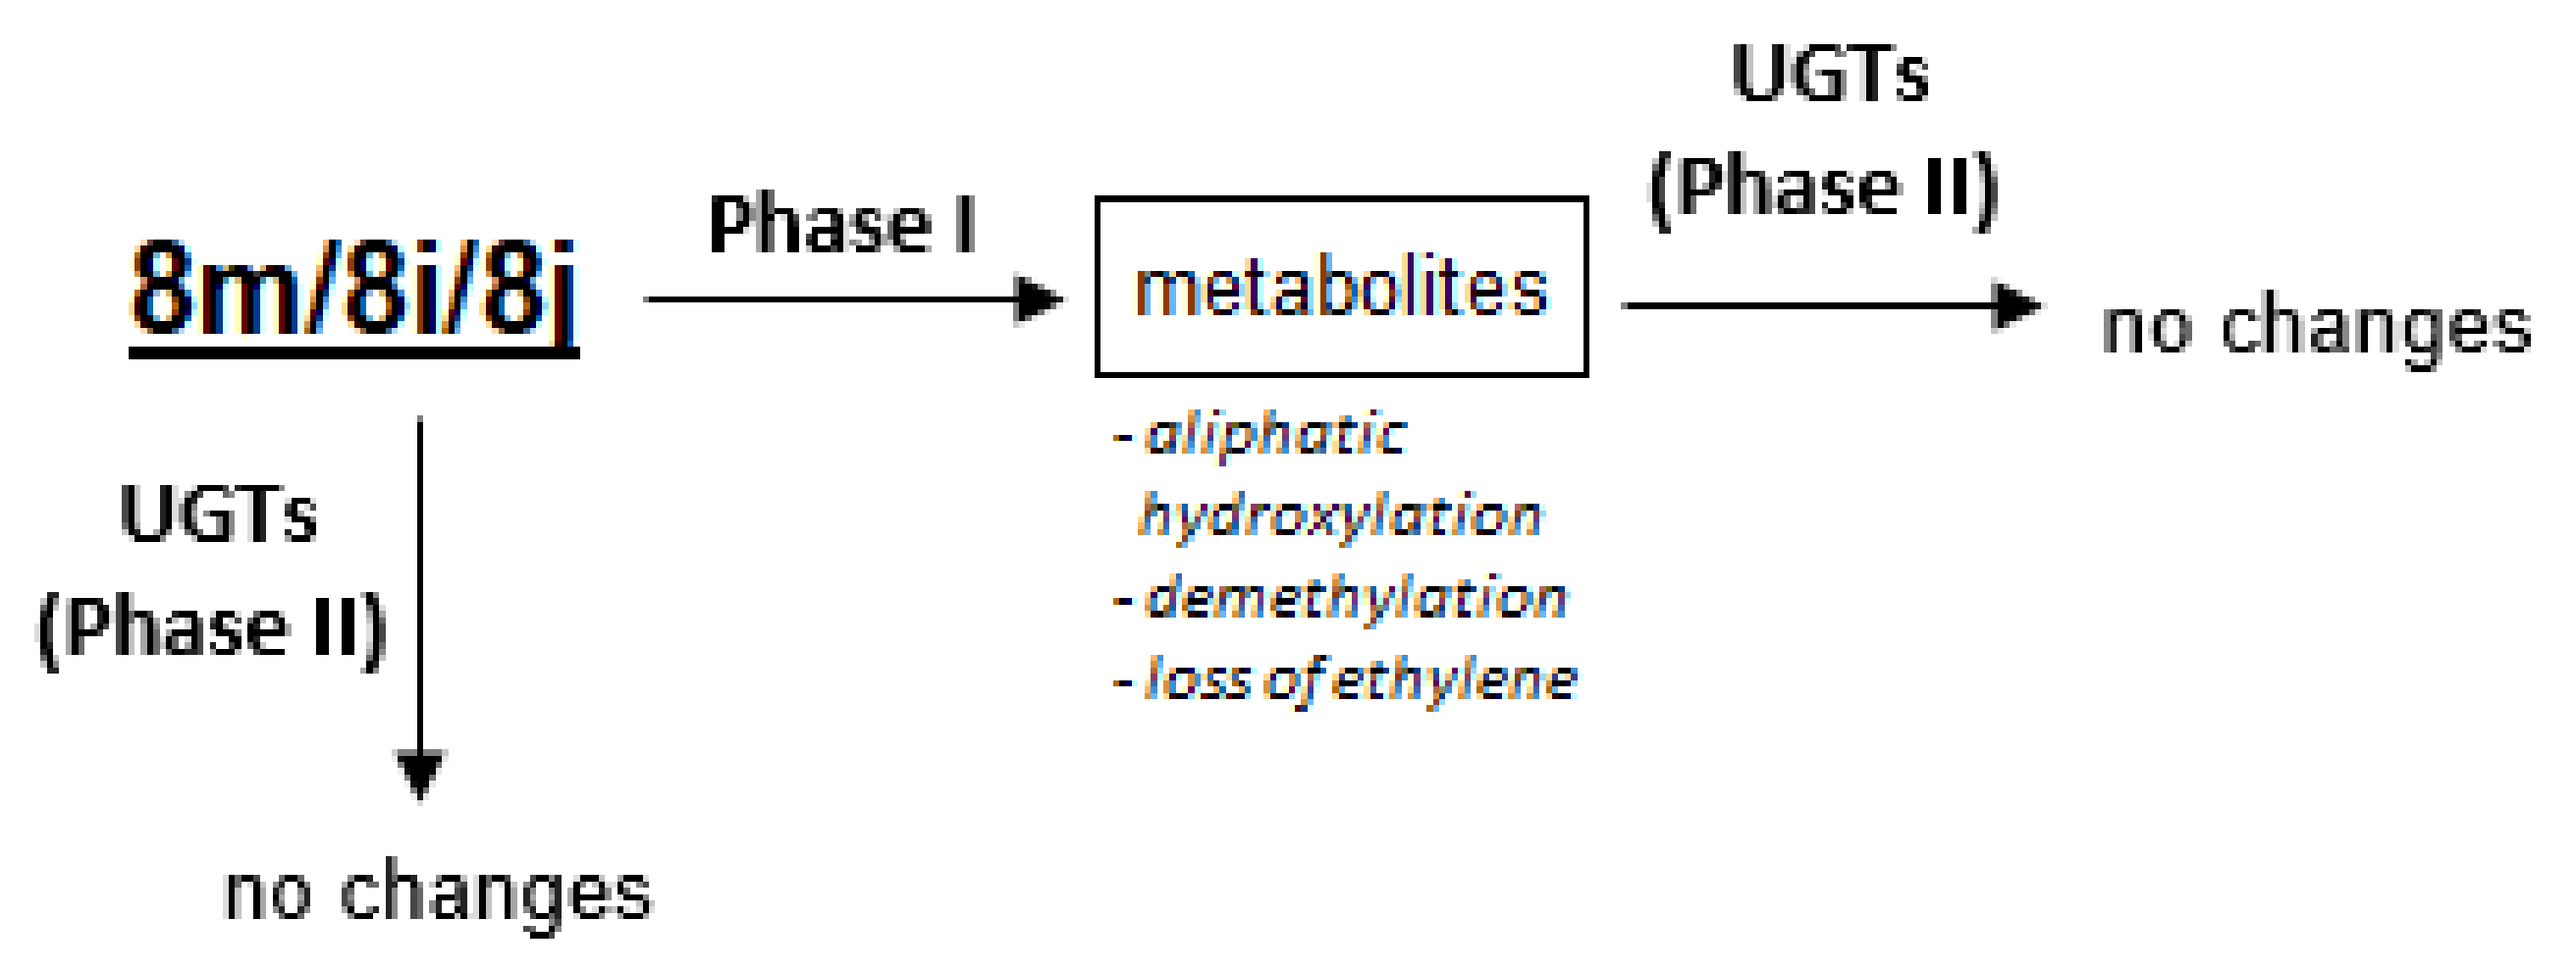
2.5. Susceptibility to Metabolic Transformation

In looking for the reasons for the poor cytotoxicity of the studied compounds, we also considered their potency to metabolic transformations, which are possible in tumor cells. This metabolism is able to transform active compounds into their less- or non-active metabolites, which would be the case of the investigated agents. Three compounds among the studied pyrazolo[4,3-e][1,2,4]triazine derivatives—8m, 8i and 8j—were selected for the studies on their susceptibility in phases I and II of metabolic transformations, which were performed with rat liver microsomes.

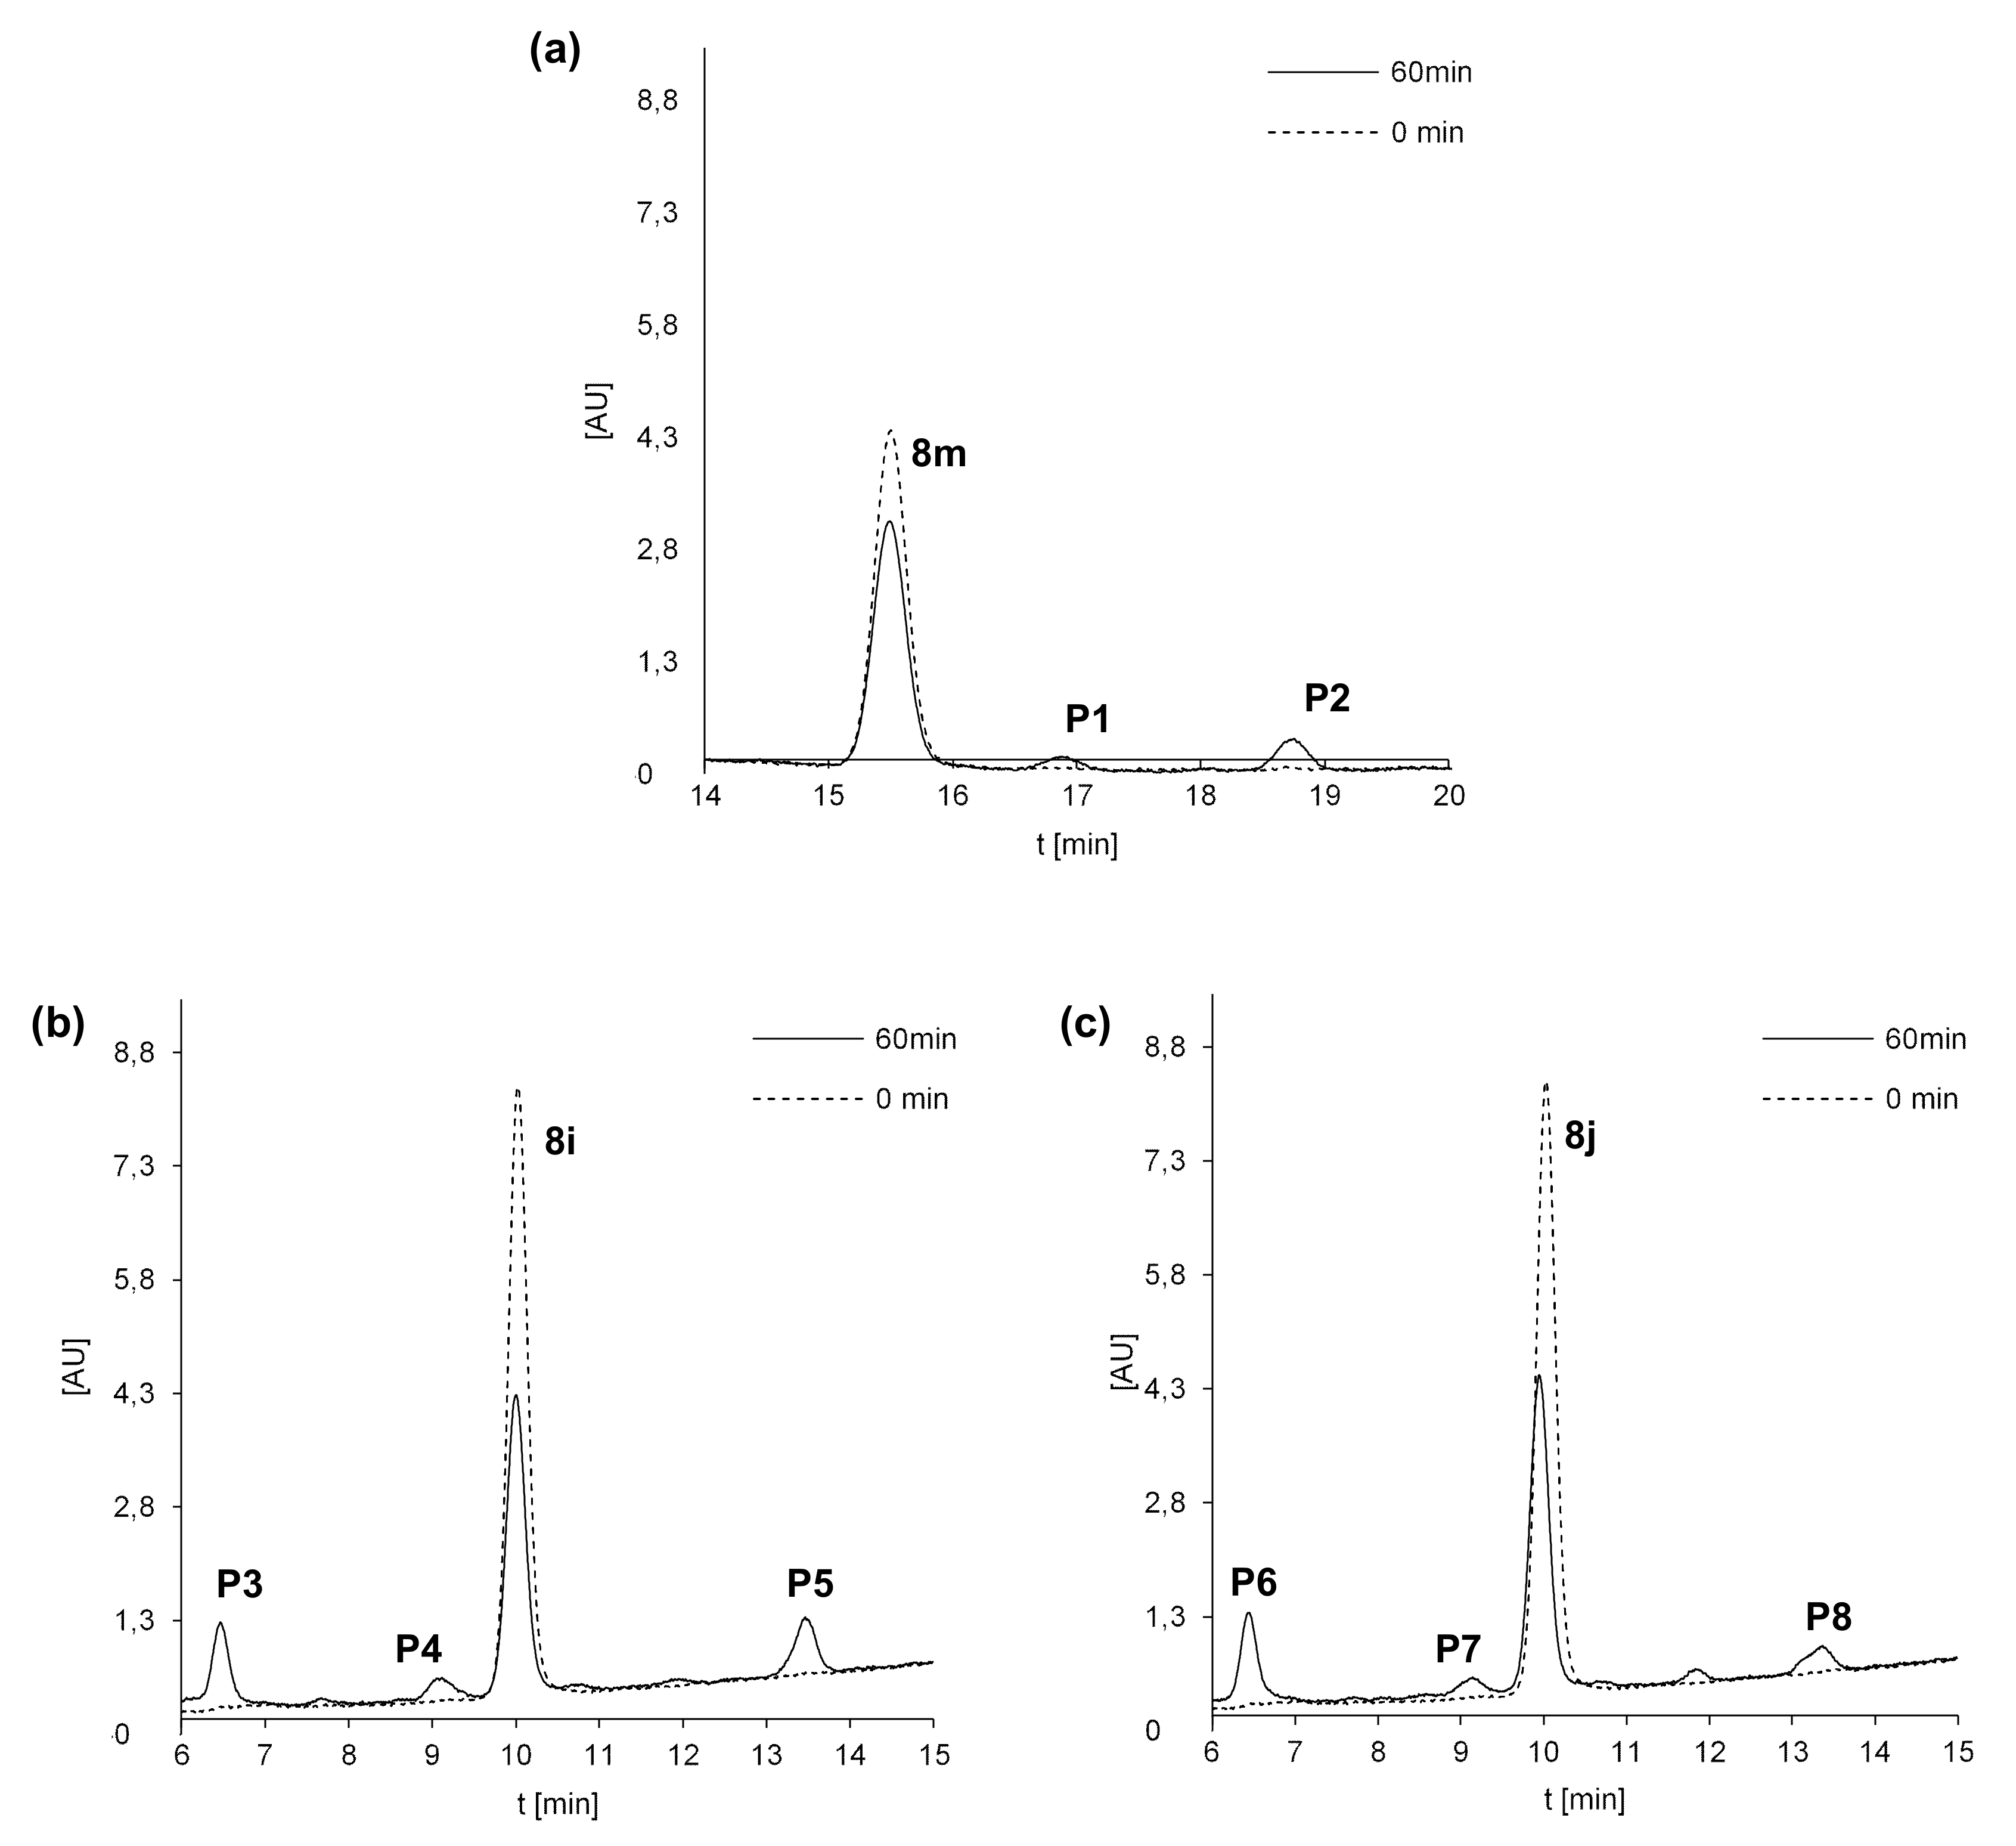
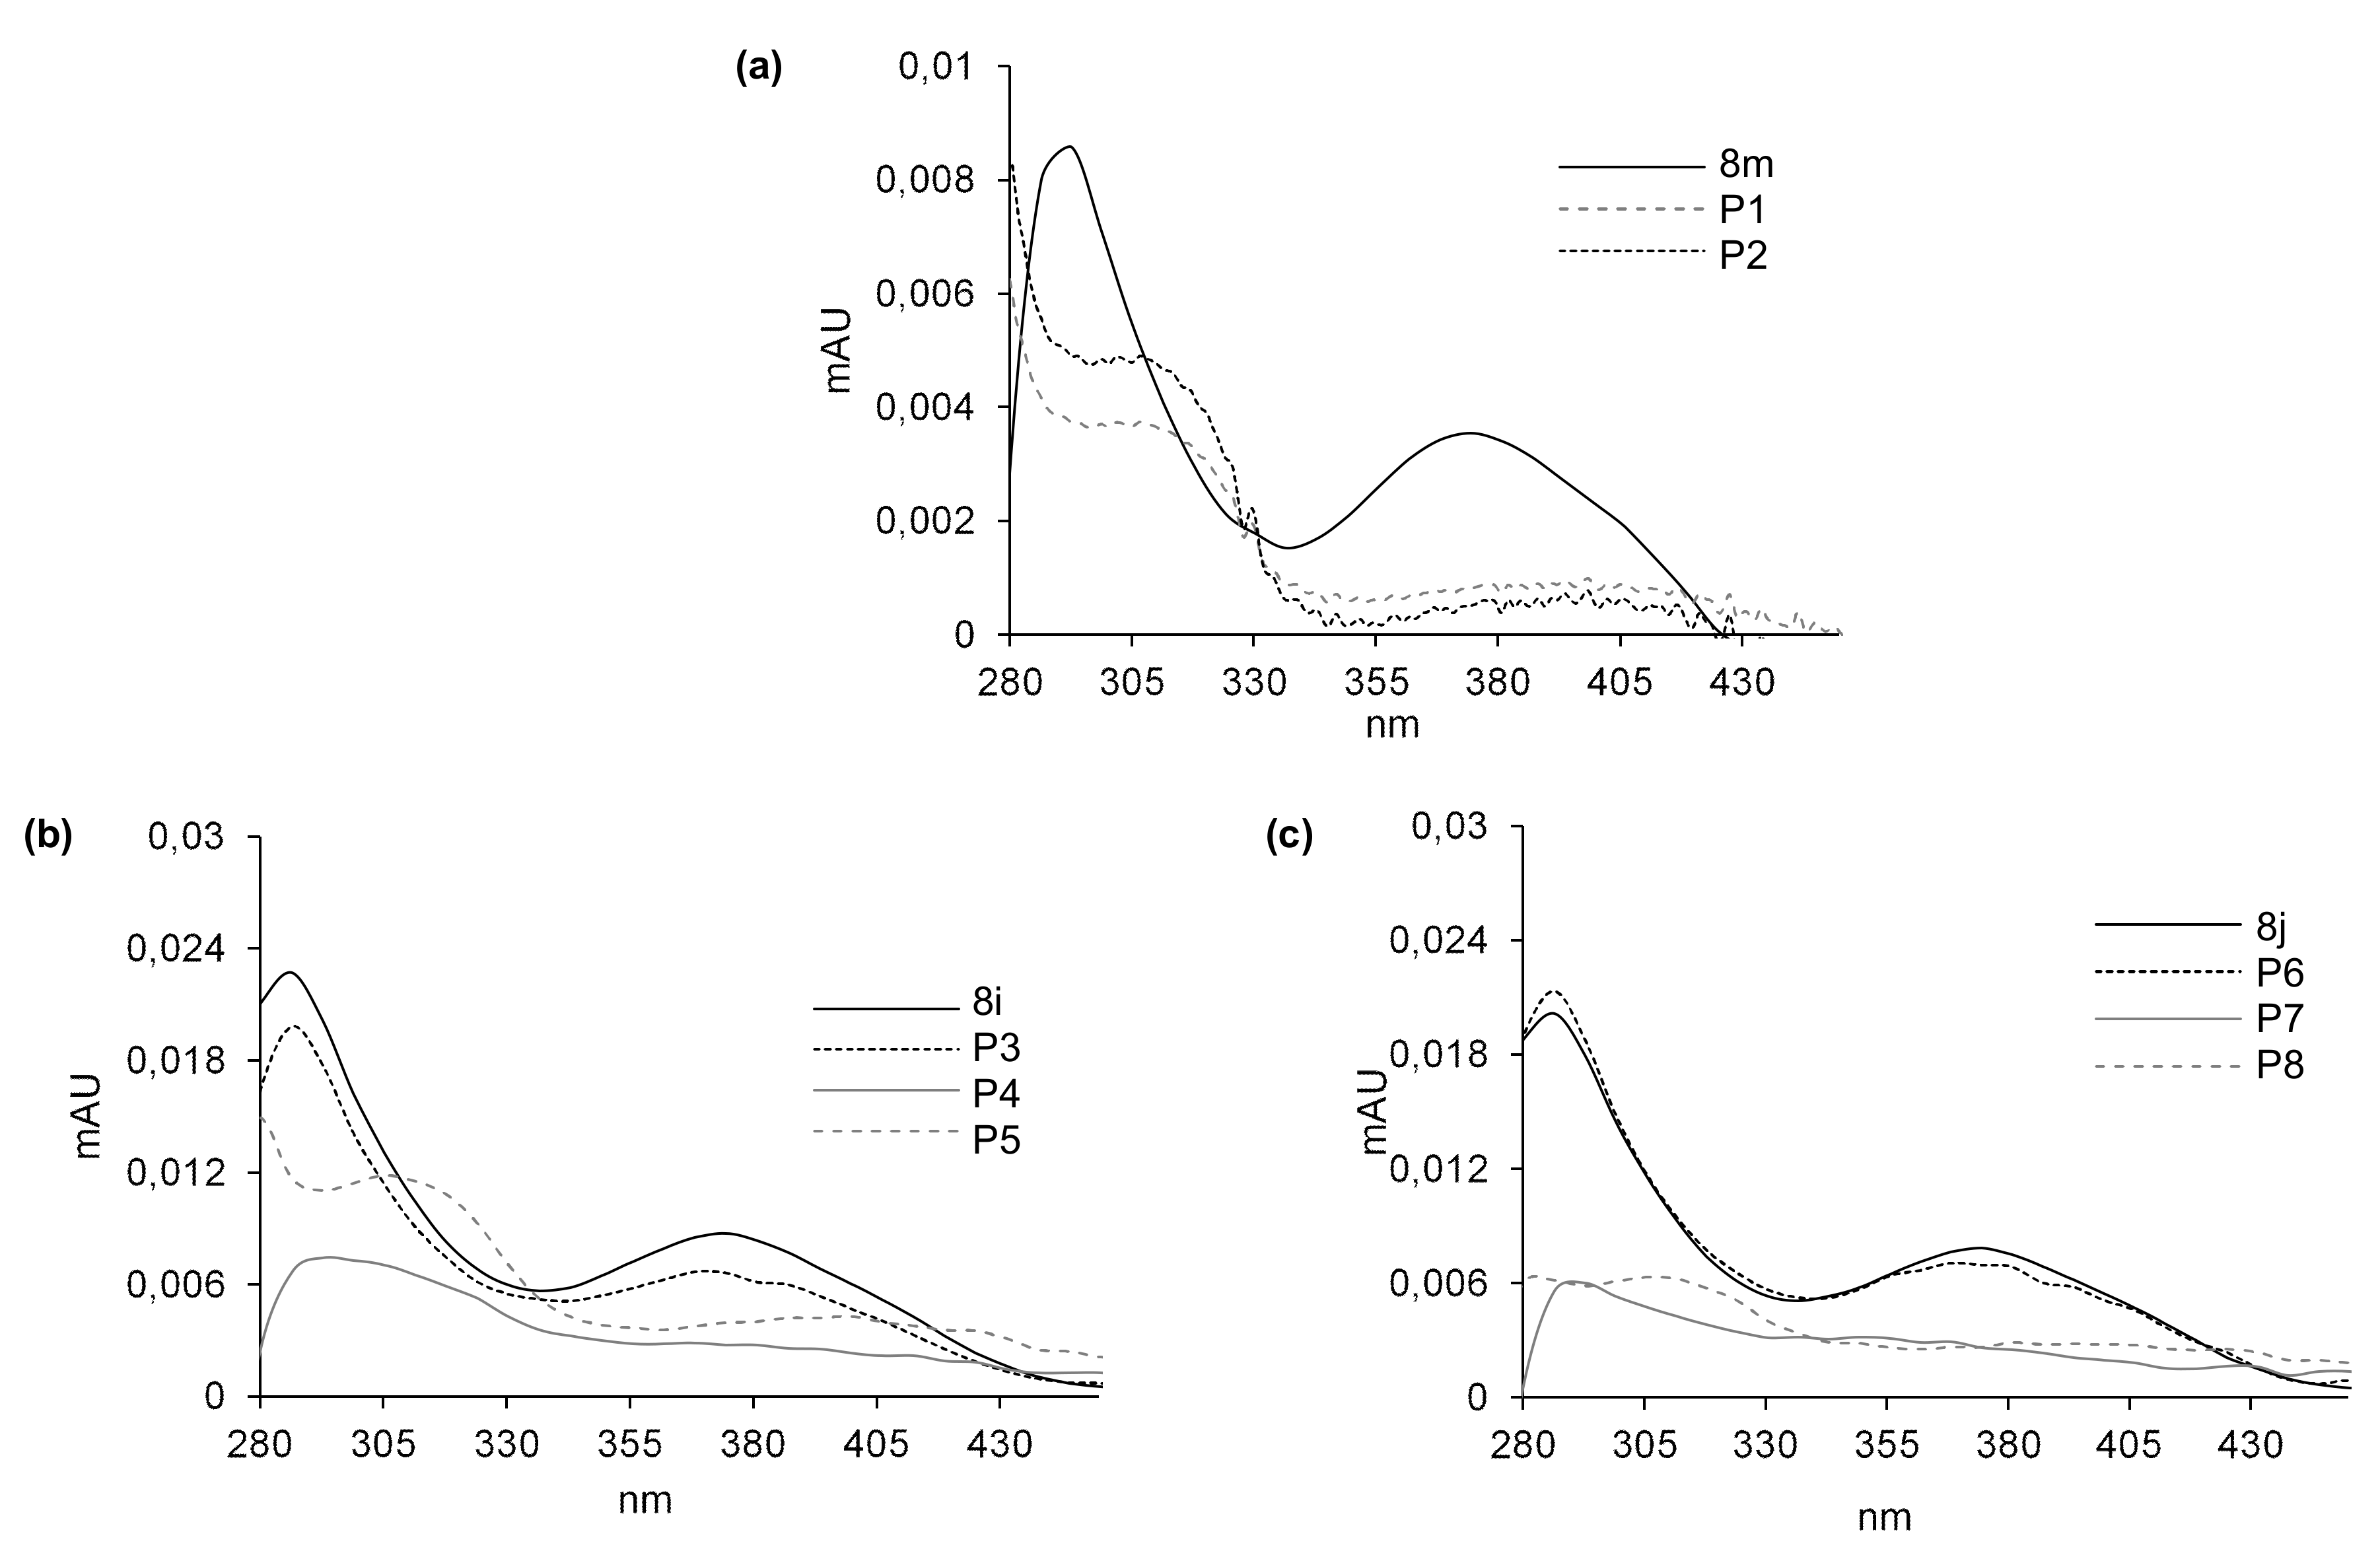
2.5.1. Phase I Metabolism of 8m, 8i and 8j with Rat Liver Microsomes

Phase I metabolism was considered in the first step of the studies on transformations of 8m, 8i and 8j compounds. Each compound was incubated with rat liver microsomes (RLMs) and NADPH as a cofactor of phase I metabolism, and the reaction mixtures were monitored by HPLC analysis with UV-Vis detection. The chromatograms recorded after 60 min of incubation are shown for each compound in Figure 4. The chromatographic peaks were analyzed by their ESI-MS spectra, and the m/z values related to the HPLC bands are presented in Table 8. The UV-Vis spectra of 8m, 8i and 8j and their metabolites obtained with RLM in the presence of NADPH are presented in Figure 5.
After 60 min of incubation with 8m, we observed in Figure 4a two metabolite peaks of very low intensities: P1 at Rt near 17 min and P2 near 19 min, whereas Rt of the substrate was much lower. Analyses of the metabolite spectra also indicated the strong changes in comparison with that of the substrate 8m. Bathochromic shifts were observed in the spectra of both metabolites P1 and P2. Thus, a strong difference in metabolites Rt and the UV-Vis spectra suggest significant modifications in the structure of the heterocyclic part of 8m metabolites. The analysis of their ESI-MS spectra also showed that 8m underwent metabolic transformations to two products: P1 of m/z = 448.1 and P2 of m/z = 404.1 (Table 8). These results indicated a mass of metabolites equal to [448.1 (P1)] = [431.1 (8m) + 16 (O)+ 1 (H+)] and to [404.1(P2)] = [431.1 (8m)—28 (C2H4) + 1 (H+)]. Therefore, the attachment of oxygen atoms and the loss of the ethyl group were postulated, respectively, for the metabolites P1 and P2 of the 8m substrate. The results indicated higher polarity of both 8m metabolites and significant changes in their chromophore structures. Thus, metabolic transformations would occur in the N-methyl piperazinyl substituent as well as in the molecule core. All of these together are suspected to improve the metabolite penetration in the living organism.
Three metabolite peaks of different intensities at Rt near 6.5 min (P3/P6), 9 min (P4/P7) and 13.5 min (P5/P8) were observed after 60 min of 8i and 8j incubation (Figure 4b,c). The UV-Vis spectra of one metabolite of both compounds (P3/P6) were very similar to those of the substrates, whereas the spectra of the next two metabolites—P4, P5 and P7, P8 of the 8i and 8j substrates—were of low intensity. Therefore, significant changes in the structure of the heterocyclic chromophore in these metabolites were proposed. The analysis of the ESI-MS spectra of these compounds showed that 8i and 8j underwent metabolic transformations to three products described by the following m/z values: 465.1, 435.1 and 421.1 (Table 8). This would suggest the attachment of an oxygen molecule in the products [m/z 465.1 (P3/6)] = [448.1 (8i/j) + 16 (O) + 1 (H+)] and the demethylation, for the metabolites [m/z 435.1 (P4/7)] = [448.1 (8i/j)—14 (CH2) + 1 (H+)] as well as the loss of the ethyl group [m/z 421.1 (P5/8)] = [448.1 (8i/j)—28 (C2H4) + 1 (H+)]. The comparison of the described metabolite characteristics indicated that the compounds with long aliphatic chains in 8i and 8j resulted in one more product than 8m. Metabolites P3 and P6 of the chromophore, identical to that of the substrate and higher than that of the substrate polarity, would be the result of hydroxylation without changes in the chromophore. Therefore, it would occur in the aliphatic chain. The next products, P4, P5 and P7, P8, were suspected to be the result of dealkylations. Similar to 8m, more polar hydroxylation products as well as dealkylation metabolites should be suspected not only to be easier in the organism distribution, but also express easier interactions with molecular targets, including serum albumins.

2.5.2. Phase II Metabolism with Rat Liver Microsomes

The compounds 8m, 8i and 8j were also studied in respect to their phase II metabolisms. The incubation with rat liver microsomes was performed in the presence of glucuronyltransferase (UGT) and the cofactor of this enzyme family, UDPGA. As a result, we did not observe any glucuronidation product of 8m, 8i and 8j after 60 min of incubation of these compounds with rat liver microsomes (RLMs) in the presence of UDPGA. The ESI-MS analysis also did not indicate any characteristic mass value increase for glucuronidation product equal to m/z + 176 Da. Therefore, the results demonstrated that none of the studied compounds were the substrate for UGT in RLM.
Finally, the three studied compounds 8m, 8i and 8j were incubated with rat liver microsomes (RLMs) together with two activating cofactors, NADPH and UDPGA, to stimulate both phase I and phase II metabolism. However, only the products of phase I (m/z + 16, m/z − 14 and m/z − 28) were found in the chromatograms with ESI-MS detection. The results indicate that the phase I metabolites did not undergo transformation in the following phase II metabolism in the presence of UGTs.
In conclusion, we proposed similar metabolic pathways of pyrazolo[4,3-e][1,2,4]triazine sulfonamides for compounds 8m, 8i and 8j, which are presented in Figure 6. The studied compounds were sensitive to metabolic transformations with phase I enzymes, which led to oxidized metabolites as hydroxylation and dealkylation products. Phase II transformations were not demonstrated either directly by UGT or upon activation with phase I enzymes. Therefore, the best known detoxification pathway, UGT-mediated glucuronidation, was not observed in the case of the studied compounds. It cannot be excluded that the proposed phase I metabolites were responsible for the deactivation.

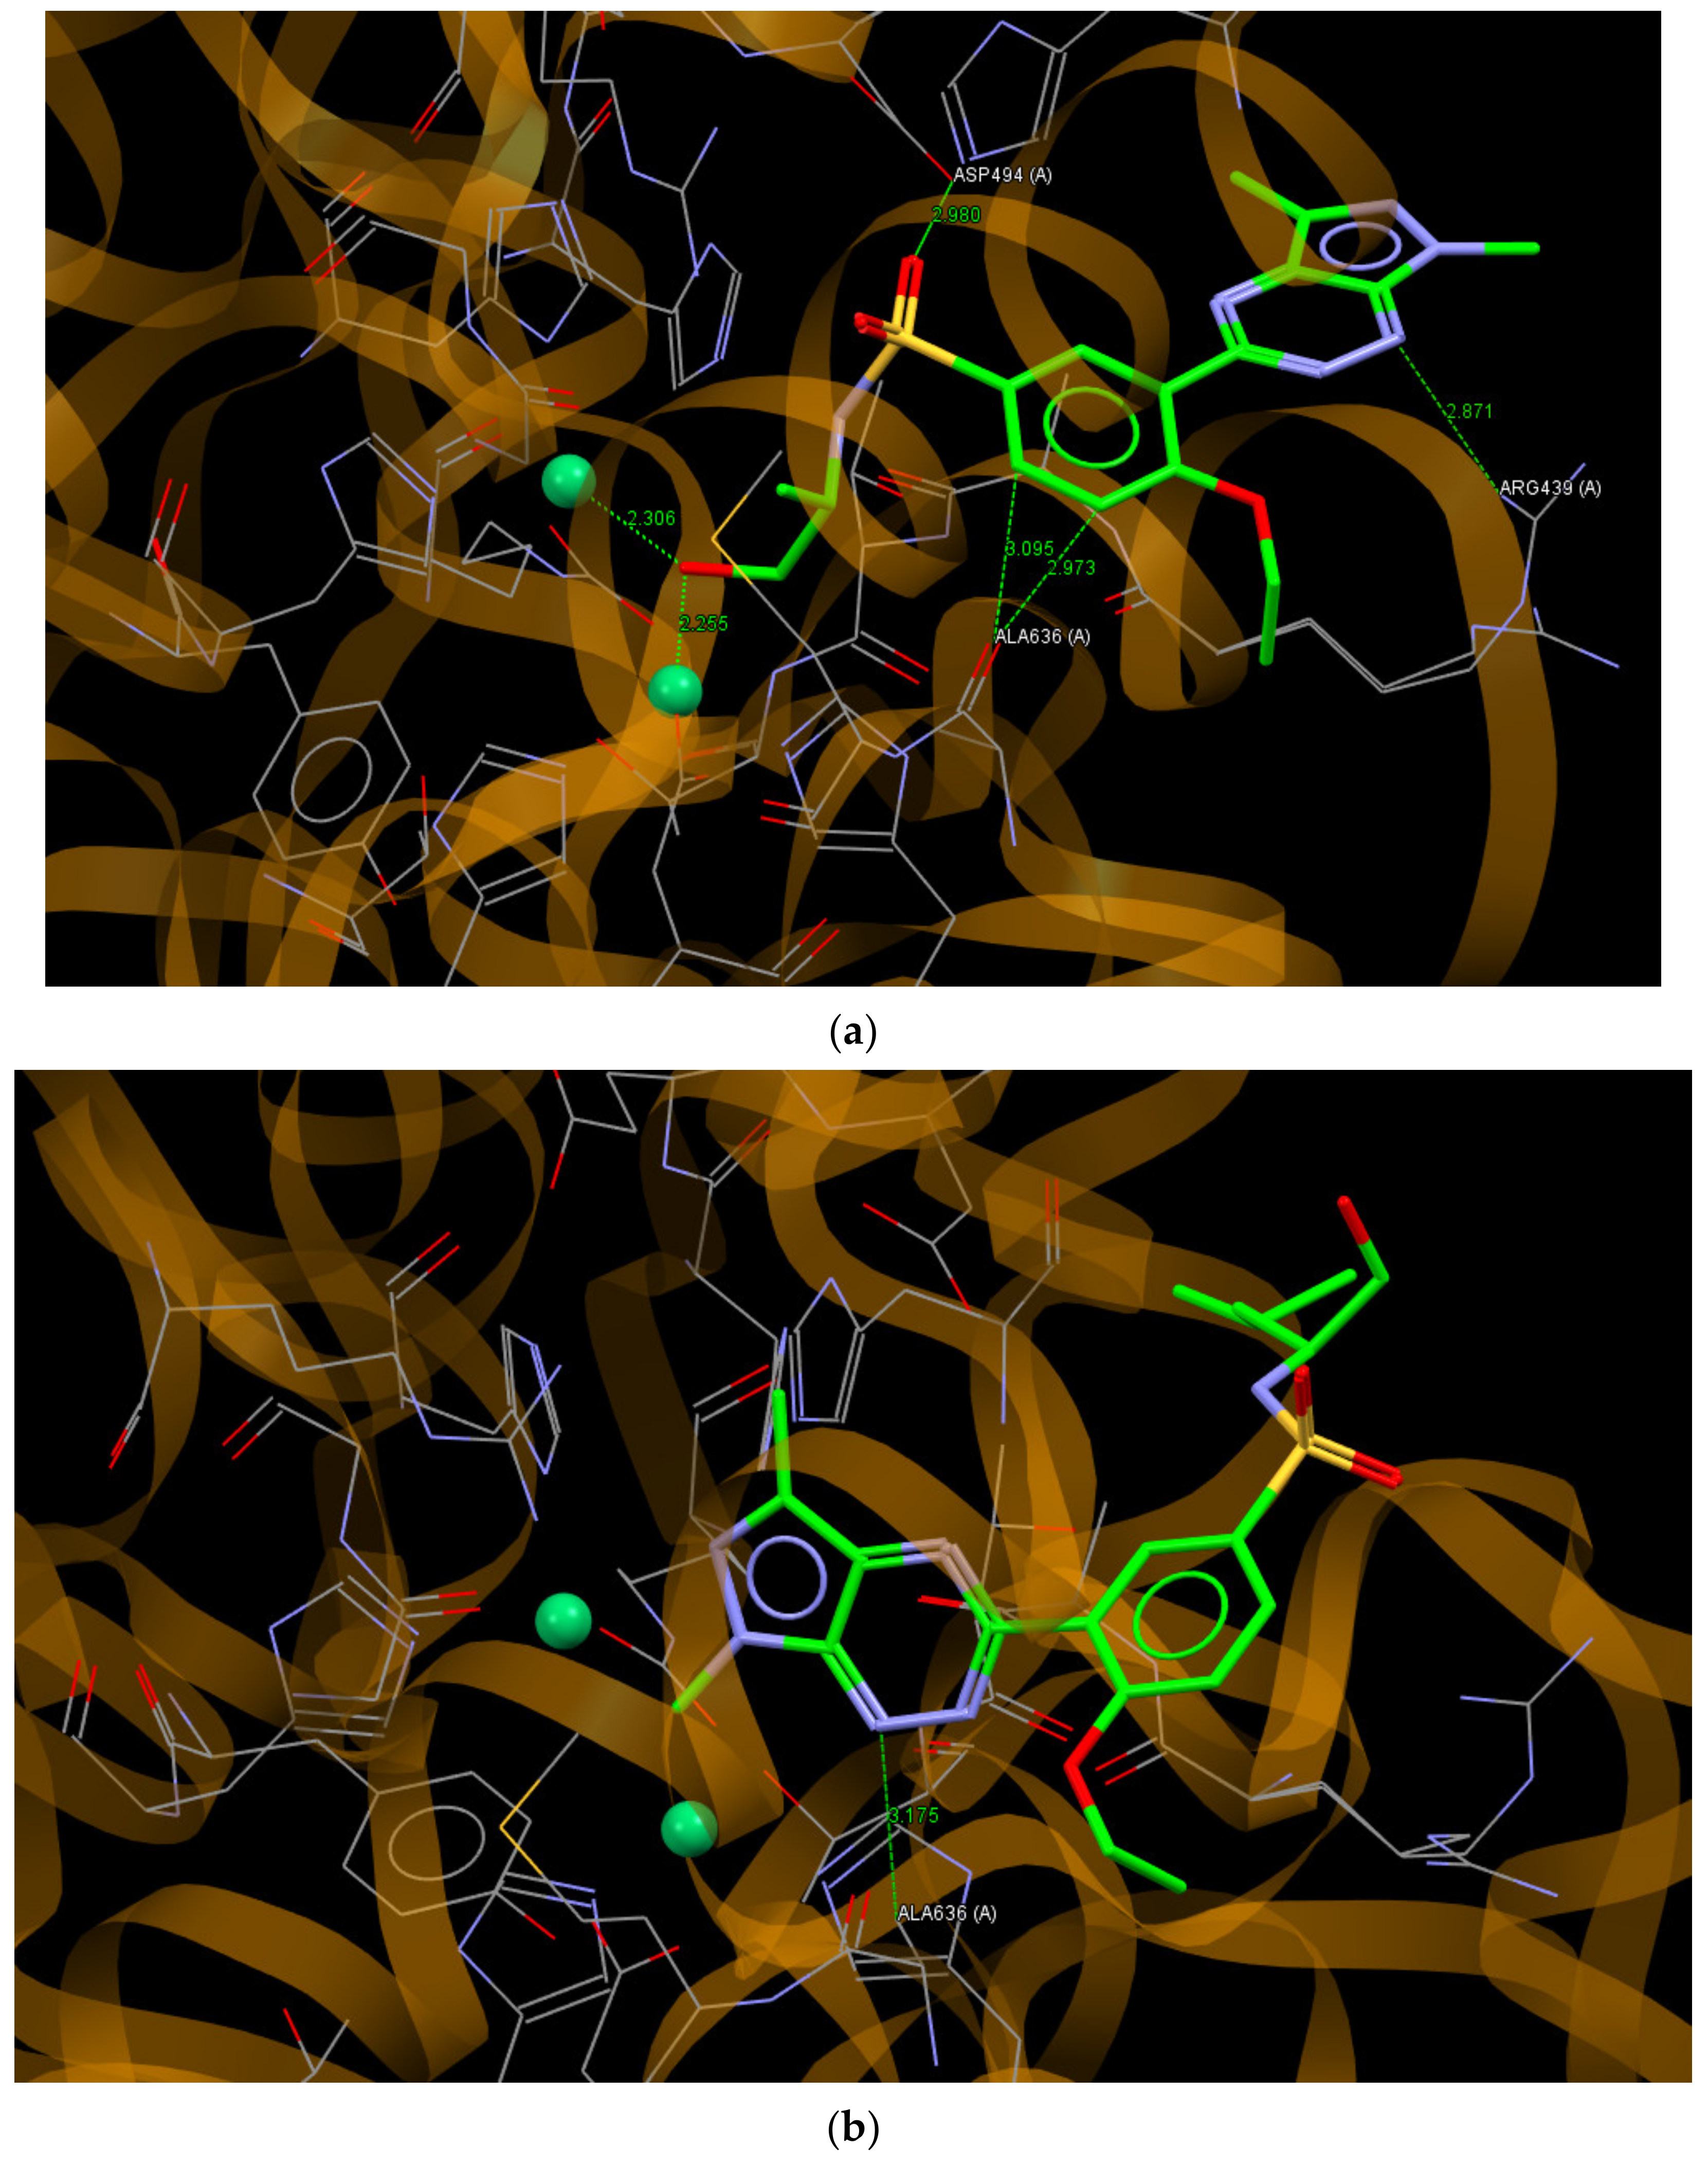
2.6. Molecular Docking

The investigated pyrazolo[4,3-e][1,2,4]triazine sulfonamides showed no antiproliferative activity against tumor cell lines in in vitro tests. However, our previous pharmacological studies showed that all chiral sulphonamides 8aj exhibited significant inhibitory activity on mushroom tyrosinase and jack bean urease [20]. Therefore, the biological activity of 8aj prompted us to investigate in silico the mechanism of action at the molecular level of the investigated pirazolotriazine sulfonamides by the molecular docking method.
All chiral sulphonamides 8aj exhibited significant inhibitory activity on mushroom tyrosinase, with IC50 values in the range of 27.9–40.17 μM, comparable to the activity of kojic acid (IC50 = 16.69 μM), which was used as a reference compound in the test [20]. The most active compounds 8j and 8b showed inhibition of tyrosinase at IC50 of 27.9 and 30.76 μM levels, respectively. Moreover, compounds 8aj were tested for their inhibitory effects on jack bean urease, exhibiting inhibitory activity that changed from an IC50 of 0.037 μM for 8a to 0.084 μM for 8b, better than the activity of reference thiourea with an IC50 value of 20.7 μM [20].
Tyrosinase is the enzyme which is responsible for the synthesis of melanin, a ubiquitous pigment in living organisms. In the crystalline state, Agaricus bisporus mushroom tyrosinase occurs as tetramer H2L2 subunits in complex with its inhibitor tropolone, forming a pre-Michaelis complex with the enzyme and a binuclear copper binding site in H subunit (PDB ID: 2Y9X) [47].
The results of the molecular docking of the most active in vitro testing of 8j and 8b to the binding site of tyrosinase are presented in Figure 7. The ligands 8j and 8b bound to the active site with the values of scoring function ChemPLP of 62.70 and 63.50, respectively. These values were significantly better than the value of 50.14 obtained for the re-docked molecule of tropolone, which indicates a greater affinity of 8j and 8b for the enzyme than that observed for tropolone. The molecule of 8j bound to the binding site of tyrosinase by intermolecular hydrogen bonds N2… C (PHE264A) and C11… O (SER282A), with the distances between interacting atoms being 3.152 and 2.921 Å, respectively.
Moreover, short contacts between the hydroxyl group of (R)-(-)-leucinol substituent and Cu2+ ions with distances of 2.493 and 3.474 Å were observed. The molecule of 8b interacted with the active site of tyrosinase through the O22…C (HIS263A; 3.001 Å) hydrogen bond and, similar to 8j, short contacts to the Cu2+ ions with distances of 2.598 and 2.475 Å were observed.
Urease is a nickel-containing enzyme. Catalyzing the hydrolysis of urea and its inhibitors plays an important role in the therapy of human and plant disorders [20]. For the docking study, the crystal structure of a jack bean urease complex with acetohydroxamic acid, 1,2-ethanediol and two Ni2+ ions in the binding site was used (PDB ID: 4H9M) [48]. Compounds 8a and 8i, being the most active in the test of the inhibitory effect on urease, bound to the active site of this enzyme with ChemPLP values of 77.60 and 66.72, respectively. It should be noted that the redocking of the acetohydroxamic acid molecule gave a relatively smaller ChemPLP value of 39.08, which indicates that the molecules of 8a and 8i fit better to the active site than the molecule of acetohydroxamic acid. The molecule of 8a bound to the active site of urease via O22… O (ASP494A), N1… N (ARG439A), C14… O (ALA636A) and C15… O (ALA636A) hydrogen bonds, with distances between the interacting atoms of 2.980, 2.871, 2.973 and 3.095 Å, respectively. Moreover, the hydroxyl group of (S)-(+)-2-amino-1-propanole substituent interacted with the Ni2+ ions with distances of 2.306 and 2.255 Å between the O atom and Ni2+ ions (Figure 8a). As can be seen in Figure 8b, the molecule of 8i bound to an active site of urease through N1… C (ALA636A; 3.175 Å) but in a different pose than the molecule of 8a with the pyrazolo[4,3-e][1,2,4]triazine ring in the vicinity of Ni2+ ions.
The molecular docking study showed that the compound 8aj, showing experimentally confirmed activity in the direction of inhibitory effects on mushroom tyrosinase and jack bean urease, had better affinity to these enzymes than their ligands in a crystalline state. The Cu2+ and Ni2+ ions present in the active site of tyrosinase and urease, respectively, were important centers in the interactions of ligands with enzymes.

3. Conclusions

Theoretical calculations performed at the DFT/6-311++G(d,p) level showed that all investigated pyrazol[4,3-e][1,2,4]triazine sulfonamides showed large similarity in structural and electronic parameters (torsion angles, dipole moments and net charge at the atoms), and they were characterized by similar reactivity and stability indexes. Therefore, it can be assumed that they should behave similarly under physiological conditions.
The molecular docking of the most active compound, in the direction of inhibitory effects on mushroom tyrosinase and jack bean urease, revealed that the analyzed compounds had high affinities to the active sites of these enzymes and the Cu2+ and Ni2+ ions in the binding pockets of tyrosinase and urease, respectively, and they may play a key role in the mechanism of these enzymes’ inhibition.
All presented sulfonamides were obtained using a multistep procedure and appeared to be inactive against cancer cell lines. They also did not show kinase inhibitory potency toward Abl or CDK2/cyclin E.
The compounds were characterized by a small affinity for plasma proteins, which could be advantageous in potential in vivo studies. Their lipophilicity may be connected with the large polarities of the molecules, confirmed by large values of dipole moments theoretically calculated for the investigated sulfonamides using the DFT method.
The investigated pyrazolotriazines, being not active against the selected tumor cell lines, were sensitive to metabolic transformations with phase I enzymes, which led to the hydroxylation and dealkylation products, whereas phase II transformations did not occur. It cannot be excluded that the observed phase I metabolites would be responsible for the modification of the final activity of the studied compounds. Moreover, polar metabolites would not only be easier for distribution in the organism, but they would also interact easier with molecular targets, including the selected plasma proteins.

4. Experimental

4.1. Chemistry

4.1.1. Materials and Methods

For preparation and spectroscopic data of compounds 27, 8a-8j and 8m, see [20,28,48].

4.1.2. Synthesis of Sulfonamides 8am

A mixture of chlorosulfonyl chloride 7 (100 mg, 0.29 mmol) and amine (1 mmol) in anhydrous acetonitrile (5 mL) was stirred overnight at room temperature, and then the reaction mixture was concentrated in vacuo to afford the crude sulfonamide as a yellow solid. The residue was purified on silica gel using a mixture of CH2Cl2:EtOH (25:1) as an eluent to give the titled compounds as a yellow solid.
3-(1,3-dimethyl-1H-pyrazolo[4,3-e][1,2,4]triazin-5-yl)-4-ethoxy-N-(1,3-dihydroxy-2-methyl-propan-2-yl)benzenesulfonamide (8k) yield 89%; m.p. 119–122 °C. 1H NMR (CDCl3): 1.34 (t, 3H, J = 6.8 Hz), 1.39 (s, 3H), 2.69 (s, 3H), 3.79–3.81 (m, 2H), 3.78 (d, 2H, J = 11.6 Hz), 3.98 (d, 2H, J = 11.6 Hz), 4.18 (q, 2H, J = 6.4 Hz), 4.32 (s, 3H), 7.13 (d, 1H, J = 8.8 Hz), 7.98 (dd, 1H, J1 = 8.8 Hz, J2 = 2.4 Hz), 8.27 (d, 1H, J = 2.4 Hz). 13C NMR (CDCl3): 11.04, 14.43, 20.26, 34.82, 58.52, 64.94, 67.61, 112.78, 126.97, 130.48, 131.42, 132.49, 134.56, 142.45, 147.13, 158.42, 160.46. HRMS (ESI, m/z) Calcd for C18H24N6O5S [M+] 436.4921. Found [M+] 436.4926. Anal. Calcd for C18H24N6O5S: C, 49.53; H, 5.54; N, 19.25. Found: C, 49.69; H, 5.70; N, 19.08.
3-(1,3-dimethyl-1H-pyrazolo[4,3-e][1,2,4]triazin-5-yl)-4-ethoxy-N-(1-hydroxy-2-methyl-propan-2-yl)benzenesulfonamide (8l) yield 92%; m.p. 130–132 °C. 1H NMR (CDCl3): 1.35 (t, 3H, J = 6.8 Hz), 1.44 (s, 6H), 2.68 (s, 3H), 3.78 (s, 2H), 4.17 (q, 2H, J = 6.4 Hz), 4.30 (s, 3H), 4.68 (t, 1H, J = 6.4 Hz, OH, exchanged with D2O), 7.13 (d, 1H, J = 8.8 Hz), 7.96 (dd, 1H, J1 = 8.8 Hz, J2 = 2.4 Hz), 8.20 (d, 1H, J = 2.4 Hz). 13C NMR (CDCl3): 11.04, 14.43, 24.60, 34.82, 55.80, 64.94, 70.30, 112.78, 126.97, 130.48, 131.42, 132.49, 134.56, 142.45, 147.13, 158.42, 160.46. HRMS (ESI, m/z) Calcd for C18H24N6O4S [M+] 420.1423. Found [M+] 420.1426. Anal. Calcd for C18H24N6O4S: C, 51.42; H, 5.75; N, 19.99. Found: C, 51.38; H, 5.89; N, 19.85.

4.2. Lipophilicity and Protein Affinity Determination

4.2.1. UV-Vis Spectroscopy

The UV-Vis spectra were recorded in a water (phosphate buffer)–methanol (1:1) solution by means of a UV-160A Shimadzu spectrophotometer. Quartz cuvettes (1 cm) were used for measurements.

4.2.2. RP-18 Chromatography

A Eurosil Bioselect C18 (5 μm, 300 × 4.6 mm) column was used as the stationary phase. The mobile phase consisted of different volume mixtures of methanol and a 20 mM acetate buffer as the aqueous phase to give a pH of 7.4. The methanol concentration ranged from 0.3 to 0.90 (v/v), depending on the structure of the compound, in intervals of 0.05. The flow rate was 1 mL/min at room temperature. The measurements were made at 280 nm. The retention time of an unretained solute (t0) was determined by the injection of a small amount of acetone dissolved in water.

4.2.3. IAM Chromatography

A Rexchrom IAM.PC.DD2 (12 μm, 100 × 4.6 mm, 300 Å) (Regis Technologies) column was used as the stationary phase. The mobile phase consisted of different volume mixtures of acetonitrile and a 20 mM phosphate buffer as the aqueous phase to give a pH of 7.4 (0.02 M KH2PO4, Na2HPO4 and 0.15 M KCl). The acetonitrile concentration ranged from 0.05 to 0.5 (v/v), depending on the structure of compound, at intervals of 0.05. The flow rate was 1 mL min−1 at room temperature. Measurements were made at 280 nm. The retention time of an unretained solute (t0) was determined by the injection of a small amount of citric acid dissolved in water.

4.2.4. Affinity Chromatography

Human serum albumin (HSA) immobilized on the 5 µm, 100 × 3 mm silica gel column (Chiralpac) and an α1-acid glycoprotein (AGP) immobilized on the 5 µm, 100 × 4 mm silica gel column (Chiralpac) were used. The mobile phase was composed of a 50 mM ammonium acetate solution (pH = 7.4) and propan-2-ol at 85/15 (v/v). Its flow rate was 0.5 mL min−1 at room temperature. The measurements were conducted at 280 nm. The retention time of an unretained solute (t0) was determined by the injection of a small amount of citric acid dissolved in water. The log k values for the selected mobile phase were determined for all compounds. The percentage of protein plasma binding (% PPB) values were calculated from the calibration curve according to Valko et al. [35].
HPLC measurements were performed using a Knauer liquid chromatograph (Knauer, Berlin, Germany) with a dual pump and a UV-visible detector.

4.2.5. Calibration of the Protein Columns

The column performance check and calibration were performed before the measurements. The racemic mixture of warfarin was used for their performance evaluation. The following calibration set of drugs was applied: bromazepam, carbamazepine, diclofenac, nicardipine, nizatidine, piroxicam and warfarin for the HSA and bromazepam, imipramine, nicardipine, nizatidine, propranolol and warfarin for the AGP. The drugs were dissolved at a 0.5 mg/mL concentration in a 50% propan-2-ol and ammonium acetate solution (pH = 7.4) mixtures. The log k values of the drugs were determined under the assumed conditions. The obtained log k values from HPLC were plotted against the calculated log K values (K = binding equilibrium constant and log K = linearized PPB), based on the literature data for plasma protein binding (% PPB).
The following relationships were obtained:
log KHSA = 0.377 + 1.011 log kHSA; r2 = 0.947; s = 0.190
log KAGP = 0.231 + 0.926 log kAGP; r2 = 0.940; s = 0.156
The calculated log K values of the compounds were transformed to HSA and AGP bindings (% PPB) [44].

4.2.6. Computational Methods

The tPSA values and molar refractivity CMR were calculated using the ChemDraw Ultra 10.0, according to the fragmentation method introduced by Crippen [39]. The Moriguchi estimation of log P was made using the MedChem Designer (TM) version 3.0.0.30 (Simulations Plus, Inc.) and ACD log P using ACD/ChemSketch of ACD/Labs [39]. The pKa values were calculated using MarvinSketch 19.9 (ChemAxon Ltd., Lublin, Poland). Statistics 7.1 (StatSoft, Inc., Lublin, Poland) was used for the statistical analysis.

4.3. Metabolic Transformation

4.3.1. Chemicals

The following chemicals were obtained from Merck KGaA (Darmstadt, Germany): methanol (gradient grade for liquid chromatography), HEPES, NADPH and UDPGA. The ammonium formate was from Fisher Scientific (Loughborough, UK). All other chemicals and solvents were of the highest purity available.

4.3.2. Enzymes

Rat-pooled liver microsomes (RLMs) (20 mg of microsomal protein per mL) were purchased from Tebu-Bio (Le Perray-En-Yvelines, France).

4.3.3. Methods

Metabolism with Phase I Enzymes in Rat Liver Microsomes

The RLMs (2 mg/mL of protein) were assayed for activity toward tested compounds as follows. The proteins were incubated in a buffer containing 0.1 M HEPES (pH 7.4) and 2 mM MgCl2 with either 0.05 mM substrate in a total volume of 70 µL. The substrates were also added in the buffer HEPES, with a pH of 7.4. Reactions were started by the addition of NADPH (2 mM) and were incubated for a specified time at 37 °C. The reactions were stopped by the addition of 8.75 µL of 1 M HCl, followed by centrifugation at 13,400 rpm for 10 min to pellet the denatured protein. The supernatant fractions were used for high-performance liquid chromatography (HPLC analysis). Control reactions omitting the substrate were run with each assay. All incubations were performed in two repetitions.

Metabolism with Phase II, UGT and Enzymes in Rat Liver Microsomes

The RLMs (2 mg/mL of protein) were assayed for activity toward the tested compounds as follows. The proteins were incubated in a buffer containing 0.1 M HEPES (pH 7.4) and 2 mM MgCl2 with either 0.05 mM substrate in a total volume of 70 µL. Substrates were also added in the buffer HEPES with a pH of 7.4. Reactions were started by the addition of UGPGA (5 mM) and were incubated for a specified time at 37 °C. The reactions were stopped by the addition of 8.75 µL of 1 M HCl, followed by centrifugation at 13,400 rpm for 10 min to pellet the denatured protein. The supernatant fractions were used for high-performance liquid chromatography (HPLC analysis). Control reactions omitting the substrate were run with each assay. All incubations were performed in two repetitions.

Metabolism with Phase I (NADPH) and Phase II (UDPGA) Enzymes in Rat Liver Microsomes

The RLMs (2 mg/mL of protein) were assayed for activity toward the tested compounds as follows. The proteins were incubated in a buffer containing 0.1 M HEPES (pH 7.4) and 2 mM MgCl2 with either 0.05 mM substrate in a total volume of 70 µL. The substrates were also added in a buffer of HEPES with a pH of 7.4. Reactions were started by the addition of NADPH (2 mM) and UGPGA (5 mM) and were incubated for a specified time at 37 °C. The reactions were stopped by the addition of 8.75 µL of 1 M HCl, followed by centrifugation at 13,400 rpm for 10 min to pellet the denatured protein. The supernatant fractions were used for high-performance liquid chromatography (HPLC analysis). Control reactions omitting the substrate were run with each assay. All incubations were performed in two repetitions.

4.3.4. HPLC UV-Vis Analysis

HPLC analyses of the supernatants were performed using an LC-2040C 3D HPLC system and the LabSolution software package (Shimadzu, Kioto, Japonia). Samples were separated using a reversed-phase 5 μm Suplex pKb-100 analytical column (0.46 × 25 cm, C18) (Supelco, Bellefonte, PA, USA) warmed to 25 °C. The analyses were performed at a flow rate of 1 mL/min with the two following mobile phase systems, listed individually for the studied compounds.
For the 8m compound, a linear gradient from 15% to 60% methanol was used in an ammonium formate buffer (0.05 M, pH 3.4) for 20 min, followed by a linear gradient from 60% to 100% methanol in ammonium formate for 10 min. The column was then re-equilibrated at the initial conditions for 10 min between runs. The elution of each metabolite was monitored at 380 nm.
For the 8i/j compound, a linear gradient from 50% to 100% methanol was used in an ammonium formate buffer (0.05 M, pH 3.4) for 30 min. The column was then re-equilibrated at the initial conditions for 10 min between runs. The elution of each metabolite was monitored at 380 nm.

4.3.5. Liquid Chromatography–Tandem Mass Spectrometry Analysis

HPLC–tandem mass spectrometry analyses of the products were performed by electrospray ionization (ESI) with positive ion detection and an LCMS-2020 mass spectrometer (Shimadzu, Kioto, Japonia). Samples were separated according to the procedure described under HPLC UV-Visible Analysis.

4.4. Theoretical Calculations

The energy, geometrical and electronic parameters (torsion angles, frontier orbitals, dipole moments and NBO net charge distributions on the atoms) for all investigated compounds were obtained after energy minimization and geometry optimization of molecules 8am with GAUSSIAN 03 [49] at the DFT/B3LYP/6-311++G(d,p) level. The initial geometries were built de novo using the semiempirical method AM1, implemented in the HyperChem ver. 8.0.10 package [50]. The visualization of theoretical calculation results was performed using GaussView [51]. Calculations were carried out at the Academic Computer Centre in Siedlce.

4.5. Molecular Docking

The crystal structures of tyrosinase from Agaricus bisporus in complex with tropolone (PDB ID: 2Y9X) [47] and jack bean urease in complex with acetohydroxamic acid (PDB ID: 4H9M) [48], downloaded from Protein Data Bank, were used in a molecular docking procedure carried out for 8a, 8b, 8i and 8j using the GOLD Suite v. 5.8.1 software [46]. The enzyme preparation, including the addition of hydrogens, removal of water molecules and extraction of original ligand from the protein binding site, were done with the GOLD default settings. The binding site of the tropolone molecule in the crystal structure of tyrosinase and the acetohydroxamic acid molecule in the crystal structure of urease were used as the active sites, with a selection of atoms within 6 Å in the molecular docking of the investigated ligands. The tropolone and acetohydroxamic acid, as reference ligands, were removed from the X-ray structures of their protein–ligand complexes and docked back into their binding sites with the RMS values of 2.875 and 1.713 Å, respectively. The docking stimulations were run with the default parameters of GOLD, and the docked ligand was kept flexible, but the amino acid residues of the enzyme were held rigid. The number of dockings to be performed on each ligand was 10, starting each time from a different ligand conformation. The results of the different docking runs were ranked by fitness score. The pose with the best value of the scoring function was used to analyze the ligand interaction with the active site of the enzyme. The ChemPLP scoring function was used to evaluate the degree of ligand fit to the active site. ChemPLP is an empirical fitness function optimized for pose prediction, which is used to model the steric complenmentarity between the protein and the ligand [52,53]. The analysis of interactions between amino acid residues and the ligand was performed using Hermes v. 1.10.5 [52].

4.6. Cell Cultures

Detailed descriptions can be found in [54,55].

4.7. MTT Assay

The assay was performed according to the method described in [54,55].

4.8. Kinase Inhibition Assay

Kinase assays were performed according to the established protocols [55,56,57].

Author Contributions

Conceptualization, M.M.; methodology, Z.M., J.M. and Z.K.; software, J.M., Z.K.; validation, J.M., A.M. and Z.M.; formal analysis, Z.M., J.M. and Z.K.; investigation, Z.B.; data curation, J.M., Z.M. and Z.K.; writing—original draft preparation, K.K.-M., Z.M., J.M. and Z.K.; writing—review and editing, M.M, J.M. and Z.M.; visualization, Z.K.; supervision, M.M.; All authors have read and agreed to the published version of the manuscript.

Funding

This research received no external funding.

Institutional Review Board Statement

Not applicable.

Informed Consent Statement

Not applicable.

Data Availability Statement

Not applicable.

Acknowledgments

Mariusz Mojzych is thankful to Vladimír Krystof from the Centre of the Region Haná for Biotechnological and Agricultural Research, Laboratory of Growth Regulators, Faculty of Science, Palacký University, Olomouc, Czech Republic for the MTT and kinase inhibition assay.

Conflicts of Interest

The authors declare no conflict of interest.

References

  1. Lindner, H.J.; Schaden, G. [Pyrazolo 4.3-e] as triazine, a new heterocyclic system from Pseudomonas fluorescens Var. Pseudoiodinum. Chem Ber. 1972, 105, 1949. [Google Scholar] [CrossRef]
  2. Hirata, K.; Nakagami, H.; Takashina, J.; Mahmud, T.; Kobayashi, M.; Ishida, T.; Miyamoto, K. Novel violet pigment, Nostocine A, an extracelluar metabolite from cyanobacterium Nostoc spongiaeforme. Heterocycles 1996, 43, 1513. [Google Scholar]
  3. Smirnov, V.V.; Kiprianova, E.A.; Garagulya, A.D.; Esipov, S.E.; Dovjenko, S.A. Fluviols, bicyclic nitrogen- rich antibiotics produced by Pseudomonas fluorescens. FEMS Microbiol. Lett. 1997, 153, 357. [Google Scholar] [CrossRef]
  4. Supuran, C.T.; Casini, A.; Scozzafava, A. Protease inhibitors of the sulfonamide type: Anticancer, antiinflammatory, and antiviral agents. Med. Res. Rev. 2003, 5, 535. [Google Scholar] [CrossRef] [PubMed]
  5. Scozzafava, A.; Owa, T.; Mastrolorenzo, A.; Supuran, C.T. Anticancer and antiviral sulfonamides. Curr. Med. Chem. 2003, 10, 925. [Google Scholar] [CrossRef]
  6. Kleeman, A.; Engel, J.; Kutscher, B.; Reichert, D. (Eds.) Pharmaceutical Substances, Syntheses, Patents, Applications; Thieme: Stuttgart, Germany; New York, NY, USA, 1999. [Google Scholar]
  7. Terrett, N.K.; Bell, A.S.; Brown, D.; Ellis, P. Sildenafil (VIAGRATM), a potent and selective inhibitor of type 5 cGMP phosphodiesterase with utility for the treatment of male erectile dysfunction. Bioorg. Med. Chem. Lett. 1996, 6, 1819. [Google Scholar] [CrossRef]
  8. Neri, D.; Supuran, C.T. Interfering with pH regulation in tumours as a therapeutic strategy. Nat. Rev. Drug Disc. 2011, 10, 767. [Google Scholar] [CrossRef] [PubMed] [Green Version]
  9. Supuran, C.T. Carbonic anhydrases: Novel therapeutic applications for inhibitors and activators. Nat. Rev. Drug Disc. 2008, 7, 168. [Google Scholar] [CrossRef]
  10. Khan, K.M.; Maharvi, G.M.; Perveen, S.; Khan, M.T.; Abdel-Jalil, R.J.; Shah, S.T.; Fecker, M.; Choudhary, M.I.; Voelter, W. Synthesis of methyl ether analogues of sildenafil (Viagra®) possessing tyrosinase inhibitory potential. Chem. Biodivers. 2005, 2, 470–476. [Google Scholar] [CrossRef]
  11. Khan, K.M.; Maharvi, G.M.; Khan, M.T.; Perveen, S.; Choudhary, M.I. A facile and improved synthesis of sildenafil (Viagra®) analogs through solid support microwave irradiation possessing tyrosinase inhibitory potential, their conformational analysis and molecular dynamics simulation studies. Mol. Divers. 2005, 9, 15–26. [Google Scholar] [CrossRef]
  12. Byth, K.F.; Culshaw, J.D.; Green, S.; Oakes, S.E.; Thomas, A.P. Imidazolo[1,2-a]pyridines. Part 2: SAR and optimization of a potent and selective class of cyclin-dependent kinase inhibitors. Bioorg. Med. Chem. Lett. 2004, 14, 2249. [Google Scholar] [CrossRef] [PubMed]
  13. Shoaib Ahmad Shah, S.; Rivera, G.; Ashfaq, M. Recent advances in medicinal chemistry of sulfonamides. Rational design as anti-tumoral, anti-bacterial and anti-inflammatory agents. Mini Rev. Med. Chem. 2013, 13, 70–86. [Google Scholar] [CrossRef]
  14. Supuran, C.T.; Scozzafava, A.; Casini, A. Carbonic anhydrase inhibitors. Med. Res. Rev. 2003, 23, 146–189. [Google Scholar] [CrossRef] [PubMed]
  15. Supuran, C.T. Carbonic anhydrases: Catalytic and inhibition mechanisms, distribution and physiological roles. In Carbonic Anhydrase: Its Inhibitors and Activators; CRC Press: Boca Raton, FL, USA, 2004; pp. 1–23. [Google Scholar]
  16. Supuran, C.T.; Scozzafava, A. Carbonic anhydrases as targets for medicinal chemistry. Bioorg. Med. Chem. 2007, 15, 4336–4350. [Google Scholar] [CrossRef] [PubMed]
  17. Winum, J.Y.; Scozzafava, A.; Montero, J.L.; Supuran, C.T. Inhibition of carbonic anhydrase IX: A new strategy against cancer. Anticancer Agents Med. Chem. 2009, 9, 693–702. [Google Scholar] [CrossRef] [Green Version]
  18. Winum, S.J.Y.; Rami, M.; Scozzafava, A.; Montero, J.L.; Supuran, C.T. Carbonic Anhydrase IX: A new druggable target for the design of antitumor agents. Med. Res. Rev. 2008, 28, 445–463. [Google Scholar] [CrossRef] [PubMed]
  19. Pastoreková, S.; Pastorek, J. Cancer-related carbonic anhydrase isozymes and their inhibition. In Carbonic Anhydrase. Its Inhibitors and Activators; Supuran, C.T., Scozzafava, A., Conway, J., Eds.; CRC Press: Boca Raton, FL, USA, 2004; pp. 255–281. [Google Scholar]
  20. Mojzych, M.; Tarasiuk, P.; Kotwica-Mojzych, K.; Rafiq, M.; Seo, S.Y.; Nicewicz, M.; Fornal, E. Synthesis of chiral pyrazolo [4, 3-e][1, 2, 4] triazine sulfonamides with tyrosinase and urease inhibitory activity. J. Enzyme Inhib. Med. Chem. 2017, 32, 99–105. [Google Scholar] [CrossRef] [Green Version]
  21. Kaliszan, R.; Haber, P.; Baczek, T.; Siluk, D.; Valko, K. Lipophilicity and pKa estimates from gradient high-performance liquid chromatography. J. Chromatogr. A 2002, 965, 117–127. [Google Scholar] [CrossRef]
  22. Hollosy, F.; Valko, K.; Hersey, A.; Nunhuck, S.; Keri, G.; Bevan, C. Estimation of volume of distribution in humans from high throughput HPLC-based measurements of human serum albumin binding and immobilized artificial membrane partitioning. J. Med. Chem. 2006, 49, 6958–6971. [Google Scholar] [CrossRef] [PubMed]
  23. Rykowski, A.; Makosza, M. Reaction of 1, 2, 4-triazines with nitronate anions, direct nucleophilic acylation of 1, 2, 4-triazines. Tetrahedron Lett. 1984, 25, 4795. [Google Scholar] [CrossRef]
  24. Rykowski, A.; Lipinska, T. A Concise Route to a Key Intermediate in the Total Synthesis of Sempervirine1. Synth. Commun. 1996, 26, 4409. [Google Scholar] [CrossRef]
  25. Rykowski, A.; Mojzych, M.; Karczmarzyk, Z. A new synthesis of pyrazolo [4, 3-e][1, 2, 4] triazines via acid promoted ring closure of the phenylhydrazones of 5-acyl-1, 2, 4-triazines. Heterocycles 2000, 53, 2175. [Google Scholar] [CrossRef]
  26. Mojzych, M.; Rykowski, A. Transformations of phenylhydrazones of 5-acyl-1, 2, 4-triazines to pyrazolo [4, 3-e][1, 2, 4] triazines or 4-cyanopyrazole. J. Heterocycl. Chem. 2007, 44, 1003. [Google Scholar] [CrossRef]
  27. Alphonse, F.-A.; Suzenet, F.; Keromnes, A.; Lebret, B.; Guillaumet, G. Palladium-catalyzed 3-thiomethyltriazine-boronic acid cross coupling: Easy access to 3-substituted-1, 2, 4-triazines. Synlett 2002, 3, 447. [Google Scholar] [CrossRef]
  28. Mojzych, M.; Kubacka, M.; Mogilski, S.; Filipek, B.; Fornal, E. Relaxant effects of selected sildenafil analogues in the rat aorta. J. Enzyme Inhib. Med. Chem. 2016, 31, 381. [Google Scholar]
  29. Mojzych, M.; Karczmarzyk, Z.; Wysocki, W.; Ceruso, M.; Supuran, C.T.; Krystof, V.; Urbańczyk-Lipkowska, Z.; Kalicki, P. New approaches to the synthesis of sildenafil analogues and their enzyme inhibitory activity. Bioorg. Med. Chem. 2015, 23, 1421. [Google Scholar] [CrossRef] [PubMed]
  30. Mojzych, M.; Ceruso, M.; Bielawska, A.; Bielawski, K.; Fornal, E.; Supuran, C.T. New pyrazolo [4, 3-e][1, 2, 4] triazine sulfonamides as carbonic anhydrase inhibitors. Bioorg. Med. Chem. 2015, 23, 3674. [Google Scholar] [CrossRef] [PubMed]
  31. Mojzych, M.; Bielawska, A.; Bielawski, K.; Ceruso, M.; Supuran, C.T. Pyrazolo [4, 3-e][1, 2, 4] triazine sulfonamides as carbonic anhydrase inhibitors with antitumor activity. Bioorg. Med. Chem. 2014, 22, 2643. [Google Scholar] [CrossRef]
  32. Soczewinski, E.; Wachtmeister, C.A. The relation between the composition of certain ternary two-phase solvent systems and RM values. J. Chromatogr. A 1962, 7, 311. [Google Scholar] [CrossRef]
  33. Janicka, M.; Kwietniewski, L.; Matysiak, J. A new method for estimating log kw values and solute biological activity. JPC-J. Planar Chromat. 2000, 13, 285. [Google Scholar]
  34. Niewiadomy, A.; Zabinska, A.; Matysiak, J.; Rozylo, J.K. Influence of modifier and molecular structure of some dihydroxythiobenzanilides on retention in reversed-phase high-performance thin-layer chromatography. J. Chromatogr. A 1997, 791, 237. [Google Scholar] [CrossRef]
  35. Valko, K. Application of high-performance liquid chromatography based measurements of lipophilicity to model biological distribution. J. Chromatogr. A 2004, 1037, 299. [Google Scholar] [CrossRef]
  36. Ong, S.; Pidgeon, C. Thermodynamics of solute partitioning into immobilized artificial membranes. Anal. Chem. 1995, 67, 2119. [Google Scholar]
  37. Mojzych, M.; Bernat, Z.; Karczmarzyk, Z.; Matysiak, J.; Fruziński, A. Synthesis, Structural Characterization, and Biological Activity of New Pyrazolo [4, 3-e][1, 2, 4] triazine Acyclonucleosides. Molecules 2020, 25, 221. [Google Scholar] [CrossRef] [PubMed] [Green Version]
  38. Ghose, A.K.; Crippen, G.M. Atomic physicochemical parameters for three-dimensional-structure-directed quantitative structure-activity relationships. 2. Modeling dispersive and hydrophobic interactions. J. Chem. Inf. Comp. Sci. 1987, 27, 21. [Google Scholar] [CrossRef]
  39. Petrauskas, A.A.; Kolovanov, E.A. ACD/Log P method description. Perspect. Drug Discov. Des. 2000, 19, 99. [Google Scholar] [CrossRef]
  40. Janicka, M.; Sztanke, M.; Sztanke, K. Reversed-phase liquid chromatography with octadecylsilyl, immobilized artificial membrane and cholesterol columns in correlation studies with in silico biological descriptors of newly synthesized antiproliferative and analgesic active compounds. J. Chromatogr. A 2013, 1318, 91. [Google Scholar] [CrossRef]
  41. Pyka, A.; Buska, M.; Zachariasz, M. A comparison of theoretical methods of calculation of partition coefficients for selected drugs. Acta Pol. Pharm. 2006, 63, 159. [Google Scholar]
  42. Barbato, F.; Cirocco, V.; Grumetto, L.; la Rotonda, M.I. Comparison between immobilized artificial membrane (IAM) HPLC data and lipophilicity in n-octanol for quinolone antibacterial agents. Eur. J. Pharm. Sci. 2007, 31, 288–297. [Google Scholar] [CrossRef]
  43. Veber, D.F.; Johnson, S.R.; Cheng, H.Y.; Smith, B.R.; Ward, K.W.; Kopple, K.D. Molecular properties that influence the oral bioavailability of drug candidates. J. Med. Chem. 2002, 45, 2615. [Google Scholar] [CrossRef] [PubMed]
  44. Valko, K.; Nunhuck, S.; Bevan, C.; Abraham, M.H.; Reyncilds, D.P. Fast gradient HPLC method to determine compounds binding to human serum albumin. Relationships with octanol/water and immobilized artificial membrane lipophilicity. J. Pharm. Sci. 2003, 92, 2236. [Google Scholar] [CrossRef] [PubMed]
  45. Bertrand, S.M.; Ancellin, N.; Beaufils, B.; Bingham, R.P.; Borthwick, J.A.; Boullay, A.B.; Boursier, E.; Carter, P.S.; Chung, C.W.; Churcher, I.; et al. The discovery of in vivo active mitochondrial branched-chain aminotransferase (BCATm) inhibitors by hybridizing fragment and HTS hits. J. Med. Chem. 2015, 58, 7140. [Google Scholar] [CrossRef] [PubMed]
  46. Noctor, T.A.; Diaz-Perez, M.J.; Wainer, I.W. Use of a human serum albumin-based stationary phase for high-performance liquid chromatography as a tool for the rapid determination of drug-plasma protein binding. J. Pharm. Sci. 2015, 82, 675. [Google Scholar] [CrossRef]
  47. Ismaya, W.T.; Rozeboom, H.J.; Weijn, A.; Mes, J.J.; Fusetti, F.; Wichers, H.J.; Dijkstra, B.W. Crystal structure of Agaricus bisporus mushroom tyrosinase: Identity of the tetramer subunits and interaction with tropolone. Biochemistry 2011, 50, 5477–5486. [Google Scholar] [CrossRef] [PubMed] [Green Version]
  48. Begum, A.; Choudhary, M.I.; Betzel, C. The First Jack Bean Urease (Canavalia Ensiformis) Complex Obtained at 1.52 Resolution. 2012. Available online: https://dx.doi.org/10.2210/pdb4h9m/pdb (accessed on 20 March 2009).
  49. Frisch, M.J.; Trucks, G.W.; Schlegel, H.B.; Scuseria, G.E.; Robb, M.A.; Cheeseman, J.R.; Montgomery, J.A., Jr.; Vreven, T.; Kudin, K.N.; Burant, J.C.; et al. Pople, Gaussian 03, Revision E.01; Gaussian, Inc.: Wallingford, CT, USA, 2004. [Google Scholar]
  50. HyperChem. Release 8.0.10 for Windows Molecular Modeling System; Hypercube Inc.: Gainesville, FL, USA, 2011. [Google Scholar]
  51. Frisch, A.; Dennington, R.D., II; Keith, T.A.; Millam, J.; Nielsen, A.B.; Holder, A.J.; Hiscocks, J. Gauss View Reference; Version 4; Gaussian Inc.: Wallingford, CT, USA, 2007. [Google Scholar]
  52. Jones, G.G.; Willett, P.; Glen, R.C.; Leach, A.R.; Taylor, R. Development and validation of a genetic algorithm for flexible docking. J. Mol. Biol. 1997, 267, 727–748. [Google Scholar] [CrossRef] [Green Version]
  53. Korb, O.; Stützle, T.; Exner, T.E. Empirical scoring functions for advanced protein−Ligand docking with PLANTS. J. Chem. Inf. Model. 2009, 49, 84–96. [Google Scholar] [CrossRef]
  54. Carmichael, J.; Degraff, W.; Gazdar, A.; Minna, J.; Mitchell, J. Evaluation of a tetrazolium-based semiautomated colorimetric assay: Assessment of chemosensitivity testing. Cancer Res. 1987, 47, 936. [Google Scholar] [PubMed]
  55. Mojzych, M.; Subertová, V.; Bielawska, A.; Bielawski, K.; Bazgier, V.; Berka, K.; Gucký, T.; Fornal, E.; Krystof, V. Synthesis and kinase inhibitory activity of new sulfonamide derivatives of pyrazolo[4,3-e][1,2,4]triazines. Eur. J. Med. Chem. 2014, 78, 217. [Google Scholar] [CrossRef]
  56. Zatloukal, M.; Jorda, R.; Gucky, T.; Reznickova, E.; Voller, J.; Pospisil, T.; Malinkova, V.; Adamcova, H.; Krystof, V.; Strnad, M. Synthesis and in vitro biological evaluation of 2, 6, 9-trisubstituted purines targeting multiple cyclin-dependent kinases. Eur. J. Med. Chem. 2013, 61, 61–72. [Google Scholar] [CrossRef]
  57. Jorda, R.; Havlicek, L.; McNae, I.W.; Walkinshaw, M.D.; Voller, J.; Sturc, A.; Navratilová, J.; Kuzma, M.; Mistrik, M.; Bartek, J.; et al. Pyrazolo [4, 3-d] pyrimidine bioisostere of roscovitine: Evaluation of a novel selective inhibitor of cyclin-dependent kinases with antiproliferative activity. J. Med. Chem. 2011, 54, 2980–2993. [Google Scholar] [CrossRef] [PubMed]
Scheme 1. Synthetic pathway to the sulfonamides 8ai. Reagents and conditions include (a) CH3CH2NO2, KOH, DMSO, 2 h, 80–86%; (b) Na2S2O4, H2O/dioxane, rt, 12 h, 55–65%; (c) CH3NH-NH2, PTSA, EtOH, rt, 1 h, 50–55%; (d) method A: 10% HCl, EtOH, reflux, 1 h, 58–61%; method B: PTSA, 140 °C, 1 min, 61%; (e) ethoxyphenylboronic acid, Pd(PPh3)4, CuMeSal, THF, Ar, reflux, overnight, 75–80%; (f); ClSO3H, 0 °C to rt, 2 h, 75–95%; and (g) appropriate amine, anhydrous MeCN, rt, overnight, 72–93%.
Applsci 11 02660 sch001
Figure 1. Molecules 8am with the vector’s dipole moment in the low-energy conformation obtained from calculations at the DFT/B3LYP/6-311++G(d,p) level.
Applsci 11 02660 g001
Figure 2. The numbering of the atoms and the definition of the torsion angles φ1, φ2, φ3, φ4 and φ5, describing the conformation of the pyrazolo[4,3-e][1,2,4]triazine-ethoxybenzene-sulfonamide part of molecules 8am.
Applsci 11 02660 g002
Figure 3. Graphical representation of the HOMO and LUMO orbitals for 8a and 8j, as calculated using the DFT/B3LYP/6-311++G(d,p) method.
Applsci 11 02660 g003
Figure 4. Metabolism of 8m (a), 8i (b) and 8j (c) with rat liver microsomes (RLMs) and NADPH as cofactors. Representative HPLC chromatograms of the incubations of 0.05 mM 8m, 8i and 8j at 37 °C with 2 mg/mL of RLM in the presence of 2 mM NADPH.
Applsci 11 02660 g004
Figure 5. UV-Vis spectra of the metabolites of 8m (a), 8i (b) and 8j (c) formed with RLM and NADPH. Spectra were recorded directly during HPLC analysis by means of a multidiode array detector in an ammonium formate pH 3.4/methanol mobile phase.
Applsci 11 02660 g005
Figure 6. The proposed metabolic pathways of compounds 8m, 8i and 8j.
Applsci 11 02660 g006
Figure 7. A view of the interaction of (a) 8j and (b) 8b with amino acids of the binding site in mushroom tyrosinase.
Applsci 11 02660 g007
Figure 8. A view of the interaction of (a) 8a and (b) 8i with amino acids of the binding site in jack bean urease.
Applsci 11 02660 g008
Table 1. The torsion angles φ1, φ2, φ3, φ4 and φ5 (°) calculated at the DFT/B3LYP/311++G(d,p) level for 8am.
Comp.φ1φ2φ3φ4φ5
8a48.34−176.79177.69−61.88−86.87
8b48.12−176.14177.58−79.54−65.17
8c48.49−176.67177.30−71.34−91.70
8d48.27−176.62177.40−73.26−105.64
8e48.38−175.89177.14−82.67−64.24
8f47.82−176.36177.66−74.63−92.87
8g48.02−176.50177.62−70.19−91.80
8h48.24−176.20178.03−84.06−65.37
8i48.12−175.91177.43−77.67−52.71
8j48.21−175.98177.62−76.04−62.26
8k48.82−176.71177.24−57.63−86.19
8l48.99−176.38177.10−56.25−93.33
8m−47.34−176.31178.33−89.0169.02
Table 2. Total energy ET (kcal/mol.), dipole moment MD (D), energy of HOMO, EHOMO, LUMO, ELUMO, orbitals (kcal/mol) and ΔE = ELUMOEHOMO (kcal/mol) for 8am calculated at the DFT/B3LYP/6-311++G(d,p) level.
Comp.ETMDEHOMOELUMOΔE
8a−1,059,794.5797.896−154.284−64.35789.927
8b−1,059,793.3067.177−151.234−62.38688.848
8c−1,109,145.7457.857−153.795−64.08689.709
8d−1,109,143.3106.350−153.380−64.02489.356
8e−1,059,794.5236.287−153.619−64.36389.256
8f−1,059,795.5087.522−153.631−63.90589.726
8g−1,107,011.8277.035−153.387−63.57989.808
8h−1,107,007.2717.434−151.253−63.11488.139
8i−1,133,819.7718.453−155.050−65.47489.576
8j−1,133,818.2786.853−151.467−62.73888.729
8k−1,131,683.1748.171−152.809−64.63988.170
8l−1,084,469.2217.549−150.193−62.83887.355
8m−1,095,904.1706.682−145.160−62.85682.304
Table 3. Net atomic charges (e) on the selected atoms in the pyrazolo[4,3-e][1,2,4]triazine-ethoxybenzene-sulfonamide part of molecules 8am, calculated using the NBO method at the DFT/B3LYP/6-311++G(d,p) level.
Atom8a8b8c8d8e8f8g8h8i8j8k8l8m
N1−0.202−0.208−0.202−0.202−0.202−0.202−0.202−0.202−0.201−0.208−0.201−0.202−0.203
N2−0.232−0.229−0.232−0.231−0.231−0.231−0.232−0.231−0.231−0.229−0.231−0.231−0.231
C3+0.378+0.378+0.378+0.378+0.378+0.378+0.377+0.380+0.378+0.378+0.380+0.381+0.379
N4−0.412−0.410−0.412−0.413−0.413−0.416−0.416−0.412−0.414−0.412−0.414−0.413−0.413
C5+0.113+0.113+0.113+0.113+0.113+0.113+0.113+0.113+0.113+0.113+0.112+0.112+0.113
C6+0.318+0.322+0.318+0.318+0.318+0.318+0.318+0.317+0.318+0.322+0.317+0.317+0.317
N7−0.226−0.231−0.226−0.226−0.226−0.226−0.226−0.226−0.225−0.232−0.226−0.225−0.225
N8−0.235−0.235−0.235−0.235−0.234−0.235−0.235−0.235−0.234−0.235−0.235−0.236−0.235
C9+0.157+0.159+0.157+0.157+0.157+0.158+0.158+0.156+0.157+0.159+0.156+0.156+0.157
O18−0.537−0.539−0.537−0.536−0.537−0.535−0.536−0.538−0.538−0.539−0.538−0.540−0.530
S21+2.207+2.227+2.212+2.217+2.217+2.209+2.209+2.220+2.225+2.230+2.224+2.219+2.238
O22−0.904−0.913−0.907−0.911−0.913−0.907−0.961−0.913−0.913−0.914−0.908−0.915−0.917
O23−0.952−0.925−0.950−0.950−0.921−0.952−0.959−0.927−0.940−0.927−0.962−0.931−0.920
N24−0.875−0.890−0.885−0.893−0.865−0.874−0.886−0.875−0.896−0.895−0.916−0.913−0.750
Table 4. Inhibition of protein kinase and antiproliferative activity of sulfonamide derivatives of pyrazolo[4,3-e][1,2,4]triazines (8al) after 24 h of incubation.
Compd.MTT Assay, IC50 (µM) a
CDK2/EAblK562MCF-7p53
8a>100>100>100>100>100
8b>100>100>100>100>100
8c>100>100>100>100>100
8d>100>100>100>100>100
8e>100>100>100>100>100
8f>100>100>100>100>100
8g>100>100>100>100>100
8h>100>100>100>100>100
8i>100>100>100>100>100
8j>100>100>100>100>100
8k>100>100>100>100>100
8l>100>100>100>100>100
chlorambuciln.a.n.a.84 ± 697 ± 2
imatinib>1000.313 ± 2n.a.
roscovitine0.1>1004211
a Data represent the mean ± SD of each compound from four independent experiments.
Table 5. The lipophilicity parameters of compounds (log k w(RP−18) and –S values (Equation (1)) obtained by RP-18 and immobilized artificial membrane (IAM) HPLC chromatography (pH = 7.4).
No.RP-18 HPLC, pH = 7.4IAM HPLC, pH = 7.4Δ log kw
Slog kwr2nφSlog kwr2n
8a4.89912.50780.99671330–906.0158 1.39810.9879101.1097
8b4.84572.49180.99771330–905.8731 1.33690.9929101.1549
8c5.16042.91890.9981140–905.7249 1.61660.992481.3023
8d4.96562.81080.99571040–855.78391.63040.991381.1804
8e4.78002.52110.98621330–905.51501.32300.9951101.1981
8f4.87772.52950.99631330–905.92691.39950.9870101.1300
8g4.62902.16770.99051330–905.1630 1.08740.986791.0803
8h4.75172.23970.98921230–855.3347 1.11560.9903101.1241
8i5.61073.38250.99631140–906.65272.04140.982991.3411
8j5.67043.23710.99601040–856.16221.93010.992581.3070
8k4.89482.41620.99541230–855.43201.21840.9908101.1978
8l5.06112.77060.9941135–855.73801.51550.990191.2551
8m3.76862.57560.9984730–855.12481.59110.981660.9845
Table 6. The molecular descriptors (a) of the compounds calculated in silico.
No.HBDHM log PClog PACD log PtPSACMRpK a
8a20.4350.2991.46132.1210.271.01
8b20.4350.2991.46132.1210.271.01
8c20.9051.2272.34132.1211.191.01
8d20.9051.2272.34132.1211.191.01
8e20.4350.2991.46132.1210.271.01
8f20.4350.2991.46132.1210.271.01
8g3−0.289−0.1570.50152.3510.421.01
8h3−0.289−0.1570.50152.3510.421.01
8i21.1321.7552.87132.1211.661.01
8j21.1321.7552.87132.1211.661.01
8k3−0.0510.2481.28152.3510.881.01
8l20.6720.6981.81132.1210.731.01
8m00.9051.1222.27102.5411.231.01/5.96
a HBDH = the number of hydrogen bond donor protons; MlogP = the Moriguchi estimation log P; C log P; ACD log P = log P calculated using the ACD/Labs algorithm; tPSA = the polar surface area; CMR = the molar refractivity; and pKa = log Ka.
Table 7. The log k values of the compounds obtained using the human serum albumin (HSA) and α1-glycoprotein (AGP) columns, with the log K values obtained from a calibration curve (log binding equilibrium constant) and calculated % plasma protein binding (% PPB) (% HSA, % AGP).
HSAAGP
log kHSAlog KHSA% HSAlog kAGPlog KAGP% AGP
8a−0.78.4−0.42027.8−1.841−1.6472.3
8b−0.822−0.45926,1−0.6199−0.39628.9
8c−0.442−0.07546.1−0.519−0.29334.1
8d−0.782−0.41827.9−0.483−0.25736.0
8e−2.052−1.7022.0−0.966−0.75115.2
8f−1.771−1.4183.7−0.986−0.77114.6
8g−0.926−0.56421.6−0.762−0.54322.5
8h−1.248−0.89011.5−1.675−1.4773.3
8i−0.2050.16560.0−0.297−0.06646.6
8j−0.1860.183161.0−0.384−0.15541.6
8k−0.917−0.55522.0−1.646−1.4473.5
8l−0.694−0.32932.2−0.494−0.26835.4
8m−0.1970.17360.4−0.2220.01051.0
Table 8. ESI-MS m/z obtained after 8m, 8i and 8j metabolism with rat liver microsomes (RLMs) and NADPH as cofactors.
Compd.ESI-MS m/z
8m432.1[8m + H+]
P1448.1[8m + 16 + H+]
P2404.1[8m-28 + H+]
8i449.1[8i + H+]
P3465.1[8i + 16 + H+]
P4435.1[8i-14 + H+]
P5421.1[8i-28 + H+]
8j449.1[8j + H+]
P6465.1[8j + 16 + H+]
P7435.1[8j-14 + H+]
P8421.1[8j-28 + H+]
Publisher’s Note: MDPI stays neutral with regard to jurisdictional claims in published maps and institutional affiliations.

