
Reliability Evaluation of the Factors That Influenced COVID-19 Patients’ Condition


Abstract
Featured Application
Abstract
1. Introduction
- -
- the possibility of a time-dependent and time-independent reliability analysis;
- -
- the univalent correlation of the system state and component states for all possible combinations of the components states;
- -
- the canonical representation of the system with any structural complexity;
- -
- the complexity of the system representation is not dependent on its structure complexity and depends on the number of components only.
2. Structure Function and Uncertain Data
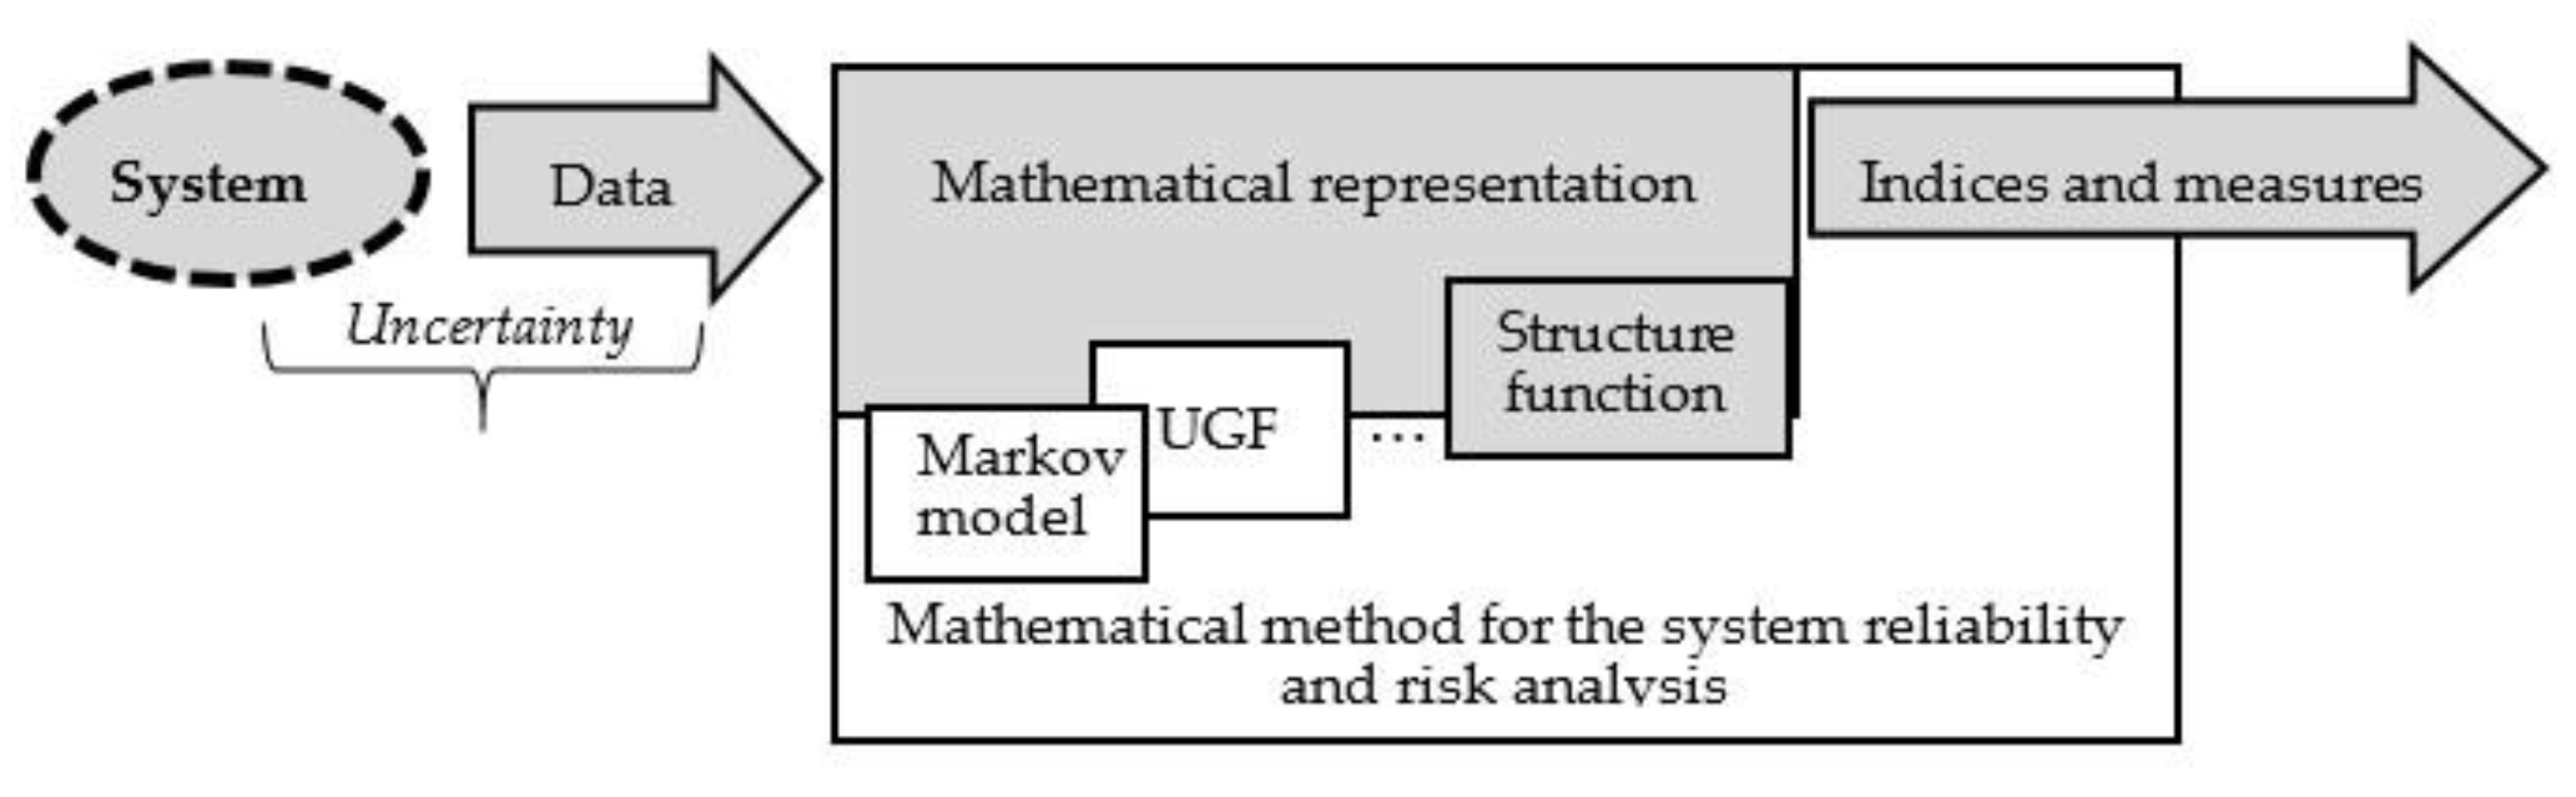
2.1. System Mathematical Representation
2.2. Structure Function
2.3. Related Studies
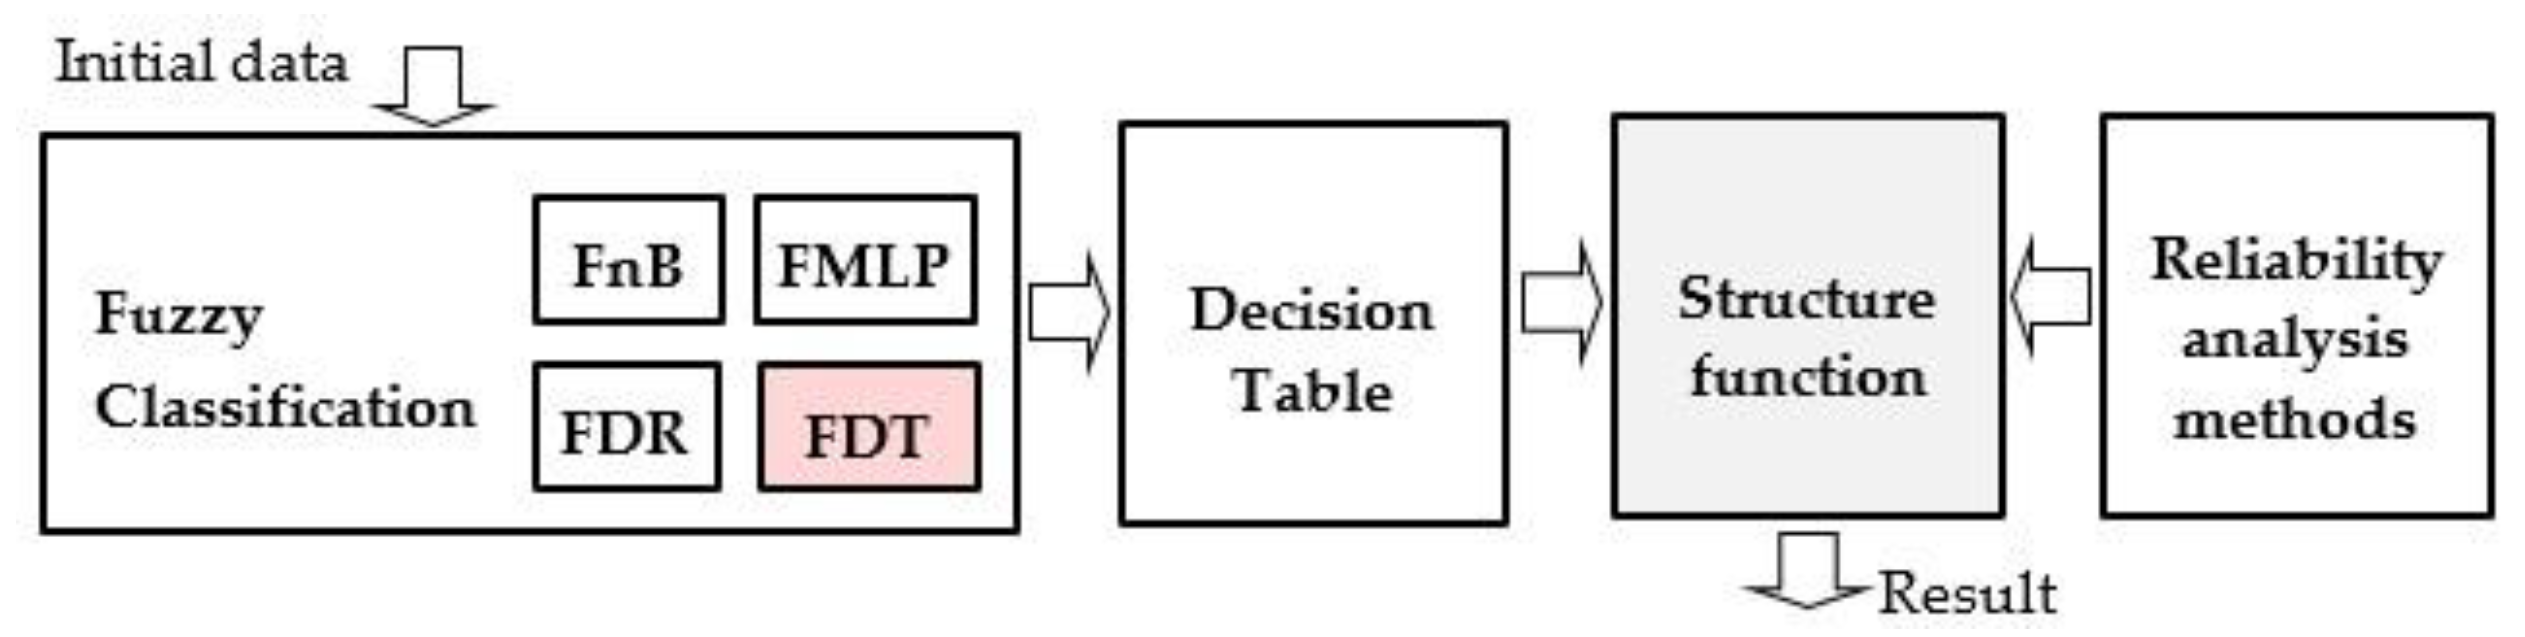
3. Method of the Structure Function Building
- -
- The induction of a fuzzy classifier based on the initial data.
- -
- The building of the decision table based on the inducted classifier.
- -
- The interpretation of the decision table as the structure function and the computation of the indices and measures for the reliability and risk evaluation.
4. Usage the Structure Function for System Evaluation
5. Results
6. Discussion
7. Conclusions
Author Contributions
Funding
Institutional Review Board Statement
Informed Consent Statement
Data Availability Statement
Conflicts of Interest
References
- Zaitseva, E.; Levashenko, V.; Rabcan, J.; Krsak, E. Application of the Structure Function in the Evaluation of the Human Factor in Healthcare. Symmetry 2020, 12, 93. [Google Scholar] [CrossRef]
- Zhang, M. A heuristic policy for maintaining multiple multi-state systems. Reliab. Eng. Syst. Saf. 2020, 203, 107081. [Google Scholar] [CrossRef]
- Shafiee, M.; Finkelstein, M.; Bérenguer, C. An opportunistic condition-based maintenance policy for offshore wind turbine blades subjected to degradation and environmental shocks. Reliab. Eng. Syst. Saf. 2015, 142, 463–471. [Google Scholar] [CrossRef]
- Mohaghegh, Z.; Mosleh, A. Incorporating organizational factors into probabilistic risk assessment of complex socio-technical systems: Principles and theoretical foundations. Saf. Sci. 2009, 47, 1139–1158. [Google Scholar] [CrossRef]
- World Health Assembly Global action on patient safety. In Proceedings of the Seventy-Second World Health Assembly, Geneva, Switzerland, 20–28 May 2019; Volume 22, pp. 809–815.
- Hale, D.; Fallon, E.F.; Fitzgerald, C. An equipment qualification framework for healthcare. IISE Trans. Healthc. Syst. Eng. 2019, 10, 47–59. [Google Scholar] [CrossRef]
- Spurgeon, P.; Flanagan, H.; Cooke, M.; Sujan, M.; Cross, S.; Jarvis, R. Creating safer health systems: Lessons from other sectors and an account of an application in the Safer Clinical Systems programme. Health Serv. Manag. Res. 2017, 30, 85–93. [Google Scholar] [CrossRef] [PubMed]
- Carayon, P.; Xie, A.; Kianfar, S. Human factors and ergonomics as a patient safety practice. BMJ Qual. Saf. 2014, 23, 196–205. [Google Scholar] [CrossRef] [PubMed]
- Qian, K.; Yahara, T. Mentality and behavior in COVID-19 emergency status in Japan: Influence of personality, morality and ideology. PLoS ONE 2020, 15, e0235883. [Google Scholar] [CrossRef] [PubMed]
- Aven, T.; Bouder, F. The COVID-19 pandemic: How can risk science help? J. Risk Res. 2020, 23, 849–854. [Google Scholar] [CrossRef]
- Aven, T.; Zio, E. Globalization and global risk: How risk analysis needs to be enhanced to be effective in confronting current threats. Reliab. Eng. Syst. Saf. 2021, 205, 107270. [Google Scholar] [CrossRef]
- Albornoz-Cabello, M.; Pérez-Mármol, J.M.; Cardero-Durán, M.D.L. Ángeles; Barrios-Quinta, C.J.; Espejo-Antúnez, L. Construction, Factor Structure, and Internal Consistency Reliability of the Hospital Physical Therapy Perceived Satisfaction Questionnaire (H-PTPS). Int. J. Environ. Res. Public Health 2020, 17, 5857. [Google Scholar] [CrossRef]
- Zaitseva, E.; Kvassay, M.; Levashenko, V.; Kostolny, J. Estimation of a Healthcare System Based on the Importance Analysis. In Computational Intelligence, Medicine and Biology. Studies in Computational Intelligence; Pancerz, K., Zaitseva, E., Eds.; Springer International Publishing: Cham, Switzerland, 2015; Volume 600, pp. 3–22. [Google Scholar] [CrossRef]
- Misirli, A.T.; Bener, A.B. Bayesian Networks For Evidence-Based Decision-Making in Software Engineering. IEEE Trans. Softw. Eng. 2014, 40, 533–554. [Google Scholar] [CrossRef]
- Jung, H.; Chung, K. Life style improvement mobile service for high risk chronic disease based on PHR platform. Clust. Comput. 2016, 19, 967–977. [Google Scholar] [CrossRef]
- Sujan, M.A.; Embrey, D.; Huang, H. On the application of Human Reliability Analysis in healthcare: Opportunities and challenges. Reliab. Eng. Syst. Saf. 2020, 194, 106189. [Google Scholar] [CrossRef]
- Taylor, E.F. The reliability engineer in the health care system. In Proceedings of the IEEE the 18th Annual Reliability & Maintainability Symposium, San Francisco, CA, USA, 25–27 January 1972; pp. 245–248. [Google Scholar]
- Bogner, M.S. Human Error in Medicine; Lawrence Erlabaum Associates: Hillsdale, NJ, USA, 1994. [Google Scholar]
- Fiaz, M.; Ikram, A.; Ilyas, A. Enterprise Resource Planning Systems: Digitization of Healthcare Service Quality. Adm. Sci. 2018, 8, 38. [Google Scholar] [CrossRef]
- Dhillon, B. Reliability Technology, Human Error, and Quality in Health Care. In Reliability Technology, Human Error, and Quality in Health Care; CRC Press: Boca Raton, FL, USA, 2008. [Google Scholar]
- Nemeth, C.; Cook, R. Reliability versus Resilience: What Does Healthcare Need? In Proceedings of the Human Factors and Ergonomics Society Annual Meeting; SAGE Publications: Thousand Oaks, CA, USA, 2007; Volume 51, pp. 621–625. [Google Scholar]
- Albahri, A.S.; Hamid, R.A.; Alwan, J.K.; Al-Qays, Z.; Zaidan, A.A.; Zaidan, B.B.; Alamoodi, A.H.; Khlaf, J.M.; Almahdi, E.M.; Thabet, E.; et al. Role of biological Data Mining and Machine Learning Techniques in Detecting and Diagnosing the Novel Coronavirus (COVID-19): A Systematic Review. J. Med. Syst. 2020, 44, 1–11. [Google Scholar] [CrossRef]
- Comtet, H.; Johannessen, K.-A. The Moderating Role of Pro-Innovative Leadership and Gender as an Enabler for Future Drone Transports in Healthcare Systems. Int. J. Environ. Res. Public Health 2021, 18, 2637. [Google Scholar] [CrossRef]
- Bieńkowska, A.; Tworek, K.; Zabłocka-Kluczka, A. Organizational Reliability Model Verification in the Crisis Escalation Phase Caused by the COVID-19 Pandemic. Sustain. J. Rec. 2020, 12, 4318. [Google Scholar] [CrossRef]
- Zaitseva, E.; Levashenko, V.; Kvassay, M.; Barach, P. Healthcare system reliability analysis addressing uncertain and ambiguous data. In Proceedings of the 2017 International Conference on Information and Digital Technologies (IDT), Zilina, Slovakia, 5–7 July 2017; IEEE: Danvers, MA, USA, 2017; pp. 442–451. [Google Scholar]
- Barlow, R.E.; Proschan, F. Statistical Theory of Reliability and Life Testing Probability Models To Begin With. Technometrics 1975, 72, 304. [Google Scholar]
- Zio, E. Reliability engineering: Old problems and new challenges. Reliab. Eng. Syst. Saf. 2009, 94, 125–141. [Google Scholar] [CrossRef]
- Lisnianski, A.; Frenkel, I.; Karagrigoriou, A. Recent Advances in Multi-State Systems Reliability; Springer: Cham, Switzerland, 2018; ISBN 978-3-319-63423-4. [Google Scholar]
- Levitin, G. Optimizing Defense Strategies for Complex Multi-State Systems. Harvey J. Greenberg 2008, 128, 33–64. [Google Scholar] [CrossRef]
- Barlow, R.E.; Wu, A.S. Coherent Systems with Multi-State Components. Math. Oper. Res. 1978, 3, 275–281. [Google Scholar] [CrossRef]
- Birolini, A. Reliability Engineering Theory and Practice, 5th ed.; Springer: Berlin/Heidelberg, Germany, 2007; ISBN 9783540493884. [Google Scholar]
- Zaitseva, E.; Levashenko, V. Investigation Multi-State System Reliability by Structure Function. In Proceedings of the 2nd International Conference on Dependability of Computer Systems (DepCoS-RELCOMEX ’07), SzklarskaPoreba, Poland, 14–16 June 2007; IEEE: Los Alamitos, CA, USA, 2007; pp. 81–90. [Google Scholar]
- Zaitseva, E.; Levashenko, V. Construction of a Reliability Structure Function Based on Uncertain Data. IEEE Trans. Reliab. 2016, 65, 1710–1723. [Google Scholar] [CrossRef]
- Uncertainty in Risk Assessment. In Uncertainty in Risk Assessment; Wiley: Chichester, UK, 2014; Volume 9781118489, pp. 1–186.
- Barach, P. Designing high-reliability healthcare teams. In Proceedings of the 2016 International Conference on Information and Digital Technologies (IDT), Rzeszow, Poland, 5–7 June 2016; IEEE: Danvers, MA, USA, 2016; pp. 17–22. [Google Scholar]
- Bracco, F.; Masini, M.; De Tonetti, G.; Brogioni, F.; Amidani, A.; Monichino, S.; Maltoni, A.; Dato, A.; Grattarola, C.; Cordone, M.; et al. Adaptation of non-technical skills behavioural markers for delivery room simulation. BMC Pregnancy Childbirth 2017, 17, 89. [Google Scholar] [CrossRef] [PubMed]
- Muñoz-Saavedra, L.; Civit-Masot, J.; Luna-Perejón, F.; Domínguez-Morales, M.; Civit, A. Does Two-Class Training Extract Real Features? A COVID-19 Case Study. Appl. Sci. 2021, 11, 1424. [Google Scholar] [CrossRef]
- Bačenková, D.; Trebuňová, M.; Špakovská, T.; Schnitzer, M.; Bednarčíková, L.; Živčák, J. Comparison of Selected Characteristics of SARS-CoV-2, SARS-CoV, and HCoV-NL63. Appl. Sci. 2021, 11, 1497. [Google Scholar] [CrossRef]
- Marović, I.; Perić, M.; Hanak, T. A Multi-Criteria Decision Support Concept for Selecting the Optimal Contractor. Appl. Sci. 2021, 11, 1660. [Google Scholar] [CrossRef]
- Kuo, W.; Zhu, X. Importance Measures in Reliability, Risk, and Optimization. In Importance Measures in Reliability, Risk, and Optimization; Wiley: Chichester, UK, 2012. [Google Scholar]
- Zaitseva, E.N.; Levashenko, V.G. Importance analysis by logical differential calculus. Autom. Remote Control 2013, 74, 171–182. [Google Scholar] [CrossRef]
- Wang, H.; Leung, D.; Leung, M.; Ni, M. A review on hydrogen production using aluminum and aluminum alloys. Renew. Sustain. Energy Rev. 2009, 13, 845–853. [Google Scholar] [CrossRef]
- Zaitseva, E.; Levashenko, V.; Kvassay, M.; Deserno, T.M. Reliability Estimation of Healthcare Systems using Fuzzy Decision Trees. In Proceedings of the 2016 Federated Conference on Computer Science and Information Systems, Gdansk, Poland, 11–14 September 2016; Volume 8, pp. 331–340. [Google Scholar] [CrossRef]
- Maimon, O.; Rokach, L. Data Mining and Knowledge Discovery Handbook; Springer: New York, NY, USA, 2005; ISBN 0-387-24435-2. [Google Scholar]
- Zaman, M.; Hassan, A. Fuzzy Heuristics and Decision Tree for Classification of Statistical Feature-Based Control Chart Patterns. Symmetry 2021, 13, 110. [Google Scholar] [CrossRef]
- Ley, D. Approximating process knowledge and process thinking: Acquiring workflow data by domain experts. In Proceedings of the 2011 IEEE International Conference on Systems, Man, and Cybernetics, Guangxi, China, 10–13 July 2011; pp. 3274–3279. [Google Scholar]
- Yu, D.; Park, W.S. Combination and evaluation of expert opinions characterized in terms of fuzzy probabilities. Ann. Nucl. Energy 2000, 27, 713–726. [Google Scholar] [CrossRef]
- Huang, H.Z. Structural reliability analysis using fuzzy sets theory. Eksploat. Niezawodn. 2012, 14, 284–294. [Google Scholar]
- Tanaka, H.; Fan, L.T.; Lai, F.S.; Toguchi, K. Fault-Tree Analysis by Fuzzy Probability. IEEE Trans. Reliab. 1983, R-32, 453–457. [Google Scholar] [CrossRef]
- Jiang, C.; Zhang, Z.; Han, X.; Liu, J. A novel evidence-theory-based reliability analysis method for structures with epistemic uncertainty. Comput. Struct. 2013, 129, 1–12. [Google Scholar] [CrossRef]
- De Felice, F.; Petrillo, A. An Overview on Human Error Analysis and Reliability Assessment; Springer Series in Reliability Engineering: Piscataway, NJ, USA, 2017; pp. 19–41. [Google Scholar]
- Moieni, P.; Spurgin, A.; Singh, A. Advances in human reliability analysis methodology. Part I: Frameworks, models and data. Reliab. Eng. Syst. Saf. 1994, 44, 27–55. [Google Scholar] [CrossRef]
- Abrishami, S.; Khakzad, N.; Hosseini, S.M.; van Gelder, P. BN-SLIM: A Bayesian Network methodology for human reliability assessment based on Success Likelihood Index Method (SLIM). Reliab. Eng. Syst. Saf. 2020, 193, 106647. [Google Scholar] [CrossRef]
- Hollnagel, E. Cognitive Reliability and Error Analysis Method (CREAM); Elsevier: Oxford, UK, 1998. [Google Scholar]
- Foster, J.D.; Miskovic, D.; Allison, A.S.; Conti, J.A.; Ockrim, J.; Cooper, E.J.; Hanna, G.B.; Francis, N.K. Application of objective clinical human reliability analysis (OCHRA) in assessment of technical performance in laparoscopic rectal cancer surgery. Tech. Coloproctol. 2016, 20, 361–367. [Google Scholar] [CrossRef] [PubMed]
- Faiella, G.; Parand, A.; Franklin, B.D.; Chana, P.; Cesarelli, M.; Stanton, N.A.; Sevdalis, N. Expanding healthcare failure mode and effect analysis: A composite proactive risk analysis approach. Reliab. Eng. Syst. Saf. 2018, 169, 117–126. [Google Scholar] [CrossRef]
- Khan, M.A.; Kim, J. Toward Developing Efficient Conv-AE-Based Intrusion Detection System Using Heterogeneous Dataset. Electronics 2020, 9, 1771. [Google Scholar] [CrossRef]
- Jore, S.; Egeli, A. Risk management methodology for protecting against malicious acts—Are probabilities adequate means for describing terrorism and other security risks? In Proceedings of the Safety and Reliability of Complex Engineered Systems, Zurich, Switzerland, 7–10 September 2015; CRC Press: Leiden, The Netherlands, 2015; pp. 807–815. [Google Scholar]
- Wang, T.-R.; Pedroni, N.; Zio, E. Identification of protective actions to reduce the vulnerability of safety-critical systems to malevolent acts: A sensitivity-based decision-making approach. Reliab. Eng. Syst. Saf. 2016, 147, 9–18. [Google Scholar] [CrossRef]
- Fesenko, H.; Kharchenko, V.; Zaitseva, E. Evaluating Reliability of a Multi-fleet with a Reserve Drone Fleet: An Approach and Basic Model. In Proceedings of the 2019 International Conference on Information and Digital Technologies (IDT), Zilina, Slovakia, 25–27 June 2019; IEEE: Danvers, MA, USA, 2019; pp. 128–132. [Google Scholar]
- Zhang, L.; Lu, Z.; Wang, P. Efficient structural reliability analysis method based on advanced Kriging model. Appl. Math. Model. 2015, 39, 781–793. [Google Scholar] [CrossRef]
- Mollalo, A.; Rivera, K.M.; Vahedi, B. Artificial Neural Network Modeling of Novel Coronavirus (COVID-19) Incidence Rates across the Continental United States. Int. J. Environ. Res. Public Health 2020, 17, 4204. [Google Scholar] [CrossRef] [PubMed]
- Khan, M.A.; Kim, Y. Cardiac Arrhythmia Disease Classification Using LSTM Deep Learning Approach. Comput. Mater. Contin. 2021, 67, 427–443. [Google Scholar] [CrossRef]
- Mohammed, M.A.; Abdulkareem, K.; Garcia-Zapirain, B.; Mostafa, S.A.; Maashi, M.S.; Al-Waisy, A.S.; Subhi, M.A.; Mutlag, A.A.; Le, D.-N. A Comprehensive Investigation of Machine Learning Feature Extraction and Classification Methods for Automated Diagnosis of COVID-19 Based on X-Ray Images. Comput. Mater. Contin. 2021, 66, 3289–3310. [Google Scholar] [CrossRef]
- Shorten, C.; Khoshgoftaar, T.M.; Furht, B. Deep Learning applications for COVID-19. J. Big Data 2021, 8, 1–54. [Google Scholar] [CrossRef] [PubMed]
- Zeroual, A.; Harrou, F.; Dairi, A.; Sun, Y. Deep learning methods for forecasting COVID-19 time-Series data: A Comparative study. Chaos Solitons Fractals 2020, 140, 110121. [Google Scholar] [CrossRef]
- Singh, C.; Wang, L. Role of artificial intelligence in the reliability evaluation of electric power systems. Turk. J. Electr. Eng. 2008, 16, 189–200. [Google Scholar]
- Zaitseva, E.; Levashenko, V. Reliability analysis of multi-state system with application of multiple-valued logic. Int. J. Qual. Reliab. Manag. 2017, 34, 862–878. [Google Scholar] [CrossRef]


| x1 | f | f | f | f | f | f | f | f | w | w | w | w | w | w | w | w |
| x2 | f | f | f | f | w | w | w | w | f | f | f | f | w | w | w | w |
| x3 | f | f | w | w | f | f | w | w | f | f | w | w | f | f | w | w |
| x4 | f | w | f | w | f | w | f | w | f | w | f | w | f | w | f | w |
| ϕ(ξ) | f | f | f | f | f | f | f | f | f | f | f | w | f | w | w | W |
| ϕ(x) | 0 | 1 |
|---|---|---|
| State vectors | 0000, 0001, 0010, 0011, 0100, 0101, 0110, 0111, 1000, 1001, 1010, 1100 | 1011, 1101, 1110, 1111 |
| x1 | x2 | x3 | x4 | ϕ(x) | |||||
|---|---|---|---|---|---|---|---|---|---|
| 0 | 1 | 0 | 1 | 0 | 1 | 0 | 1 | 0 | 1 |
| 0.5 | 0.5 | 0.9 | 0.1 | 0.7 | 0.3 | 0.7 | 0.3 | 0.7 | 0.3 |
| 0.8 | 0.2 | 0.8 | 0.2 | 0.8 | 0.2 | 0.1 | 0.9 | 0.8 | 0.2 |
| 0.8 | 0.2 | 0.8 | 0.2 | 0.3 | 0.7 | 0.2 | 0.8 | 0.9 | 0.1 |
| 0.9 | 0.1 | 0.2 | 0.8 | 0.8 | 0.2 | 0.9 | 0.1 | 0.8 | 0.2 |
| 0.8 | 0.2 | 0.1 | 0.9 | 0.0 | 1.0 | 0.0 | 1.0 | 0.8 | 0.2 |
| 0.1 | 0.9 | 0.9 | 0.1 | 0.4 | 0.6 | 0.8 | 0.2 | 0.9 | 0.1 |
| 0.0 | 1.0 | 0.8 | 0.2 | 0.8 | 0.2 | 0.0 | 1.0 | 0.7 | 0.3 |
| 0.1 | 0.9 | 0.9 | 0.1 | 0.2 | 0.8 | 0.3 | 0.7 | 0.2 | 0.8 |
| 0.1 | 0.9 | 0.1 | 0.9 | 1.0 | 0.0 | 0.5 | 0.5 | 0.9 | 0.1 |
| 0.1 | 0.9 | 0.0 | 1.0 | 1.0 | 0.0 | 0.0 | 1.0 | 0.1 | 0.9 |
| 0.2 | 0.8 | 0.2 | 0.8 | 0.1 | 0.9 | 0.9 | 0.1 | 0.1 | 0.9 |
| 0.1 | 0.9 | 0.1 | 0.9 | 0.1 | 0.9 | 0.4 | 0.6 | 0.2 | 0.8 |
| A1 | A2 | A3 | A4 | B | Confidence of Class Attribute B |
|---|---|---|---|---|---|
| 0 | 0 | 0 | 0 | 0 | 0.738 |
| 0 | 0 | 0 | 1 | 0 | 0.738 |
| 0 | 0 | 1 | 0 | 0 | 0.738 |
| 0 | 0 | 1 | 1 | 0 | 0.738 |
| 0 | 1 | 0 | 0 | 0 | 0.738 |
| 0 | 1 | 0 | 1 | 0 | 0.738 |
| 0 | 1 | 1 | 0 | 0 | 0.738 |
| 0 | 1 | 1 | 1 | 0 | 0.738 |
| 1 | 0 | 0 | 0 | 0 | 0.707 |
| 1 | 0 | 0 | 1 | 0 | 0.707 |
| 1 | 0 | 1 | 0 | 0 | 0.575 |
| 1 | 0 | 1 | 1 | 1 | 0.528 |
| 1 | 1 | 0 | 0 | 0 | 0.765 |
| 1 | 1 | 0 | 1 | 1 | 0.605 |
| 1 | 1 | 1 | 0 | 1 | 0.655 |
| 1 | 1 | 1 | 1 | 1 | 0.655 |
| x2x3x4 | ∂ϕ(ξ)/∂ξ1 | x1x3x4 | ∂ϕ(ξ)/∂ξ2 | x1x2x4 | ∂ϕ(ξ)/∂ξ3 | x1x2x3 | ∂ϕ(ξ)/∂ξ4 |
|---|---|---|---|---|---|---|---|
| 0 0 0 | 0 | 0 0 0 | 0 | 0 0 0 | 0 | 0 0 0 | 0 |
| 0 0 1 | 0 | 0 0 1 | 0 | 0 0 1 | 0 | 0 0 1 | 0 |
| 0 1 0 | 0 | 0 1 0 | 0 | 0 1 0 | 0 | 0 1 0 | 0 |
| 0 1 1 | 1 | 0 1 1 | 0 | 0 1 1 | 0 | 0 1 1 | 0 |
| 1 0 0 | 0 | 1 0 0 | 0 | 1 0 0 | 0 | 1 0 0 | 0 |
| 1 0 1 | 1 | 1 0 1 | 1 | 1 0 1 | 1 | 1 0 1 | 1 |
| 1 1 0 | 1 | 1 1 0 | 1 | 1 1 0 | 1 | 1 1 0 | 1 |
| 1 1 1 | 1 | 1 1 1 | 0 | 1 1 1 | 0 | 1 1 1 | 0 |
| N1 = 4 | N2 = 2 | N3 = 2 | N4 = 2 | ||||
| SI1 = 0.50 | SI2 = 0.25 | SI3 = 0.25 | SI4 = 0.25 |
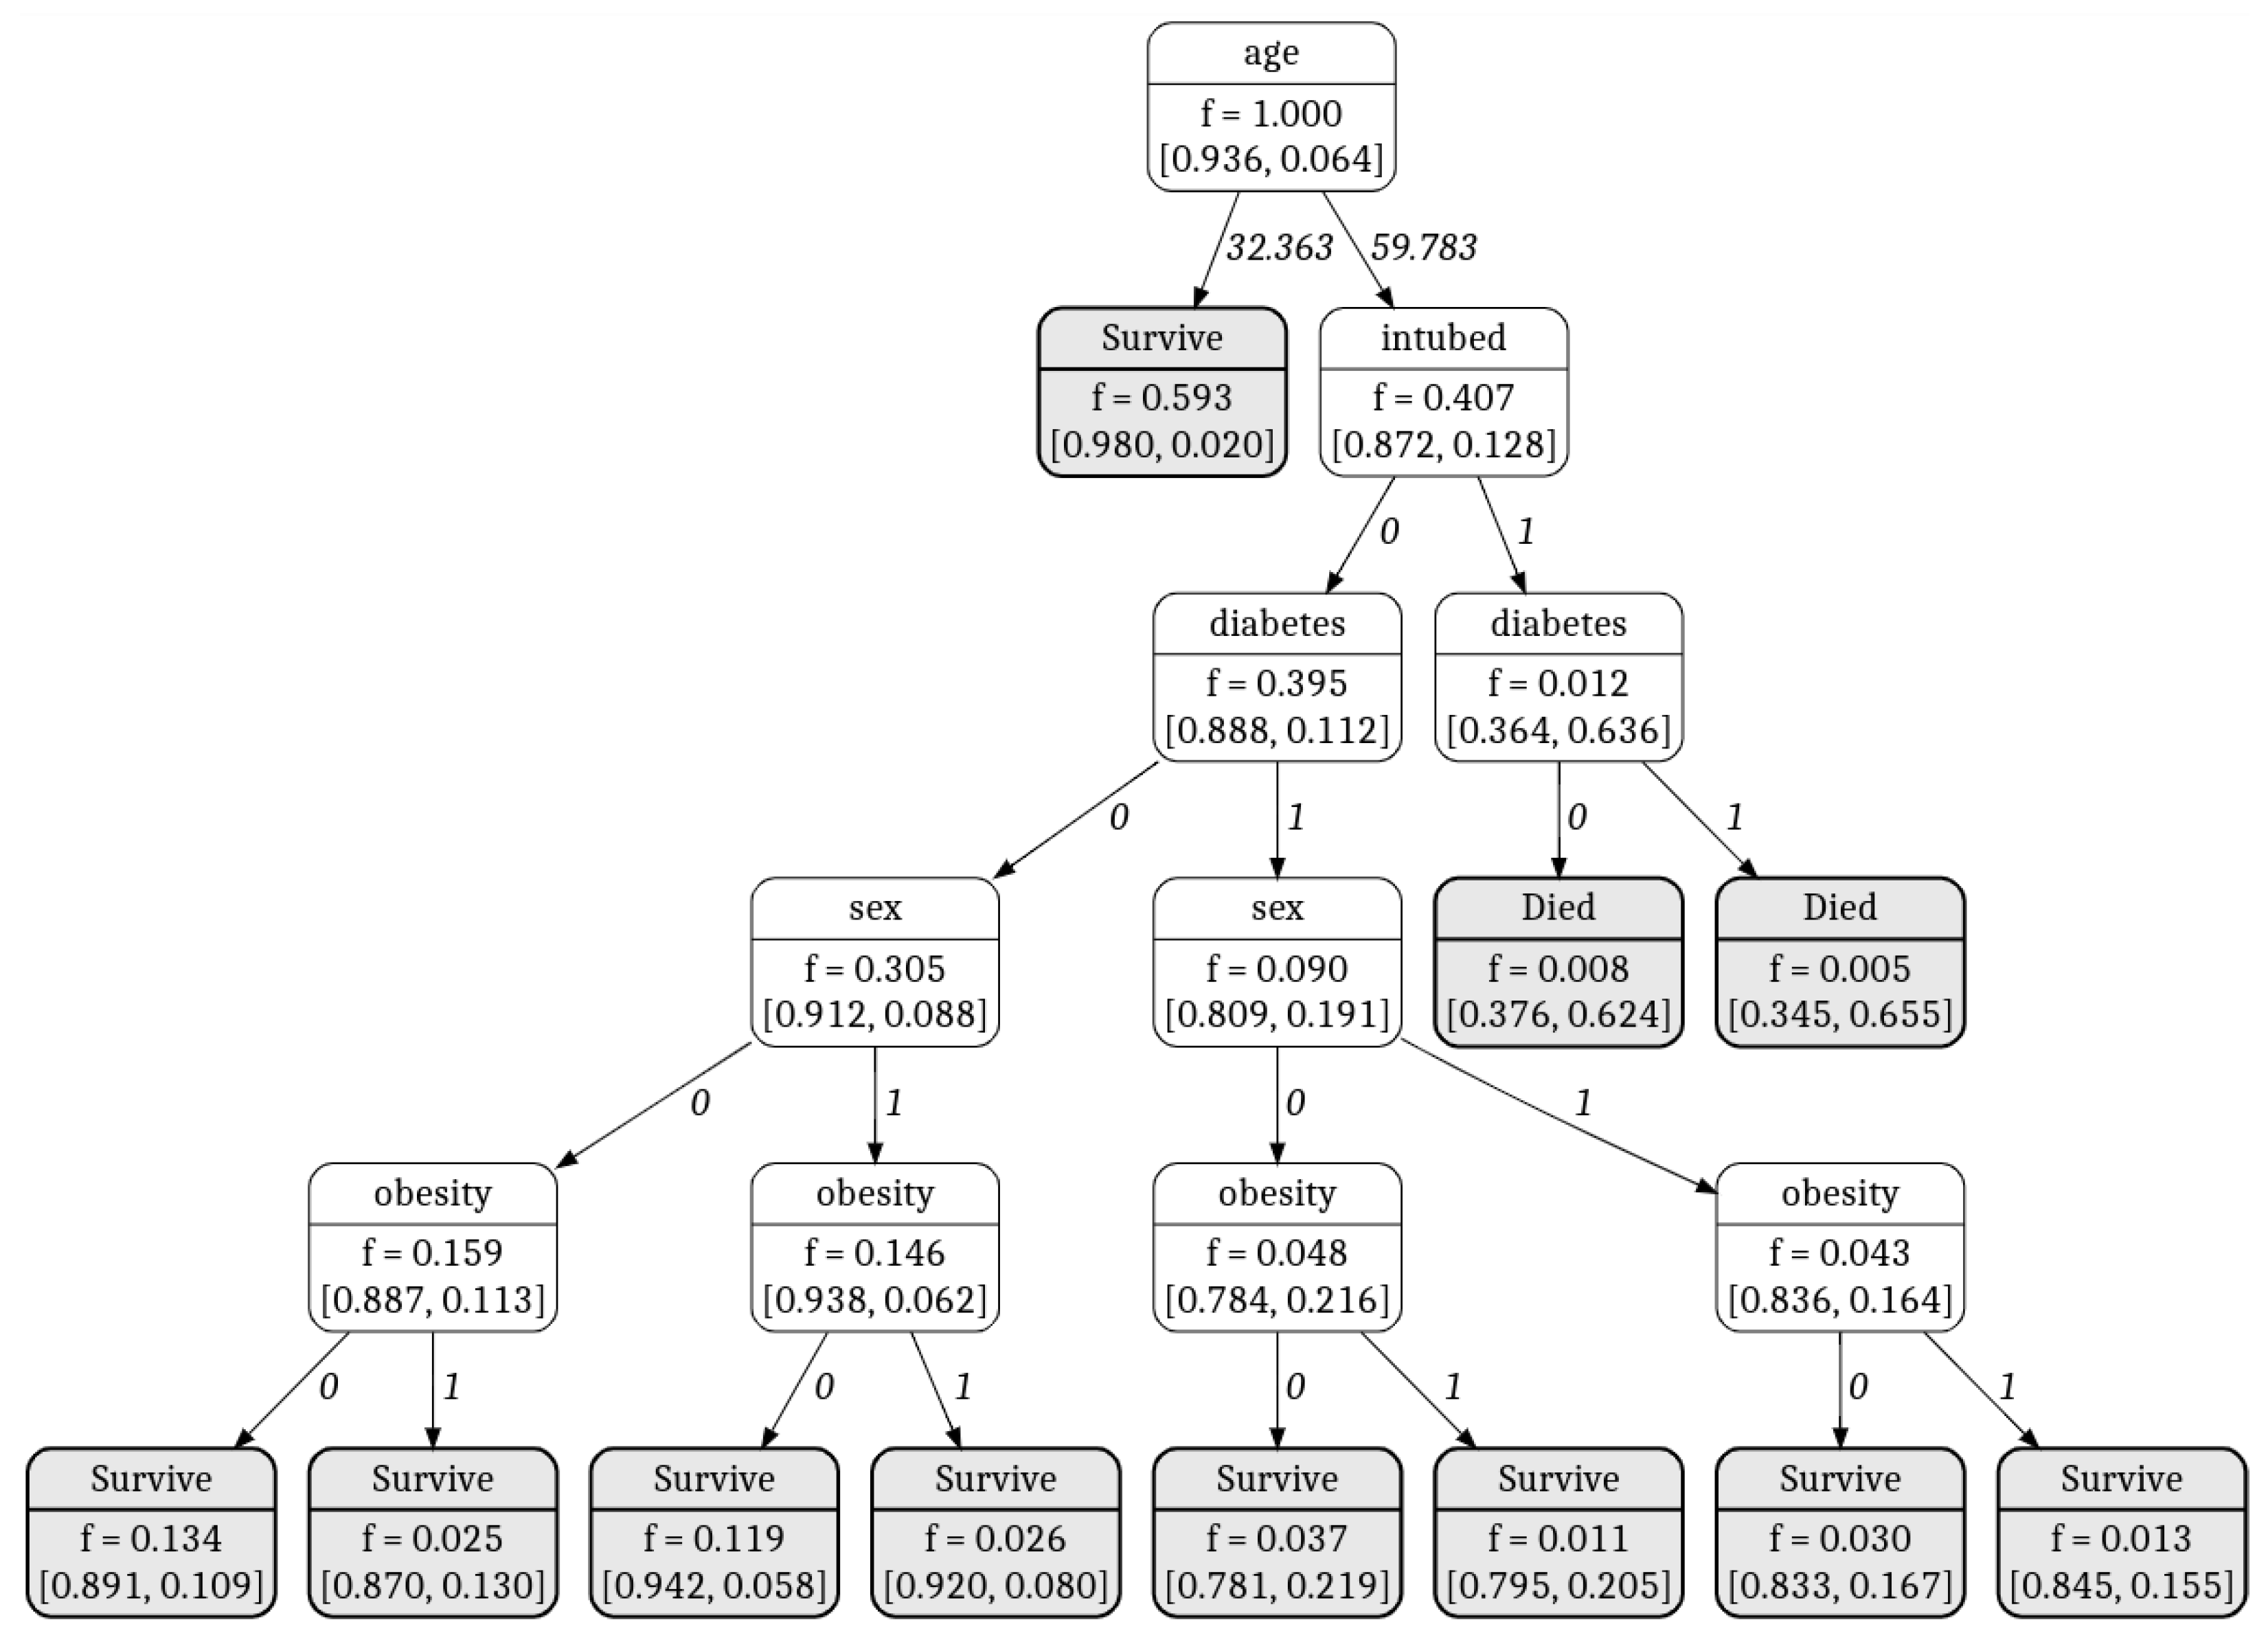
| Attribute | Description |
|---|---|
| Sex (x1) | Identifies the sex of the patient (1—man and 0—female) |
| Intubation (x2) | Identifies if the patient required intubation (1—yes, 0—not) |
| Diabetes (x3) | Identifies if patient suffers from diabetes (1—yes, 0—not) |
| Obesity (x4) | Identifies if patient suffers from obesity (1—yes, 0—not) |
| Age (x5) | Identifies the age of the patient |
| Died (ϕ(x)) | Identifies if patient died (1—not, 0—died) |
| β\α | 0.000 | 0.028 | 0.056 | 0.083 | 0.111 | 0.139 | 0.167 | 0.194 | 0.222 | 0.250 |
|---|---|---|---|---|---|---|---|---|---|---|
| 0.700 | 0.925 | 0.925 | 0.923 | 0.928 | 0.928 | 0.928 | 0.928 | 0.929 | 0.929 | 0.929 |
| 0.733 | 0.931 | 0.931 | 0.930 | 0.932 | 0.933 | 0.933 | 0.934 | 0.934 | 0.935 | 0.934 |
| 0.767 | 0.944 | 0.944 | 0.945 | 0.945 | 0.945 | 0.946 | 0.947 | 0.947 | 0.947 | 0.935 |
| 0.800 | 0.949 | 0.949 | 0.950 | 0.950 | 0.950 | 0.951 | 0.951 | 0.954 | 0.954 | 0.940 |
| 0.833 | 0.949 | 0.949 | 0.950 | 0.950 | 0.950 | 0.950 | 0.951 | 0.951 | 0.954 | 0.940 |
| 0.867 | 0.948 | 0.948 | 0.949 | 0.949 | 0.949 | 0.949 | 0.950 | 0.951 | 0.949 | 0.935 |
| 0.900 | 0.947 | 0.947 | 0.949 | 0.949 | 0.949 | 0.949 | 0.950 | 0.951 | 0.949 | 0.934 |
| 0.933 | 0.947 | 0.947 | 0.949 | 0.949 | 0.949 | 0.949 | 0.950 | 0.951 | 0.949 | 0.933 |
| 0.967 | 0.947 | 0.947 | 0.949 | 0.949 | 0.949 | 0.949 | 0.950 | 0.951 | 0.949 | 0.932 |
| 1.000 | 0.947 | 0.947 | 0.949 | 0.949 | 0.949 | 0.949 | 0.950 | 0.951 | 0.949 | 0.932 |
| Metrics of Classification Result Evaluation | FDT | DT | NB | kNN | Fuzzy Classification Rules | Fuzzy MLP | SVM | Neural Network |
|---|---|---|---|---|---|---|---|---|
| Accuracy | 0.954 | 0.931 | 0.920 | 0.891 | 0.949 | 0.940 | 0.926 | 0.949 |
| Specificity | 0.965 | 0.944 | 0.943 | 0.925 | 0.963 | 0.958 | 0.944 | 0.981 |
| Sensitivity | 0.842 | 0.807 | 0.702 | 0.579 | 0.807 | 0.772 | 0.754 | 0.643 |
| Precision | 0.716 | 0.605 | 0.571 | 0.452 | 0.697 | 0.657 | 0.589 | 0.783 |
| F1 Score | 0.774 | 0.692 | 0.630 | 0.508 | 0.748 | 0.710 | 0.662 | 0.706 |
| x4 x5 | 0 0 | 0 1 | 1 0 | 1 1 | |
|---|---|---|---|---|---|
| x1x2x3 | |||||
| 0 0 0 | 0 | 0 | 0 | 0 | |
| 0 0 1 | 0 | 0 | 0 | 0 | |
| 0 1 0 | 0 | 0 | 0 | 0 | |
| 0 1 1 | 1 | 1 | 1 | 1 | |
| 1 0 0 | 0 | 0 | 0 | 0 | |
| 1 0 1 | 0 | 0 | 0 | 0 | |
| 1 1 0 | 0 | 0 | 0 | 0 | |
| 1 1 1 | 1 | 1 | 1 | 1 | |
Publisher’s Note: MDPI stays neutral with regard to jurisdictional claims in published maps and institutional affiliations. |
© 2021 by the authors. Licensee MDPI, Basel, Switzerland. This article is an open access article distributed under the terms and conditions of the Creative Commons Attribution (CC BY) license (http://creativecommons.org/licenses/by/4.0/).
Share and Cite
Levashenko, V.; Rabcan, J.; Zaitseva, E. Reliability Evaluation of the Factors That Influenced COVID-19 Patients’ Condition. Appl. Sci. 2021, 11, 2589. https://doi.org/10.3390/app11062589
Levashenko V, Rabcan J, Zaitseva E. Reliability Evaluation of the Factors That Influenced COVID-19 Patients’ Condition. Applied Sciences. 2021; 11(6):2589. https://doi.org/10.3390/app11062589
Chicago/Turabian StyleLevashenko, Vitaly, Jan Rabcan, and Elena Zaitseva. 2021. "Reliability Evaluation of the Factors That Influenced COVID-19 Patients’ Condition" Applied Sciences 11, no. 6: 2589. https://doi.org/10.3390/app11062589
APA StyleLevashenko, V., Rabcan, J., & Zaitseva, E. (2021). Reliability Evaluation of the Factors That Influenced COVID-19 Patients’ Condition. Applied Sciences, 11(6), 2589. https://doi.org/10.3390/app11062589