Article

Robot-Touch Promotes Memory Sensitization

Advanced Telecommunications Research Institute International (ATR), Kyoto 619-0237, Japan
Appl. Sci. 2021, 11(5), 2271; https://doi.org/10.3390/app11052271
Submission received: 29 January 2021 / Revised: 1 March 2021 / Accepted: 2 March 2021 / Published: 4 March 2021
(This article belongs to the Special Issue State-of-the-Art in Human Factors and Interaction Design)

Abstract

:
Research show that we are more skeptical of the machines than fellow humans. They also find that we are reluctant to change this perception in spite of the possibility for increased efficiency through cooperative engagement with them. However, these findings that primarily focused on algorithmic agents may not readily be attributable to the case of robots. To fill this gap, the present study investigated whether the background information about the level of autonomy of a robot would have any effect on its perception by individuals whom it made a physical contact with. For this purpose, we conducted an experiment in which a robot-arm touched the left arm of thirty young Japanese adults (fifteen females, age: 22 ± 1.64) in two trials. While the robot was autonomous in both trials, we told our participants that in one of their trials the robot was controlled by a human operator while in the other the robot moved autonomously. We observed that the previous findings on soft agents extended to the case of robots in that participants significantly preferred their trial that was supposedly operated by a human. More importantly, we identified a memory sensitization with respect to the trial-order in which participants preferred their first trial, regardless of whether it was a robot- or a supposedly human-controlled scenario. As a type of nondeclarative memory that contributes to nonassociative learning, the observed memory sensitization highlighted participants’ growing perceptual distance to the robot-touch that was primarily triggered by the unconscious learning-component of their physical contact with the robot. The present findings substantiate the necessity for more in-depth and socially situated study and analysis of these new generation of our tools to better comprehend the extent of their (dis)advantages to more effectively introduce them to our society.

1. Introduction

While not uniquely human [1,2,3,4], tool-use has undoubtedly played a crucial role in our survival and the societal and technological advances that followed. Although it is still not fully understood why humans are the only species in the animal kingdom with the ability to expand their boundaries through the use of tools [5,6,7], it is not far-fetched if one claims that our future existence (and perhaps evolution) is not only inseparable from but also highly dependent on our tools and our capacity for their further advancement.
An intriguing aspect of the relation between us and our tools is the observation that they are not mere passive outcomes of our imagination in response to our mundane needs and necessities but actively reshape our perception about ourselves and the world about us: it was just a minuscule step in an evolutionary timescale to discard our flawed anthropocentric view of the universe once we had the telescope in our disposal and the epileptic seizures were no longer under demonic commands after our tools allowed us to observe the brain in action. We improve our lives by advancing our tools and they redefine us through this process
On this trajectory, robotics has certainly been an exciting development. From their industrial use [8,9] and the potential for expanding the horizon of our physical presence in the universe [10] to their ever increasing utility in medicine [11] and rehabilitation [12,13], robots present powerful tools for broadening our knowledge and improving the quality of our life. In this respect, the advent of social (assistive) robots [14] is a pivotal point. Over the past decade, the use of these machines have provided evidence for their utility in the solution concept of variety of domains that range from increasing the quality of child health-care [15,16] and early childhood education [17] to assisting the elderly care facilities [18,19].
Despite these exciting developments, further scrutiny of machines’ perception by the humans depicts a challenging scenario. For instance, research suggests that people are more skeptical of the machines than other fellow humans in a wide variety of contexts that ranges from trustworthiness [20] and cooperation [21] to intelligence [22] and health-care advice [23,24]. Furthermore, it demonstrates that [25] people are reluctant to change/refine their perception once they learn about the identity of their non-human partners, in spite of the possibility for harnessing better cooperation and more efficiency. In fact, these observations were foreseen by Gray and colleagues [26] who showed how people distinctively distinguished between livings and non-livings (including such animated objects as robots) in the mind’s dimensions.
However, it is plausible to argue that these previous studies primarily focused on algorithmic agents and therefore their results may not readily be attributable to the case of robots (Ishowo-Oloko et al. [25] (pp. 519–520)). Indeed, this line of argument is apparent in the implausible anthropomorphization of these tools [27,28,29], some going as far as bestowing a soul on their product [30,31] and their capacity for spiritual guidance [32].
The present study sought to investigate the extent of applicability of these previous findings on humans’ perception of algorithmic agents [20,21,22,23,24,25] to the case of human–robot physical contact. For this purpose, we conducted an experiment in which a robot-arm touched participants’ left arm in two trials. In both of these trials, per participant, the robot motion was based on exact same autonomous motion-generator program. However, we told participants that in one of their trials (at random) the robot-arm was controlled by a human operator (hereafter, (sham) human-controlled) while in the other it was autonomous (hereafter, robot-controlled). In the case of (sham) human-controlled, we also told half of the participants (at random) that a female operator controlled the arm.
Although the setup adapted in the present study was far from a true social interaction scenario, it allowed us to probe whether a minor change in identity of the acting agent could influence individuals’ perception and judgment of its naturalness, safety, comfortability, and trustworthiness in their two trials that were otherwise identical in all other aspects.

2. Materials and Methods

2.1. Participants

The experiment included thirty young Japanese adults (fifteen females, age: Mean (M): 22, standard deviation (SD): 1.64). Participants were not limited to university students and came from different occupational background. We used a local recruiting service to hire the participants for this experiment.

2.2. Robot-Arm

We used a single-arm KINOVA TM KG-2 [33] that was equipped with a two-finger gripper end-effector. For safety considerations, we securely covered this gripper with a soft fabric. The robot-arm was mounted on a table that was one meter high and forty cm wide. On the side of this table, we placed a stand with a safety switch on it. This switch that was within participants’ reach allowed them to switch off the robot-arm in case they felt uncomfortable continuing with their trial.
The robot-arm was located in an approximately thirty cm distance from participants’ chest. Depending on participants’ height, we occasionally used a cubic stand of size 20 × 20 × 10 cm 3 (length, width, and height) to adjust for their height with respect to the robot-arm.

2.3. Experimental Setup

It comprised two trials, per participant (Figure 1). In one trial, participants were told that the robot was autonomous (i.e., robot-controlled trial). In the other trial, they were told that it was controlled by a human operator (i.e., (sham) human-controlled trial). In reality, the robot-arm was autonomous in both trials. In other words, there was no human controller involved (hence the prefix “sham” in (sham) human-controlled trial). We used exact same primitive motion script whose steps and order of execution were fixed in both trials. This script was prepared using “MoveIt” framework on “ROS Melodic” in Python 2.7.
We divided the participants into two groups at random. Participants in Group 1 (fifteen participants, seven females) started their experiment (i.e., their first trial) with the robot-controlled trial. In the case of group 2 (fifteen participants, eight females), trials’ order was reversed. Of all thirty participants, half of them (at random, eight females) were told that the robot-operator during their (sham) human-controlled trial was female.
Each trial consisted of three physical contacts with participants’ left arm. The order of these three physical contacts was fixed for all participants and in both robot- and (sham) human-controlled trials.
In the first physical contact, the robot-arm moved from its resting position (about the chest of participants) and approached the participants’ left arm (below their elbow and closer to their wrist). It then moved downward and toward their hand, touching their arm all the way, until it reached below their wrist. It then slowly turned its gripper’s wrist upward for forty-five degree, as if it was holding the participants’ hand in its gripper end-effector’s palm. It then repeated this sequence in reverse, thereby moving back to its resting position.
In the second physical contact, the robot-arm again moved from its resting position and toward participants’ left shoulder. It then moved downward (while keeping contact with their left arm) from their shoulder to their elbow. It then repeated this sequence in reverse, thereby moving back to its resting position.
In the third (i.e., last) physical contact, the robot-arm again moved from its resting position, approaching the participants’ left arm approximately midway between their elbow and their shoulder. Once in this position, It gently pushed the participants for five degree side-wise. It then repeated this sequence in reverse, thereby moving back to its resting position.
These three physical contacts were performed sequentially in the above order, with no time-gap between them, and within the same trial, per participant, per robot- and (sham) human-controlled trials. Each trial lasted for 1.42 min.

2.3.1. Personality Traits

Prior to the start of the experiment, we asked participants to fill their responses to a personality traits questionnaire. We used the Japanese version (TIPI-J [34]) of the big-five of Personality [35] (a.k.a five-factor-model (FFM)). It comprised two questions for each of the five personality traits (i.e., neuroticism, extraversion, openness to experience, agreeableness, and conscientiousness). TIPI-J uses a seven-point Likert scale that ranges from 1 (strong denial) to 7 (strong approval). All participants filled their responses to these ten questions prior to ten-minute rest period that took place before the start of their first trial (Figure 1).

2.3.2. Saliva Samples

To determine the potential effect of the trials on participants’ physiological responses, we also collected four saliva samples (Figure 1) from every individual (2.0 mL of saliva sample, per participant, per sample, in a standard 2.0 mL eppendorf tube). We used these samples to analyze the potential change in the level of cortisol in participants’ saliva in response to their physical contact with the robot-arm during the experiment. The use of salivary cortisol to verify if different robot-physical-contact scenarios could induce different degree of stress response in human subjects was motivated by previous studies such as Turner-Cobb et al. [36] who showed its utility for evaluating individuals’ stress reactivity and adaptation during their (social) interaction with robots.
We collected the participants’ first saliva sample right before the start of their first trial. We then collected the second saliva sample, per participant, immediately after they finished their first trial. Similarly, we collected the third and the fourth samples, per participant, right before the start of their second trial and immediately after their second trial was over.
All participants took two ten-minute rests: one prior to the start of the first trial and one after collecting their second saliva sample and before participating in their second trial. After collecting their fourth saliva sample at the end of their second trial, we asked participants to respond to our experiment-specific questionnaire.

2.3.3. Questionnaire

To assess participants’ perception of their physical contacts with the robot-arm, we designed a five-item questionnaire. We presented the first four items of this questionnaire in a written form to participants. On the other hand, we asked the last item verbally and in an informal way. This last item was asked when participants were leaving the facility (i.e., when they thought their experiment was finished). Neither the experiment assistant nor the participants were aware of the purpose of this last item. The experiment assistant was told that it was meant for experimenter’s piece of mind (vindication of the experiment’s success) and was requested to communicate it to participants in a casual manner and while guiding them to the facility’s elevator for their departure. In what follows, we elaborate on the content of this questionnaire.
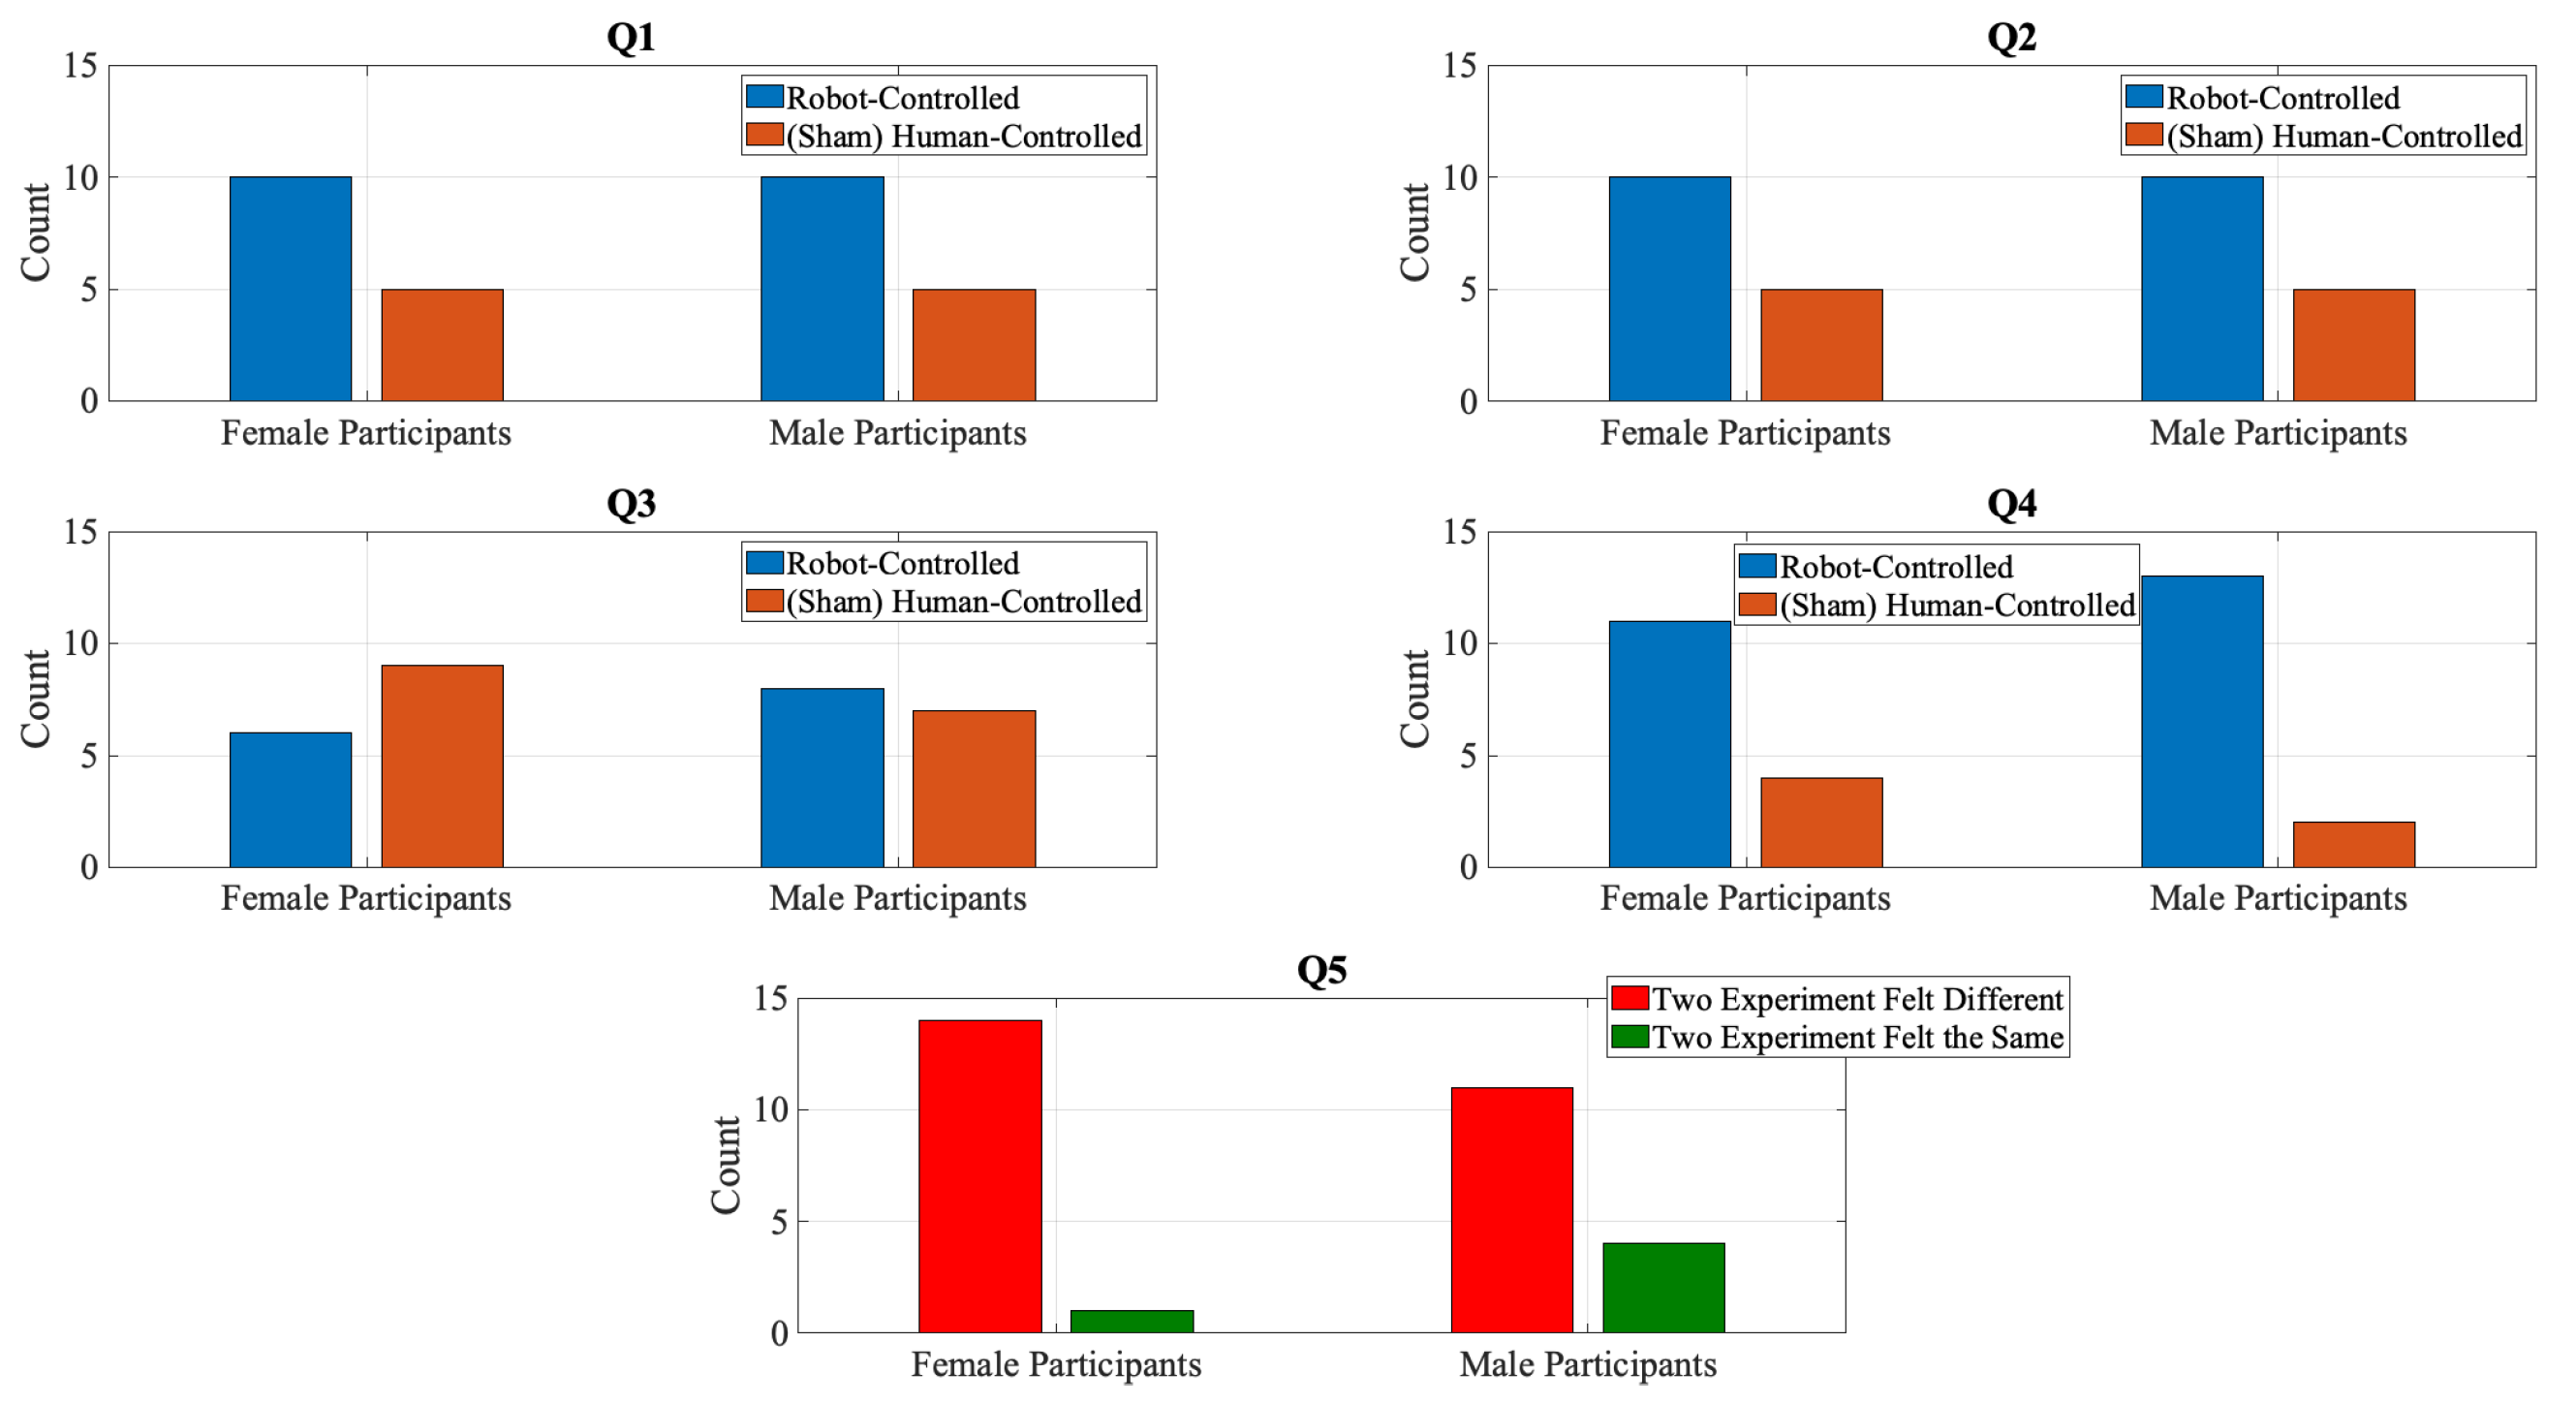
  • Four-Item Written Questionnaire: After collecting their fourth saliva sample at the end of their second trial, we asked participants to fill in their responses to a written questionnaire (in Japanese). It comprised four items, each with a binary response. These four items were:
    (a)
    The robot-arm moved more naturally (Q1)
    (b)
    I felt safer (Q2)
    (c)
    I felt more comfortable with the robot-arm touching me (Q3)
    (d)
    I can trust a touch by a robot (Q4)
    The participants responded to each of Q1 through Q4 using the same binary-response protocol:
    (a)
    when it was controlled by the robot
    (b)
    when it was controlled by a human
  • Fifth Item Verbal Questionnaire: This item was verbally communicated with participants as they were on their way to leave the facility. Specifically, the experiment assistant asked the participants (as she was guiding them to the elevator) if they felt that their two trials (i.e., robot- and the (sham) human-controlled) were the same. We then recorded these responses as fifth questionnaire item (i.e., Q5).

2.4. Procedure

Upon their arrival, participants were greeted and guided to the experiment room by experiment assistant (female, in her thirties, who was not aware of the purpose of this experiment). The experiment room was partitioned into two sections: the front section (approximately 4 × 5 m 2 ) and the back section (which the participants could not see) where the computer that controlled the robot-arm motion was placed. Throughout the experiment, per participant, an experimenter (male, in their forties) was present in this back side. He ran the robot-arm motion script on its computer. The participants were not aware of the experimenter’s presence in the experiment room.
The front side of the experiment room was further divided into two sections. The first section (approximately 4 × 3 m 2 ) directly faced the entry to experiment room. Participants sat in this part of the experiment room when, for example, resting, signing the consent form, or collecting their saliva samples. The second section (approximately 4 × 2 m 2 ) contained the robot-arm setting. The trials took place in this section. Participants saw this section of the experiment room for the first time when they attended their first trial. At the corner of this section, we placed a camera and recorded all participants’ trials. Every participant was informed about the purpose of this camera (i.e., recording the trials) and the fact that we were video-recording their trials. All participants agreed with the video-recording of their trials.
Prior to the start of the experiment, the experiment assistant walked the participants through the entire experiment’s procedure. First, she informed the participants that their experiment would last for about an hour. She then told them that during this period they would participate in two trials of approximately 1.42 min each. She also informed them that both of these trials would comprise the same three types of physical contacts (Section 2.3) on their left arm whose order would remain unchanged between the two trials. Next, she explained what types of physical contacts would be performed by the robot-arm on their left arm. Then, she told the participants that one of these trials would be based on autonomous robot-arm motion in which the robot would control its own movement (i.e., robot-controlled trial) and that in the other trial the robot-arm motion would be controlled by a human operator (i.e., (sham) human-controlled trial). She then informed the participants that each of these two trials would involve two sets of saliva sampling: one immediately before and the other immediately after each trial. She also showed them the saliva sampling toolkit (Super•SAL TM Universal Saliva Collection Kit) and helped them familiarize themselves with it. The experiment assistant then waited until the participants confirmed that they understood how to use the saliva sampling toolkit and they felt comfortable with using it. Last, the experiment assistant told the participants that their experiment would end by completing a four-item questionnaire that would ask about their personal experience in their two trials. However, she did not provide any further information about the type/nature of the questionnaire’s items.
Next, the experiment assistant confirmed that the participants fully understood the procedure and whether there was any further information that they might want to enquire about. Once the participants confirmed that they fully understood the procedure and that they felt comfortable with participating in the experiment, the experiment assistant asked them to sign a written consent form.
After they signed their written consent form, the experiment assistant asked them to fill in their responses to ten-item personality traits questionnaire (Section 2.3.1) which was followed by a ten-minute resting period. At the end of this resting period, the experiment assistant gave the participants their respective saliva sampling toolkit and requested them to collect their first saliva sample. She then guided the participants to the robot-arm section of the experiment room. She explained the setting to the participants and let them familiarize themselves with the setting. She also ensured that the participants fully understood about how the robot-arm would approach them, what sequence of physical contacts it would perform on their left arm, and how the participants would be able to interrupt the trial (at any point during the trial that is) if they felt uncomfortable and/or lost their interest/trust in continuing with their trial/experiment. At this point, the experiment assistant also revealed to the participants whether their trials would start with the robot- or (sham) human-controlled trial. She also told the participants about the gender of the supposedly human operator of the robot-arm during their (sham) human-controlled trial.
Next, the participants completed the first trial which was immediately followed by collecting their second saliva sample (outside the robot-arm section). The experiment assistant then gave the participants a ten-minute resting period before starting their second trial. After this ten-minute rest, the participants were instructed to collect their third saliva sample, guided back to the robot-arm section of the experiment room, and completed their second trial. This was immediately followed by collecting their fourth (i.e., last) saliva sample. Last, the participants filled in their responses to the four-item written questionnaire (i.e., Q1 through Q4, Section 2.3.3).
Participants were then informed that their experiment was finished and were compensated with a sum of 3000 YEN for their time, as per the experiment’s arrangement. The experiment assistant then guided the participants to the elevator. At this point, she asked the participants whether their two trials (i.e., robot- and the (sham) human-controlled) felt the same (i.e., the verbal, fifth questionnaire item, Q5, Section 2.3.3). The entire experiment, per participant, took about an hour to complete.

2.5. Analysis

In what follows, we outline the analysis steps. In so doing, we divide them into two categories: (1) main analyses in which we highlight the analyses whose results are reported in the main manuscript (2) supplementary analyses in which we elaborate on additional analyses that are included in the accompanying Appendix A, Appendix B and Appendix C.

2.5.1. Main Analyses

First, we checked whether participants’ responses were consistent between the two genders. For this purpose, we formed four 2 × 2 contingency tables (one per Q1 through Q4) where the entries of each table corresponded to the gender and the counts of participants’ preference between (sham) human- or robot-controlled trial in each of Q1 through Q4. We then applied χ 2 tests on these tables to examine whether participants’ gender had a significant effect on their responses.
Next, we determined whether any of the experiment’s design factors had a significant effect on participants’ responses to Q1 through Q5. These factors were the order of the two trials (i.e., whether the (sham) human- or robot-controlled trial was carried out first), supposed gender of the operator in (sham) human-controlled trial, and the interaction between these two factors. We then adapted a general linear model (GLM) [37] approach. The inputs to GLM were the two experiment’s factors and their interaction (i.e., an N × 3 matrix where N = 30 denotes the number of participants). The output from GLM was the participants’ responses to Q1 through Q5. This resulted in five separate tests, one per questionnaire’s item. For each of these models, we used their corresponding coefficients (i.e., models’ weights) and applied ANOVA on them to determine whether any of the two experiment’s design factors and/or their interaction had a significant effect on participants’ responses.
We then examined participants’ overall preference between (sham) human- and robot-controlled trials. To this end, we counted the total number of times that each participant responded by selecting “when it was controlled by the robot” versus “when it was controlled by the human” to Q1 through Q4 (i.e., collectively). We then performed a bootstrap (10,000 simulation runs) test (i.e., random sampling with replacement) on the difference between these counts (i.e., count((sham) human-controlled)-count(robot-controlled)) at 99.0% confidence interval (CI) (i.e., p < 0.01 significance level). We then considered the following null hypothesis.
Hypothesis 1 (H1).
The difference between the number of times that participants preferred (sham) human-controlled versus robot-controlled was non-significant.
We tested Hypothesis 1 against the following alternative hypothesis.
Hypothesis 2 (H2).
Participants preferred (sham) human-controlled trial significantly differently from robot-controlled trial.
The choice of 99.0% CI resulted in p < 0.01 significant level. In this respect, a 99.0% CI that did not contain zero would confirm a significant difference between these preferences at p < 0.01. Furthermore, the average value associated with this CI (i.e., mean[count((sham) human-controlled)-count(robot-controlled)]) would indicate which trial the participants’ preferences were significantly inclined to. Precisely, the average value > 0.0 would indicate a significant inclination of participants’ preferences toward (sham) human-controlled (i.e., with respect to the order of subtraction count((sham) human-controlled)-count(robot-controlled)). On the other hand, it would identify the opposite (i.e., robot-controlled preferences) if this average value < 0.0.
We also applied this bootstrap (10,000 simulation runs) test of significant difference at 99.0% CI (i.e., p < 0.01) on participants’ responses to Q5. For this test, we considered the following null hypothesis.
Hypothesis 3 (H3).
Participants perceived (sham) human- and robot-controlled trials were the same.
We tested Hypothesis 3 against the following alternative hypothesis.
Hypothesis 4 (H4).
Participants perceived the two trials were significantly different.
This test allowed us to verify whether participants realized the two trials were based on the same robot-arm motion controller or they mentally construed them differently. Similar to the case of Q1 through Q4, a 99.0% CI that did not include zero would indicate that participants perceived the two trials significantly different (p < 0.01). Furthermore, the average (i.e., mean[(count(two trials perceived differently)-count(two trials perceived the same)]) > 0.0 at 99.0% CI would indicate that a significantly (i.e., p < 0.01) larger proportion of participants did not perceive the two trials were carried out using the same underlying robot-arm motion control.
Additionally, we considered the ratio of each individual’s preference between (sham) human- versus robot-controlled trials. For this purpose, we first computed each individual’s (sham) human-controlled and robot-controlled ratios as n u m b e r o f t i m e s ( s h a m ) h u m a n c o n t r o l l e d s e l e c t e d t o t a l n u m b e r o f r e s p o n s e s and n u m b e r o f t i m e s r o b o t c o n t r o l l e d s e l e c t e d t o t a l n u m b e r o f r e s p o n s e s , respectively. For each of these ratios (i.e., separately), we then calculated its bootstrapped (10,000 simulation runs) average response at 99.0% CI (i.e., random sampling with replacement). We considered the following null hypothesis.
Hypothesis 5 (H5).
Participants’ preference for (sham) human-/robot-controlled trial was at chance level.
We tested Hypothesis 5 against the following alternative hypothesis.
Hypothesis 6 (H6).
Participants’ preference for (sham) human-/robot-controlled trial significantly differed from chance level.
In the case of these tests, the 99.0% CI that did not include 0.5 would indicate a significant difference from chance at p < 0.01. Furthermore, participants’ preference would be significantly above chance if the average preference associated with 99.0% CI > 0.5.
Last, we examined the effect of (sham) human- and robot-controlled trials on participants’ physiological responses by analyzing the change in the cortisol level in their saliva samples. For this purpose, we first subtracted the participants’ cortisol levels that were sampled prior to their trials (one per robot- and (sham) human-controlled trials) from their cortisol levels that were sampled immediately after their trials were finished. We then performed Lilliefors test with Monte Carlo approximation (95.0% CI or equivalently p < 0.05 significant level) to determine whether participants’ cortisol data followed a normal distribution. This test did not reject the hypothesis that the change in participants’ cortisol levels was normally distributed (p = 0.2837, kstats = 0.09, critical value = 0.11). Therefore, we applied a parametric three-factor (participants’ gender × (sham) operator’s gender × trials’ order) ANOVA.
This test indicated non-significant effects of participants’ gender, operator’s gender, and their interactions (with one another as well as with respect to trail’s order). Given these observations, we discarded the participants’ gender and formed two sets of change in cortisol level: one that comprised all participants’ robot-controlled trial and the other that corresponded to their (sham) human-controlled trial. We then performed a two-sample t-test on these two sets.

2.5.2. Supplementary Analyses

We also examined whether participants’ personality traits had significant effects on their responses to Q1 through Q5 using GLM analysis. The input to GLM was an N × 11 matrix where N = 30 refers to the number of participants and 11 is the participants’ gender, their responses to five items of the personality traits (i.e., neuroticism, extraversion, openness to experience, agreeableness, and conscientiousness), and the interaction between the participants’ gender and their responses to each of these five items. The output from GLM was participants’ responses to Q1 through Q5 (i.e., five models, one per Q1 through Q5). For each of these models, we used their corresponding coefficients (i.e., models’ weights) and applied ANOVA on them to determine whether any of the input factors (i.e., gender, personality traits, and/or the interaction between gender and these traits) had a significant effect on participants’ responses to Q1 through Q5. We presented these results in Appendix A.
Additionally, we reported the results of pairwise Spearman correlations between participants’ responses to the personality traits questionnaire in Appendix B.
Last, we reported the results of Kendall correlations between these personality traits and the participants’ responses to Q1 through Q5 in Appendix C.

2.6. Reported Effect-Sizes

In the case of χ 2 tests, we used “chi.test” from R 3.6.2. We reported the effect size ϕ = χ 2 N [38] where N denotes the sample size. This effect-size is considered [39] small if ϕ 0.1, medium when ϕ 0.3, and large when ϕ 0.5.
For GLM analyses, we used “fitlm” function and its accompanying “anova” in Matlab 2016a. In the case of ANOVA analyses, we reported η 2 effect-size. This effect is considered [39] small when η 2 0.01, medium when 0.06 η 2 , and large when η 2 0.14.
For two-sample t-test, we reported r = t 2 t 2 + d f w i t h i n as effect size [40] where t and d f w i t h i n are test-statistics and degrees of freedom for the test-statistic (N-2, with N referring to the sample size).
For all results, an uncorrected p-value of 0.05 3 = 0.0167 0.017 in which 3 corresponded to the Bonferroni correction for three robot-arm motion control conditions (i.e., one robot-controlled and two female/male (sham) human-controlled) was considered significant.

3. Results

3.1. Consistency of the Participants’ Responses to Q1 through Q5

We observed non-significant differences between responses of female and male participants to Q1 (Figure 2 Q1, χ 2 = 0.0, p = 1.0, ϕ = 0.0), Q2 (Figure 2 Q2, χ 2 = 0.0, p = 1.0, ϕ = 0.0), Q3 (Figure 2 Q3, χ 2 = 0.14, p = 0.714, ϕ = 0.07), Q4 (Figure 2 Q4, χ 2 = 0.21, p = 0.648, ϕ = 0.08), and Q5 (Figure 2 Q5, χ 2 = 0.96, p = 0.327, ϕ = 0.18).

3.2. Effect of Experiment’s Design Factors on Participants’ Responses to Q1 through Q5

Table 1 summarizes the results of GLM on the effect of experiment’s design factors (i.e., trials’ order and operator’s gender in the case of (sham) human-controlled trial) and their interaction on participants’ responses to Q1 through Q5.
In the case of Q1, it identified a significant effect of operator’s gender (F = 4.60, p = 0.041, η 2 = 0.15) that did not survive the Bonferroni correction. On the other hand, this analysis identified non-significant effect of trial-order (F = 0.0, p = 1.0, η 2 = 0.0) and the interaction between these factors (F = 0.14, p = 0.708, η 2 = 0.005).
For Q2, we found non-significant effects of operator’s gender (F = 1.84, p = 0.186, η 2 = 0.06), trial-order (F = 0.07, p = 0.788, η 2 = 0.002), and their interaction (F = 3.68, p = 0.065, η 2 = 0.11) on participants’ response.
In the case of Q3, we observed a non-significant effect of operator’s gender (F = 0.08, p = 0.773, η 2 = 0.0002), a significant effect of trial-order (F = 10.24, p = 0.003 η 2 = 0.27), and a non-significant interaction between these factors (F = 0.17, p = 0.684, η 2 = 0.005). Additionally, the follow-up posthoc χ 2 test on the significant effect of trial-order identified (Figure 3) that the participants significantly ( χ 2 = 6.56, p = 0.010, ϕ = 0.47) preferred (Figure 3) their first trial (i.e., regardless of whether it was a robot- or (sham) human-controlled trial) while responding to Q3 (i.e., “I felt more comfortable with the robot-arm touching me”).
With respect to Q4, we found non-significant effects of operator’s gender (F = 0.55, p = 0.463, η 2 = 0.02), trial-order (F = 0.06, p = 0.806, η 2 = 0.002), and their interaction (F = 0.12, p = 0.728, η 2 = 0.004).
Last, participants’ responses to Q5 was not affected by the operator’s gender (F = 0.25, p = 0.623, η 2 = 0.009), trial-order (F = 0.25, p = 0.622, η 2 = 0.009), and the interaction between these factors (F = 0.50, p = 0.488, η 2 = 0.02).

3.3. Participants’ Overall Preference between (Sham) Human- and Robot-Controlled Trials

3.3.1. Q1 through Q4

We observed that the bootstrap (10,000 simulation runs, Figure 4, left subplot) test at 99.0% CI (i.e., p < 0.01) on count((sham) human-controlled)-count(robot-controlled) did not contain zero (Figure 4, right subplot). This observation supported the alternative hypothesis H2, indicating that the participants’ preferences between their two trials differed significantly. In addition, the average value associated with this test (i.e., mean[count((sham) human-controlled)-count(robot-controlled)], Figure 4, right subplot) was > 0.0. This indicated that participants significantly preferred the (sham) human-controlled over the robot-controlled trials.

3.3.2. Q5

The bootstrap (10,000 simulation runs) test at 99.0% CI (i.e., p < 0.01, Figure 4B, left subplot) supported the alternative hypothesis H4 that the participants perceived the two trials were significantly different. Furthermore, the average value associated with this test (i.e., p < 0.01, Figure 4B, right subplot) was > 0.0. This showed that, on average (i.e., mean[count(two trials perceived differently)-count(two trials perceived to be the same)])), a significantly (i.e., p < 0.01) larger proportion of participants perceived the two trials were not carried out using the same underlying robot-arm motion controller.

3.4. Ratio of Preferences between (Sham) Human- Versus Robot-Controlled Trials

The 99.0% CI (i.e., p < 0.01) of the bootstrapped (10,000 simulation runs) test supported the alternative hypothesis H6 that the participants’ preference for (sham) human-/robot-controlled trials significantly differed from the chance level. For both trials (i.e., (sham) human- and robot-controlled), we observed that (Figure 5) their respective CIs did not include 0.5, thereby indicating their significant differences from chance at p < 0.01. Furthermore, participants’ preference was significantly above chance in the case of (sham) human-controlled (Figure 5A) trial (M = 0.66, SD = 0.05, CI = [0.53 0.79]). On the other hand, their preference was significantly below chance in the case of robot-controlled (Figure 5B) trial (M = 0.34, SD = 0.05, CI = [0.22 0.48]). These results verified that the observed significant differences between (sham) human- and robot-controlled trials (Section 3.3) were not due to the chance. Precisely, participants preferred the (sham) human-controlled trial over the robot-controlled trial with a significantly higher rate.

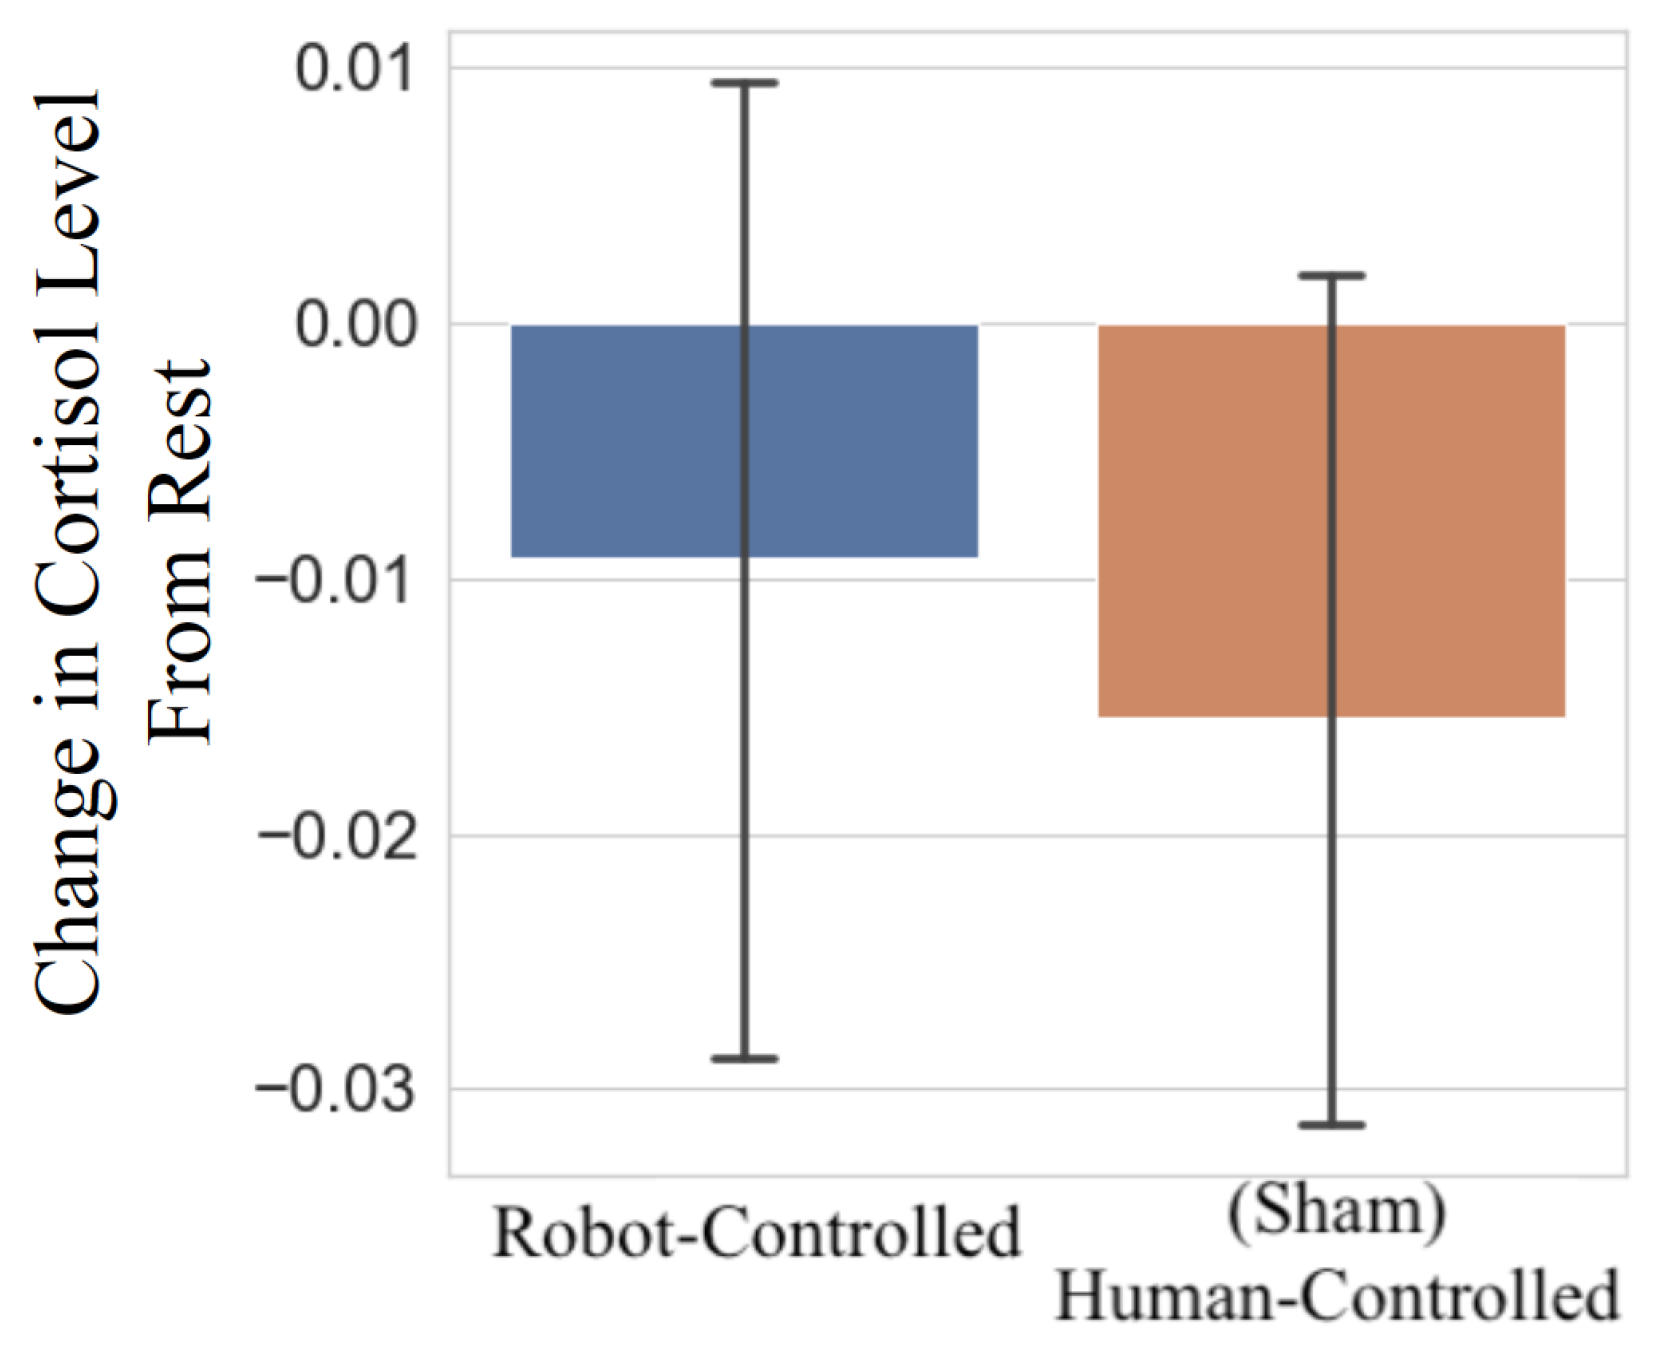
3.5. Change in Cortisol

3.5.1. Three-Factor ANOVA

Three-factor (participants’ gender × (sham) operator’s gender × trials’ order) identified non-significant effect of participants’ gender (p = 0.1744, F(1, 1) = 1.90, η 2 = 3.52), operator’s gender (p = 0.7003, F(1, 1) = 0.15, η 2 = 0.28), and trials’ order (p = 0.5911, F(1, 1) = 0.29, η 2 = 0.54).
Similarly, the interaction between these factors were non-significant (participants’ gender × (sham) operator’s gender: p = 0.5200, F(1, 1) = 0.42, η 2 = 0.78, participants’ gender × trials’ order: p = 0.4664, F(1, 1) = 0.54, η 2 = 1.00, (sham) operator’s gender × trials’ order: p = 0.7989, F(1, 1) = 0.07, η 2 = 0.12, participants’ gender × operator’s gender × trials’ order: p = 0.4060, F(1, 1) = 0.70, η 2 = 1.30).

3.5.2. Two-Sample T-Test: Robor- versus (Sham) Human-Controlled Trials

Two-sample t-test on the participants’ change in cortisol level during their two trials indicated (Figure 6) a non-significant change in cortisol level between robot- and (sham) human-controlled trials (p = 0.6396, r = 0.06, F = 0.47, M r o b o t c o n t r o l l e d = −0.010, SD r o b o t c o n t r o l l e d = 0.056, M ( s h a m ) h u m a n c o n t r o l l e d = −0.016, SD ( s h a m ) h u m a n c o n t r o l l e d = 0.048, r = 0.06).

4. Discussion

How would we perceive a physical contact by a robot? Would we consider it (non)threatening? Would we find it (dis)comforting? These are among some of the most basic questions to seek answers for if the robots are to ever take part in our social life activities [41,42].
The present research investigated these questions by examining whether the background information about the level of autonomy of a robot would have any effect on its perception by individuals whom it made a physical contact with. For this purpose, we asked 30 young adults to let a robot-arm touch their left arm in two consecutive trials. While the robot was autonomous and used exact same program for its movement in these two trials, we told our participants that in one of their trials the robot was controlled by a human operator while in the other the robot moved autonomously.
We observed that the participants’ gender and personality traits had no influence on their perception of robot-touch. This discarded the overemphasis of gender [28] during interaction with robots. In the same vein, the gender of (sham) human operator (whether female or male) did not play a role in participants’ perception of their two trials. A number of previous studies [43,44,45] reported that, in various cultures and countries, men and women both preferred a touch by women more than by men. In light of these findings, the non-significant effect of operator’s gender in the present study indicated that the participants did not attach any social component to the robot-touch.
On the other hand, we observed that although the robot-touch was identical in both trials, participants significantly preferred the trial that was supposedly operated by a human. This extended the previous findings on humans’ disapproval of soft/algorithmic agents [20,21,22,25] to the case of phycial contact with a robot. It also complemented these findings by showing that in spite of identical tasks, a minor manipulation of the agent’s identity was sufficient to reproduce these previous findings.
However, the more important (and perhaps pressing) observation in present study pertained to the effect of trial-order on participants’ comfortability with the robot-touch. Concretely, we observed that the participants significantly preferred their first trial, regardless of whether it was a robot- or a (sham) human-controlled scenario. This highlighted a sensitization effect: a component of nondeclarative memory [46] (p. 390) which refers to the type of knowledge that an individual is not conscious of. Types of memory that fall under this category include: procedural memory [47] (e.g., learning complex repeating patterns that appears as random), priming [48] (e.g., change in the response to a stimulus or the ability to identify that stimulus, following a prior exposure to that stimulus), conditioning (e.g., Pavlov dog), habituation (e.g., getting used to an initially uncomfortable toothbrush) and sensitization (e.g., rubbing one’s arm which, at first, creates a feeling of warm but when continued it starts to hurt [46] (p. 395)). Interestingly, we also observed that the change in participants’ salivary cortisol did not differ significantly. The presence of sensitization along with the non-significant change in salivary cortisol indicated that the observed effect was not due to different degree of stress or anxiety in two trials but primarily triggered by participants’ memory of the event.
As a form of nonassociative learning, sensitization (and its closely related effect; habituation) primarily involves sensory and sensorimotor pathways [46] (p. 395). However, contrary to habituation which reflects an incremental level of comfort over time, sensitization signals increased sensitivity and loss of comfort. As a result, the observed memory sensitization among participants in the present study indicated their growing distance toward robot-touch. In other words, it signified how these individuals (unconsciously) felt (i.e., their emotional stance) about the robot-touch itself. In this respect, the association between memory and emotion becomes clearer, considering their interaction during memory consolidation and its subsequent long-term retrieval [49]. It might also be tempting to attribute the observed memory sensitization to the robot’s look-and-feel (i.e., mechanistic than human-liked). However, it is unlikely that such a characteristic played a role in present observation, given the substantial findings on its repulsive neuropsychological effect [50,51] that not only extends to the case of living versus non-living entities (e.g., tools versus animals) [52,53] but has also been observed among other primates [54].
The unconscious effect of robot-touch on individuals’ memory and learning may help interpret humans’ distrust in machines [20,21,22,25] in terms of our evolutionarily tuned affective responses to the world’s events. Panksepp [55] (p. 123) argued that the brain emotive systems evolved to “initiate, synchronize, and energize sets of coherent physiological, behavioural, and psychological changes that are primal instinctive solutions to various archetypal life-challenging situations.” In this view, individuals’ perception of artificial agents may not solely be motivated by the lack of trust per se but their deeply-rooted evolutionary emotional and cognitive reactions to an object that is presented out of its expected context. This interpretation finds evidence in neuroscientific findings that voiced the substantial differences in humans’ emotional and neural responses to robots [50,56]. In particular, these findings indicated that the neural markers of mentalizing [57,58] and social motivation [59] were not activated during interaction with robots and that the brain activity within the theory-of-mind (TOM) network [60,61] was reduced [62].
There is no doubt that robots can play a substantial role in various aspects of humans’ life from their potential utility for improving social skills in children with autism spectrum disorder (ASD) [16] to reducing the effect of loneliness on older citizens [18]. At the same time, the present and previous observations [20,21,22,25] substantiate the necessity for more in-depth and socially situated [63] study and analysis of these new generation of our tools to better comprehend the extent of their (dis)advantages to more effectively introduce them to our society.

5. Concluding Remarks

The small number of participants in the present study who were from a single demographic background (i.e., 30 younger Japanese adults) limit the generalizability of its findings. Future research can address these limitations by including larger sample of gender-diverse individuals from various cultural backgrounds and age range (i.e., children, adolescents, and older individuals in addition to younger adults only). Such diversified studies will allow for more informed conclusions via broader examination of the potential effect of age, culture, and gender on present findings.
Another venue in which the future research can further the present findings is through adaptation of different types of robots for touch interaction to verify how such variety may affect the perception of physical interaction by human subjects. For instance, these studies may consider the change in degree of trust, likeability, etc. by human subjects as a function of varying level of human-likeness of such physically interacting agents. In the same vein, they may also compare the human-likeness versus more animal-like look-and-feel to verify how such a change in appearance could help in addressing human subjects’ affective stance toward robots.
Another possibility to extend the present findings is through introduction of various robot’s behavioural paradigms. Specifically, the present study used the same robot’s touch-behaviour that followed fixed references for the robot-arm trajectories and people’s postures. In this regard, it becomes more interesting to verify whether the robot ability to adjust its touch as per individuals’ pose and posture can affect their attitude toward robot.

Author Contributions

Conceptualization, methodology, formal analysis, data curation, writing—original draft preparation, writing–review and editing, and funding acquisition: S.K. The author has read and agreed to the published version of the manuscript.

Funding

This work was supported by Japan Society for the Promotion of Science (JSPS) KAKENHI Grant Number JP19K20746.

Institutional Review Board Statement

This study was carried out in accordance with the recommendations of the ethical committee of the Advanced Telecommunications Research Institute International (ATR) (approval code: 19-501-4).

Informed Consent Statement

All subjects signed a written informed consent form in accordance with ethical approval of the ATR Ethics Committee.

Acknowledgments

The author would like to thank Advanced Telecommunications Research Institute International (ATR) for providing the robot-arm and the experiment’s room, Yukiko Horikawa for translating the content of the questionnaire to Japanese, and Minaka Homma, whose assistance allowed the experiment progress smoothly.

Conflicts of Interest

The author declares no conflict of interest. The funder had no role in the design of the study; in the collection, analyses, or interpretation of data; in the writing of the manuscript, or in the decision to publish the results.

Appendix A. Effect of the Participants’ Personality Traits on Their Responses to Questionnaire’s Items Q1 through Q5

We observed non-significant effects of participants’ personality traits and their interactions with thier gender on their responses to Q1 (Table A1), Q2 (Table A2), Q3 (Table A3), Q4 (Table A4), and Q5 (Table A5).
Table A1. GLM analysis of the effect of participants’ personality traits (i.e., extraversion, agreeableness, conscientiousness, neuroticism, openness) on their responses to question Q1.
QuestionFactorFp η 2
participant gender0.0040.9500.0002
extraversion0.620.4390.03
agreeableness0.180.6740.007
conscientiousness1.030.3220.04
neuroticism0.640.4320.03
Q1openness1.290.2710.05
participant gender × extraversion0.0010.9800.00
participant gender × agreeableness0.050.8270.002
participant gender × conscientiousness0.220.6460.009
participant gender × neuroticism1.610.2200.06
participant gender × openness0.300.5880.01
Table A2. GLM analysis of the effect of participants’ personality traits (i.e., extraversion, agreeableness, conscientiousness, neuroticism, openness) on their responses to question Q2.
QuestionFactorFp η 2
participant gender0.840.3710.03
extraversion1.110.3040.04
agreeableness1.920.1820.07
conscientiousness0.070.8000.003
neuroticism1.180.290.05
Q2openness0.630.4370.02
participant gender × extraversion0.020.8890.001
participant gender × agreeableness0.280.6050.0
participant gender × conscientiousness0.040.8360.002
participant gender × neuroticism0.5300.4750.02
participant gender × openness0.600.4480.02
Table A3. GLM analysis of the effect of participants’ personality traits (i.e., extraversion, agreeableness, conscientiousness, neuroticism, openness) on their responses to question Q3.
QuestionFactorFp η 2
participant gender4.240.0530.14
extraversion0.310.5860.01
agreeableness0.160.6900.01
conscientiousness0.330.5740.01
neuroticism1.100.3070.04
Q3openness0.160.6920.01
participant gender × extraversion3.260.0870.11
participant gender × agreeableness0.060.8120.002
participant gender × conscientiousness0.060.8160.002
participant gender × neuroticism0.770.3920.03
participant gender × openness0.160.6960.01
Table A4. GLM analysis of the effect of participants’ personality traits (i.e., extraversion, agreeableness, conscientiousness, neuroticism, openness) on their responses to question Q4.
QuestionFactorFp η 2
participant gender0.020.8800.001
extraversion0.680.4210.03
agreeableness0.2700.6090.01
conscientiousness1.760.1200.07
neuroticism0.660.4270.03
Q4openness0.490.4910.02
participant gender × extraversion0.050.8300.002
participant gender × agreeableness0.770.3920.03
participant gender × conscientiousness0.050.8320.002
participant gender × neuroticism0.120.7370.005
participant gender × openness0.010.7600.004
Table A5. GLM analysis of the effect of participants’ personality traits (i.e., extraversion, agreeableness, conscientiousness, neuroticism, openness) on their responses to question Q5.
QuestionFactorFp η 2
participant gender0.230.6390.01
extraversion0.4740.4500.02
agreeableness0.410.5320.02
conscientiousness1.1880.2900.05
neuroticism0.210.6520.01
Q5openness0.520.4800.02
participant gender × extraversion1.380.2540.06
participant gender × agreeableness0.740.3400.03
participant gender × conscientiousness0.300.5900.01
participant gender × neuroticism0.090.7630.004
participant gender × openness0.130.7280.01

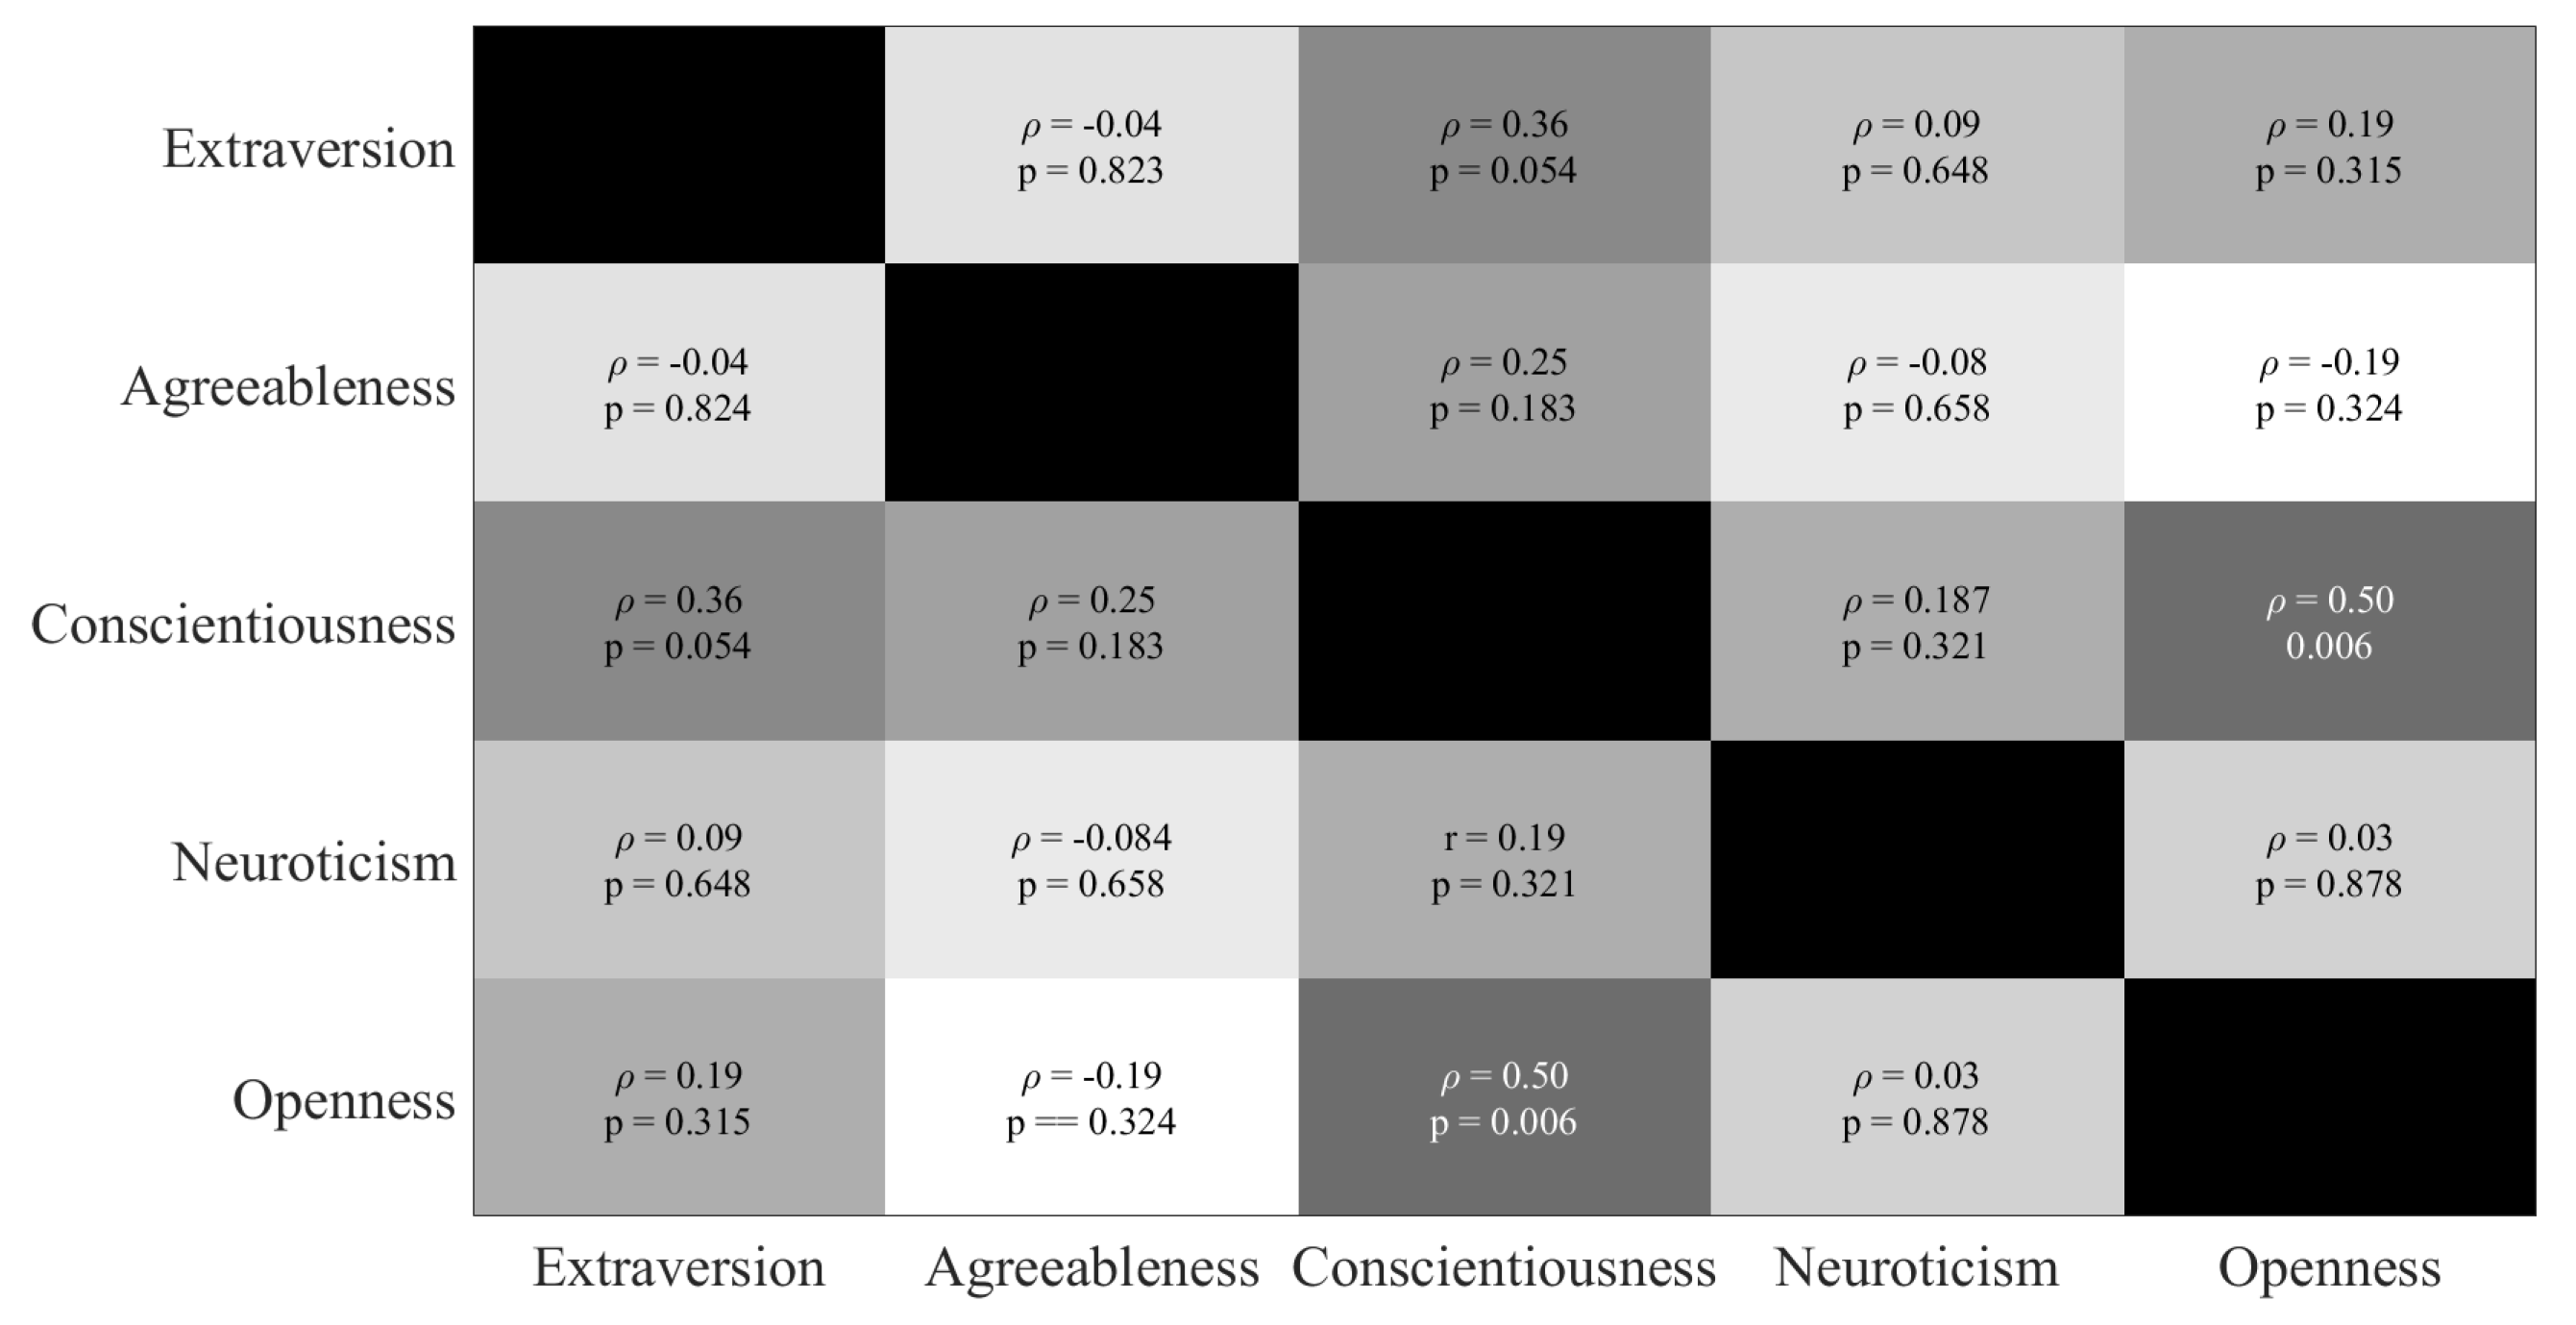
Appendix B. Spearman Correlations: Participants’ Personality Traits

We observed a significant (uncorrected) correlation between “conscientiousness” and “openness” personality traits of the participants (r = 0.50, p = 0.006). All the other pairwise correlations were non-significant (Figure A1).
Figure A1. Pairwise Spearman correlations between participants’ personality traits: Extraversion, Agreeableness, Conscientiousness, Neuroticism, Openness. The Spearman correlation ρ along with its p-value in each cell correspond to the paired personality traits for that cell. We only observed a significant (uncorrected) correlation between “conscientiousness” and “openness”. All other correlations were non-significant.
Applsci 11 02271 g0a1

Appendix C. Kendall Correlations: Participants’ Personality Traits and Their Responses to Q1 through Q5

We only observed a significant (uncorrected) correlation between the participants’ openness and their responses to Q4 ( τ = 0.36, p = 0.038). All the other correlations (Table A6) between participants’ personality traits and their responses to Q1 through Q5 were non-significant.
Table A6. Kendall correlations between participants’ personality traits and their responses to questions Q1 through Q5.
QuestionsExtraversionAgreeablenessConscientiousnessNeuroticismOpenness
Q1 τ = −0.20 τ = −0.14 τ = −0.21 τ = −0.07 τ = −0.07
p = 0.224p = 0.418p = 0.201p = 0.699p = 0.680
Q2 τ = −0.01 τ = −0.23 τ = 0.09 τ = 0.21 τ = 0.14
p = 0.982p = 0.177p = 0.590p = 0.228p = 0.410
Q3 τ = 0.01 τ = −0.10 τ = −0.07 τ = 0.29 τ = −0.09
p = 0.983p = 0.538p = 0.703p = 0.086p = 0.620
Q4 τ = −0.16 τ = −0.15 τ = 0.20 τ = −0.10 τ = 0.36
p = 0.340p = 0.381p = 0.223p = 0.573p = 0.038
Q5 τ = 0.04 τ = 0.21 τ = 0.22 τ = −0.04 τ = −0.24
p = 0.842p = 0.221p = 0.191p = 0.818p = 0.165

References

  1. Seed, A.; Byrne, R. Animal tool-use. Curr. Biol. 2010, 20, R1032–R1039. [Google Scholar] [CrossRef] [Green Version]
  2. Haslam, M. ‘Captivity bias’ in animal tool use and its implications for the evolution of hominin technology. Philos. Trans. R. Soc. B Biol. Sci. 2013, 368, 20120421. [Google Scholar] [CrossRef] [Green Version]
  3. Lamon, N.; Neumann, C.; Gruber, T.; Zuberbühler, K. Kin-based cultural transmission of tool use in wild chimpanzees. Sci. Adv. 2017, 3, e1602750. [Google Scholar] [CrossRef] [Green Version]
  4. Clay, Z.; Tennie, C. Is overimitation a uniquely human phenomenon? Insights from human children as compared to bonobos. Child Dev. 2017, 89, 1535–1544. [Google Scholar] [CrossRef] [Green Version]
  5. Byrne, R.W. The manual skills and cognition that lie behind hominid tool use. In The Evolution of Thought: Evolutionary Origins of Great Ape Intelligence; Cambridge University Press: Cambridge, UK, 2004. [Google Scholar]
  6. Stout, D.; Chaminade, T. Stone tools, language and the brain in human evolution. Philos. Trans. R. Soc. B Biol. Sci. 2012, 367, 75–87. [Google Scholar]
  7. Orban, G.A.; Caruana, F. The neural basis of human tool use. Front. Psychol. 2014, 5, 310. [Google Scholar] [CrossRef] [Green Version]
  8. Petersen, K.H.; Napp, N.; Stuart-Smith, R.; Rus, D.; Kovac, M. A review of collective robotic construction. Sci. Robot. 2019, 4, eaau8479. [Google Scholar] [CrossRef] [PubMed]
  9. Billard, A.; Kragic, D. Trends and challenges in robot manipulation. Sci. Robot. 2019, 364, eaat8414. [Google Scholar] [CrossRef] [PubMed]
  10. Gao, Y.; Chien, S. Review on space robotics: Toward top-level science through space exploration. Sci. Robot. 2017, 2, eaan5074. [Google Scholar] [CrossRef] [Green Version]
  11. Li, J.; de Ávila, B.E.F.; Gao, W.; Zhang, L.; Wang, J. Micro/nanorobots for biomedicine: Delivery, surgery, sensing, and detoxification. Sci. Robot. 2017, 2, eaam6431. [Google Scholar] [CrossRef] [PubMed]
  12. Yang, G.Z.; Riener, R.; Dario, P. To integrate and to empower: Robots for rehabilitation and assistance. Sci. Robot. 2017, 2, eaan5593. [Google Scholar] [CrossRef] [PubMed]
  13. Nazarpour, K. A more human prosthetic hand. Sci. Robot. 2020, 23, eabd9341. [Google Scholar] [CrossRef]
  14. Matarić, M.J. Socially assistive robotics: Human augmentation versus automation. Sci. Robot. 2017, 2, eaam5410. [Google Scholar] [CrossRef] [PubMed]
  15. Dawe, J.; Sutherl, C.; Barco, A.; Broadbent, E. Can social robots help children in healthcare contexts? A scoping review. BMJ Paediatr. Open 2019, 3, 1. [Google Scholar] [CrossRef] [Green Version]
  16. Scassellati, B.; Boccanfuso, L.; Huang, C.M.; Mademtzi, M.; Qin, M.; Salomons, N.; Ventola, P.; Shic, F. Improving social skills in children with ASD using a long-term, in-home social robot. Sci. Robot. 2018, 3, eaam5410. [Google Scholar] [CrossRef] [Green Version]
  17. Tanaka, F.; Cicourel, A.; Movellan, J.R. Socialization between toddlers and robots at an early childhood education center. Proc. Natl. Acad. Sci. USA 2007, 104, 17954–17958. [Google Scholar] [CrossRef] [Green Version]
  18. Robinson, H.; MacDonald, B.; Kerse, N.; Broadbent, E. The psychosocial effects of a companion robot: A randomized controlled trial. J. Am. Med. Dir. Assoc. 2013, 14, 661–667. [Google Scholar] [CrossRef]
  19. Valenti Soler, M.; Agüera-Ortiz, L.; Olazarán Rodríguez, J.; Mendoza, R.C.; Pérez, M.A.; Rodríguez, P.I.; Osa, R.E.; Barrios, S.A.; Herrero, C.V.; Carrasco, C.L.; et al. Social robots in advanced dementia. Front. Aging Neurosci. 2015, 7, 133. [Google Scholar] [CrossRef] [PubMed] [Green Version]
  20. Dietvorst, B.J.; Simmons, J.P.; Massey, C. Algorithm aversion: People erroneously avoid algorithms after seeing them err. J. Exp. Psychol. Gen. 2015, 144, 114. [Google Scholar] [CrossRef] [Green Version]
  21. Merritt, T.; McGee, K. Protecting artificial team-mates: More seems like less. In Proceedings of the SIGCHI Conference on Human Factors in Computing Systems, Austin, TX, USA, 5–10 May 2012; pp. 2793–2802. [Google Scholar]
  22. Oudah, M.; Babushkin, V.; Chenlinangjia, T.; Crandall, J.W. Learning to interact with a human partner. In Proceedings of the 10th ACM/IEEE International Conference on Human-Robot Interaction (HRI), Portland, OR, USA, 2–5 March 2015; pp. 311–318. [Google Scholar]
  23. Ratanawongsa, N.; Barton, J.L.; Lyles, C.R.; Wu, M.; Yelin, E.H.; Martinez, D.; Schillinger, D. Association between clinician computer use and communication with patients in safety-net clinics. JAMA Intern. Med. 2016, 176, 125–128. [Google Scholar] [CrossRef] [Green Version]
  24. Promberger, M.; Baron, J. Do patients trust computers? J. Behav. Decis. Mak. 2006, 19, 455–468. [Google Scholar] [CrossRef]
  25. Ishowo-Oloko, F.; Bonnefon, J.F.; Soroye, Z.; Crandall, J.; Rahwan, I.; Rahwan, T. Behavioural evidence for a transparency–efficiency tradeoff in human–machine cooperation. Nat. Mach. Intell. 2019, 1, 517–521. [Google Scholar] [CrossRef]
  26. Gray, H.M.; Gray, K.; Wegner, D.M. Dimensions of mind perception. Science 2007, 315, 619. [Google Scholar] [CrossRef] [Green Version]
  27. Broadbent, E. Interactions with robots: The truths we reveal about ourselves. Annu. Rev. Psychol. 2017, 68, 627–652. [Google Scholar] [CrossRef] [Green Version]
  28. Uchida, T.; Takahashi, H.; Ban, M.; Shimaya, J.; Minato, T.; Ogawa, K.; Yoshikawa, Y.; Ishiguro, H. Japanese Young Women did not discriminate between robots and humans as listeners for their self-disclosure-pilot study. Multimodal Technol. Interact. 2020, 4, 35. [Google Scholar] [CrossRef]
  29. Manzi, F.; Peretti, G.; Di Dio, C.; Cangelosi, A.; Itakura, S.; Kanda, T.; Ishiguro, H.; Massaro, D.; Marchetti, A. A robot is not worth another: Exploring children’s mental state attribution to different humanoid robots. Front. Psychol. 2020, 11, 2011. [Google Scholar] [CrossRef]
  30. Graham, B. SOUL MATE Erica the Japanese Robot Is So Lifelike She ‘Has a Soul’ and Can Tell JOKES… Although They Aren’t Very Funny. THE Sun. Available online: https://www.thesun.co.uk/tech/5050946/erica-robot-lifelike-soul-jokes/ (accessed on 5 October 2018).
  31. Cai, F. Japanese Scientist Insists His Robot Twin Is Not Creepy Synced, AI Technology & Industry Review. 2019. Available online: https://syncedreview.com/2019/11/14/japanese-scientist-insists-his-robot-twin-is-not-creepy/ (accessed on 3 March 2021).
  32. Zeeberg, A. What We Can Learn about Robots from Japan, BBC, 2020. Available online: https://www.bbc.com/future/article/20191220-what-we-can-learn-about-robots-from-japan (accessed on 3 March 2021).
  33. Campeau-Lecours, A.; Lamontagne, H.; Latour, S.; Fauteux, P.; Maheu, V.; Boucher, F.; Deguire, C.; L’Ecuyer, L.J.C. Kinova modular robot arms for service robotics applications. In Rapid Automation: Concepts, Methodologies, Tools, and Applications; IGI Global: Hershey, PA, USA, 2019; pp. 693–719. [Google Scholar]
  34. Oshio, A.; Abe Shingo, S.; Cutrone, P. Development, reliability, and validity of the Japanese version of Ten Item Personality Inventory (TIPI-J). Jpn. J. Personal. 2012, 21, 40–52. [Google Scholar] [CrossRef] [Green Version]
  35. Goldberg, L.R. An alternative “description of personality”: The big-five factor structure. J. Personal. Soc. Psychol. 1990, 59, 1216–1229. [Google Scholar] [CrossRef]
  36. Turner-Cobb, J.M.; Asif, M.; Turner, J.E.; Bevan, C.; Fraser, D.S. Use of a non-human robot audience to induce stress reactivity in human participants. Comput. Hum. Behav. 2019, 99, 76–85. [Google Scholar] [CrossRef]
  37. Mardia, K.; Kent, J.; Bibby, J. Multivariate analysis. In Probability and Mathematical Statistics; Academic Press Inc.: Cambridge, MA, USA, 1979. [Google Scholar]
  38. Kim, H.Y. Statistical notes for clinical researchers: Chi-squared test and Fisher’s exact test. Restor. Dent. Endod. 2017, 42, 152–155. [Google Scholar] [CrossRef]
  39. Vacha-Haase, T.; Thompson, B. How to estimate and interpret various effect sizes. J. Couns. Psychol. 2004, 51, 473–481. [Google Scholar] [CrossRef] [Green Version]
  40. Rosnow, R.L.; Rosenthal, R.; Rubin, D.B. Contrasts and correlations in effect-size estimation. Psychol. Sci. 2000, 11, 446–453. [Google Scholar] [CrossRef]
  41. Rahwan, I.; Cebrian, M.; Obradovich, N.; Bongard, J.; Bonnefon, J.F.; Breazeal, C.; Crandall, J.W.; Christakis, N.A.; Couzin, I.D.; Jackson, M.O.; et al. Machine behaviour. Nature 2019, 568, 477–486. [Google Scholar] [CrossRef] [Green Version]
  42. Yang, G.Z.; Bellingham, J.; Dupont, P.E.; Fischer, P.; Floridi, L.; Full, R.; Jacobstein, N.; Kumar, V.; McNutt, M.; Merrifield, R.; et al. The grand challenges of Science Robotics. Sci. Robot. 2018, 3, eaar7650. [Google Scholar] [CrossRef]
  43. Tomita, M. Exploratory Study of Touch zones in college students on two campuses. Calif. J. Health Promot. 2008, 6, 1–22. [Google Scholar] [CrossRef] [Green Version]
  44. Suvilehto, J.T.; Glerean, E.; Dunbar, R.I.; Hari, R.; Nummenmaa, L. Topography of social touching depends on emotional bonds between humans. Proc. Natl. Acad. Sci. USA 2015, 112, 13811–13816. [Google Scholar] [CrossRef] [Green Version]
  45. Suvilehto, J.T.; Nummenmaa, L.; Harada, T.; Dunbar, R.I.; Hari, R.; Turner, R.; Sadato, N.; Kitada, R. Cross-cultural similarity in relationship-specific social touching. Proc. R. Soc. B 2019, 286, 20190467. [Google Scholar] [CrossRef] [PubMed]
  46. Gazzaniga, M.S.; Ivry, R.B.; Mangun, G.R. Cognitive Neuroscience. In The Biology of the Mind, 5th ed.; W.W. Norton & Company: New York, NY, USA, 2019. [Google Scholar]
  47. Yin, H.H.; Knowlton, B.J. The role of the basal ganglia in habit formation. Nat. Rev. Neurosci. 2006, 7, 464–476. [Google Scholar] [CrossRef] [PubMed]
  48. Cave, C.B. Very long-lasting priming in picture naming. Psychol. Sci. 1997, 8, 322–325. [Google Scholar] [CrossRef]
  49. LaBar, K.S.; Cabeza, R. Cognitive neuroscience of emotional memory. Nat. Rev. Neurosci. 2006, 7, 54–64. [Google Scholar] [CrossRef]
  50. Rosenthal-von der Pütten, A.M.; Krämer, N.C.; Maderwald, S.; Brand, M.; Grabenhorst, F. Neural mechanisms for accepting and rejecting artificial social partners in the uncanny valley. J. Neurosci. 2019, 39, 6555–6570. [Google Scholar] [CrossRef] [PubMed]
  51. Pollick, F.E. In search of the uncanny valley. In International Conference on User Centric Media; Springer: Berlin/Heidelberg, Germany, 2009; pp. 69–78. [Google Scholar]
  52. Chao, L.L.; Haxby, J.V.; Martin, A. Attribute-based neural substrates in temporal cortex for perceiving and knowing about objects. Nat. Neurosci. 1999, 2, 913–919. [Google Scholar] [CrossRef] [PubMed]
  53. Noppeney, U.; Price, C.J.; Penny, W.D.; Friston, K.J. Two distinct neural mechanisms for category-selective responses. Cereb. Cortex 2006, 16, 437–445. [Google Scholar] [CrossRef] [PubMed]
  54. Steckenfinger, S.A.; Ghazanfar, A.A. Monkey visual behavior falls into the uncanny valley. Proc. Natl. Acad. Sci. USA 2009, 106, 18362–18366. [Google Scholar] [CrossRef] [Green Version]
  55. Panksepp, J. Affective Neuroscience: The Foundations of Human and Animal Emotions; Oxford University Press: Oxford, UK, 2004. [Google Scholar]
  56. Henschel, A.; Hortensius, R.; Cross, E.S. Social Cognition in the Age of Human-Robot Interaction. Trends Neurosci. 2020, 43, 373–384. [Google Scholar] [CrossRef]
  57. Frith, C.D.; Frith, U. Interacting minds-a biological basis. Science 1999, 286, 1692–1695. [Google Scholar] [CrossRef] [Green Version]
  58. Dennett, D.C. The Intentional Stance; MIT Press: Cambridge, MA, USA, 1989; Volume 286. [Google Scholar]
  59. Chevallier, C.; Kohls, G.; Troiani, V.; Brodkin, E.S.; Schultz, R.T. The social motivation theory of autism. Trends Neurosci. 2012, 16, 231–239. [Google Scholar] [CrossRef] [PubMed] [Green Version]
  60. Koster-Hale, J.; Saxe, R. Theory of mind: A neural prediction problem. Neuron 2013, 79, 836–848. [Google Scholar] [CrossRef] [Green Version]
  61. Saxe, R.; Wexler, A. Making sense of another mind: The role of the right temporo-parietal junction. Neuropsychologia 2005, 43, 1391–1399. [Google Scholar] [CrossRef]
  62. Wang, Y.; Quadflieg, S. In our own image? Emotional and neural processing differences when observing human–human vs. human–robot interactions. Soc. Cogn. Affect. Neurosci. 2015, 10, 1515–1524. [Google Scholar] [CrossRef] [Green Version]
  63. Redcay, E.; Schilbach, L. Using second-person neuroscience to elucidate the mechanisms of social interaction. Nat. Rev. Neurosci. 2019, 20, 495–505. [Google Scholar] [CrossRef]
Figure 1. Conceptual diagram of the experiment’s design in which every participant took part in two consecutive trials.
Applsci 11 02271 g001
Figure 2. Participants’ responses to Q1 through Q5 of the experiment-specific questionnaire.
Applsci 11 02271 g002
Figure 3. Cumulative (i.e., participants’ gender discarded) participants’ responses to Q3.
Applsci 11 02271 g003
Figure 4. Hypothesis testing. (A) Hypothesis 1 versus Hypothesis 2 with respect to participants’ responses to Q1 through Q4. (B) H3 versus H4. Subplots on left show the histogram of tests’ respective counts. Right subplots show these tests’ bootstrapped results at 99.0% confidence interval (i.e., area with red lines). Yellow lines are bootstrapped averages and tick blue line mark null hypothesis H0.
Applsci 11 02271 g004
Figure 5. Testing Hypothesis 5 versus Hypothesis 6. (A) n u m b e r o f t i m e s ( s h a m ) h u m a n c o n t r o l l e d s e l e c t e d t o t a l n u m b e r o f r e s p o n s e s (B) n u m b e r o f t i m e s r o b o t c o n t r o l l e d s e l e c t e d t o t a l n u m b e r o f r e s p o n s e s . The left subplots show the histograms of these ratios. The right subplots correspond to the results of their bootstrapped tests at 99.0% confidence interval (area within red lines). Tick blue lines mark the null hypothesis H0 (i.e., participants’ preference for two trials was at chance level) and yellow lines are bootstrapped averages. These subplots verify that whereas participants preferred (sham) human-controlled trial with a significantly above chance level, their preference for robot-controlled trial was significantly below chance level.
Applsci 11 02271 g005
Figure 6. Two-sample t-test indicated that participants showed a non-significant change in salivary cortisol during their (sham) human-controlled and robot-controlled trials.
Applsci 11 02271 g006
Table 1. GLM: Effect of experiment’s design factors (i.e., operator’s gender, trial-order, and their interaction) on participants’ responses to Q1 through Q5. In this table, “Operator’s Gender” refers to the supposed gender of operator in (sham) human-controlled trial.
ResponsesFactorFp η 2
Operator’s Gender4.600.0410.15
Q1Trial-Order0.01.00.0
Operator’s Gender × Trial-Order0.140.7080.005
Operator’s Gender1.840.1860.06
Q2Trial-Order0.070.7880.002
Operator’s Gender × Trial-Order3.680.0650.11
Operator’s Gender0.080.7730.002
Q3Trial-Order10.240.0030.27
Operator’s Gender × Trial-Order0.170.6840.005
Operator’s Gender0.550.4630.02
Q4Trial-Order0.060.8060.002
Operator’s Gender × Trial-Order0.120.7280.004
Operator’s Gender0.250.6230.009
Q5Trial-Order0.250.6220.009
Operator’s Gender × Trial-Order0.500.4880.02
Publisher’s Note: MDPI stays neutral with regard to jurisdictional claims in published maps and institutional affiliations.

