1. Introduction
In the traditional design methodologies of mechanical systems, design variables are optimized to maximize the performances based on deterministic assumption [
1,
2]. However, there are a lot of uncertainties in real mechanical systems, including input loads, product dimensions, material properties, and manufacturing tolerance [
3,
4,
5,
6]. To quantitatively represent these uncertainties in actual conditions and analyze their influence on performance functions, plenty of uncertainty analysis methods have been proposed in the design of mechanical systems.
Initially, the uncertain input variables are assumed to be aleatoric uncertainties. By means of low-cost experiment or rapid simulation analysis, the uncertainty information can be acquired, meanwhile the distribution types and distribution parameters are treated as determinate and accurate variables. Many probabilistic uncertainty analysis methodologies have been proposed to deal with aleatoric uncertainties, such as uncertainty quantification based on available uncertainty information [
7,
8,
9,
10], uncertainty propagation among multiple variables [
11,
12], probabilistic sensitivity analysis [
13,
14], probabilistic uncertainty optimization design [
15,
16,
17], etc.
However, under some circumstances, it is time-consuming and complicated to acquire enough uncertainty information to construct deterministic representation functions for uncertain input variables. Therefore, many representation methods of epistemic uncertainties have been employed, which include possibility theory [
18], probability box [
19,
20], evidence theory [
21,
22,
23], fuzzy set [
24,
25] and convex models [
26,
27]. Sankararaman and Mahadevan [
28,
29] proposed an uncertainty representation method based on sparse points and/or interval data, the distribution type uncertainty was quantified by using Bayesian model averaging and Bayesian hypothesis testing approaches, while the uncertainties of distribution parameters were calculated using the maximum likelihood estimation methodology. Zaman et al. [
30,
31] estimated the distribution parameters of uncertainty variables using a worst-case maximum-likelihood-based approach, and developed a robustness-based design optimization methodology under aleatoric and epistemic uncertainties. Choi [
32] identified the parameter uncertainties using a stochastic inverse algorithm based on Karhunen-Loève expansion and the maximum likelihood estimation method. Zhao [
33,
34] derived a complete probabilistic expression of epistemic uncertainty according to statistical information of uncertain variables, and applied the proposed cubic-normal distribution to a variety of areas in reliability engineering. Wang [
35,
36] developed the state-dependent parameter method to calculate the sensitivity indices of uncertainties of input variables and their distribution parameters. Zhang [
37,
38] estimated the uncertainty of the performance function using the maximum entropy and univariate dimension reduction methods based on multimodal probability density functions of input uncertainty variables. McFarland [
39] developed a Monte Carlo framework to deal with aleatoric and epistemic uncertainty, and computational approaches were outlined for propagation and sensitivity analysis with distribution parameter uncertainty. Wei [
40] developed a non-intrusive imprecise probabilistic integration framework to quantify uncertainties of epistemic variables with uncertain distribution parameters.
The uncertainty information of epistemic uncertainties in the above methods comes from single sources. However, in order to decrease the error from single source and increase the available uncertainty information, the uncertainty data for epistemic uncertainties may come from multiple different sources in some conditions, such as cases involving multiple sensors or various expert knowledge. The distribution parameters are also uncertain due to insufficient data, and the optimum distribution types may be different due to insufficient data from multiple data sources, the fusing algorithm should be researched to obtain an accurate uncertainty representation model of epistemic uncertainty. The data fusion algorithm for multiple sources [
41] can only deal with the Bernoulli distribution type. To the best of our knowledge, there is no general uncertainty data fusion algorithm for multiple sources of input data, especially for the uncertainty representation of distribution parameters.
For a mechanical system where the input variables are uncertain, sparse or inaccurate data will result in the distribution parameters being unavailable. If a probability distribution is used in the distribution parameters, the distribution family can be used to represent these random variables. However, there is insufficient uncertainty information to obtain the probability distribution of uncertain distribution parameters in some actual conditions. Some sparse and incomplete uncertainty information can be obtained from multiple data sources, and the type and amounts of available uncertain information from multiple data sources may be different. Therefore, a reliability measure method considering the uncertainties of input variables and their distribution parameters simultaneously is proposed.
In general, the key scientific contribution of our work is providing a unified uncertainty quantification method considering uncertain distribution parameters, owing to insufficient data being obtained from two sources. The proposed algorithm in this paper can decrease the uncertainty of insufficient data and obtain an accurate probabilistic function for epistemic variables with uncertain distribution parameters, which can increase the accuracy of the reliability index of mechanical systems. The rest of this paper is organized as follows. The reliability measure problem is described in
Section 2. In
Section 3, the uncertain distribution parameters of epistemic uncertainty are fused using a Gaussian interpolation method, which can fuse insufficient data and evidence theory information from two sources. The epistemic uncertainties are probabilistically represented considering uncertainties of distribution parameters in
Section 4. A reliability index that simultaneously describes aleatoric and epistemic uncertainties is calculated, and the unified reliability analysis procedure is proposed in
Section 5. In
Section 6, the proposed algorithm is applied to the crank-slider mechanism, and conclusions are summarized in
Section 7.
2. Problem Description
The uncertainty variables are divided into aleatoric uncertainty variables and epistemic uncertainty variables . In this paper, the distribution type and distribution parameters for are deterministic, but the probabilistic distributions of cannot be given, as the available data of are always insufficient and the knowledge is limited. However, in many conditions, can be represented with determinate distribution type and uncertain distribution parameters . Taking a part in a mechanical system as an example, its dimension parameters (length, width, etc) are uncertainty variables due to manufacturing tolerance, whose distributions follow a Normal distribution because of the size randomness. Furthermore, the distribution parameters (mean and standard deviation) are also uncertain when there is only a small amount of sampling data.
Although, for the uncertain distribution parameters of , the available uncertainty information is limited, the data acquired from multiple sources can be used to decrease the uncertainty of under some circumstances. For example, information from two sensors, theoretical calculation or simulation analysis may be available. However, the uncertainty information from two sources is not identical; how to fuse these data to obtain accurate uncertainty information for is the key problem.
Here, it is assumed that the available uncertainty information of distribution parameters includes insufficient data from Source 1 and evidence theory information from Source 2 at the same time. The insufficient data from Source 1 contains point data and/or interval data simultaneously. The available interval information for every distribution parameter from Source 2 is sub-intervals with corresponding basic probability assignment (BPA) . A relationship within these available uncertainty data is established firstly, then the fusion representation model for is constructed and the reliability index considering aleatoric uncertainties and epistemic uncertainties is calculated. Three problems that need to be addressed are shown as follows:
How to fuse the uncertainty information from two sources and construct the representation function for distribution parameters .
How to get the probabilistic representation of epistemic uncertainty variables considering uncertain distribution parameters .
How to calculate the reliability index considering aleatoric uncertainty variables and epistemic uncertainty variables simultaneously.
3. Uncertainty Representation of Uncertain Distribution Parameters
3.1. Available Information from Two Sources
m point entries
and
n interval entries
from Source 1 constitute insufficient data for every distribution parameter
. There are seven candidate distribution types, which are Normal distribution, F distribution, Gamma distribution, Weibull distribution, Extreme value distribution, Uniform distribution, and Lognormal distribution. The probability density function (PDF) under candidate distribution type
and distribution parameters
are represented with
. For the
k-th distribution type
, the likelihood estimation function
considering both probability density function of sampling points and cumulative probability density function of sampling interval data is constructed in Equation (
1).
The maximum likelihood estimation values of
under determinate distribution type
are calculated by maximizing
. Further, the probability density function
of
is calculated using Bayes’ theorem [
42] in Equation (
2).
The evidence theory information from Source 2 for each distribution parameter
is transformed into a continuous probability density function using the uniformity method. For the
i-th sub-interval
, its BPA, lower and upper bounds are represented as
,
, and
, respectively. If
is located in the independent sub-interval
, the PDF
of the corresponding probabilistic variable is calculated using Equation (
3). There are overlap intervals, and
is the sum of the overlapped sub-intervals. For example, when
is located in the overlapped region of
and
,
is calculated using Equation (
4).
3.2. Fusion of Uncertain Distribution Parameters
Using the Gaussian interpolation method, the insufficient data from Source 1 and evidence theory information from Source 2 are fused to represent all of the uncertain distribution parameters for the epistemic uncertainty variables .
Since the uncertainty representation data from two sources are not sufficient to cover the whole uncertainty design region of distribution parameters
, the design domain of
is firstly determined using a method similar to that for triangle fuzzy variables [
43].
After the available point data and random sampling points of interval data are acquired, the mean value
and standard deviation
of insufficient data from Source 1 are calculated using Equations (
5) and (
6), respectively.
is the data set, which contains sampling points and random sampling points from sampling intervals .
The lower and upper bound of insufficient data from Source 1 are determined based on available point and/or interval data and standard deviation
of insufficient data in Equation (
6). The lower and upper bound of evidence theory information from Source 2 are determined based on available interval data. The design domain
of
is determined considering data of lower bound and upper bound from both Source 1 and Source 2, which are shown in Equations (
7) and (
8):
where
and
are the maximum and minimum values of sampling data from Source 1,
and
are the lower bound and upper bound of the interval information from Source 2, respectively.
is the extension parameter with a value equal to
[
43].
The design domain
of
is discretized into
Q points
uniformly. The corresponding optimum PDF values
for
in Gaussian model
for Source 1 are calculated through maximizing the likelihood function
of insufficient data in Equation (
9):
are the probability density values of sampling point
from Source 1.
and
are the cumulative probability density values of the sampling interval’s upper bound
and lower bound
from Source 1, respectively.
Using Equation (
9), the optimum PDF values at discrete points
are gained and named as
, then the Gaussian interpolation model
for Source 1 is constructed. The probability density values
of
Q discrete points
for Source 2 are calculated based on the PDF
in Equations (
3) and (
4), and the Gaussian interpolation model
for Source 2 is constructed using a similar method for insufficient data. Finally, the likelihood estimation function
of the fusion model
G considering insufficient data from Source 1 and evidence theory information from Source 2 is constructed using Equation (
10):
are the weight ratios. To find the optimal
, the minimization of the total deviation
between
G and
,
are used in Equation (
11):
The weight ratios
are optimized through minimizing
in Equation (
11).
,
and
are calculated using Equation (
10), based on the Gaussian model
G, the optimum Gaussian model
for Source 1 and the continuous probabilistic representation model
for Source 2.
After the weight ratios are determined, the fusion Gaussian model is constructed through the interpolation method based on the fusion probability density values at the determinate discrete points.
4. Representation of Epistemic Uncertainty Considering Uncertain Distribution Parameters
The distribution type of the epistemic uncertainty variable y is deterministic, whereas distribution parameters have the characteristic of uncertainty. The insufficient data and evidence theory information are fused from two sources, so the distribution parameters can be defined by the Gaussian interpolation method. The epistemic uncertainty variable y is one of the functions of the uncertain distribution parameters . The probability density function of epistemic uncertainty variable y is calculated by the weighted summation of multiple dispersed distribution parameters, which can be obtained from the probability density function . Therefore, the uncertainty calculation complexity of the system performance can be effectively reduced.
The lower limit and upper limit of the i-th distribution parameter are referred to and , which are determined with and , where is the inverse probability density function of . Then, the interval is decomposed by the inverse cumulative distribution function. Therefore, after is calculated, the design space of can be decomposed into 10 Bayesian evidence intervals, , and , which have the same BPA of . If the interval length , then the interval is decomposed to and , and the corresponding BPAs are calculated using the cumulative distribution function of .
Therefore, the uncertain distribution parameter is decomposed into sub-interval , where and . Thus, is represented using discrete points with the BPA of interval .
Every uncertain distribution parameter
can be represented by the method mentioned above, so the epistemic uncertain variable
y is probabilistically calculated by a weighted sum of probability variables
in Equation (
12):
The distribution type and distribution parameters of
are
and
, respectively.
5. Unified Reliability Calculation Procedure Considering Aleatoric and Epistemic Uncertainties
The step by step flowrate to calculate reliability index considering aleatoric and epistemic uncertainties with uncertain distribution parameters is listed as follows, and the solution flowchart is shown in
Figure 1.
Step 1: The uncertain distribution parameter
is represented using the maximum likelihood estimation method based on insufficient data from Source 1, the probability density function
considering insufficient data of distribution parameter are calculated using Equations (
1) and (
2).
Step 2: The PDF
of distribution parameter
in Equations (
3) and (
4) is calculated using evidence theory based on available uncertainty information from Source 2.
Step 3: The design domain
of
is determined based on sampling information from Source 1 and Source 2 using Equations (
5)–(
8).
Step 4: The fusion model
G is constructed to minimize the total deviation
between
G and
,
, the weight ratios
and fusion probability density values
at discrete points are calculated using Equations (
9)–(
11), and the uncertainty distribution parameter
is represented considering uncertainty information from two sources simultaneously.
Step 5: The uncertainty distribution parameters
are dispersed according to their probability density function
, the epistemic uncertainty variable
y is probabilistically represented using a weighted sum of probability variables
in Equation (
12).
Step 6: The approximation model of performance function
considering aleatoric uncertainty variables
and epistemic uncertainty variables
is constructed around the most probable point (MPP)
, as follows:
where
,
,
and
are coefficients that are determined using the optimum Latin hypercube sampling method.
Step 7: The actual reliability probability
is calculated according to the approximation model
, which is defined in Equation (
15):
6. Application Examples
6.1. Example of Crank-Slider Mechanism
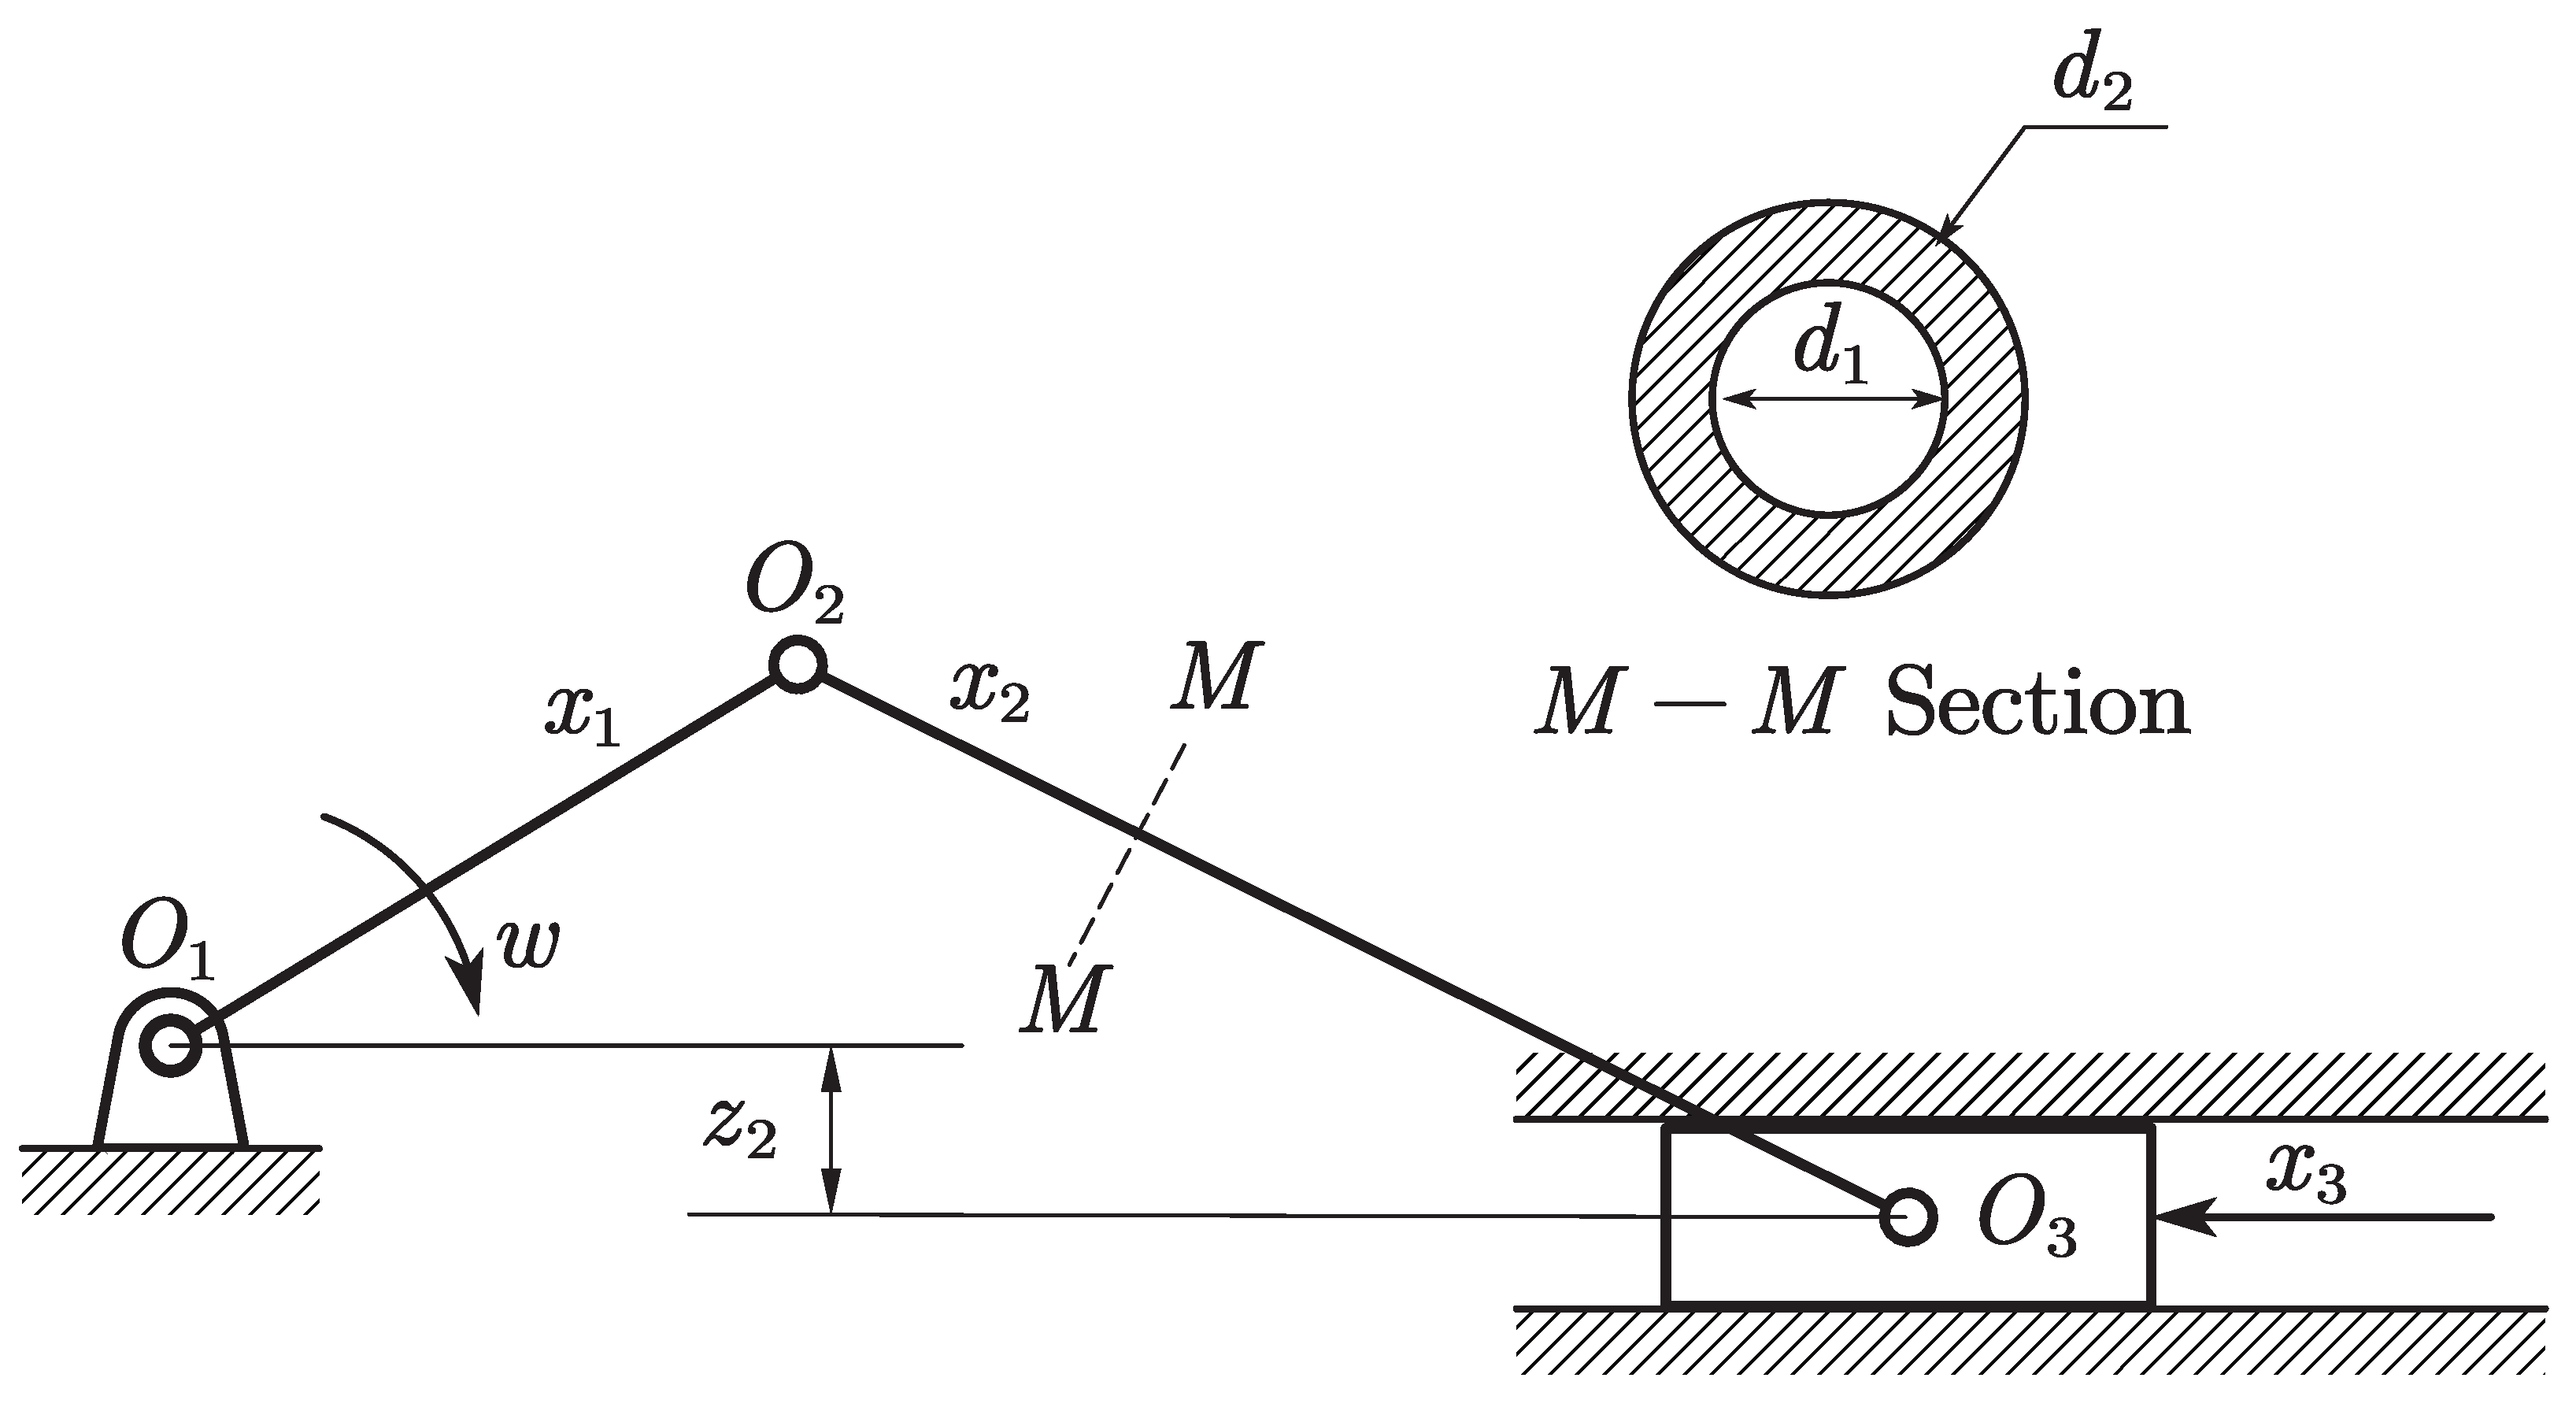
The example of a crank-slider mechanism is used to demonstrate the effectiveness of the proposed algorithm. The mechanism is shown in
Figure 2. The length of the crank
, the length of the coupler
, and the external force
are aleatoric uncertainty variables. Their uncertainties are listed in
Table 1. The Young’s modulus of the material
is an epistemic uncertainty variable, whose distribution type is Normal with a deterministic mean
GPa and an uncertain standard deviation
. The insufficient data for
from Source 1 contain sparse sampling points
and multiple intervals
. The sub-intervals with their corresponding BPAs from Source 2 are listed in
Table 2. The coupler’s internal diameter
mm, external diameter
mm, the offset
mm of the mechanism, and the coefficient of friction
acting on the slider are all deterministic values.
The probabilistic representation model for Source 2 is transfered from evidence theory using Equations (
3) and (
4), and the result is shown in
Figure 3a. Then, the design domain of
is determined to be
using Equations (
7) and (
8). The Gaussian interpolation model considering only insufficient data from Source 1 is constructed by maximizing the likelihood function in Equation (
9). In the optimization design of the fusion model, the weight ratios
are optimized through minimizing
in Equation (
11). The fusion Gaussian model is shown in
Figure 3b.
The product performance function is defined as follows
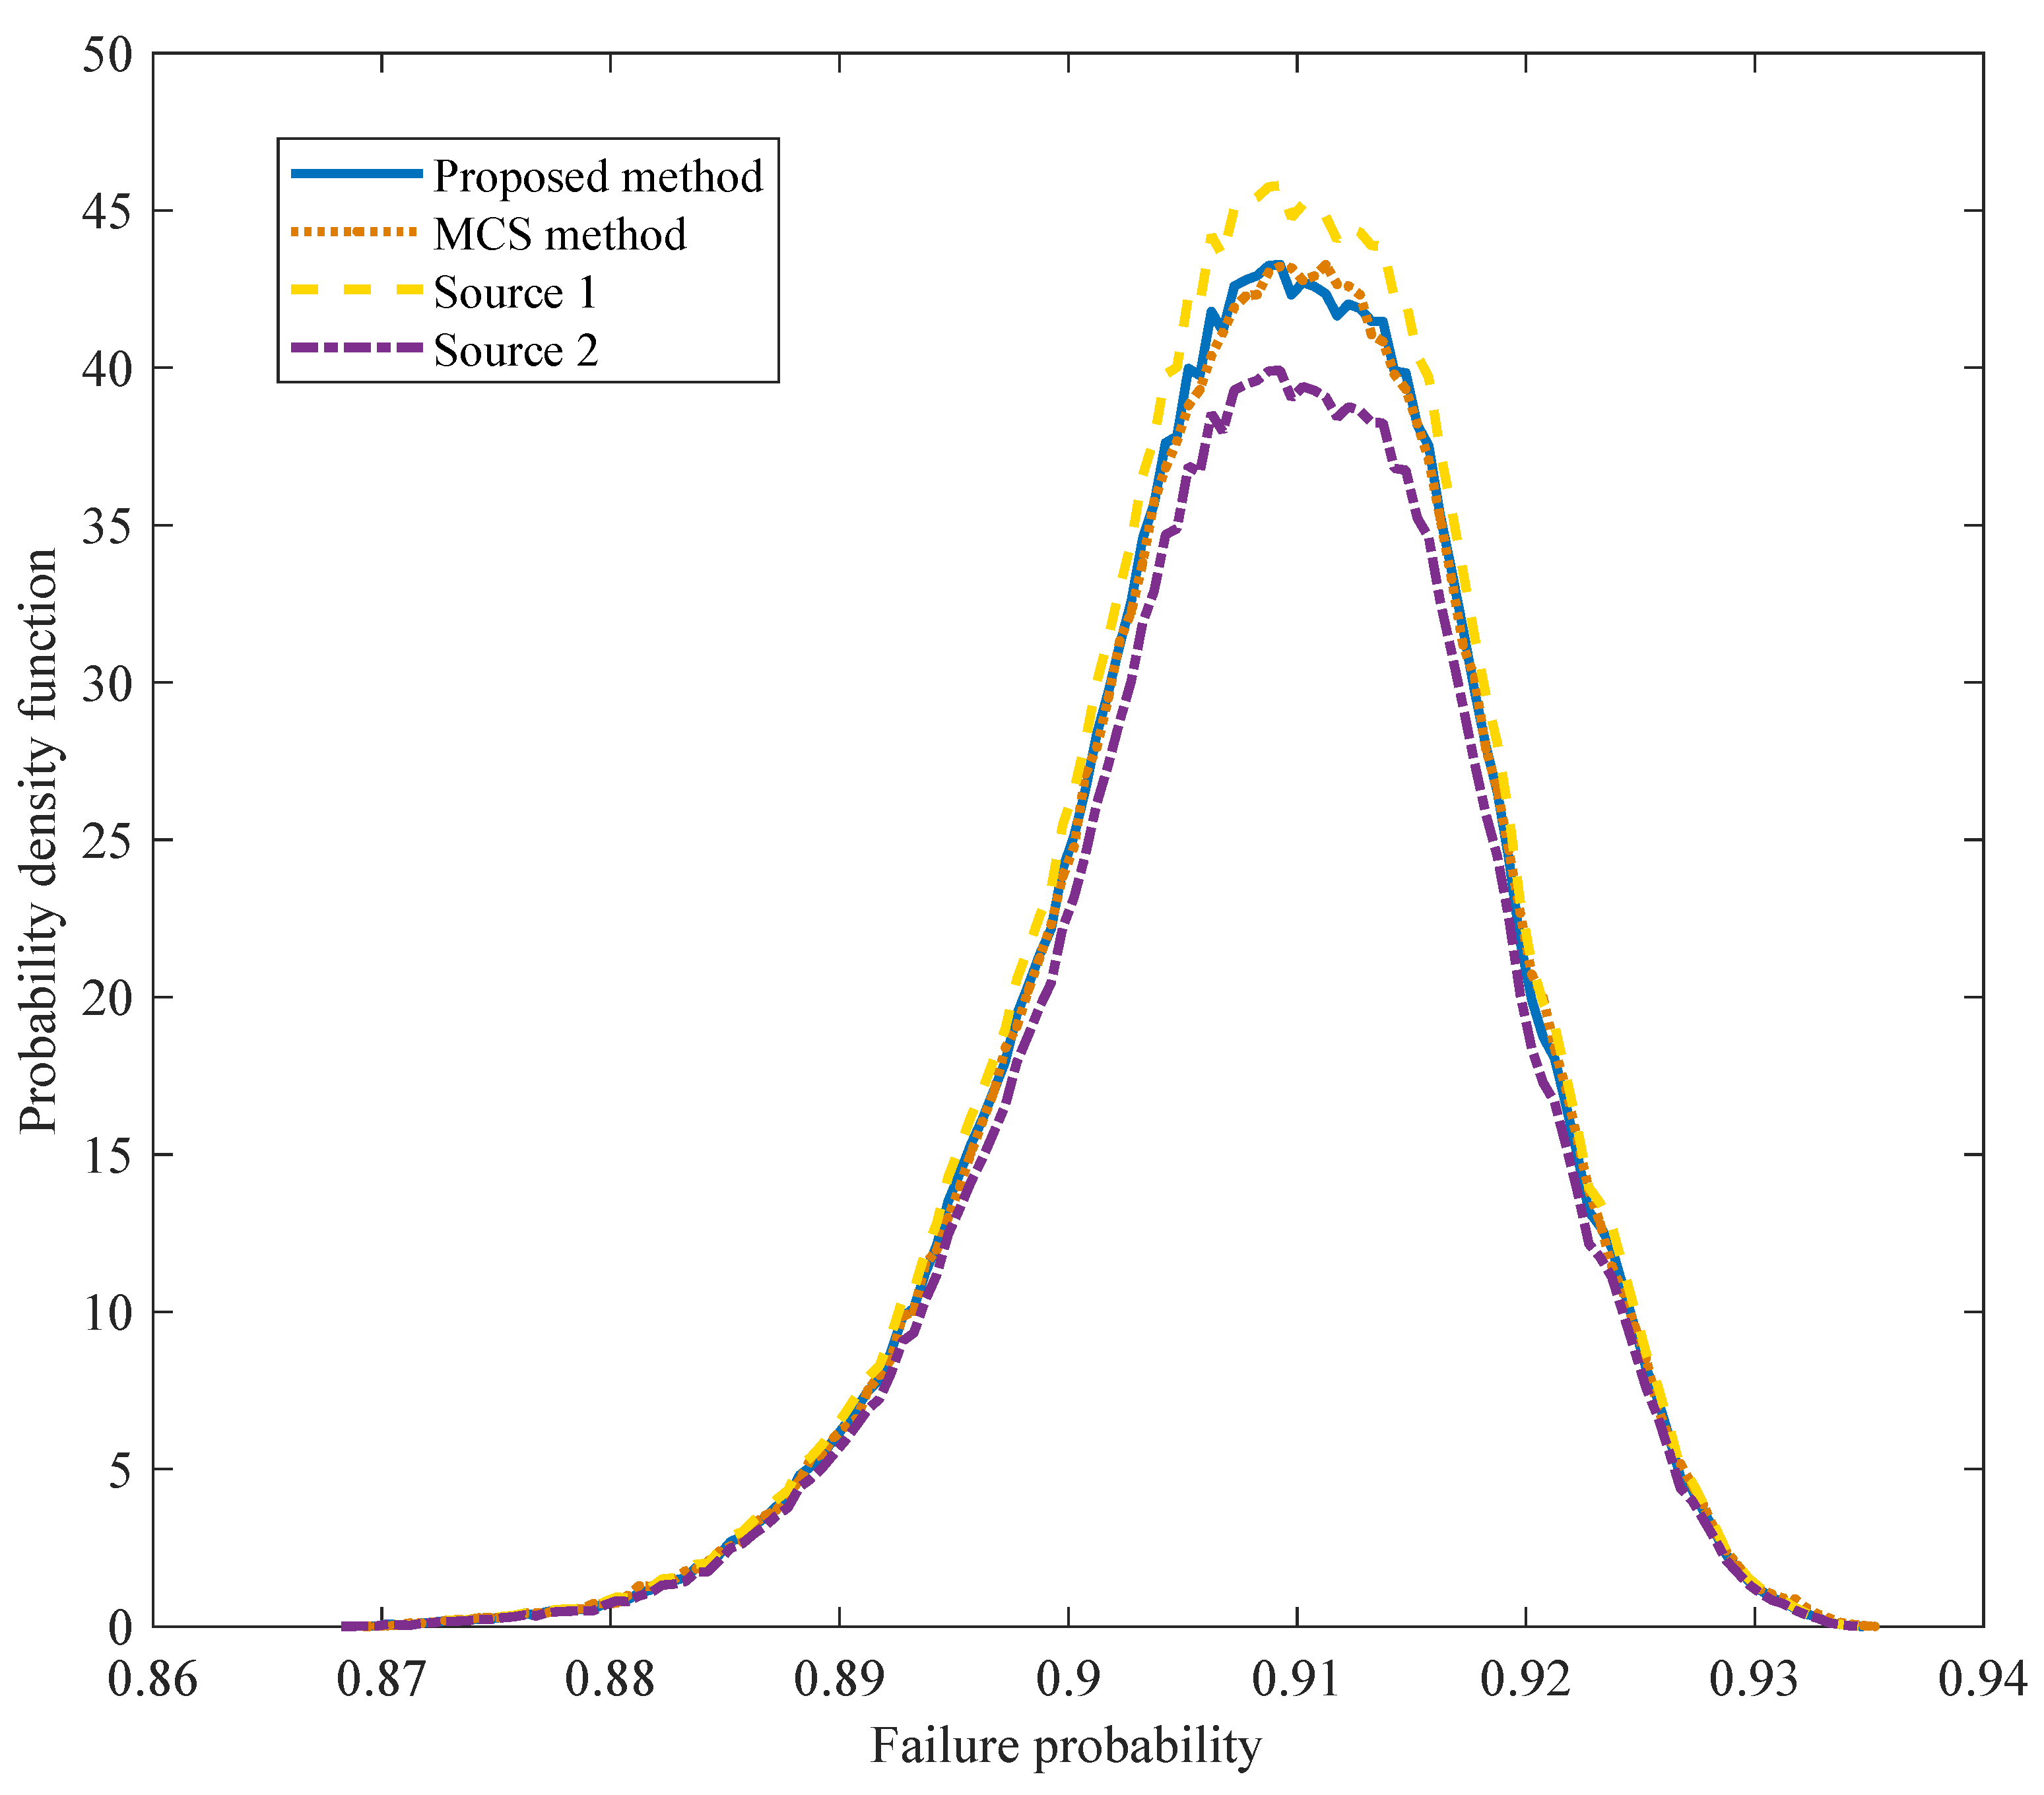
The hybrid reliability is analysed using the proposed algorithm, then the belief and plausibility results for different reliability limit states
are calculated. The reliability results comparison in
Figure 4 shows that the results of the proposed method are identical to those of the Monte Carlo method, confirming the effectiveness of the proposed method. In order to further illustrate the effectiveness of the proposed algorithm, the reliability indices considering sampling information from Source 1 or Source 2 are calculated, which are also shown in
Figure 4. The proposed algorithm can obtain more accurate reliability indices compared with results under sampling information from a single source, which can also indicate the effectiveness of the proposed method.
6.2. Example of Composite Laminated Plate
The proposed method is also applied in the reliability analysis of an 8-layer composite laminated plate made of AS4 carbon/3501-6 epoxy obtained from [
44]. The considered micro uncertainty parameters contain material property parameters (longitudinal elastic modulus of fiber
, transverse modulus of fiber
, elastic modulus of matrix
, fiber volume ratio
, major Poisson’s ratio of fiber
, Poisson’s ratio of matrix
, in-plane shear modulus of fiber
), and strength parameters (longitudinal tensile strength of fiber
, transverse tensile strength of matrix
, compressive strength of matrix
and shear strength of matrix
), which are assumed to be Normal distribution functions according to [
45]. The first uncertainty parameter (mean value) of
is assumed to be uncertain. The insufficient data from Source 1 contain sparse sampling points of
Pa and multiple intervals of
Pa, and the sub-intervals with their corresponding BPAs from Source 2 are listed in
Table 3.
The hybrid reliability of the 8-layer composite laminated plate is analyzed using the proposed algorithm. The reliability results of the proposed method and Monte Carlo method are compared in
Figure 5; the reliability indices considering uncertainty information from single source are also calculated. Compared with the results under single data source, the proposed method can obtain a more accurate reliability result, and the computational effort is less than that of the Monte Carlo method, which shows the effectiveness of the proposed method.
7. Conclusions
This article proposes a probabilistic reliability measure method that considers uncertainties of input variables and their distribution parameters simultaneously. The uncertain distribution parameters are represented through fusing the insufficient data and evidence theory data with a Gaussian interpolation method, and the epistemic uncertainty variables are probabilistically represented, taking account of uncertainties in the distribution parameters. The performance reliability index is calculated based on a linear approximation of the performance function. Through the proposed method, the reliability index of a crank-slider mechanism and a composite laminated plate are calculated considering the aleatoric uncertainty and epistemic uncertainty with uncertain distribution parameters. The comparison results with the Monte Carlo method demonstrate that the proposed method is accurate and efficient.
Author Contributions
Conceptualization, Y.L. and X.P.; methodology, Y.L. and Z.L.; software, Y.L. and Z.L.; validation, X.P., Z.L., J.T., and C.Q.; formal analysis, Y.L. and Z.L.; investigation, Y.L. and X.P.; resources, C.Q.; data curation, C.Q.; writing—original draft preparation, Y.L.; writing—review and editing, Z.L., X.P., J.T. and C.Q.; visualization, Y.L. and X.P.; supervision, Z.L.; project administration, J.T.; funding acquisition, Z.L. and J.T. All authors have read and agreed to the published version of the manuscript.
Funding
This research was funded by National Natural Science Foundation of China (grant number 51935009, 51875525 and 51875517) and the Zhejiang Provincial Natural Science Foundation of China [grant number LY21E050008 and LY20E050015].
Conflicts of Interest
The authors declare no conflict of interest.
References
- Li, Y.; Chen, G.; Sun, D.; Gao, Y.; Wang, K. Dynamic analysis and optimization design of a planar slider–crank mechanism with flexible components and two clearance joints. Mech. Mach. Theory 2016, 99, 37–57. [Google Scholar] [CrossRef]
- Qian, J.; Yi, J.; Zhang, J.; Cheng, Y.; Liu, J. An Entropy Weight-Based Lower Confidence Bounding Optimization Approach for Engineering Product Design. Appl. Sci. 2020, 10, 3554. [Google Scholar] [CrossRef]
- Jiang, C.; Fu, C.M.; Ni, B.Y.; Han, X. Interval arithmetic operations for uncertainty analysis with correlated interval variables. Acta Mech. Sin. 2016, 32, 743–752. [Google Scholar] [CrossRef]
- Wang, W.; Gao, H.; Zhou, C.; Zhang, Z. Reliability analysis of motion mechanism under three types of hybrid uncertainties. Mech. Mach. Theory 2018, 121, 769–784. [Google Scholar] [CrossRef]
- Cheng, J.; Zhang, Y.; Feng, Y.; Liu, Z.; Tan, J. Structural Optimization of a High-Speed Press Considering Multi-Source Uncertainties Based on a New Heterogeneous TOPSIS. Appl. Sci. 2018, 8, 126. [Google Scholar] [CrossRef]
- Huang, Z.; Xu, J.; Yang, T.; Li, F.; Deng, S. Evidence-Theory-Based Robust Optimization and Its Application in Micro-Electromechanical Systems. Appl. Sci. 2019, 9, 1457. [Google Scholar] [CrossRef]
- Naskar, S.; Mukhopadhyay, T.; Sriramula, S. Probabilistic micromechanical spatial variability quantification in laminated composites. Compos. B Eng. 2018, 151, 291–325. [Google Scholar] [CrossRef]
- Oladyshkin, S.; Nowak, W. Data-driven uncertainty quantification using the arbitrary polynomial chaos expansion. Reliab. Eng. Syst. Saf. 2012, 106, 179–190. [Google Scholar] [CrossRef]
- Liu, H.; Jiang, C.; Xiao, Z. Efficient uncertainty propagation for parameterized p-box using sparse-decomposition-based polynomial chaos expansion. Mech. Syst. Signal Process. 2020, 138, 106589. [Google Scholar] [CrossRef]
- Peng, X.; Gao, Q.; Li, J.; Liu, Z.; Yi, B.; Jiang, S. Probabilistic Representation Approach for Multiple Types of Epistemic Uncertainties Based on Cubic Normal Transformation. Appl. Sci. 2020, 10, 4698. [Google Scholar] [CrossRef]
- Dey, S.; Mukhopadhyay, T.; Naskar, S.; Dey, T.; Chalak, H.; Adhikari, S. Probabilistic characterisation for dynamics and stability of laminated soft core sandwich plates. J. Sandw. Struct. Mater. 2019, 21, 366–397. [Google Scholar] [CrossRef]
- Ghasemi, H.; Rafiee, R.; Zhuang, X.; Muthu, J.; Rabczuk, T. Uncertainties propagation in metamodel-based probabilistic optimization of CNT/polymer composite structure using stochastic multi-scale modeling. Comput. Mater. Sci. 2014, 85, 295–305. [Google Scholar] [CrossRef]
- Xiao, S.; Lu, Z.; Wang, P. Multivariate Global Sensitivity Analysis Based on Distance Components Decomposition. Risk Anal. 2018, 38, 2703–2721. [Google Scholar] [CrossRef] [PubMed]
- Yun, W.; Lu, Z.; Jiang, X. An efficient sampling approach for variance-based sensitivity analysis based on the law of total variance in the successive intervals without overlapping. Mech. Syst. Signal Process. 2018, 106, 495–510. [Google Scholar] [CrossRef]
- Li, J.; Wang, B.J.; Zhou, J. The reliability-based design and optimization procedures for a heavy-duty pallet system. Adv. Mech. Eng. 2018, 10, 168781401775175. [Google Scholar] [CrossRef]
- Chen, Z.; Li, X.; Chen, G.; Gao, L.; Qiu, H.; Wang, S. A probabilistic feasible region approach for reliability-based design optimization. Struct. Multidiscip. Optim. 2018, 57, 359–372. [Google Scholar] [CrossRef]
- Peng, X.; Guo, Y.; Qiu, C.; Wu, H.; Li, J.; Chen, G.; Jiang, S.; Liu, Z. Reliability optimization design for composite laminated plate considering multiple types of uncertain parameters. Eng. Optim. 2021, 53, 221–236. [Google Scholar] [CrossRef]
- Fan, C.; Lu, Z.; Shi, Y. Safety life analysis under the required failure possibility constraint for structure involving fuzzy uncertainty. Struct. Multidiscip. Optim. 2018, 58, 287–303. [Google Scholar] [CrossRef]
- Schöbi, R.; Sudret, B. Structural reliability analysis for p-boxes using multi-level meta-models. Probab. Eng. Eng. Mech. 2017, 48, 27–38. [Google Scholar] [CrossRef]
- Liu, X.; Wang, X.; Xie, J.; Li, B. Construction of probability box model based on maximum entropy principle and corresponding hybrid reliability analysis approach. Struct. Multidiscip. Optim. 2020, 61, 599–617. [Google Scholar] [CrossRef]
- Bae, H.R.; Grandhi, R.V.; Canfield, R.A. Epistemic uncertainty quantification techniques including evidence theory for large-scale structures. Comput. Struct. 2004, 82, 1101–1112. [Google Scholar] [CrossRef]
- Jiang, C.; Zhang, Z.; Han, X.; Liu, J. A novel evidence-theory-based reliability analysis method for structures with epistemic uncertainty. Comput. Struct. 2013, 129, 1–12. [Google Scholar] [CrossRef]
- Long, X.; Mao, D.; Jiang, C.; Wei, F.; Li, G. Unified uncertainty analysis under probabilistic, evidence, fuzzy and interval uncertainties. Comput. Meth. Appl. Mech. Eng. 2019, 355, 1–26. [Google Scholar] [CrossRef]
- Fuh, C.F.; Jea, R.; Su, J.S. Fuzzy system reliability analysis based on level (λ,1) interval-valued fuzzy numbers. Inf. Sci. 2014, 272, 185–197. [Google Scholar] [CrossRef]
- Lü, H.; Yang, K.; Huang, X.; Yin, H.; Shangguan, W.B.; Yu, D. An efficient approach for the design optimization of dual uncertain structures involving fuzzy random variables. Comput. Meth. Appl. Mech. Eng. 2020, 371, 113331. [Google Scholar] [CrossRef]
- Jiang, C.; Zhang, Q.F.; Han, X.; Qian, Y.H. A non-probabilistic structural reliability analysis method based on a multidimensional parallelepiped convex model. Acta Mech. 2014, 225, 383–395. [Google Scholar] [CrossRef]
- Xie, S.; Pan, B.; Du, X. High dimensional model representation for hybrid reliability analysis with dependent interval variables constrained within ellipsoids. Struct. Multidiscip. Optim. 2017, 56, 1493–1505. [Google Scholar] [CrossRef]
- Sankararaman, S.; Mahadevan, S. Likelihood-based representation of epistemic uncertainty due to sparse point data and/or interval data. Reliab. Eng. Syst. Saf. 2011, 96, 814–824. [Google Scholar] [CrossRef]
- Sankararaman, S.; Mahadevan, S. Distribution type uncertainty due to sparse and imprecise data. Mech. Syst. Signal Process. 2013, 37, 182–198. [Google Scholar] [CrossRef]
- Zaman, K.; Rangavajhala, S.; McDonald, M.P.; Mahadevan, S. A probabilistic approach for representation of interval uncertainty. Reliab. Eng. Syst. Saf. 2011, 96, 117–130. [Google Scholar] [CrossRef]
- Zaman, K.; Dey, P.R. Likelihood-based representation of epistemic uncertainty and its application in robustness-based design optimization. Struct. Multidiscip. Optim. 2017, 56, 767–780. [Google Scholar] [CrossRef]
- Choi, C.K.; Yoo, H.H. Stochastic inverse method to identify parameter random fields in a structure. Struct. Multidiscip. Optim. 2016, 54, 1557–1571. [Google Scholar] [CrossRef]
- Zhao, Y.G.; Zhang, X.Y.; Lu, Z.H. Complete monotonic expression of the fourth-moment normal transformation for structural reliability. Comput. Struct. 2018, 196, 186–199. [Google Scholar] [CrossRef]
- Zhao, Y.G.; Zhang, X.Y.; Lu, Z.H. A flexible distribution and its application in reliability engineering. Reliab. Eng. Syst. Saf. 2018, 176, 1–12. [Google Scholar] [CrossRef]
- Wang, P.; Lu, Z.; Xiao, S. A generalized separation for the variance contributions of input variables and their distribution parameters. Appl. Math. Model. 2017, 47, 381–399. [Google Scholar] [CrossRef]
- Wang, P.; Lu, Z.; Xiao, S. Variance-based sensitivity analysis with the uncertainties of the input variables and their distribution parameters. Commun. Stat. Simul. Comput. 2018, 47, 1103–1125. [Google Scholar] [CrossRef]
- Zhang, Z.; Wang, J.; Jiang, C.; Huang, Z.L. A new uncertainty propagation method considering multimodal probability density functions. Struct. Multidiscip. Optim. 2019, 60, 1983–1999. [Google Scholar] [CrossRef]
- Zhang, Z.; Jiang, C.; Han, X.; Ruan, X. A high-precision probabilistic uncertainty propagation method for problems involving multimodal distributions. Mech. Syst. Signal Process. 2019, 126, 21–41. [Google Scholar] [CrossRef]
- McFarland, J.; DeCarlo, E. A Monte Carlo framework for probabilistic analysis and variance decomposition with distribution parameter uncertainty. Reliab. Eng. Syst. Saf. 2020, 197, 106807. [Google Scholar] [CrossRef]
- Wei, P.; Liu, F.; Valdebenito, M.; Beer, M. Bayesian probabilistic propagation of imprecise probabilities with large epistemic uncertainty. Mech. Syst. Signal Process. 2021, 149, 107219. [Google Scholar] [CrossRef]
- Wang, L.; Pan, R.; Wang, X.; Fan, W.; Xuan, J. A Bayesian reliability evaluation method with different types of data from multiple sources. Reliab. Eng. Syst. Saf. 2017, 167, 128–135. [Google Scholar] [CrossRef]
- Peng, X.; Li, J.; Jiang, S. Unified uncertainty representation and quantification based on insufficient input data. Struct. Multidiscip. Optim. 2017, 56, 1305–1317. [Google Scholar] [CrossRef]
- Zhang, J.; Deng, Y. A method to determine basic probability assignment in the open world and its application in data fusion and classification. Appl. Intell. 2017, 46, 934–951. [Google Scholar] [CrossRef]
- Thapa, M.; Mulani, S.B.; Walters, R.W. Stochastic multi-scale modeling of carbon fiber reinforced composites with polynomial chaos. Compos. Struct. 2019, 213, 82–97. [Google Scholar] [CrossRef]
- Peng, X.; Ye, T.; Li, J.; Wu, H.; Jiang, S.; Chen, G. Multi-scale uncertainty quantification of composite laminated plate considering random and interval variables with data driven PCE method. Mech. Adv. Mater. Struct. 2020. [Google Scholar] [CrossRef]
| Publisher’s Note: MDPI stays neutral with regard to jurisdictional claims in published maps and institutional affiliations. |
© 2021 by the authors. Licensee MDPI, Basel, Switzerland. This article is an open access article distributed under the terms and conditions of the Creative Commons Attribution (CC BY) license (http://creativecommons.org/licenses/by/4.0/).


