Article

Innovative Hydrogeophysical Approaches as Aids to Assess Hungarian Groundwater Bodies

1
MTA-ME Geoengineering Research Group, University of Miskolc, H-3515 Miskolc-Egyetemváros, Hungary
2
Indian Institute of Technology, Department of Earth Sciences, Roorkee 247667, India
3
MTA CSFK, Geodetic and Geophysical Institute, P.O. Box 5, H-9401 Sopron, Hungary
*
Author to whom correspondence should be addressed.
Appl. Sci. 2021, 11(5), 2099; https://doi.org/10.3390/app11052099
Submission received: 8 January 2021 / Revised: 9 February 2021 / Accepted: 22 February 2021 / Published: 26 February 2021
(This article belongs to the Section Earth Sciences)

Abstract

:
The Hungarian water management plan has lately identified 185 groundwater bodies based on the concepts given by the European Water Framework Directive. Achieving and maintaining the good quantitative and chemical status of these groundwater bodies is of primary importance. It is demonstrated how innovative hydrogeophysical methods can be applied successfully to assess the Hungarian or other international groundwater bodies. By applying geoelectric methods, horizontal layering or large uniform rock units can be well characterized by Wenner–Schlumberger array, also enabling accurate depth determination of the shallow groundwater table. Horizontal variations in the rock type or its state can be well described by dipole–dipole array or, even better, by the newly developed quasi-null arrays. Their joint application may be very straightforward to investigate different aquifer types by giving high-resolution resistivity images as input for hydrogeological modeling. In the identification of porous formations, multivariate statistical interpretation of wireline logs using cluster analysis allows reliable lithological separation of potential aquifers. Their clay content is estimated by robust factor analysis, while their hydraulic properties are directly derived from the resistivity log. For a more effective interpretation, a combination of surface and borehole geophysical methods can be recommended for meeting challenges in hydrogeology and groundwater management.

1. Introduction

The protection and sustainable use of water resources are core provisions of the European Union legislation [1]. The Water Framework Directive—setting the background for all other water-related directives—requires member states to assess the qualitative and quantitative status of all water bodies and to ensure the protection or restoration of their good chemical and ecological state. The recently adopted second National Watershed Management Plan [2] defines four cornerstones for future actions: avoiding the global water crisis, preserving our water resources, using their potential efficiently and safeguarding ourselves from water hazards. The key instrument towards these goals is integrated water resources management [3]. However, effective actions require a sound basis of knowledge and information.
In 2016, the Hungarian Academy of Sciences launched the National Water Research Program [4] to provide the scientific evidence base for implementing the strategic targets of the National Water Strategy. This baseline document provides a concise overview of the situation, based predominantly on the extensive documentation developed as part of the revision process of the Hungarian River Basin Management Plan by the National Water Directorate under the Ministry of Interior. One hundred eighty-five different groundwater bodies were identified in the Hungarian River Basin Management Plan. The main goal is to achieve good quantitative and chemical status in the case of all groundwater bodies. Although this main objective seems to be quite simple, the whole work process needs much work from different experts. In this paper, it is demonstrated how different innovative hydrogeophysical approaches can be used effectively in this complex work to assess the Hungarian groundwater bodies. Table 1 summarizes 6 main challenges, which can be addressed by hydrogeophysical methods studied in this paper.
To handle the above challenges, a good alternative is the application of both surface geophysical and borehole logging methods. Surface geophysical methods can give an overview of large areas in a relatively short time for acceptable costs. They are also applicable to characterize smaller areas with greater accuracy. Well-logging methods, including lithology (natural gamma-ray intensity, spontaneous potential), porosity (density, neutron-porosity) and resistivity logs in contrary give information only to selected points of an area, but they can describe very detailed the vertical variations of, e.g., lithology and shaliness, porosity and water-saturation which are basic in situ parameters in hydrogeological studies. Hydrogeophysical methods have been widely used recently to investigate water-bearing formations and handle challenging problems in preserving groundwater resources [5]. Among many other efficient investigation techniques, geophysical surveying methods are easy to implement and relatively inexpensive, of course, taking into account its limitations, which generally apply to research depth and spatial resolution as well as the problem of ambiguity that may occur during the interpretation of surface geophysical data. To improve the evaluation of groundwater formations, we suggest using some innovative geophysical methods.
In problems related to groundwater, the relatively cost-effective electromagnetic [6,7,8] and direct current (DC) geoelectric methods [9,10] are the most convenient tools. In addition to that, these methods can well separate lithological units; they are sensitive to the presence and quantity of subsurface water. Geological features, such as, e.g., faults, fractures, caves, which have a great influence on groundwater movements, are also detectable by these methods. While in large-scale studies, particularly very-low-frequency (VLF), e.g., in [11], and radio-magnetotelluric (RMT) methods are used [12], the geoelectric method is applicable both in large-, and small-scale studies. 2D ERT measurements are often done with the aim of studying faults [13], fracture zones [14], fractures and fissures [15,16] or cavities [17], etc., that is in the prospection of hydrogeological interest. An additional practical overview of the geophysical methods applicable in hydrological studies is given in [18]. Fractures proved to be detectable by ground-penetrating radar (GPR) but with only 5 m resolution [19]. The GPR investigations carried out by [20] had at the same time very good resolution. They were, however, carried out on a quarry wall because the plateau above the cliff was covered with a conductive weathered layer, which drastically reduces the penetration depth of this method. In the study shown in [21], GPR and frequency–domain electromagnetic induction methods proved to be capable of detecting discrete fracture and conduit features. In the Kádárta area, the GPR measurements, in the other study site, in Sopron seismic measurements proved to be unable to fulfill the aim of the research.
The geoelectric method is one of the most often applied geophysical techniques for shallow subsurface investigations, among others, because the electric resistivity of the rocks varies in wide range enabling to distinguish different rocks. Since electrical resistivity depends strongly also on the water content of a rock, this method can be very successfully applied also in hydrogeological studies [22]. It can show the electrical resistivity distribution of the subsurface utilizing four electrodes. Between two of the electrodes (current electrodes), the current is forced to insert into the soil. The evolving electrical potential distribution can be measured on the surface using two other electrodes, the so-called potential electrodes. From the surface potential data, an inversion process enables the determination of the electric resistivity distribution of the subsurface. Traditionally two main types of geoelectric methods were applied: sounding was used to follow the vertical-, profiling the horizontal variations of the resistivity [23]. Actually, both of these types are joined by carrying out measurements by using numerous electrodes (e.g., 48, 60 or 72), which are laid out and computer controls, which ones are the current-, and which ones are the potential electrodes [24]. Such measurements are called electrical resistivity tomography (ERT), which can be two-, or three-dimensional (2D or 3D). Nowadays, the 2D measurements are the most often used, where the electrodes are laid in a line. The basis of the 2D measurements is the application of electrode arrays, and there are arrays, which are more convenient for sounding and arrays, which are better for profiling. For sounding the Wenner–Schlumberger (WS), profiling the dipole–dipole (Dp) array seems to be the best. Thus, WS is used to study mostly layered structures where the thickness and resistivity of the layers are the most important questions [23,25]. Furthermore, its robustness may be very favorable in a variable environment. If, however, the detection and characterization of a target with limited horizontal extent is the aim, application of the Dp array is recommended [23]. The Dp array proved to be the best among the traditional arrays in numerical simulations [25]. An optimized array set was constructed using traditional arrays by [26]. The optimized Stummer (St) configuration basis on the Dp array and is used to provide somewhat better results than the Dp array in itself [27]. Since it proved to be the most successful traditional configuration in numerical studies [25], it was also used to carry out measurements. In addition to these traditional arrays, the applicability of the recently developed γ11n arrays [28,29,30,31] has been studied. According to [30], the γ11n arrays have a larger depth of detectability values for 2D prismatic and vertical layer models than even the best traditional arrays if n is at least 2. In [31], numerous numerical examples were presented to demonstrate models, which can be better displayed by the γ11n arrays than by the traditional ones. These advantages of the γ11n arrays over the traditional ones also manifested in the quasi analog field [28] and quasi field situations [29].
In this paper, field studies carried out by geoelectric methods are first presented. Geoelectric results are ideally completed by well-logging ones. The applicability of this method is also demonstrated (Table 1). The above-mentioned challenges 1, 2 and 6 can be handled best by the Wenner–Schlumberger, challenges 3–4 by dipole–dipole and quasi null arrays, while challenge 5 by well logging. Since handling challenges 1 and 6 are more or less routinely done [32,33], here case studies will be presented, which demonstrate how to meet challenges 2–5. It must be mentioned that airborne geophysics and seismic surveys have a greater potential to map extensive areas and may appear as much more appropriate for groundwater assessment at a regional scale (e.g., in challenge 2). The further development of these large-scale and relatively expensive methods is out of the scope of our research; thus, they are not included in Table 1.

2. Materials and Methods

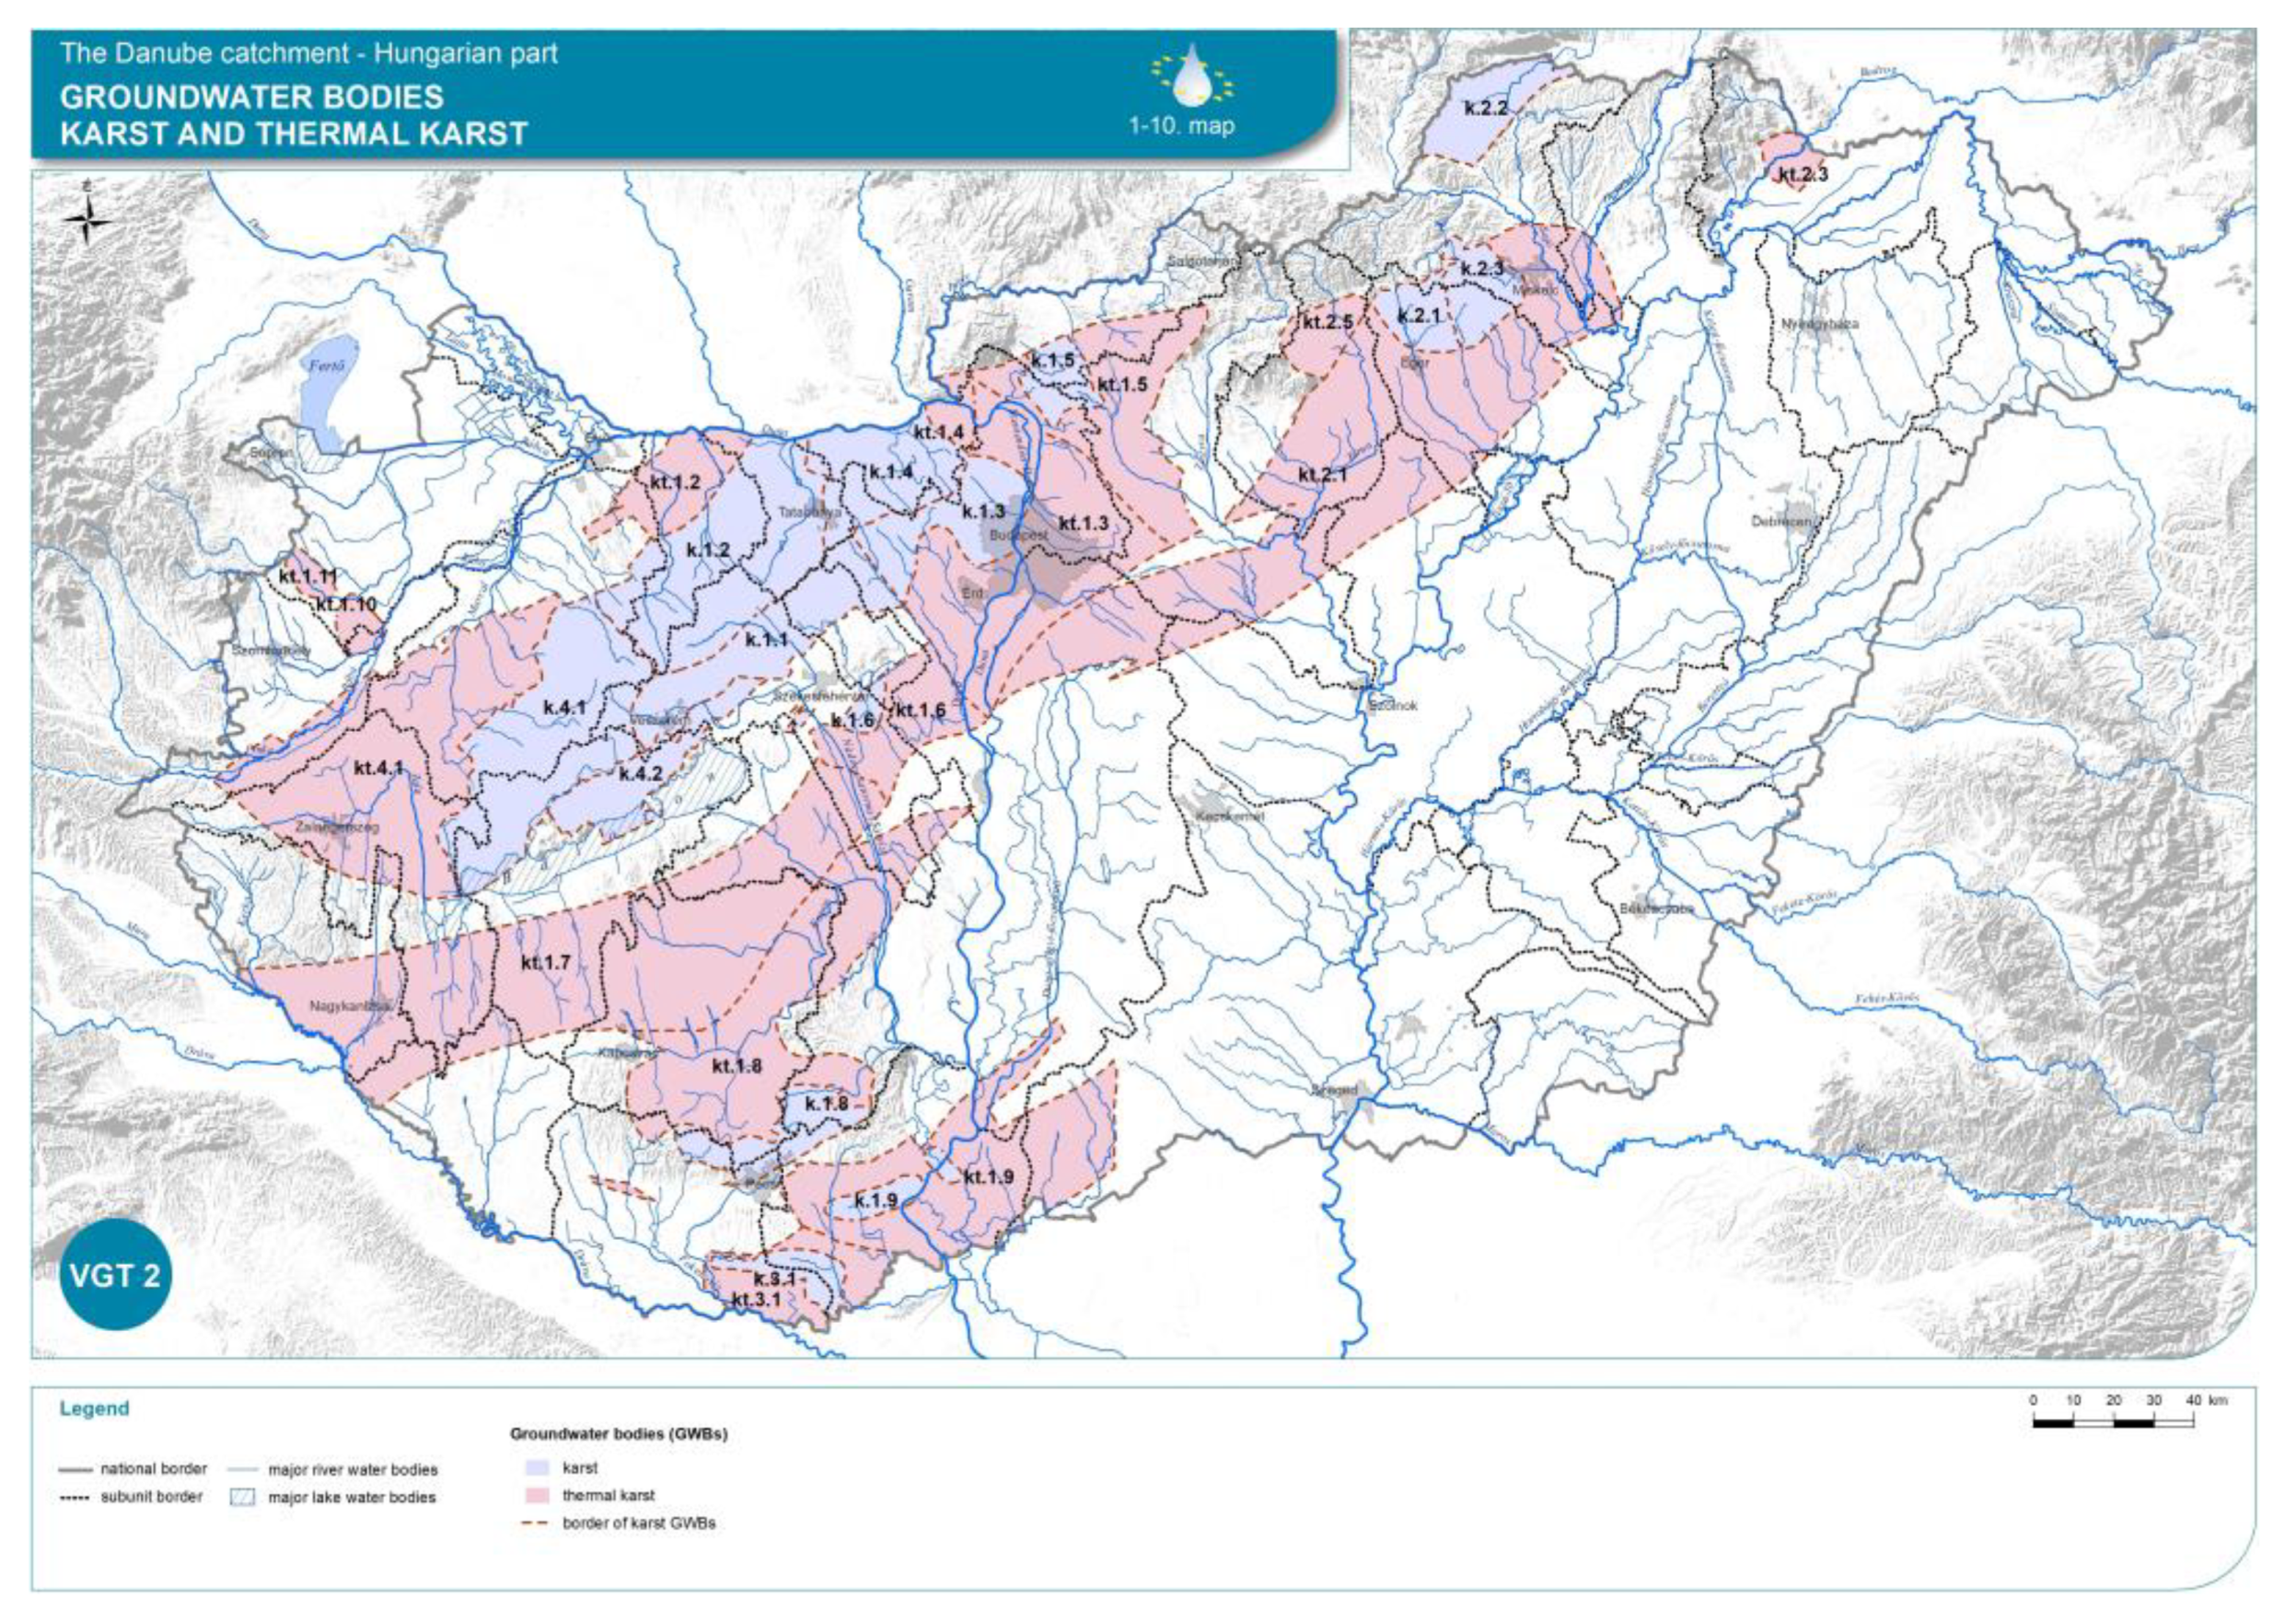
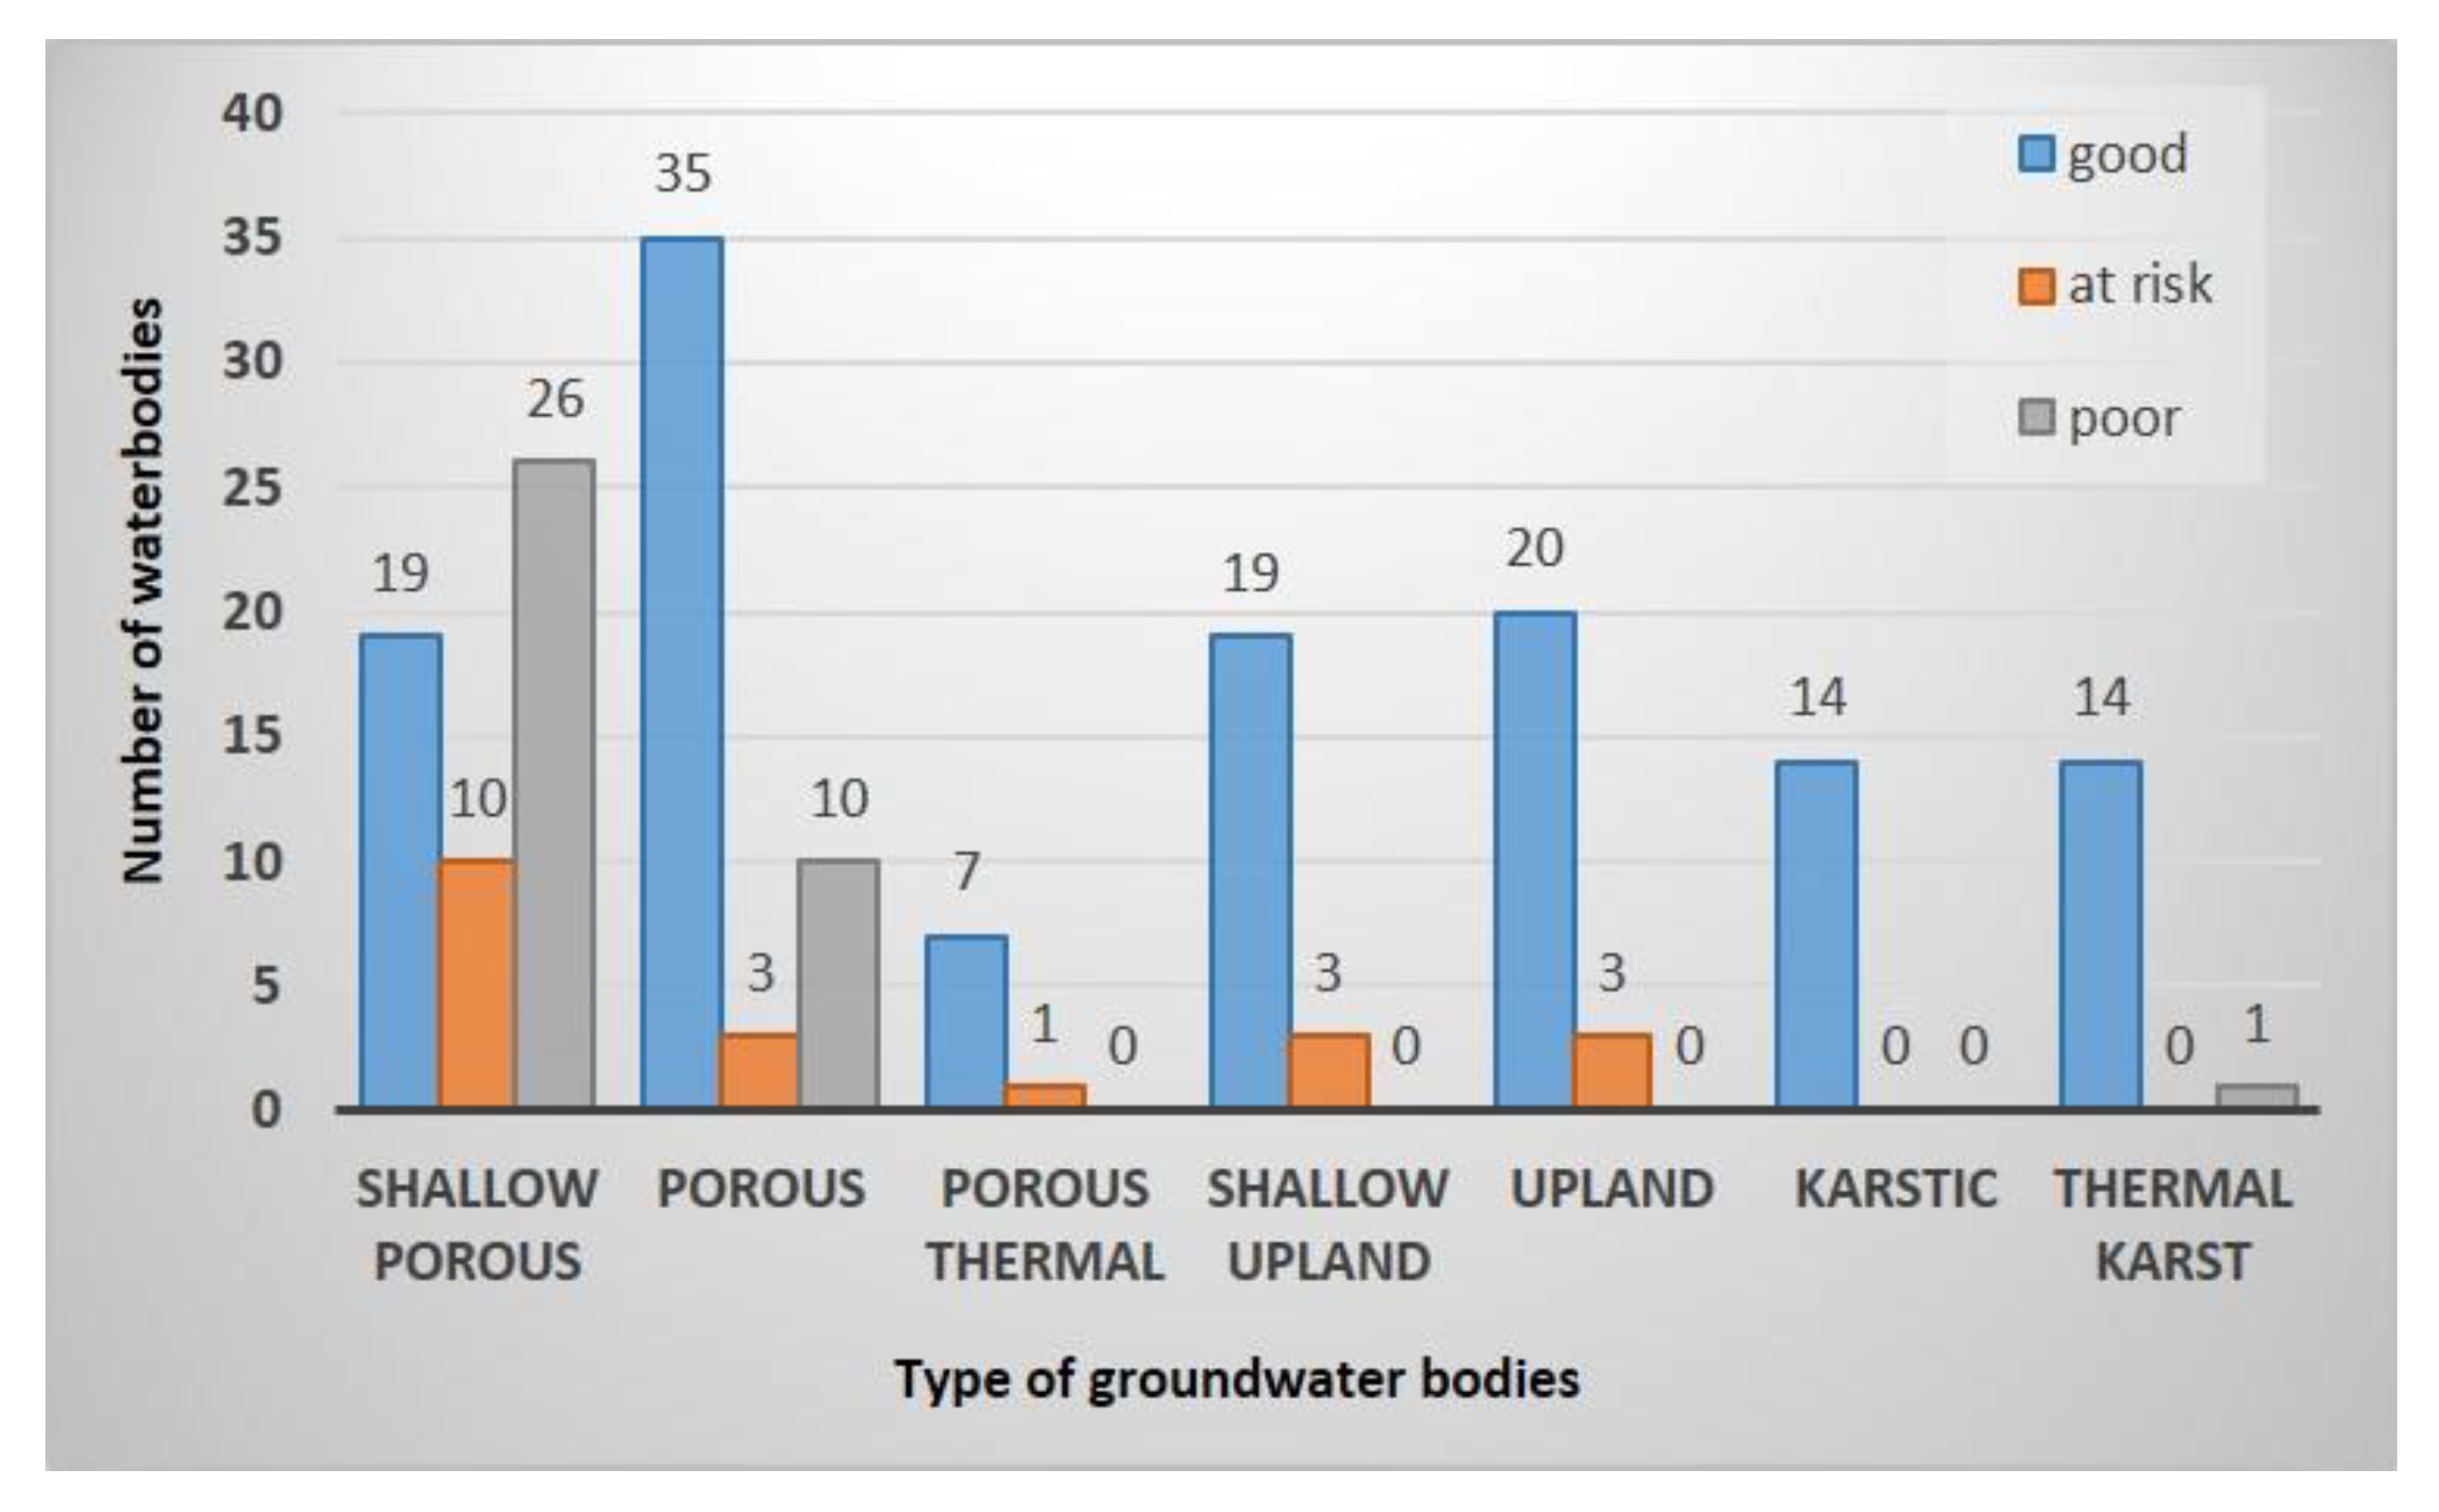
2.1. Conditions and the Relevant Situations of the Hungarian Groundwater Bodies
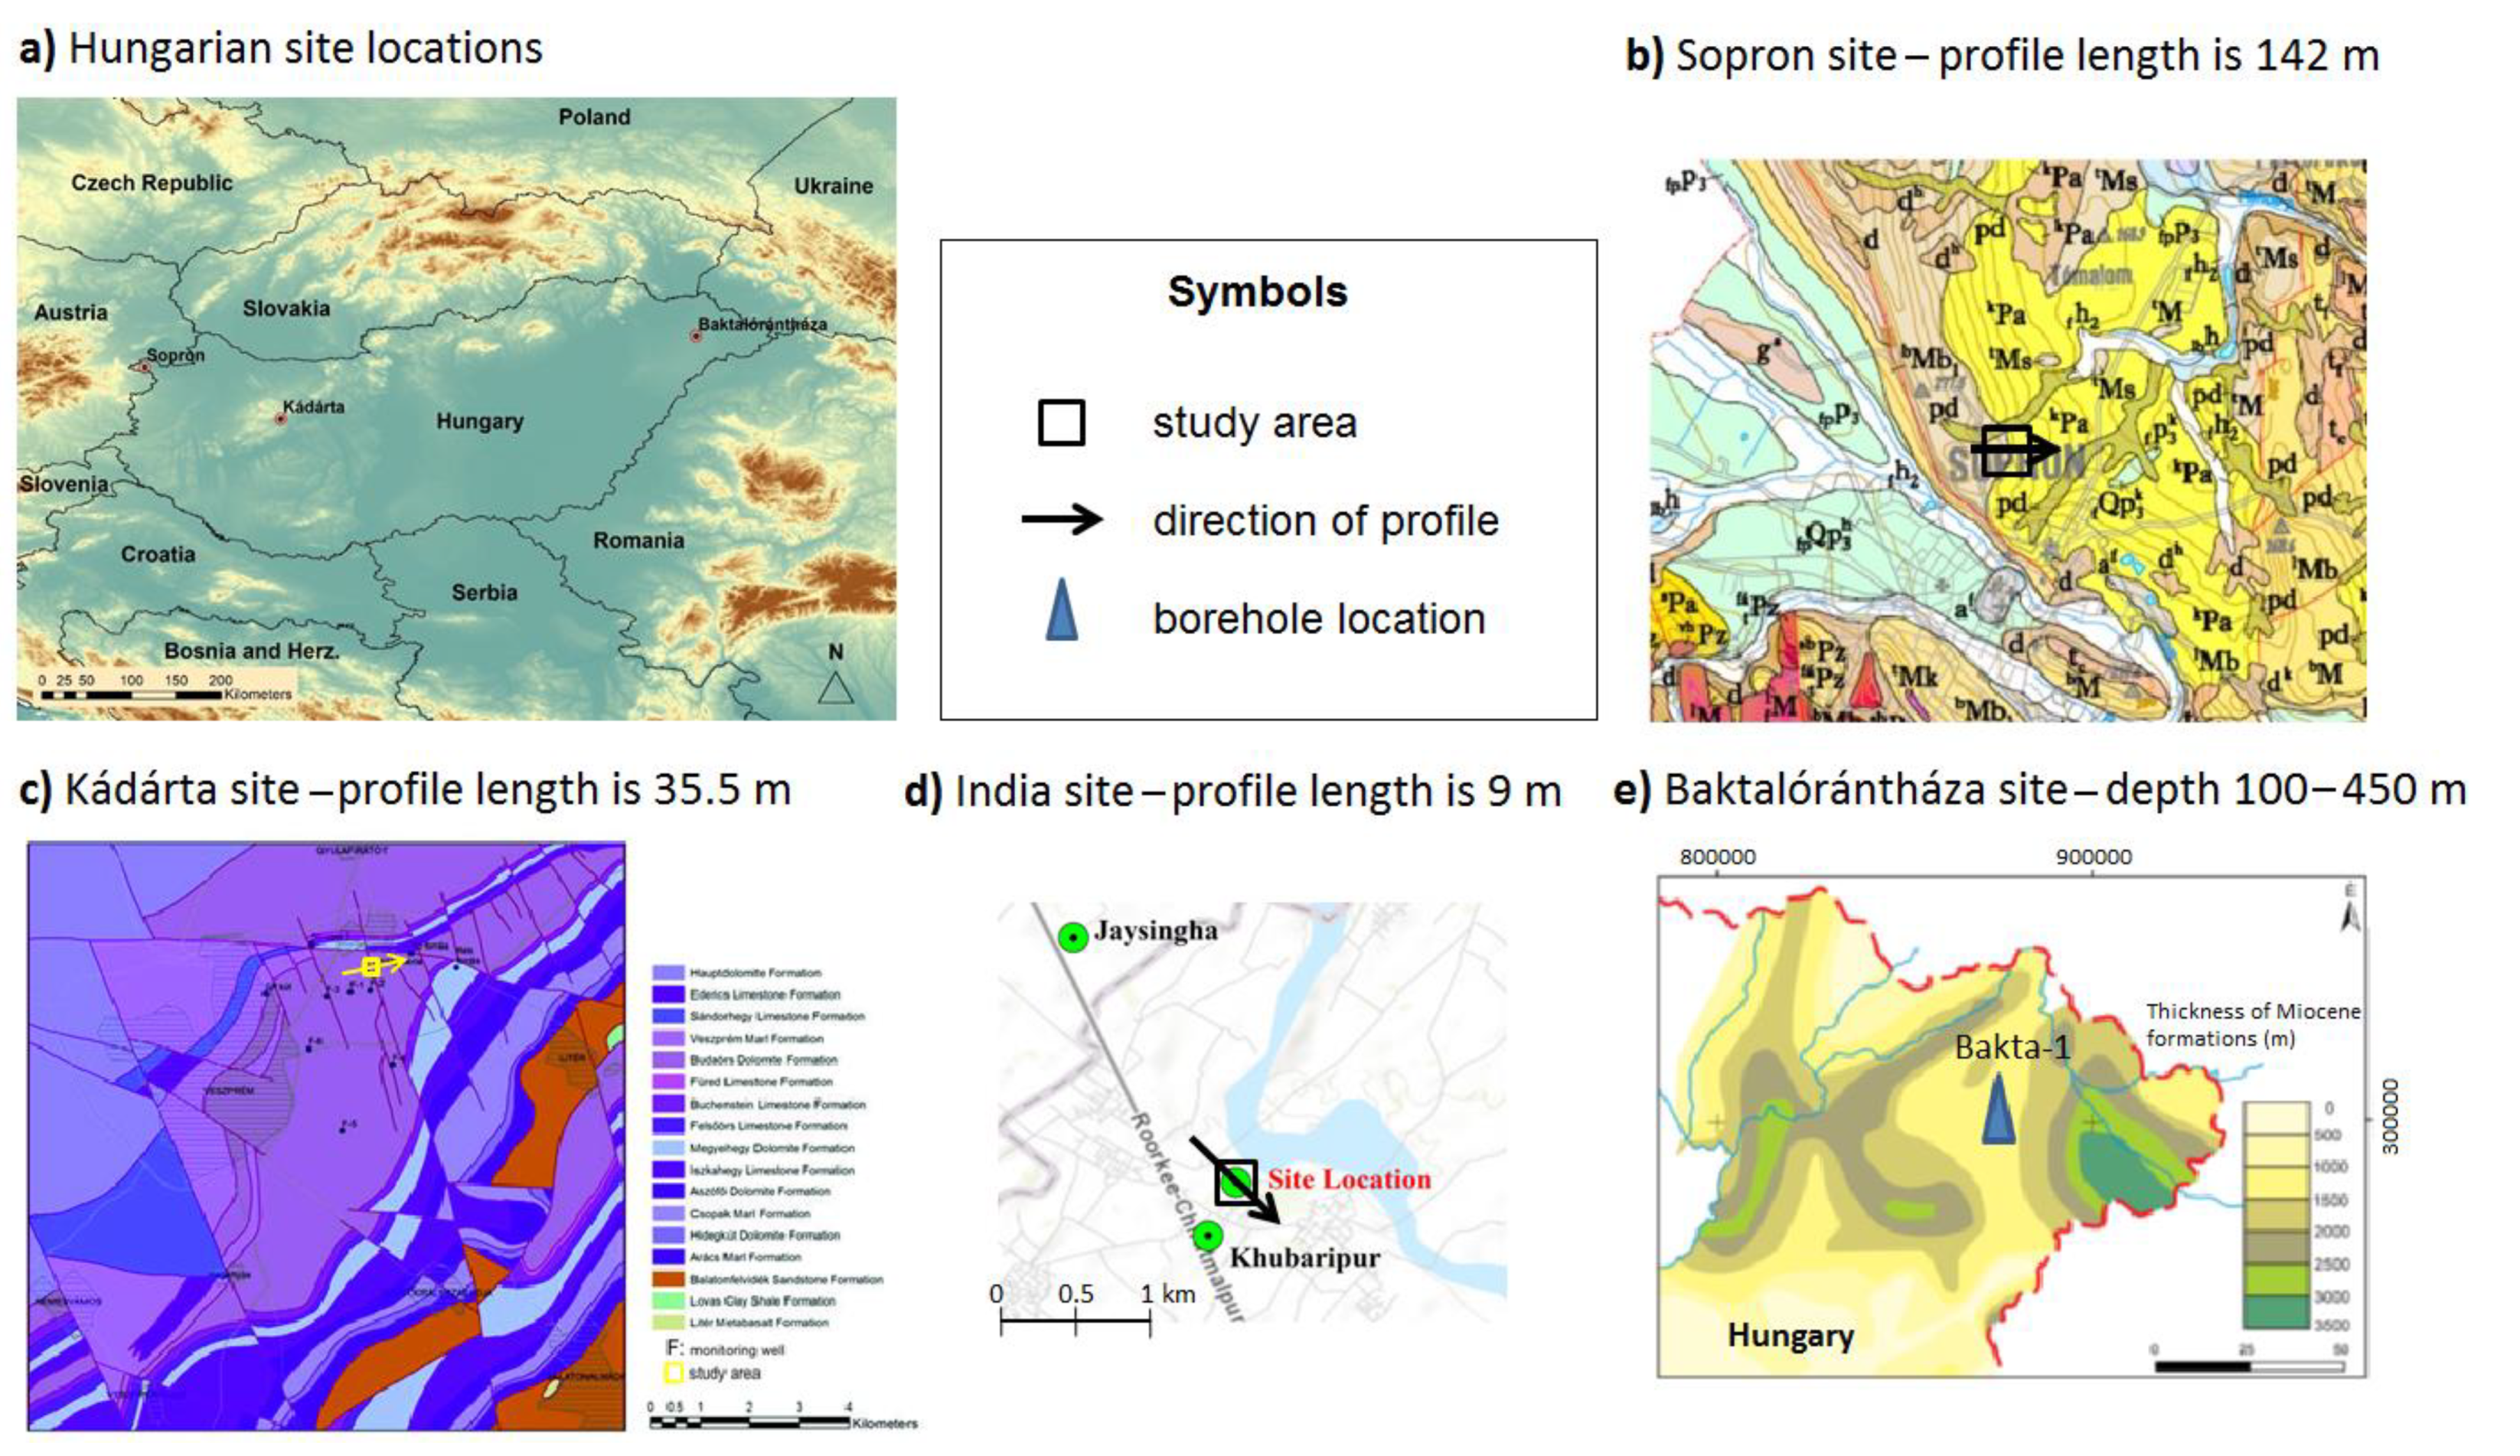
Groundwater resources play a major role in Hungary’s drinking water supply system [34]. More than 95% of our drinking water is provided from groundwater resources; meanwhile, Hungary is famous for its mineral, therapeutic, and thermal water supplies. Hydrogeologists have high professional responsibility to safeguard our groundwater resources and manage their sustainable utilization in quantitative and qualitative terms [35]. During the past years, hydrogeologist experts had to face numerous global or local environmental and social threats that have significant adverse effects on the environmental elements, especially on groundwater [36].
Hungary is located on the Danube watershed in the Carpathian Basin, which is one of the most closed basins of the world concerning the water budget. This geographical feature has especially important effects on surface waters and our groundwater resources. The River Basin Management plan of Hungary contains 185 groundwater bodies, out of which 40 are officially registered as transboundary aquifers; however, the actual dependency is even higher. Approximately 50% of the groundwater bodies are divided by the national border; thus, external effects also influence the quantity and quality of our groundwater resources. As valuable kinds of these groundwater bodies, thermal and thermal karstic water bodies and their designated boundaries are shown in Figure 1. These karst groundwater bodies, with their special fracture systems, are very sensitive to the effects of climate change or to the different surface contaminations.
Hungary shows a rather diverse geological and hydrogeological scene, where almost every unique and challenging feature can be observed in close vicinity to each other [37]. In addition to the hydrogeological features of our karstic mountains (that have a significant role in the drinking water supply), one can study the rather interesting water-bearing parameters of fractured volcanic, plutonic and metamorphic rocks. The Great Plain, which attracts international attention, and the Small Plain (Kisalföld) geographical units provide several problems to be solved by hydrogeologist experts. Among others, the reason for the unique natural variations is due to the relative thinness of the Earth’s crust under the Pannonian Basin and due to the even recently observed tectonic compression causing increasing pore pressure of deeper reservoirs and fluid containing strata of the basin. To interpret the reconstructed subsurface flow pattern of the Great Plain, one must divide the role of two driving energy sources. A gravity-driven flow system is found at shallow depth, and underneath, there is a pressurized flow system controlled by the tectonic compression [38]. The anticlines of the pre-Neogene Basin are the source areas of these highly pressurized regions. The pressure conditions are driven by sedimentation, raising the fluid temperature and tectonic compression. The vertical flow component shows uniformly upward in these deep, over-pressurized hydraulic flow systems. The contact zone of the two mentioned flow systems is very complex, and its depth is still unknown at certain points of the Great Plain. The shape and dynamic feature of the interaction zone varies significantly depending on the local topographical, meteorological and geological conditions. The geological matrix of the Great Plain consists of a complex, at some points 7000 m thick Neogene sediment overburden above the pre-Neogene basin. The porous structures in Hungary contain approximately 5000 km3 of water at a given time. This volume is the so-called static groundwater resource. Dynamic groundwater resources play a more important role in sustainable groundwater utilization; its estimated volume is approximately 2–3 km3/year [3].
The state of groundwater bodies is characterized by quantity and chemical quality. Of the 185 identified groundwater bodies, 37 were classified as poor and 20 as good but at risk of becoming poor [39]. Water balance and ecological state were the most frequently failed tests (19 and 18 water bodies, respectively). Most poor water bodies were shallow porous, or porous (26 and 10, respectively). None of the porous thermal, shallow upland, upland and karstic water bodies were classified poorly (Figure 2).
To maintain a safe national water supply network, the implementation of the national water resource protection program should be continued, applying it both to active and prospective water aquifers [40]. More than half of the 1700 drinking water sources are considered to be vulnerable; thus, the strategic importance of a safe drinking water supply can only be guaranteed by proper diagnostics and well-head protection of our water resources. In the frame of the drinking water quality improvement program, such hydrogeological and water management solutions should be applied that do not depend significantly on expensive water treatment technologies. From a technical perspective, it is inevitable to implement the reform of the water supply network in which hydrogeologists have some responsibility. It is a common interest that the technical expectations regarding the water supply network should increase significantly in the future, by this serving the further improvement of drinking water service quality and reliability, and the renewal of the aging infrastructure of waterworks and distribution. To date, the significant water loss in the distribution systems (in cases over 20–30%) [3] can negatively influence at certain places both the quality and quantity parameters of the water sources. As far as the perspective water resources considered our country is in a rather good condition. Taking into consideration the 2–2.5 million m3/day water discharge from groundwater bodies, our country has approximately 1 million m3/day total capacity perspective water resources, delineated mostly along the Danube and Tisza rivers’ gravel terrace [3].
In this study, we demonstrate the feasibility of newly proposed hydrogeophysical measurement techniques and data processing methods. The test areas in Hungary (and also in India) were selected to show the applicability of these innovative techniques, mostly related to challenges 1, 3, 4 and 5 in Table 1. The case studies represent typical problems in Hungary, where our results are validated with direct observations or core data. Instead of regional-scale assessments, we focus on the improvement of local evaluations; hence the aim of the study is to increase the resolution of geoelectric surveys, e.g., in fault and fracture detection and to improve the reliability of groundwater formation evaluation by interpreting all well logs simultaneously. We demonstrate the hydrogeological applications of unconventional geoelectric surveying techniques with special electrode arrays, while multivariate statistical processing of wireline logs is applied to rock typing and to estimate important hydrogeological parameters in an alternative way. Our investigations not just may help more accurate and reliable modeling of groundwater aquifers, but the assessment of groundwater bodies up on higher scales.

2.2. Study Sites

The location of the Hungarian study areas is illustrated in Figure 3a. Geoelectric measurements, which are presented in Section 3.1.1, were carried out in Sopron, West Hungary, over a series of faults, thus a step-like structure in limestone (Figure 3b). The ERT profile is perpendicular to the N-S-directed Kőhida-fault zone, which is the eastern boundary of the Sopron-Kismarton Basin (NW Hungary). The gneissic basement, which outcrops in a few hundred meters away, is overlaid by clay. The surface dips eastwards, most likely following the dipping of the bedrock.
The measurements, whose results are presented in Section 3.1.2, were carried out at the edge of a large plateau at the village of Kádárta, which lies close to the city of Veszprém, North West Hungary [41] (Figure 3c). The plateau is made up of middle-Triassic dolomite, which is characterized by N-S oriented strike-slip and normal faults [42]. The dolomite surface is overlain by thin (0.1–0.2 m) poor quality soils in this area. The aim of the study was to detect and characterize fracture zones and fractures since they are profoundly significant in hydrological respect because of their high hydraulic conductivity and water-bearing capacity.
Section 3.1.3 demonstrates the results obtained in Haridwar District, Uttarakhand State, India, in a sedimentary environment consisting of sand, sandy clays, clay and gravel. The investigated site is located at the bank of Solani river (latitude: 29.991266, longitude: 77.77679) in Khubaripur village, which is located about 18 km N38.170 W of Roorkee, Uttarakhand, India (Figure 3d). A well logging approach proposed in this paper is tested in Baktalórátháza-1 well drilled in Szabolcs-Szatmár-Bereg County, in northeast Hungary (Figure 3e). The location of the drilling is 2.1 km from Baktalórántháza village in the direction of the south-south-west (190 degrees). Maximal depth reached by measurements: 1197.70 m, where the bottom hole temperature was 53 Centigrade. The thickness map of Miocene sediments was established by [43]. The borehole did not show a good prospect of hydrocarbon exploration, but it still serves as productive thermal water well. An unconsolidated shaly sandy sequence of high storage capacity is investigated to conclude on the lithology and petrophysical/hydraulic properties of the groundwater formations.

2.3. The Applied Geophysical Methods

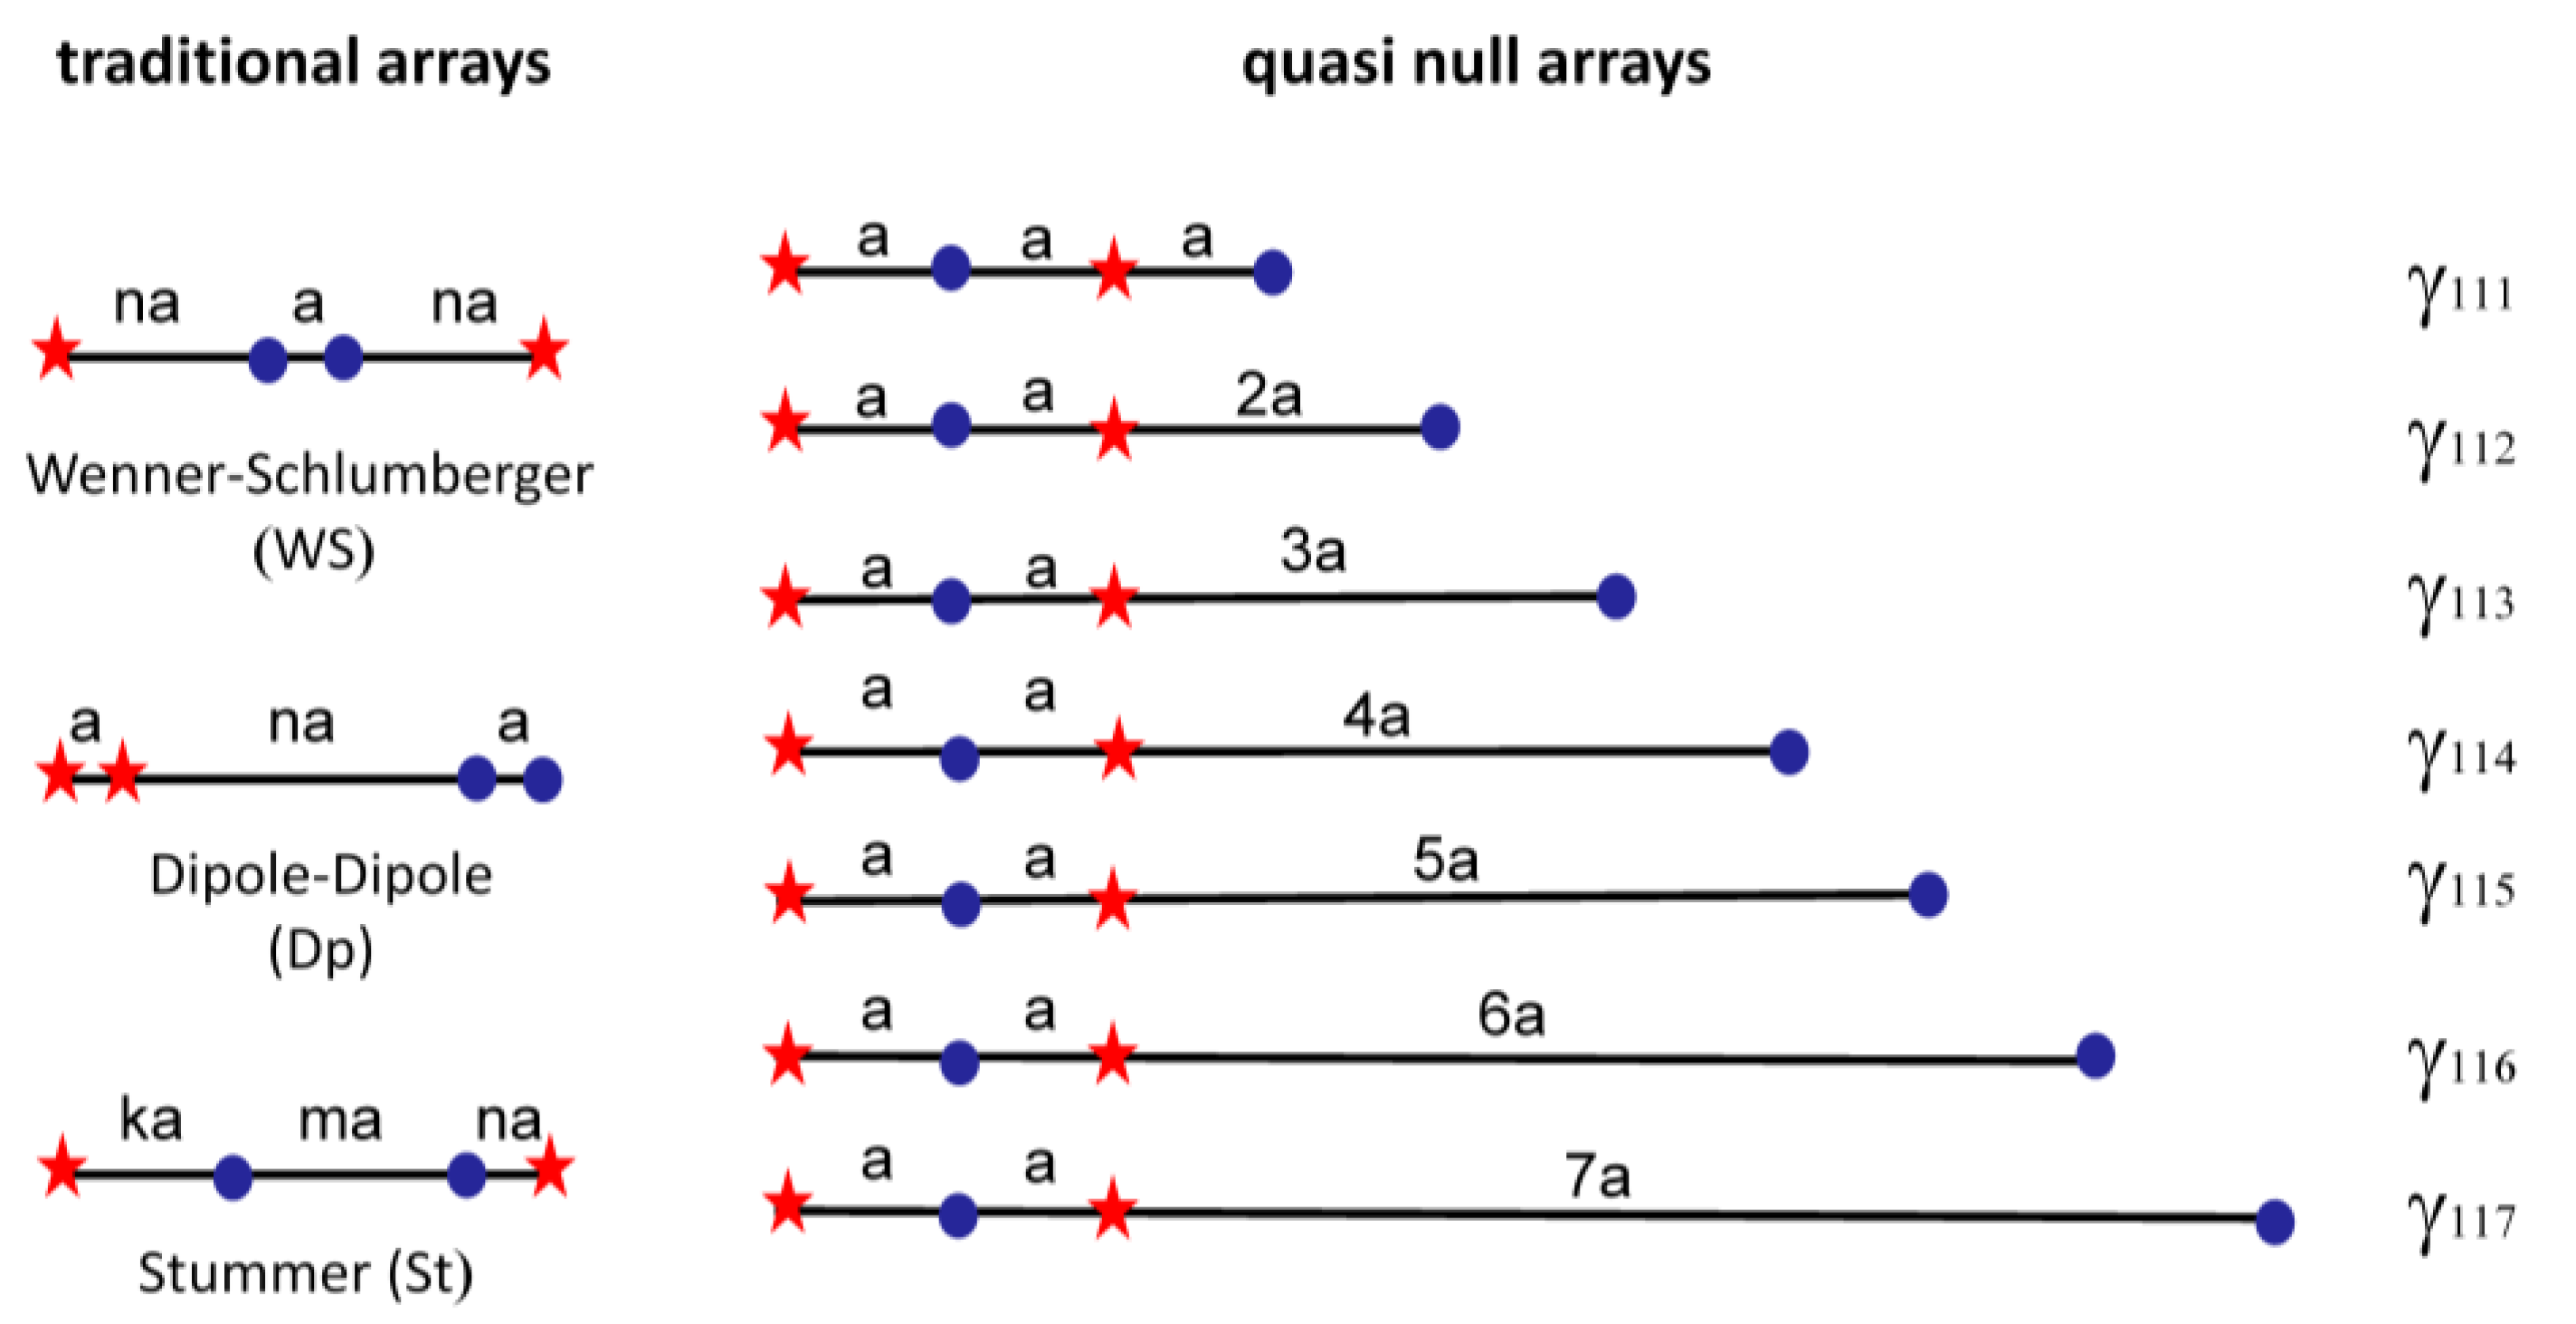
2.3.1. Geoelectric Surveying Methods

Recently, a new array set has been developed. Its strategy is the opposite of that of the traditionally used arrays, e.g., the Wenner–Schlumberger (WS) and the dipole–dipole (Dp) configurations (Figure 4). It measures very small, almost zero signals above homogeneous half-space. Due to this reason, they are called quasi null arrays [28]. It was shown that their depth of detectability values is larger than those of the traditional arrays [30]. Both numerical modeling [31] and quasi field modeling [29] verified this result. According to the numerical modeling results of [28] also its horizontal and vertical resolution is better than that of the traditional arrays. On the basis of these results, it was expected that the quasi-null arrays could image the subsurface with a higher resolution. Since their application together with a traditional configuration does not significantly increase the time demand and the cost of the measurements, the joint application of a traditional and a quasi-null configuration is recommended. In this paper, several examples will be shown to illustrate the advantage of such an array set. Apparent resistivity data were acquired by a Syscal Pro Standard device. The measurement sequences of the 72-electrode acquisition system contain 1010 W-Sch, 1516 Dp-Dp, 669 St (Stummer), 1222 γ112, 964 γ113, 798 γ114, 668 γ115 and 574 γ116 data points. The Stummer (St) array has 30 electrodes and contains 669 data points. The following parameters were used (Figure 2): a = 1–5, n = 1–7 (W-Sch); a = 1–6, n = 1–4 (Dp); a = 1–8 (γ112); a = 1–7 (γ113); a = 1–5 (γ114); a = 1–5 (γ115); a = 1–4 (γ116). For the parameters of the Stummer array, see [27].
The measured data must be inverted to obtain a resistivity section that can be interpreted for hydrogeological purposes. Three inversion codes were applied in Section 3.1.1, Section 3.1.2 and Section 3.1.3. In most situations, Res2D-Hu was used [44] because the available commercial methods cannot properly handle γ11n data. In some examples also traditional data were inverted by this code to be able to compare the data received by the different arrays. In Section 3.1.1 and Section 3.1.2, traditional data were inverted by both this code and EarthImager 2D Version 2.1.7 [45]. For the inversion of the third data set (Section 3.1.3), the RES2DINV [46] code was applied beside of Res2D-Hu.
In Res2D-Hu, forward modeling is carried out using the method of Finite Differences [47]. To avoid sudden resistivity changes, a smoothed inversion is applied. The smoothing factor automatically decreases starting from 100, through 50, 20, 10, 5, 2, 1, to 0.2. After 3 iterations by each smoothing factor, the inverted data set is used as the input model for the next inversion step, carried out with the next, smaller smoothing factor. The theoretical background of the Res2D-Hu code is discussed in detail in [28]. In forward modeling, the mesh size was taken as one-fourth of the electrode distance. In the inversion process, however, a less dense mesh was used to guarantee that the problem does not become undetermined. The vertical size of the mesh is increasing with the depth.
Carrying out the inversion by the EarthImager 2D, the stop criteria were set with 3% RMS error and 5% error reduction in the resistivity inversion settings because 3% noise level was assumed. The inversion terminates on meeting one of the criteria in these settings. All data were inverted using L2-norm because, in the inversion of the field data, L1-norm did not prove to be better than L2-norm in the absence of outliers. Damping factor 1 was found to be the optimal one.
In Section 3.1.1, a 72 electrode system was used with a 2 m electrode distance, enabling to display of a 28 m deep resistivity section. Res2D-Hu code was used to invert the data of each array. In Section 3.1.2, a 72 electrode system was used with 0.5 m electrode spacing. Although the best would be to measure with each γ11n array, it would not be very cost-effective. The choice of two γ11n arrays, between whose n values the difference is 2 or 3, seems to be optimal [28]. Thus, e.g., the application of the γ112 and γ114, or γ112 and γ115, or γ113 and γ115 arrays is recommended. Their sensitivity focuses on different depths, thus increasing the likelihood to highlight the feature, which is the most important for the experts. The application of only two γ11n arrays is also very economic. In this case, the γ113 and γ115 arrays were chosen because this choice proved to be one of the bests in many fields or analog modeling studies [28].
The Kádárta WS data were inverted by both the Res2D-Hu and EarthImager 2D codes. Using the EarthImager 2D, the stop criteria were set with 3% RMS error, and 5% error reduction since 3% noise level was assumed. The inversion terminates on meeting one of the criteria in these settings. Damping factor was taken 1. In Section 3.1.3, a 48-electrode system was used with 0.2 m electrode spacing enabling it to reach about 2 m depth. The Dp data were processed by RES2DINV [46]. Robust inversion was used with default parameters, and the damping factor was optimally chosen based on preliminary inversion runs. Res2D-Hu was used to invert γ116 array data.
From a geophysical point of view, groundwater bodies can be divided into two main groups: (1) porous, (2) upland and karstic types (Figure 2). While in porous groundwater bodies, the vertical variations of the electrical resistivity, in upland and karstic types, its horizontal variations are more important. While challenges 1 and 6 mainly occur in porous groundwater bodies, challenges 3 and 4 in upland and karstic types (Table 1). Challenges 2 and 5 are possible in both types of groundwater bodies.

2.3.2. Hydrogeophysical Logging Methods

Wireline logging methods used in prospecting of water resources provide high-resolution in situ information about the geometrical, petrophysical and hydraulic properties of hydrogeological structures. In the investigation of groundwater formations, general electric and nuclear logging data are simultaneously processed, the aim, of which is to vertically separate the aquifers from aquitards along a borehole, estimate their effective layer-thicknesses, porosity, water (or air) saturation, amount of shale (i.e., clay and silt content, respectively), fractional volume of the rock matrix and hydraulic conductivity as accurately as possible [48]. To further improve the interpretation results, if available, magnetic resonance sounding measurement is added [49], which is able to differentiate the volume of free water from that of the bounded fluids and give a more detailed picture of the pore geometry and hence the hydraulic conductivity and fluid properties. Open-hole logging techniques are applicable to all types of water bodies dealt with in this study, even in very shallow soil formations, where direct-push tools can be used for the characterization of the unsaturated zone [50]. In this study, we focus on the possibilities of using advanced well logging methods for the investigation of Hungarian porous water bodies (Figure 2).
Consider Darcy’s equation as basic relation used for describing the water flow through porous media:
u t = k * Φ μ p ,
where k* denotes permeability, Φ is porosity, µ is dynamic viscosity, u is the relative displacement vector of the fluid, and p is the pore pressure (t denotes time).
In hydrogeological studies, the hydraulic conductivity is preferred to be used instead of permeability, which is defined as K = k*ρwg/µ, including the mass density of pore water (ρw) and normal acceleration of gravity (g). Assuming a primary porosity rock as an assembly of capillary channels, one can use the following form of the Kozeny–Carman equation for the estimation of hydraulic conductivity [51]:
K = ρ w g μ d 2 180 Φ 3 ( 1 Φ ) 2 ,
where d is the dominant grain diameter, which is obtained from grain-size distribution curves, e.g., by [52]:
d = d 10 + d 60 2 ( d 10 d 60 ) 1 / 2 ,
where d10 and d60 are the characteristic grain sizes at 10% and 60% cumulative frequencies, respectively. Porosity is a key parameter in (2), which can be given either from laboratory or well logging measurements. In the assessment of groundwater formations, the bulk density tool assures good sensitivity to extract the porosity in all its domains. In sedimentary rocks fully saturated with fresh water, the porosity is calculated from the following (linear) tool response equation:
ρ b ( m ) = Φ ρ f + V c l ρ c l + ( 1 Φ V c l ) ρ m a ,
where ρ b ( m ) is the density measured in a given depth, Vcl is clay volume, ρf, ρma, ρcl denote the density of the fluid in the flushed zone, rock matrix and clay, respectively. In multi-mineral formations, the density of each matrix component should be taken into consideration. There are traditional methods to calculate the clay volume of the reservoirs of different ages, which are mostly based on single well log analysis [53]. The weakness of these methods that they are using the information of only one wireline log as well as highly dependent on the lithology, which should be known before the analysis.
Hydraulic parameters can be derived from the resistivity log by the Csókás method [54]. In the knowledge of grain sizes, pore-water resistivity (Rw) and resistivity of groundwater formations (R0) corrected to the effect of drilling fluid invasion; one can estimate hydraulic conductivity solely from well logging measurements. The formation factor (F) as the ratio of Rw/R0 and the Hazen’s effective grain diameter (d10) determined from sieve analysis are directly connected in freshwater formations [55]. For the dominant grain diameter, this connection leads to the following equation:
d = 1.671 · C d lg R 0 R w ,
where Cd = 5.22 × 10⁻⁴ is proposed for not too poorly sorted sediments with a resistivity formation factor less than 10. This condition normally satisfies Hungarian porous (unconsolidated) groundwater bodies. In freshwater formations, the electric current is hardly conducted through the spaces between the grains, rather mainly on the surfaces of particles. Thus, the resistivity is inversely proportional to the specific surface of rock grains. By assuming that the sedimentary rock is composed of spherical particles, the specific surface can be calculated as S = 6(1 − Φ)/d. For better separation of good storage capacity aquifers, the specific surface (S) can be derived from (5) as:
S = [ 36 ( 1 Φ ) 2 / ( 1.671 · C d · lg R 0 R w ) 2 ] 1 / 2 .
By coupling Archie’s tortuosity factor [56] with porosity and the formation factor, (2) can be properly modified to give a continuous (in situ) estimate for hydraulic conductivity (in m/s) along a borehole:
K = C k Φ 3 ( 1 Φ ) 4 [ ( lg R 0 R w ) 2 / ( R 0 R w Φ ) 1.2 ] ,
where Ck = 855.7·CtCd2 is a proportionality factor and Ct is a temperature-dependent constant calculated as Ct = 1 + 3.37 × 10⁻² T + 2.21 × 10⁻⁴ T2 (where T is given in units of °C). Aquifers are characterized by hydraulic conductivities K (m/s) > 10−6, while aquitards are indicated by K (m/s) < 3 × 10⁻⁸. An added advantage of the Csókás method is that it can give an estimate also to the critical velocity of flow and the volume capacity of the well [54].
Multivariate statistical techniques for processing well-logging datasets are proposed for a more reliable characterization of porous water bodies. For rock typing and separating the aquifers from impervious intervals, N-dimensional non-hierarchical cluster analysis is suggested [57]. In k-means clustering, the number of observed variables (N) is chosen arbitrarily, which may depend on detailed sensitivity analysis. Suitable well logs measured at different depths form objects of the data space that are separated into k number of groups in an iterative process by using a similarity criterion (defined as some vector norm of the differences of data vectors). The number of clusters must be a priori given, which must be harmonized with preliminary geological knowledge. Too few clusters provide poor vertical resolution, while too many groups provide unrealistic lithological categories. By calculating the overall deviation of data objects from their cluster centers (centroids) at different cluster numbers (sum of squared error), the well-known elbow method specifies the optimal number of clusters. It must be emphasized that this pure mathematical consideration must be verified by the available geological information. The position of centroids is of high importance because the solution is not independent of the selection of their initial values. Cluster analysis of incomplete datasets requires even more advanced algorithms. In case of having missing values of some variables, traditional clustering may fail because one loses too many objects from the analysis. After completing a correlation-based (multilinear regression assisted) imputation process, a complete data matrix of several observed variables was successfully grouped in [58]. It was shown that the proposed clustering technique could be used for the quick analysis of big data, which gives a more reliable solution than traditional clustering or other matrix factorization algorithms. To process well logs from old water wells or to treat datasets, including a high-level of instrumental noise or outliers, the use of robust statistical methods is highly recommended.
For exploring unmeasurable variables hidden in the dataset, such as clay volume or hydraulic properties, dimension reduction techniques can be fruitfully applied. By following this idea, the iteratively reweighted factor analysis (IRFA) technique developed originally for hydrocarbon formations [59] is now first used to estimate the clay volume of groundwater formations. In the first step, standardized well logs are transformed into a smaller number of statistical variables called factors, which form a linear combination of the observed variables. By minimizing the information loss, a few factors explain most of the total variance of the observed data matrix. By studying the explaining variances and factor loadings, one can give the most influential measurement types on the extracted variables. The specialty of this algorithm is that it updates the factor loadings and factor scores jointly in an inversion procedure, during which the deviation between all the measured and calculated well-logging data is weighted in proportion to its magnitude for giving an outlier-free (robust) solution. The petrophysical properties of groundwater formations can be directly connected to some of the factors by regression analysis. A strong nonlinear relation is found between the first statistical factor (F1), including the dominant part of the variance of the observed well logs and the clay volume of water-bearing beds:
V c l = a e b F 1 + c ,
where a, b, c are site-specific constants validated by core laboratory measurements and well logging information of neighboring wells. The statistical estimation for the shale content helps us to refine the lithology and improve the aquifer storage model. Factor analysis may use all available well logs sensitive to lithology (and other properties) integrated into one statistical procedure to maximize the accuracy and reliability of the interpretation results. The hydrogeophysical approach can be extended to a larger investigation area (i.e., water body) by using a 2D (or 3D) factor analysis method [60]. The well logging methodology described in this section is demonstrated using a well logging dataset measured along a Hungarian thermal water well in Section 3.2.

3. Results

3.1. Conventional and Nonconventional Geoelectric Arrays

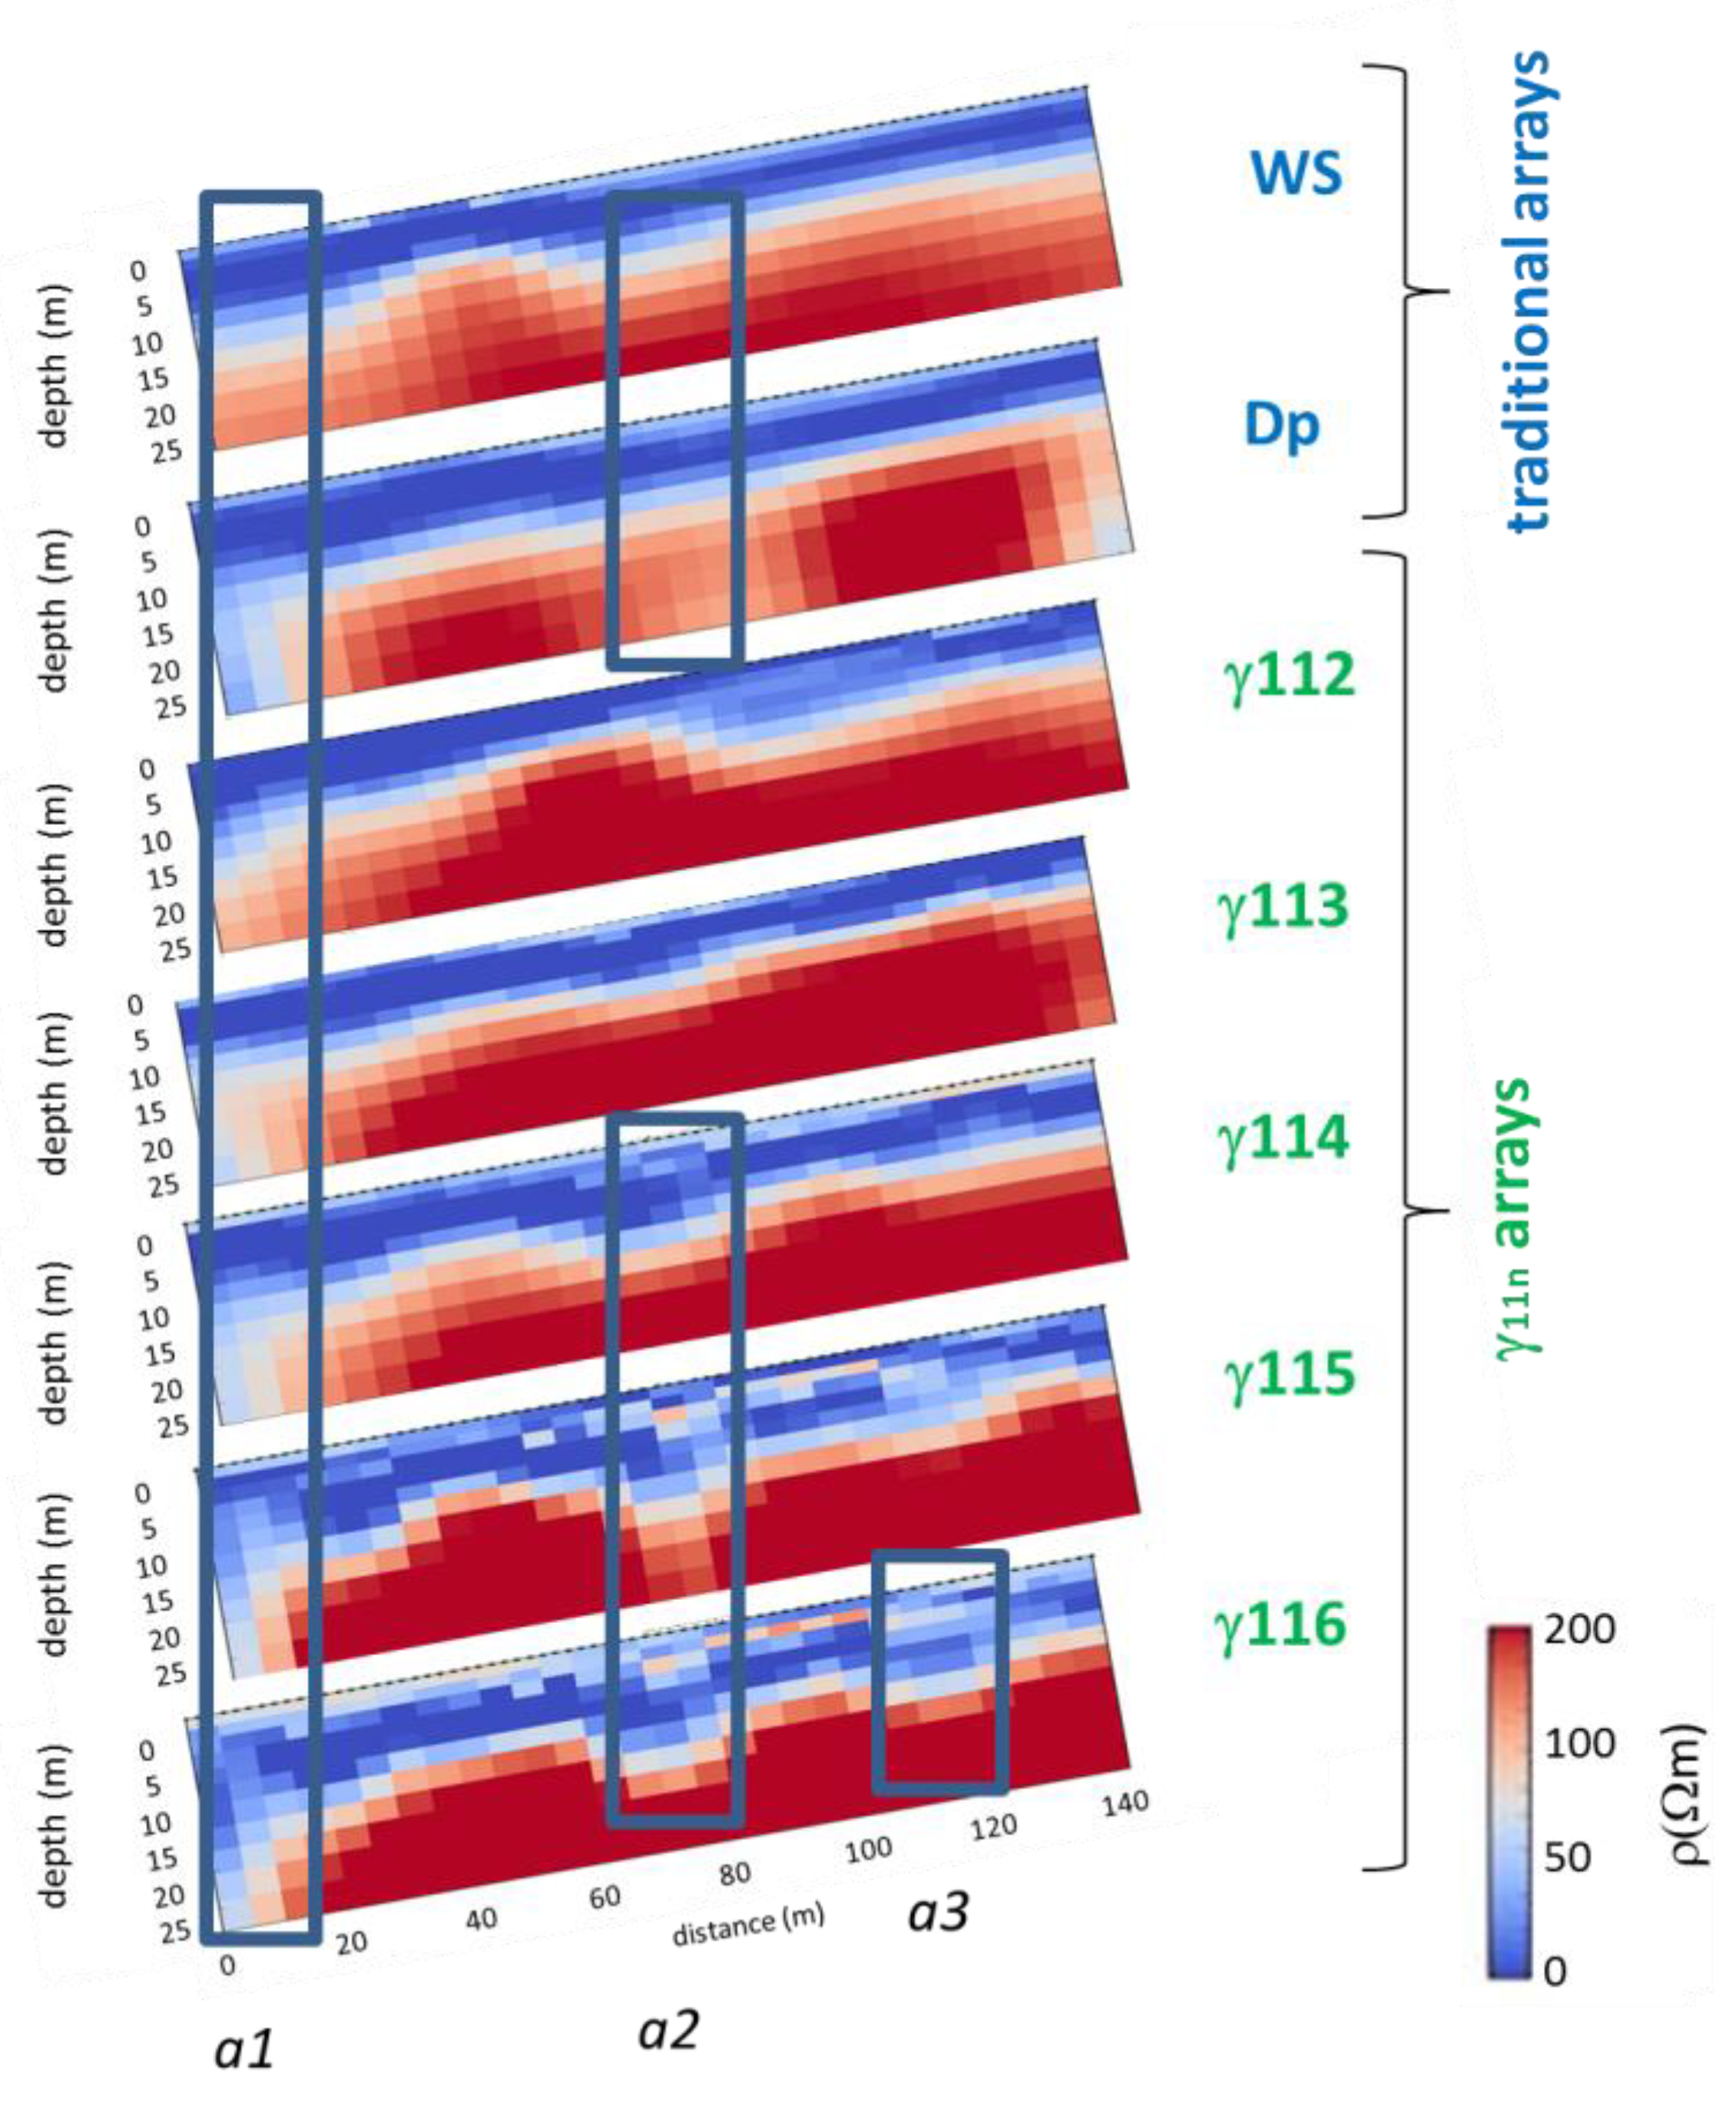
3.1.1. Study of a Series of Faults

Resistivity sections measured over a series of faults; thus, a step-like structure in limestone is presented in Figure 5. The traditional WS and Dp arrays present two stairs, two solid rock units at about 20–60 m and 90–130 m, which have resistivity over 200 Ωm. They were separated from each other by a fracture zone (60–90 m), where the resistivity of the basement is less than 150 Ωm. The fracture zone is much more clearly shown by the Dp array as expected since the Dp array was more sensitive to vertical anisotropies. This zone is not visible in the γ112 image and hardly visible in the γ113 and γ114 images. It is at the same time remarkable in the γ116 and even more remarkable in the γ115 section. Regarding both the Dp and γ115 sections, there is no doubt that there is a fracture zone at this position (anomaly 2: a2). The γ116 image presents, however, one more depression in the basement (a3), which is most likely also a fracture zone (a3) similarly to a1, which is presented by each array. Thus, the γ116 array gave the most detailed picture of the subsurface, presenting three stairs and three fracture zones. On the basis of the results obtained in this study site, the joint application of the Dp and the γ116 arrays seemed to be optimal in studying a step-like structure. Their joint interpretation enables to give all-important details, that is, the number, position, width and depth of the stairs and the fracture zones. Note that inversion of the apparent resistivity data of, e.g., the Dp and the γ116 arrays seems to be a very good idea. However, joint inversion of data sets of a traditional-, and a γ11n array did not use to produce better results than the inversion of data of the individual arrays.

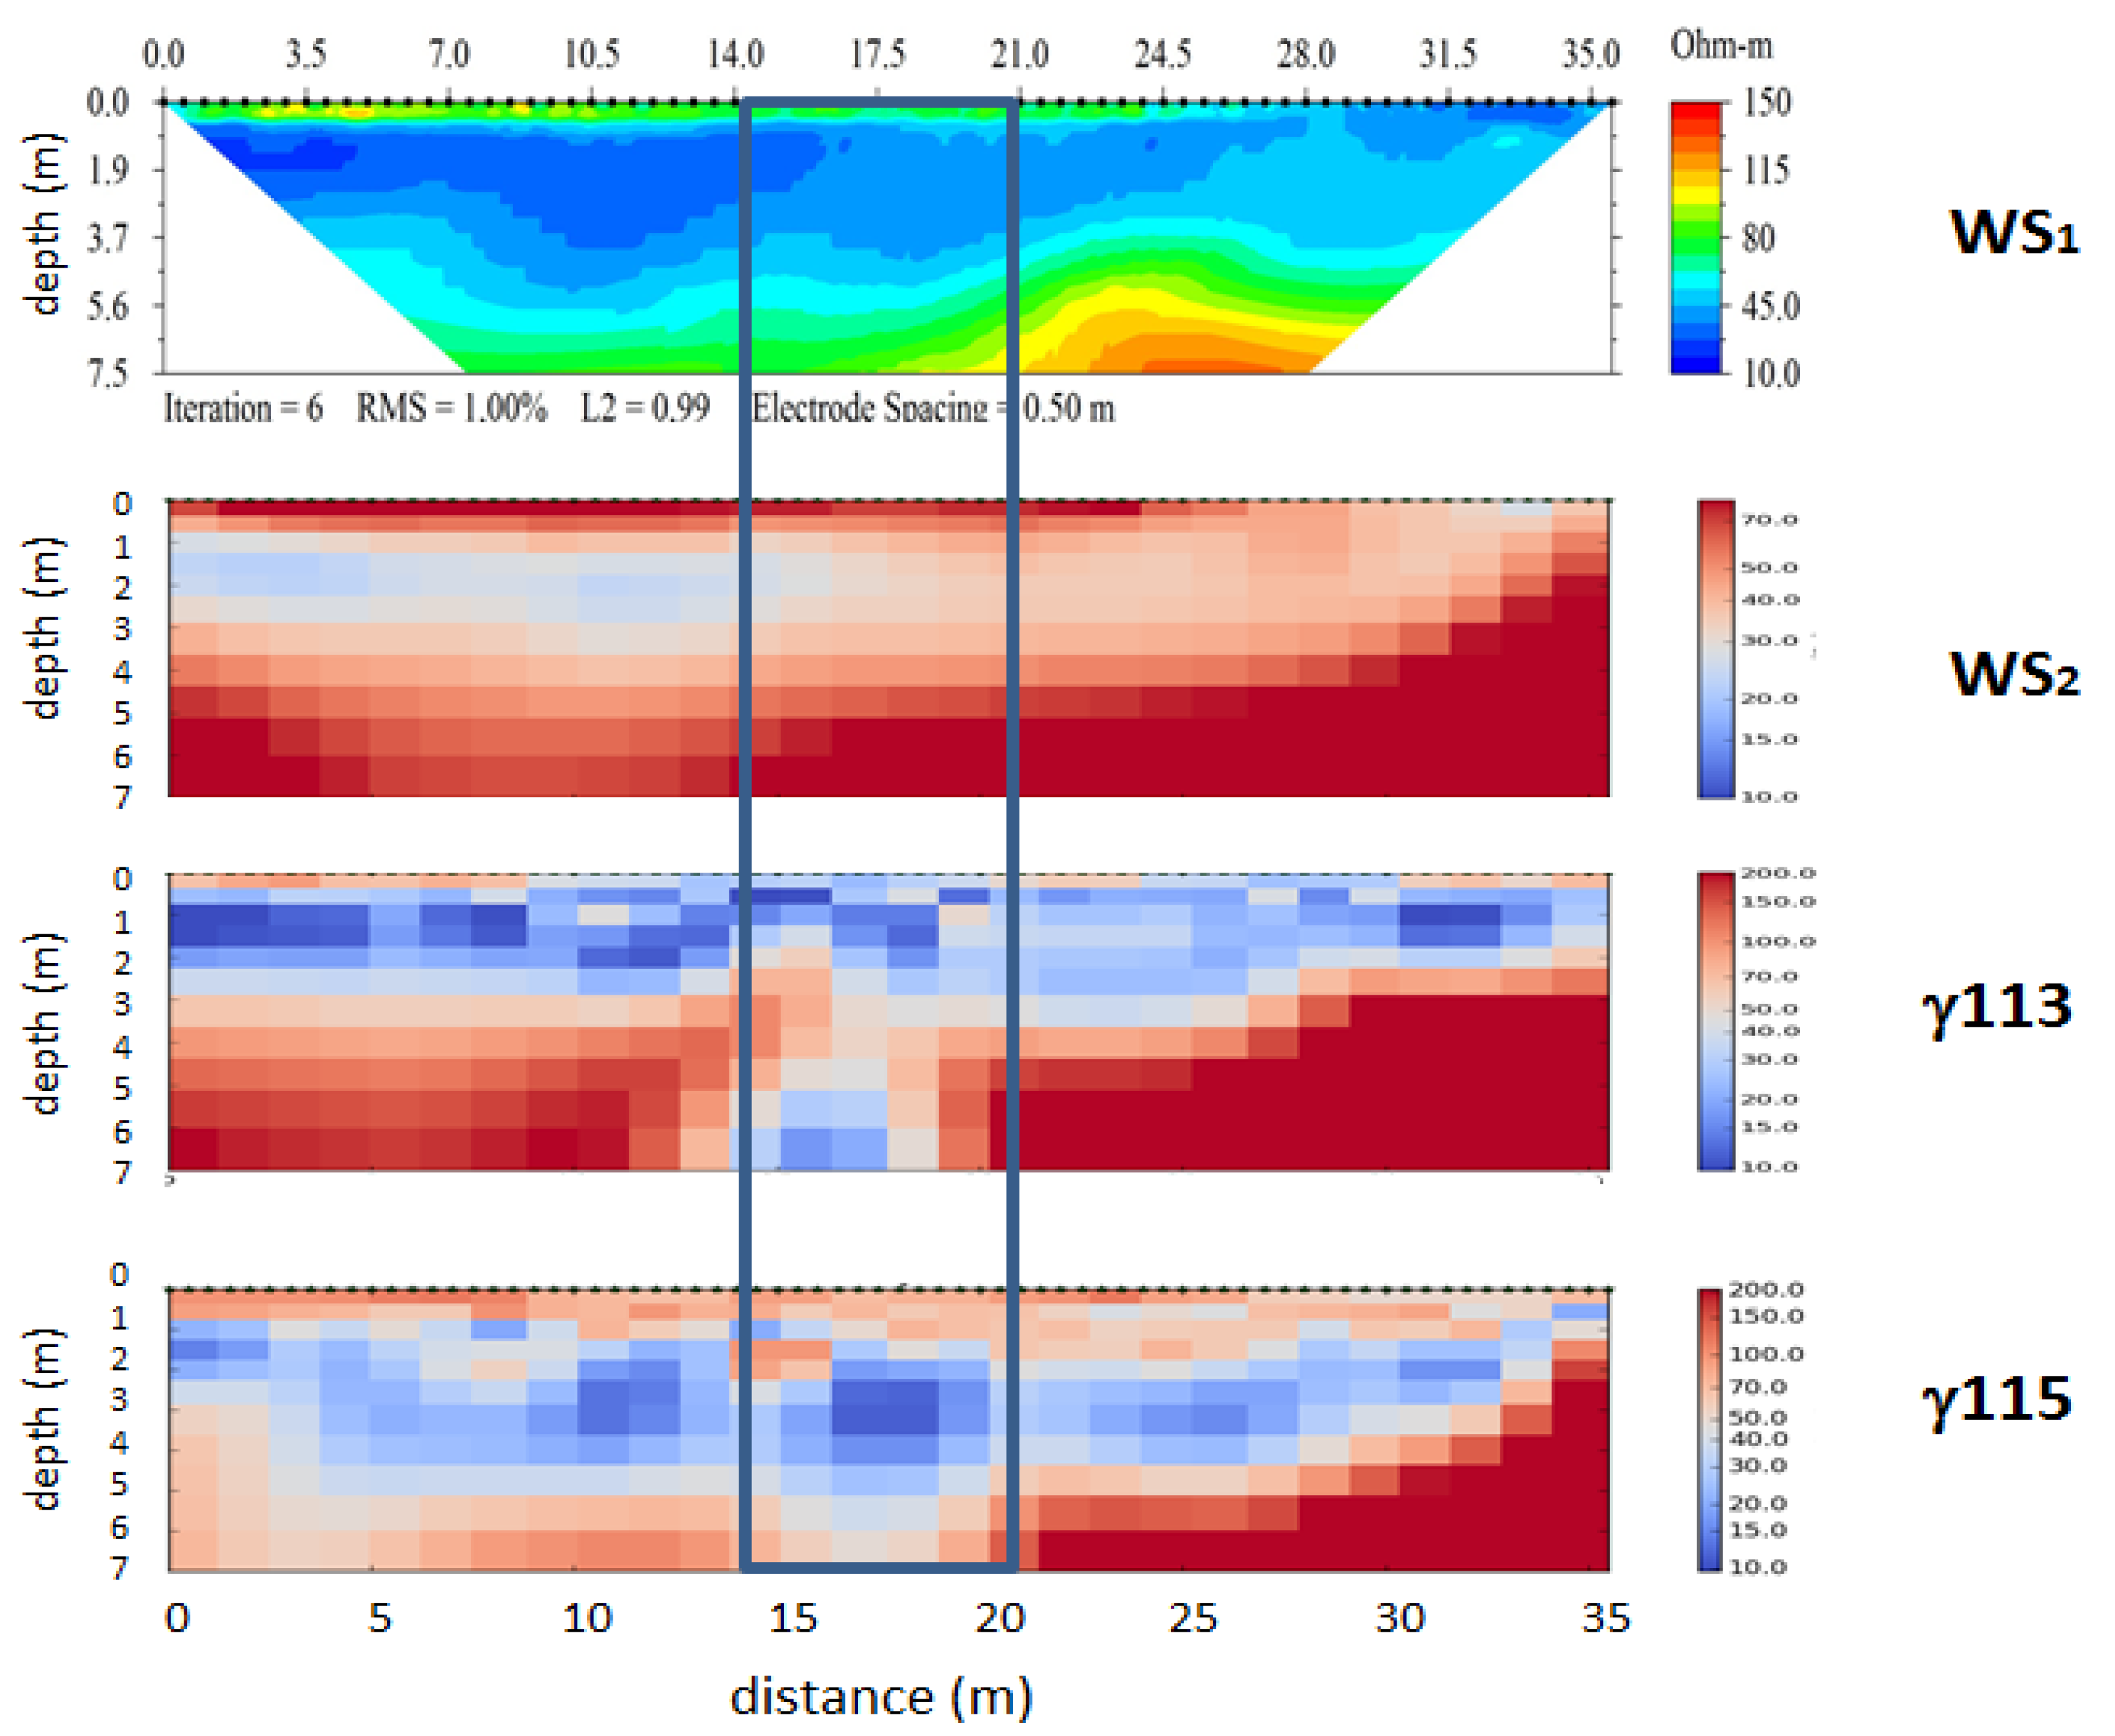
3.1.2. Fracture and Water-Bearing Zone Detection

The aim of this study was to detect and characterize fracture zones and fractures since they are profoundly significant in hydrological respect because of their high hydraulic conductivity and water-bearing capacity. Measurements were undertaken a few days after a larger amount of precipitation in the hope that the fractures are still water-saturated, thus electrically conductive.
Fracture zone characterization should be easier than that of fractures, but it may also be difficult. In Kádárta, the fracture zone had to be delimited to estimate the water-bearing potential of the area (Figure 6). In spite of that the WS array’s data were inverted using both the EarthImager (WS1) and 2DRes-Hu codes (WS2), the result was not clear. Although a fault clearly appeared at about 22–23 m in WS1, no fracture zone seemed to be related to it. A fracture zone appeared at the same time at about the expected position (15–20 m), in the vicinity of the fault, in the γ113 and γ115 sections. Its small electrical resistivity must be due to its high water content. Since drilling only a small distance from a narrow fracture zone can drastically reduce the yield of water, it is very important that the γ11n arrays could localize it rather precisely, between 16 m and 18 m. While the WS array displayed only a fault, the γ11n arrays detected and localized rather precisely the water-rich fracture zone.
The knowledge of the parameters of individual fractures, such as their position and average distance, is principal in hydrogeological modeling. This was another goal of the Kádárta study. Although ERT is a very good tool for such kind of investigations, there are several problems, which may make difficult the interpretation of data, e.g., the resistivity of the fractures depends on their filling material. Thus, they can be electrically more conductive than the host if they are water-, or clay-filled, but their resistivity is higher than that of the host if they are empty. This problem, however, used to be avoidable if measurements are carried out soon after a rainy period, but it was not the situation in Kádárta.
In the Kádárta area, the fractures, which are over a fractured, weathered, porous bedrock, became dry soon after the rain (0–18 m in Figure 7). On the contrary, the fractures in 18–30 m still contained a notable quantity of water in time of the measurements, most likely because the water did not yet leak from these fractures due to the very low permeability of the solid bedrock. Hence, while in 0–18 m, the fractures are electrically resistive, in 18–30 m, they are conductive. The different behavior of the water in different fractures made the interpretation rather difficult in this case. Note that the most significant fractures appeared at the boundaries of the differently weathered block.
In rocky terrain, it may be difficult to establish reasonable electrode/rock contact. In the study area, it could be avoided by adding water in the immediate vicinity of the electrodes. The contact was, however, mostly rather good due to the relatively thick layer (0.2–0.6 m) of clay, which covered the bedrock. Contact problems can also be well resolved by attaching sponges soaked in saltwater to the electrodes. Electrodes should be long (0.5–1 m) and should be firmly positioned between blocks with maximum contact with the underground [61]. Capacitive resistivity imaging (CRI) was applied in [62], a low-frequency, capacitively coupled measurement approach, in order to emulate ERT without the need for galvanic contact on frozen ground.
Presenting a profile parallel to the one presented in Figure 6, in 5 m distance from it, a fault became clearly visible at 20 m, in both WS1 and WS2 sections (Figure 8). Red parts of the sections present blocks with high electrical resistivity (more than 100 Ωm). They must be solid. On the basis of the WS images, a1 anomaly seemed to be the most promising to extract water. In these images, a2 and a3 seemed to be connected. The γ113 and γ115 sections separate; however, a2 and a3 from each other, thus they were most likely not connected. Once again, γ113 restricted the fracture zone a1 from 12–20 m to 17–19 m enabling to maintain most likely more productive well. WS array was able to give a robust image; the γ11n arrays further improved its quality by separating two nearby anomalies and positioning the water-bearing zone.

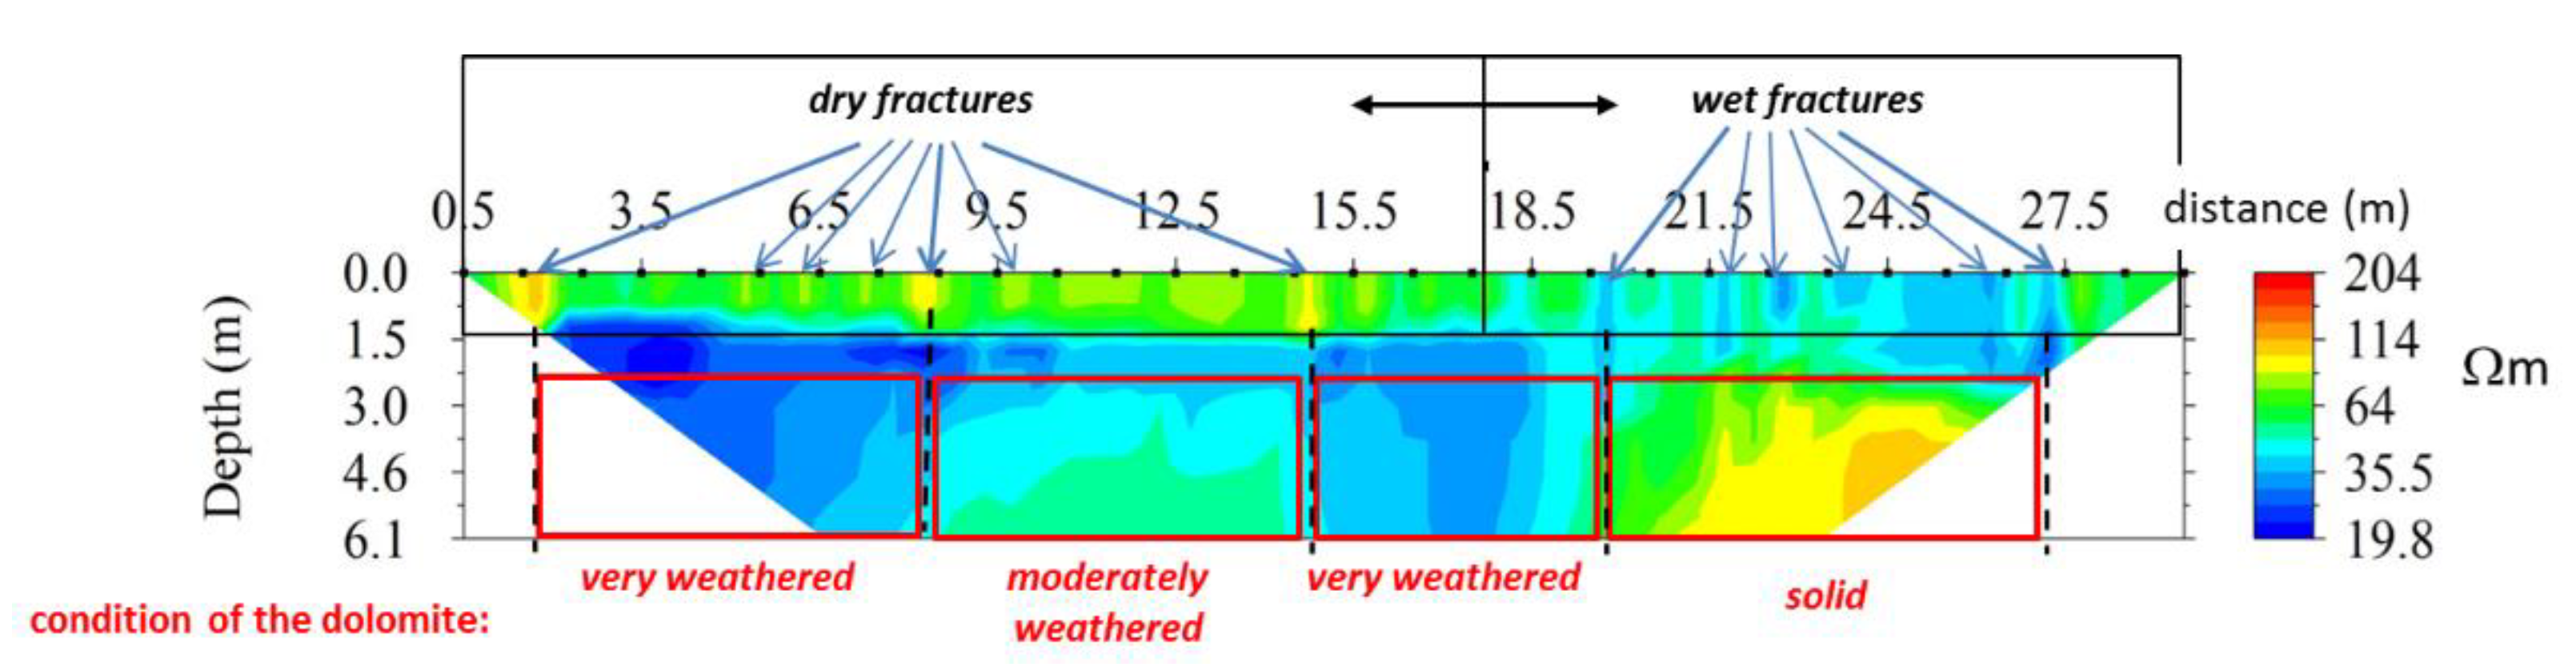
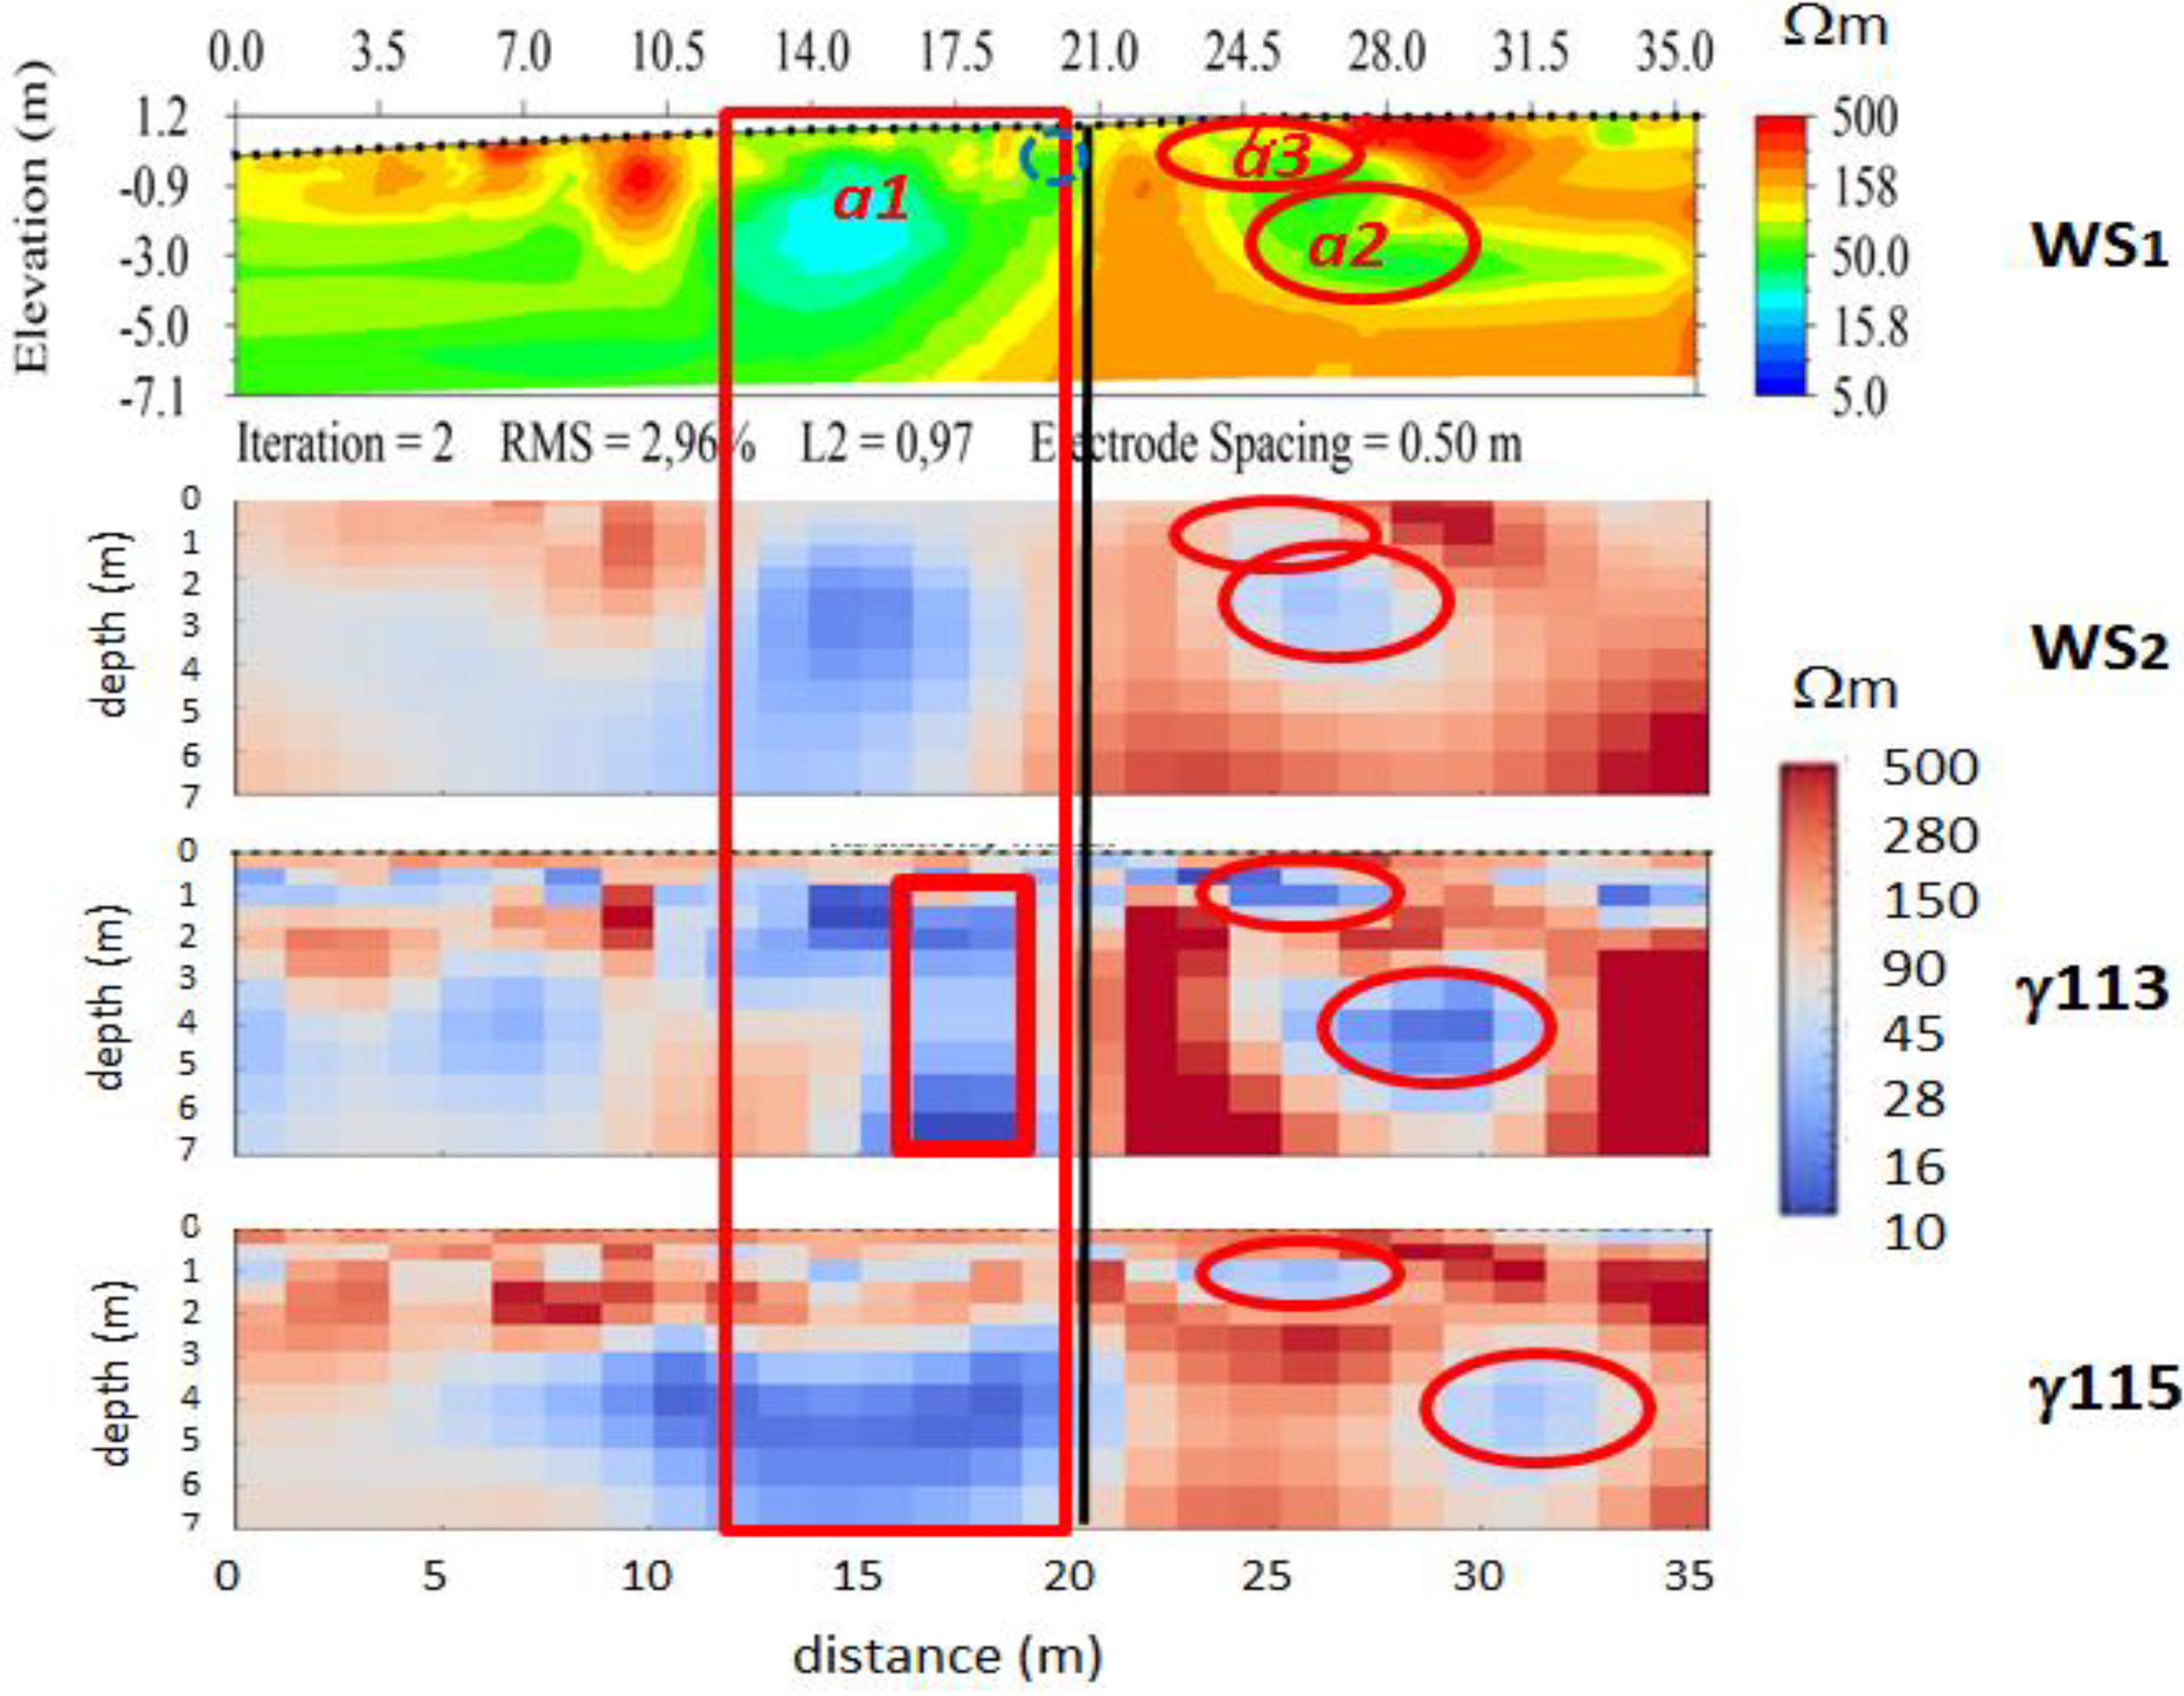
3.1.3. Study of a Fault Zone and Fracture Zones

The previously presented array set was also tested in a sedimentary environment consisting of sand, sandy clays, clay and gravel in India to see whether they are also applicable in studying groundwater bodies in other climatic conditions. Since the measurements were carried out some days after a rain, fractures were expected to be still water-saturated, thus electrically conductive.
The fault is clearly seen at about 5 m in the Dp section in Figure 9a, but its accurate localization is difficult. To decrease the doubtfulness, measurements were carried out also by the γ116 configuration (Figure 9b). Since the γ116 array is very close to the null arrays, it is almost insensitive to vertical variations of the electrical resistivity but very sensitive to its horizontal variations [28]. Thus, it does not present as clearly the rock blocks themselves at both sides of the fault, but it displays well the boundaries of the fault fracture zone. They are at the centers of the conductive anomalies, at 4.5 m and 6 m. These anomalies occur, namely due to the water-saturated large fractures, which delineate the fault zone from both sides.
The fractures seemed to reach very close to the surface because even the shallowest γ116 profile of apparent resistivity (Figure 9c) displayed very well the fracture zone. The two large positive-negative anomalies, which are due to large fractures, delineate the fracture zone from both sides (at 4.6 and 6.1 m, at their inflexion points). Two other large anomalies appeared at 1.2 m and 8.6 m. Both of them were also indicated in the γ116 ERT section as conductive zones (Figure 9b). The other significant fracture anomalies are all inside the fracture zone, demonstrating how highly fractured it is. In summary, while the Dp array gave a very good overview of the study site, the γ116 ERT section delineated the fracture zone well, but the shortest γ116 array delineated it the best. In addition to the good delineation of the fault fracture zone, the set of methods Dp ERT, γ116 ERT and the shallowest γ116 profile also enabled the detection of two other significant fractures.

3.2. Well Logging in Porous Water Bodies

The well logging approach proposed in Section 2.3.2 was tested in Baktalórátháza-1 well. Surface geoelectric methods concluded that the upper 100 m part of the well was a Pleistocene formation dominated by sands, in which only to the variation of grain sizes the traditional surface DC geoelectric methods were sensitive. The underlying rock of this sandy sequence is mainly shale. Between the interval of 100 and 160 m, sands were deposited, followed by a shaly formation, and thin (5–15 m thick) coarse-grained layers could be deposited, too. The boundary of the Pleistocene and Pannonian ages was detected at a depth of around 240 m. The Pannonian shaly complex mainly consists of clayey sand, gravel, clayey silt, clayey marl and bituminous clay (Figure 10).
In Baktalórántháza-1 well, clastic formations along the interval of 100–450 m were investigated, where the pore spaces were fully saturated with water. The following types of open-hole wireline logs were processed: natural gamma-ray intensity (GR), borehole caliper (CAL), spontaneous potential (SP), gamma–gamma (GG) and neutron–neutron (NN) and shallow resistivity (RS). The last track of Figure 10 shows the fractional volume of pore spaces, including free- and bounded water (POR), clay volume calculated by the IRFA method using (8) (VCL), and matrix volume dominated by quartz (VSD). (The laboratory measurements revealed some carbonates here and there as cementing material.) The above volumetric parameters and hydraulic conductivity had been previously estimated by the Csókás method using (4) and (7) [63].
Grain-sizes were derived by laboratory measurements made on 220 core samples. The values of d10 and d60 were given from grain-size distribution curves, while the dominant grain size was calculated using (3). The statistical distributions of characteristic grain sizes can be found in Figure 11, which show the domination of fine-grained components from impermeable (clayey and silty) formations and also refer to some bigger grain sizes associated with low and medium conductivity (sand and gravel) beds. The wide range of the shape parameter (Figure 11d) defined as the ratio of d60 and d10 also shows the heterogeneity of the studied formation.
Regression analysis was applied to find a connection between the rock physical properties and measured well logs. Clay volume from core measurements shows a strong linear connection to the shallow resistivity log (Figure 12a). The Pearson’s correlation coefficient is −0.85, which shows the strong inverse (linear) relationship between the observed variables. The standard deviations of slope and intercept with 95% confidence bounds are 0.002 and 0.04, respectively. A similar strong correlation was found for the hydraulic conductivity with the same well log (Figure 12b). The former was extracted by the combination of (2) and (3) using the data of sieve analysis. The correlation coefficient is 0.75, which refers to the strong direct (nonlinear) relationship between the hydraulic property and the resistivity log.
The evaluation of porous groundwater formations begins with reliable rock typing. Simultaneous cluster analysis of all available logs was applied for separating lithological units. To assure a robust solution, the similarity between the multidimensional vectors of well logging data using a distance metric was defined based on the L1-norm. The city-block (or Manhattan) distance calculated as the sum of the absolute values of deviations of the components of data vectors is well-known to give outlier-free solutions in geosciences applications. The sum of squared error calculated at different numbers of cluster numbers yielded an optimum at three (elbow method). Based on this simple manner, one can separate the aquitards and aquifers using the well logs. In Figure 13, the three resultant clusters in the function of the in situ measured parameters were identified as impermeable formations (cluster 1), water-bearing formations with low hydraulic conductivity (cluster 2) and those with medium or high conductivity (cluster 3).
The quantitative estimation of hydraulic conductivity and the amount of clay was based on the regression relationships explored between the resistivity log and the desired quantities (Figure 12a,b). The specific surface derived by (6) and natural gamma-ray logs allows a good lithological separation by grain-sizes and radioactivity, respectively (Figure 14). The minimum of the former showed the intervals of the best storing capacity (e.g., 225–240 m). The high values of specific surface (S) indicated the impermeable (shaly Miocene) sequences (from 300 m to the well bottom). Clay volume (track 4 in Figure 14) derived from the resistivity log (track 3 in Figure 14) showed a proper agreement with core measurements and IRFA (track 4 in Figure 14). A similarly good match was given between the estimated and lab-derived hydraulic conductivities (track 5 in Figure 14).
By the comprehensive interpretation of wireline logs, using cluster analysis, the vertical distribution of zones of different conductivities can be given at high-resolution. The well log of the serial number of clusters (see last track in Figure 14) allowed the differentiation of beds both from the lithological and hydrogeological points of view. The result of cluster analysis was consistent with the lithological and specific surface logs. As a result, one can easily identify the porous and permeable aquifers with medium/good conductivity with yellow color, whereas brown and black color intervals show lower conductivity formations.

4. Discussion and Conclusions

In this paper, advanced surface geophysical and well-logging techniques were presented as effective tools to solve hydrogeological and groundwater management problems. It was shown that these techniques could give more detailed images and petrophysical characterization about the subsurface than traditional techniques. Detection and characterization of faults, fractures and fracture zones were demonstrated in the case of studies in Hungary (and India). In order to understand hydrogeological processes in Hungarian groundwater bodies, it is essential to see such features well and determine the petrophysical properties of the hosting formations.
In Sopron, West Hungary, in studying a step-like structure, the joint application of the Dp and the newly developed γ11n arrays seemed to be an optimal choice. Their joint interpretation enabled the determination of all important details, that is, the number, position, width and depth of the steps and the fracture zones. In Kádárta, North-West Hungary, the WS array displayed a fault in the dolomite basement; the γ11n arrays enabled its accurate localization and the detection of the most-likely water-rich fracture zone. While the WS array gave a robust image of the subsurface, the γ11n arrays could enrich it by separating two anomalies and by delineating more accurately the most fractured zone. In the Indian example, the set of Dp ERT, γ116 ERT and the γ116 shallowest profile enabled the delineation of a fault fracture zone accurately and the localization of two other significant fractures. Furthermore, the water-bearing zones could be well described by this set of methods. The members of this set complete and verify each other’s results well.
Conclusions of precedent numerical and analog studies—according to which the choice of two γ11n arrays between whose n values the difference is two or three is optimal—were verified by field studies in the Sopron (Section 3.1.1) and Kádárta (Section 3.1.2) study sites. Thus, e.g., the application of the γ112 and γ114, or γ112 and γ115, or γ113 and γ115 arrays is recommended in field studies. The application of only two γ11n arrays completed with the Dp array is very economic, and it seems to be the best solution to follow horizontal resistivity variations.
Although the joint application of traditional-, and γ11n geoelectric arrays was presented in Hungarian examples, this set is applicable anywhere independently on the geomorphology conditions. Local climatic conditions may, however, severely influence the results. Fracture zones and especially narrow individual fractures may easily become “invisible” for this method if their water-saturation is not very high or low, thus not providing sufficient difference in the electrical resistivity between them and the host. In such a situation, the choice of the date of the measurement may become extremely important. The time and quantity of the last precipitation and infiltration rate must be taken into account to get the best possible results. In small-scale studies, especially if displaying lateral variations is required, application of the presented γ11n arrays together with the traditional Dp array seems to be the best geophysical method. GPR, VLF and seismic studies did not prove to be successful in the study sites. The Dp array moreover gives a robust image, which can further be refined using γ11n arrays.
In Baktalórántháza, northeast Hungary, multivariate statistical interpretation of wireline logs using robust cluster analysis allowed a reliable lithological separation of potential aquifers. Their shaliness was estimated by iteratively reweighted factor analysis, while their hydraulic properties were directly derived from the electrical resistivity log as demonstrated through a thermal-water exploration example. For the exploration of formation shaliness and hydraulic conductivity using classical (maximum-likelihood method-based) factor analysis were previously applied [64,65], which confirmed the validity of multivariate statistical methods that were further improved in this study. The porosity, water-saturation, shale content and the fractional volume of rock matrix were earlier estimated by the interval inversion method [66], which allowed not just the automated determination of volumetric parameters, but the layer-boundaries, some zone parameters (i.e., physical properties of fluid and matrix components, textural properties, such as Archie’s constants and other functional constants of probe response equations) as well as the uncertainty of the estimated model parameters. An application for the cooperative use of inverse modeling and factor analysis was published [67], which showed the advantages of the joint application of these two approaches for more accurate and reliable reservoir characterization.
On the basis of theoretical considerations and the presented field results, the following recommendations for geophysical surveying programs in different groundwater bodies can be given. To resolve problems where vertical electrical resistivity variations must be followed, that is to present layered structures, water table or large rock units (challenges 1 and 6 and partially 2, which may mainly occur in shallow porous, porous and porous thermal groundwater bodies), traditional geoelectric ERT measurement with WS array is satisfactory. WS measurements can give the depth, thickness and resistivity of the layers enabling their geological interpretation. Well-logging methods can verify ERT results and can be used to determine the petrophysical and hydraulic properties of the layers. In addition to this, the above presented multivariate statistical interpretation of wireline logs using robust cluster analysis allows a reliable lithological separation of potential aquifers and the estimation of their shaliness. Thus, their application is recommended to handle challenges 1 and 2, and especially the 3 and 5 ones (Table 1).
In order to get a more detailed image of the subsurface, in particular, if the aim is to describe horizontal resistivity variations, which may be, e.g., due to faults, fractures, fracture zones, or holes (challenges 2–4, which may mostly occur in shallow upland, upland, karstic and thermal karts groundwater bodies) traditional Dp ERT measurements are recommended completed by γ11n ERT ones. It was shown that the γ11n array could verify the results of the traditional WS and DP arrays and often complete with important information. They enabled more accurate localization of faults and fractures and better delineation and description of fracture zones, thus improving the input parameters of hydrogeological modeling and improving the yield of wells. Since drilling a well only a small distance from a fracture may drastically decrease the quantity of the exploitable water, accurate localization of the fractures is extremely important. If the aim is to get a detailed image of the subsurface, from surface measurements, Dp and γ113, γ115 measurements and the joint interpretation of their results seem to be a very good combination. The advanced interpretation of wireline logs using robust statistical analysis of in situ data may further improve the results enabling the construction of better hydrogeological models serving with more accurate input parameters. Its application is expected to localize water wells better, thus producing more water. Vulnerable areas can also be better delineated by better characterizing fractures and fracture zones, which are the key parameters in water circulation.

Author Contributions

Conceptualization, P.S.; methodology, P.S., N.P.S., and S.S.; software, N.P.S., and S.S.; validation, P.S., N.P.S., and S.S.; investigation, P.S., N.P.S., M.Z. and S.S.; resources, P.S., N.P.S., M.Z. and S.S.; writing—original draft preparation P.S., N.P.S., M.Z. and S.S.; writing—review and editing, N.P.S.; visualization, P.S., N.P.S., M.Z. and S.S.; supervision, P.S.; project administration, P.S. All authors have read and agreed to the published version of the manuscript.

Funding

European Union, GINOP-2.3.2-15-2016-00031.

Institutional Review Board Statement

Not applicable.

Informed Consent Statement

Not applicable.

Data Availability Statement

Data sharing not applicable.

Acknowledgments

The research was carried out within the GINOP-2.3.2-15-2016-00031 "Innovative solutions for sustainable groundwater resource management" project of the Faculty of Earth Science and Engineering of the University of Miskolc in the framework of the Széchenyi 2020 program, funded by the European Union.

Conflicts of Interest

The authors declare no conflict of interest.

References

  1. Buday, T.; Szűcs, P.; Kozák, M.; Püspöki, Z.; McIntosh, R.W.; Bódi, E.; Bálint, B.; Bulátkó, K. Sustainability aspects of thermal water production in the region of Hajdúszoboszló-Debrecen, Hungary. Environ. Earth Sci. 2015, 74, 7511–7521. [Google Scholar] [CrossRef]
  2. National Watershed Management Plan (in Hungarian). Available online: https://www.vizugy.hu/index.php?module=vizstrat&programelemid=149 (accessed on 5 December 2016).
  3. Szűcs, P.; Madarász, T. Hydrogeology in the Carpathian basin how to proceed? Eur. Geol. 2013, 35, 17–20. [Google Scholar]
  4. National Water Research Program (in Hungarian). Available online: https://mta.hu/data/dokumentumok/Viztudomanyi%20Program/NVKP_20180331.pdf (accessed on 3 December 2018).
  5. Hubbard, S.S.; Rubin, Y. Introduction to hydrogeophysics. In Hydrogeophysics; Water Science and Technology Library; Rubin, Y., Hubbard, S.S., Eds.; Springer: Dordrecht, The Netherlands, 2005; p. 50. [Google Scholar]
  6. Ward, S.H. Geotechnical and Environmental Geophysics: Volume I, Review and Tutorial; Stanley, H.W., Ed.; Society of Exploration Geophysicists: Tulsa, OK, USA, 1990; p. 398. [Google Scholar]
  7. McNeill, J.D. Advances in electromagnetic methods for groundwater studies. Geoexploration 1991, 27, 65–80. [Google Scholar] [CrossRef]
  8. Chegbeleh, L.P.; Akudago, J.A.; Nishigaki, N.; Edusei, S.N.K. Electromagnetic Geophysical Survey for Groundwater Exploration in the Voltaian of Northern Ghana. J. Environ. Hydrol. 2009, 17, 9. [Google Scholar]
  9. Keleko, T.D.A.; Tadjou, J.M.; Kamguia, J.; Tabod, T.C.; Feumoe, A.N.S.; Kenfack, J.V. Groundwater Investigation Using Geoelectrical Method: A Case Study of the Western Region of Cameroon. J. Water Resour. Prot. 2013, 5, 633–641. [Google Scholar] [CrossRef] [Green Version]
  10. Hafeeza, A.T.H.; Sabeta, H.S.; El-Sayedb, A.N.; Zayeda, M.A. Geoelectrical exploration of groundwater at West Dayrout Area, Assiut Governorate, Egypt. Nriag J. Astron. Geophys. 2018, 7, 279–296. [Google Scholar] [CrossRef]
  11. Beamish, D. Quantitative 2D VLF data interpretation. J. Appl. Geophys. 2000, 45, 33–47. [Google Scholar] [CrossRef] [Green Version]
  12. Linde, N.; Pedersen, L.B. Characterization of a fractured granite using radio magnetotelluric (RMT) data. Geophysics 2004, 69, 1125–1350. [Google Scholar] [CrossRef]
  13. Schütze, C.; Vienken, T.; Werban, U.; Dietrich, P.; Finizola, A.; Carsten, L. Joint application of geophysical methods and Direct Push-soil gas surveys for the improved de-lineation of buried fault zones. J. Appl. Geophys. 2012, 82, 129–136. [Google Scholar] [CrossRef] [Green Version]
  14. Francese, R.; Mazzarini, F.; Bistacchi, A.; Morelli, G.; Pasquarè, G.; Praticelli, N.; Robain, H.; Wardell, N.; Zaja, A. A structural and geophysical approach to the study of fractured aquifers in the Scansano-Magliano in Toscana Ridge, southern Tuscany, Italy. Hydrogeol. J. 2009, 17, 1233–1246. [Google Scholar] [CrossRef] [Green Version]
  15. Bievre, G.; Jongmans, D.; Winiarski, T.; Zumbo, V. Application of geophysical measurements for assessing the role of fissures in water infiltration within a clay landslide (Trieves area, French Alps). Hydrol. Process. 2012, 26, 2128–2142. [Google Scholar] [CrossRef] [Green Version]
  16. Jones, G.; Sentanac, P.; Zielinski, M. Desiccation cracking using 2-D and 3-D electrical resistivity tomography: Validation on a flood embankment. J. Appl. Geophys. 2014, 106, 196–211. [Google Scholar] [CrossRef] [Green Version]
  17. Falco, P. Sondages Géoélectriques “Null-Arrays” Pour la Caractérisation des Structures de Subsurface. Ph.D. Thesis, Université de Neuchâtel, Faculté des sciences, Neuchâtel, Switzerland, 2013. [Google Scholar]
  18. Kirsch, R. Groundwater Geophysics: A Tool for Hydrogeology; Reinhard, K., Ed.; Springer: Berlin, Germany, 2006. [Google Scholar]
  19. Barnhardt, W.A.; Kayen, R.E. Radar Structure of Earthquake-Induced, Coastal Landslides in Anchorage, Alaska. Environ. Geosci. 2000, 7, 38–45. [Google Scholar] [CrossRef]
  20. Jeannin, M.; Garambois, S.; Jongmans, D.G. Multiconfiguration GPR Measurements for Geometric Fracture Characterization in Limestone Cliffs (Alps). Geophysics 2006, 71, 85–92. [Google Scholar] [CrossRef] [Green Version]
  21. Steelman, C.M.; Kennedy, C.; Parker, B.L. Geophysical Conceptualization of a Fractured Sedimentary Bedrock Riverbed using Ground Penetrating Radar. J. Hydrol. 2015, 521, 433–446. [Google Scholar] [CrossRef]
  22. Revil, A.; Karaoulis, M.; Johnson, T.; Kemna, A. Review: Some low-frequency electrical methods for subsurface characterization and monitoring in hydrogeology. Hydrogeol. J. 2012, 20, 617–658. [Google Scholar] [CrossRef]
  23. Ward, S.H. Geotechnical and Environmental Geophysics; Vol. I. Review and Tutorial; SEG: Tulsa, Oklahoma, 1990. [Google Scholar]
  24. Dahlin, T.; Zhou, B. A numerical comparison of 2D resistivity imaging with 10 electrode arrays. Geophys Prospect. 2004, 52, 379–398. [Google Scholar] [CrossRef] [Green Version]
  25. Tabbagh, J.; Samouelian, A.; Cousin, I. Numerical modelling of direct current electrical resistivity for the characterisation of cracks in soils. J. Appl. Geophys. 2007, 62, 313–323. [Google Scholar] [CrossRef]
  26. Szalai, S.; Koppán, A.; Szokoli, K.; Szarka, L. Geoelectric imaging properties of traditional arrays and of the optimized Stummer configuration. Near Surf. Geophys. 2013, 11, 51–62. [Google Scholar] [CrossRef] [Green Version]
  27. Stummer, P.; Maurer, H.; Green, A.G. Experimental design: Electrical resistivity data sets that provide optimum subsurface information. Geophysics 2004, 69, 120–139. [Google Scholar] [CrossRef]
  28. Szalai, S.; Szokoli, K.; Prácser, E.; Metwaly, M.; Zubair, M.; Szarka, L. An alternative way in electrical resistivity prospection: The quasi null arrays. Geophys. J. Int. 2020, 220, 1463–1480. [Google Scholar] [CrossRef]
  29. Zubair, M.; Prácser, E.; Metwaly, M.; Lemperger, I.; Szarka, L.; Israil, M.; Szalai, S. A comparative study of the Imaging capability of Quasi-Null and Dipole-Dipole electrode configurations over an elongated, dipping, semi-infinite conducting body. J. Appl. Geophys. 2020, 175, 103969. [Google Scholar] [CrossRef]
  30. Szalai, S.; Lemperger, I.; Metwaly, M.; Kis, Á.; Wesztergom, V.; Szokoli, K.; Novák, A. Multiplication of the depth of detectability using γ11n arrays. J. Appl. Geophys. 2014, 107, 195–206. [Google Scholar] [CrossRef] [Green Version]
  31. Szalai, S.; Kis, A.; Metwaly, M.; Lemperger, I.; Szokoli, K. Increasing the effectiveness of electrical resistivity tomography using γ11n configurations. Geophys. Prospect. 2014, 63, 508–524. [Google Scholar] [CrossRef] [Green Version]
  32. De Oliveira Braga, A.C.; Filho, W.M.; Dourado, J.C. Resistivity (DC) method applied to aquifer protection studies. Rev. Bras. De Geofísica 2006, 24, 573–581. [Google Scholar]
  33. Vaudelet, P.; Schmutz, M.; Pessel, M.; Franceschi, M.; Guérin, R.; Atteia, O.; Blondel, A.; Ngomseu, C.; Galaup, S.; Rejiba, F.; et al. Mapping of contaminant plumes with geoelectrical methods. A case study in urban context. J. Appl. Geophys. 2011, 75, 738–751. [Google Scholar] [CrossRef]
  34. Szűcs, P.; Kompár, L.; Palcsu, L.; Deák, J. Estimation of groundwater replenishment change at a Hungarian recharge area. Carpathian J. Earth Environ. Sci. 2015, 10, 227–246. [Google Scholar]
  35. Petitta, M.; Bodó, B.; Cseko, A.; Del Bon, A.; Fernandez, I.; García Alibrandi, C.M.; Garcia Padilla, M.; Hartai, É.; Hinsby, K.; Müller, P.; et al. The KINDRA project: Sharing and evaluating groundwater research and knowledge in Europe. Acque Sotter. Ital. J. Groundw. 2018, 7. [Google Scholar] [CrossRef]
  36. Palcsu, L.; Kompár, L.; Deák, J.; Szűcs, P.; Papp, L. Estimation of the natural groundwater recharge using tritium-peak and tritium/helium-3 dating techniques in Hungary. Geochem. J. 2017, 51, 439–448. [Google Scholar] [CrossRef] [Green Version]
  37. Haás, J. (Ed.) Geology of Hungary; Springer: Berlin/Heidelberg, Germany, 2013. [Google Scholar]
  38. Tóth, J.; Almási, I. Interpretation of observed fluid potential patterns in a deep sedimentary basin under tectonic compression Hungarian Great Plain, Pannonian Basin. Geofluids 2001, 1, 11–36. [Google Scholar] [CrossRef]
  39. Miklós, R.; Darabos, E.; Lénárt, L.; Kovács, A.; Pelczéder, Á.; Szabó, N.P.; Szűcs, P. Karst water resources and their complex utilization in the Bükk Mountains, northeast Hungary: An assessment from a regional hydrogeological perspective. Hydrogeol. J. 2020, 28, 2159–2172. [Google Scholar] [CrossRef]
  40. Szűcs, P.; Civan, F.; Virág, M. Applicability of the most frequent value method in groundwater modeling. Hydrogeol. J. 2006, 14, 31–43. [Google Scholar] [CrossRef]
  41. Szalai, S.; Kovács, L.; Kuslits, L.; Facskó, G.; Gribovszki, K.; Kalmár, J.; Szarka, L. Characterisation of fractures and fracture zones in a carbonate aquifer using Electrical Resistivity Tomography and Pricking Probe methods. J. Geosci. Environ. Prot. 2018, 6, 1–21. [Google Scholar]
  42. Dudko, A. Structural Elements of the Balaton Area; MÁFI: Budapest, Hungary, 1991. [Google Scholar]
  43. Széky-Fux, V.; Püspöki, Z.; Kozák, M. 2007: Covered neogen magmatism in Eastern Hungary. Acta Geographica and Geologica et Meteorologica Debrecina. Geol. Geomorphol. Phys. Geogr. Ser. 2007, 2, 79–104. [Google Scholar]
  44. Prácser, E. Annual Report about the Activity of the Geoelectric Laboratory in 1988. 3D d.c. Modeling; Eötvös Loránd Geophysical Institute, Internal Report: Budapest, Hungary, 1999. (In Hungarian) [Google Scholar]
  45. Advanced Geosciences. Instruction Manual of AGI EarthImager 2D, Version 2.1.7; Advanced Geosciences Inc.: Austin, TX, USA, 2006. [Google Scholar]
  46. Loke, M.H. RES2DINV*64 ver.4.08. In Rapid 2-D Resisitivity & IP Inversion Using the Last-Squares Method; Geotomo Software: Penang, Malaysia, 2018. [Google Scholar]
  47. Dey, A.; Morrison, H.F. Resistivity modelling for arbitrary shaped two-dimensional structures. Geophys. Prospect. 1979, 27, 106–136. [Google Scholar] [CrossRef]
  48. Serra, O. Fundamentals of Well-Log Interpretation; Elsevier: New York, NY, USA, 1984. [Google Scholar]
  49. Walsh, D.; Turner, P.; Grunewald, E.; Zhang, H.; Butler, J.J.; Reboulet, E.; Knobbe, S.; Christy, T.; Lane, J.W.; Johnson, C.D.; et al. A small-diameter NMR logging tool for groundwater investigations. Groundwater 2013, 51, 914–926. [Google Scholar] [CrossRef]
  50. Fejes, I.; Jósa, E. The engineering geophysical sounding method. Principles, instrumentation, and computerised interpretation. In Geotechnical and Environmental Geophysics; 2, Environmental and Groundwater; Ward, S.H., Ed.; SEG: Tulsa, OK, USA, 1990; pp. 321–331. [Google Scholar]
  51. Bear, J. Dynamics of Fluids in Porous Media; Dover: New York, NY, USA, 1972. [Google Scholar]
  52. Juhász, J. Hydrogeology; Akadémiai Kiadó: Budapest, Hungary, 2002. (In Hungarian) [Google Scholar]
  53. Larionov, V.V. Radiometry of Boreholes; Nedra: Moscow, Russia, 1969. (In Russian) [Google Scholar]
  54. Csókás, J. Determination of water discharge and quality using geophysical well logs. Magy. Geofiz. 1995, 35, 176–203. (In Hungarian) [Google Scholar]
  55. Alger, R.P. Interpretation of electric logs in fresh water wells in unconsolidated formation. SPE Reprint Series 1 1971, 255, 1–25. [Google Scholar]
  56. Archie, G.E. The electrical resistivity log as an aid in determining some reservoir characteristics. SpeTrans. Aime 1942, 146, 54–62. [Google Scholar] [CrossRef]
  57. Hartigan, J.A.; Wong, M.A. Algorithm AS 136: A k-means clustering algorithm. J. R. Stat. Soc. Ser. C Appl. Stat. 1979, 28, 100–108. [Google Scholar] [CrossRef]
  58. Szabó, N.P.; Nehéz, K.; Hornyák, O.; Piller, I.; Deák, C.; Hanzelik, P.P.; Kutasi, C.; Ott, K. Cluster analysis of core measurements using heterogeneous data sources: An application to complex Miocene reservoirs. J. Pet. Sci. Eng. 2019, 178, 575–585. [Google Scholar] [CrossRef]
  59. Szabó, N.P.; Dobróka, M. Robust estimation of reservoir shaliness by iteratively reweighted factor analysis. Geophysics 2017, 82, D69–D83. [Google Scholar] [CrossRef] [Green Version]
  60. Szabó, N.P.; Dobróka, M.; Drahos, D. Factor analysis of engineering geophysical sounding data for water-saturation estimation in shallow formations. Geophysics 2012, 77, WA35–WA44. [Google Scholar] [CrossRef] [Green Version]
  61. Hauck, C.; Mühll, D.V. Inversion and Interpretation of Two-dimensional Geoelectrical Measurements for Detecting Permafrost in Mountainous Regions. Permafr. Periglac. Process. 2003, 14, 305–318. [Google Scholar] [CrossRef]
  62. Kuras, O.; Meldrum, P.I.; Haslam, E.P.; Wilkinson, P.B.; Krautblatter, M.; Murton, J.B.; Ogilvy, R.D. Time-lapse Capacitive Resistivity Imaging A Novel Methodology for the Monitoring of Permafrost Processes in Bedrock. In Proceedings of the Near Surface 2011 17th European Meeting of Environmental and Engineering Geophysics 2011, Leicester, UK, 12–14 September 2011. [Google Scholar]
  63. Szabó, N.P.; Kormos, K.; Dobróka, M. Evaluation of hydraulic conductivity in shallow groundwater formations: A comparative study of the Csókás’ and Kozeny–Carman model. Acta Geod Geophys 2015, 50, 461–477. [Google Scholar] [CrossRef] [Green Version]
  64. Szabó, N.P.; Dobróka, M.; Turai, E.; Szűcs, P. Factor analysis of borehole logs for evaluating formation shaliness: A hydrogeophysical application for groundwater studies. Hydrogeol. J. 2014, 22, 511–526. [Google Scholar] [CrossRef]
  65. Szabó, N.P. Hydraulic conductivity explored by factor analysis of borehole geophysical data. Hydrogeol. J. 2015, 23, 869–882. [Google Scholar] [CrossRef]
  66. Dobróka, M.; Szabó, N.P.; Tóth, J.; Vass, P. Interval inversion approach for an improved interpretation of well logs. Geophysics 2016, 81, D163–D175. [Google Scholar] [CrossRef] [Green Version]
  67. Abordán, A.; Szabó, N.P. Uncertainty reduction of interval inversion estimation results using a factor analysis approach. Int. J. Geomath. 2020, 11, 1–17. [Google Scholar] [CrossRef] [Green Version]
Figure 1. Twenty-nine Hungarian karst and thermal karst groundwater bodies were identified by the Hungarian River Basin Management Plan.
Applsci 11 02099 g001
Figure 2. Qualification of quantitative state of Hungarian groundwater bodies.
Applsci 11 02099 g002
Figure 3. Overview of the study areas investigated by the proposed hydrogeophysical methods: (a) locations of the Hungarian sites; (b) Sopron area, Hungary (Section 3.1.1); (c) Kádárta area, Hungary (Section 3.1.2); (d) Khubaripur area, India (Section 3.1.3); (e) Baktalórántháza area, Hungary (Section 3.2).
Applsci 11 02099 g003
Figure 4. Traditional and quasi-null arrays, stars denote current-, circles indicate potential electrodes, n is a properly chosen integer. For the parameters of the Stummer array, see [27].
Applsci 11 02099 g004
Figure 5. Study of a series of faults (Section 3.1.1) using different geoelectric arrays: ERT images above a series of faults. Rectangles horizontally delineate the supposed fault fracture zones. a1–3 denotes the anomaly zones.
Applsci 11 02099 g005
Figure 6. Characterization of a fault and a water-bearing fracture zone by the traditional WS array (inverted by EarthImager code: WS1, by Res2D-Hu code: WS2) and two quasi null arrays (Section 3.1.2).
Applsci 11 02099 g006
Figure 7. Fracture localization by electrical resistivity tomography (ERT) method (Stummer array, 30 electrodes, 1 m electrode spacing). Dotted lines are rock block boundaries; the condition of the dolomite is assumed on the basis of its resistivity (Section 3.1.2).
Applsci 11 02099 g007
Figure 8. Electrical resistivity tomography reconstruction of water-bearing zones (red rectangles and ellipses) using different geoelectric methods (Section 3.1.2). The WS1 profile is taken from [41].
Applsci 11 02099 g008
Figure 9. Fault zone characterization: (a) Dp electrical resistivity tomography (ERT) section; (b) γ116 ERT section; (c) the near-surface apparent resistivity profile measured by the γ116 array, green rectangle delineates the fracture zone according to the γ116 profile, red lines mark two other main fractures (Section 3.1.3).
Applsci 11 02099 g009
Figure 10. Observed wireline logs (tracks 1-6) and the estimated petrophysical parameters of porous groundwater formations (track 7) in Baktalórántháza-1 well, northeast Hungary.
Applsci 11 02099 g010
Figure 11. Histograms of grain sizes derived by sieve analysis: (a) relative occurrence of effective grain diameter data; (b) relative occurrence of effective grain diameter data; (c) relative occurrence of dominant grain diameter data; (d) relative occurrence of uniformity coefficient data in Baktalórántháza-1 well.
Applsci 11 02099 g011
Figure 12. Regression relationships between the measured (apparent) resistivity and petrophysical parameters of the studied groundwater formations: (a) resistivity vs. clay content; (b) resistivity vs. hydraulic conductivity in Baktalórántháza-1 well.
Applsci 11 02099 g012
Figure 13. Result of cluster analysis based on the L1-norm. The clusters (clusters 1-3) are represented in the data space of in situ measured parameters: (a) natural gamma-ray intensity, borehole caliper and spontaneous potential; (b) natural gamma-ray intensity, apparent (shallow) resistivity and thermal neutron intensity in Baktalórántháza-1 well.
Applsci 11 02099 g013
Figure 14. Result of multivariate statistical analysis of wireline logs in Baktalórántháza-1 well in Baktalórántháza-1 well, northeast Hungary.
Applsci 11 02099 g014
Table 1. Challenges in the investigation of Hungarian groundwater bodies and their solution by the best applicable (X) geophysical methods.
Challenge No.Hydrogeological ProblemHydrogeophysical Method
DC GeoelectricLithology LogsPorosity LogsResistivity Logs
1Identification and classification of aquifersXX
2Detection of lateral and vertical extensions of the groundwater bodiesXX
3Detection of lateral and vertical changes inside the groundwater bodiesXXXX
4Detection of faults, fractures and conduits in karst, volcanic and metamorphic formationsX X
5Estimation of different hydraulic and petrophysical properties XXX
6Detection of contaminations plumes in the subsurface mediaX X
Publisher’s Note: MDPI stays neutral with regard to jurisdictional claims in published maps and institutional affiliations.

