1. Introduction
Dust emission to the atmosphere, caused by wind erosion, could have significant effects on the environment and human health [
1,
2,
3]. This depends on the characteristics of the winds and the eroded surface area [
4,
5]. Anthropogenic activities, such as mining, quarrying, excavating, and the use of unpaved roads, increase the terrain’s sensitivity to dust emission. For example, heavy vehicles traveling on unpaved roads could grind the roads’ surfaces to fine particles that become available to wind erosion [
6,
7,
8].
Environmental regulators, such as the U.S. Environmental Protection Agency (EPA), recommend and enforce the use of dust control techniques. A common practice to prevent dust emission from unpaved roads is the application of anti-dust emission solutions. The two main types of such solutions are as follows: (i) Natural or synthetic polymers, e.g., lignin, resin, bitumen, and polyvinyl acetate (PVA) [
9]. These materials contain long organic chains with functional groups that could adsorb and adhere to dust particles, forming bigger and heavier aggregates [
10]. (ii) Brines with high concentrations of hydrous calcium–magnesium chloride solution, which decreases the dust emission by a hygroscopic mechanism [
11]. For both cases, the increased weights of these aggregates limit their lifting by the erosive forces of the wind, leading to a reduction in dust emission.
Katra [
12] tested the effectiveness of the lignin, resin, bitumen, PVA, and brine application in preventing dust emission by wind from unpaved roads. These tests were conducted under controlled laboratory and field conditions, using wind tunnels with varied wind velocities and time durations. It was found in this experiment that among the tested anti-dust emission solutions, brine from the Dead Sea was the most effective solution in preventing the dust emission; the brine application decreased the dust emission by >90% of the dust emissions under the control treatment [
12].
Arid and semiarid regions are characterized by a long dry season and a short wet season with limited precipitation. Thus, natural water resources, such as groundwater and non-salty surface water (fresh water, FW) in these regions, are scarce [
13]. Moreover, the climate conditions and the high population growth in these regions lead to an escalation of irrigation with low quality water, such as treated wastewater (TWW) and saline water [
13], which increases the salinization of the water sources in the region [
13].
Most of the haul roads in mines and quarries are unpaved roads covered with a layer (usually 20–30 cm thick) of calcareous granules (granular material) that sensitive to dust emission. A common practice to prevent the dust emission from these unpaved roads in arid and semiarid regions, such as Israel, is the application of hyper-saline solution (brine) on the unpaved roads. In recent years, concerns have been raised regarding the application of the brine solution on unpaved roads for controlling dust emission. It was claimed that the application of the brine solution with very high salinity will further increase the salinization of the water resources. Indeed, some quarries use FW instead of brine solution in their anti-dust practices. However, since FW is scarce in arid and semiarid regions, TWW is also used for the purpose of anti-dust emission on unpaved roads.
The TWW is characterized by moderate salt concentration, particularly Cl and Na ions; high concentrations of toxic, inorganic macro- and micro-elements, such as NO
3, boron and heavy metals; and high contents of suspended and soluble organic matters, including organic pollutants and pathogens [
13]. The brine solution, however, is characterized by very high salt concentration, particularly of Cl, Ca, and Mg ions, and a high concentration of toxic heavy metals, such as Ni, Co, Cd, and Pb. Therefore, during the rainfall season, high concentrations of salts and toxic elements and compounds could be leached from the unpaved roads treated with TWW or brine solutions and salt, and contaminate the water sources.
The present study is focused on the salinization of water sources following the application of anti-dust emission solutions on unpaved roads. The trend of using FW or TWW as anti-dust emission solutions instead of brine solution in arid and semiarid regions is based on the assumption that a decrease in the salinity of the anti-dust emission solution will necessarily decrease the salinization of the water sources in the region. However, the salinization of the water sources, under the application of anti-dust emission solutions, is dependent on varied factors other than the salinity of the anti-dust emission solutions. Therefore, the general objective of the present study was to investigate the effects of the application of TWW, FW, and brine solutions on unpaved roads as anti-dust emission solutions on the salinity of the water resources in arid and semiarid regions, such as Israel. The specific objectives were to determine or estimate the effects of the application of TWW, FW and brine solutions on the following: (i) The accumulated amounts of the solutes on the unpaved roads. (ii) The leaching rates of the ions, Cl, Na, and Ca+Mg, from the treated granular material by consecutive rainstorms. (iii) The distribution movement of the rainwater and solutes during the rainstorm via lateral movement on the terrine surface as surface runoff, or vertical movement with the infiltrating water; (iv) the long-term average of the salinization rates of the water sources.
3. Results and Discussion
The evaluation of the salinization risks of the water sources following the application of the anti-dust emission solutions (brine, TWW, and FW) was based on two main processes: (i) The annual loaded amounts of the solutes and their accumulations on the unpaved roads following the applications of the treatment solutions in the dry season (summer). (ii) Leaching rates by rainfall of the studied ions (Cl, Na, and Ca+Mg) from the granular material, which was pretreated with the treatment solutions.
The leaching rates of the Cl, Na, and Ca+Mg ions from the pretreated granular materials were determined using a rainfall simulator. Runoff was not formed in the different treated granular materials during the consecutive rainstorms. The packaging of the granular materials in the surface of the unpaved roads and in the rainfall simulator trays was similar in general. Thus, the infiltration rates of the granular materials are >48 mm h−1 (the rainstorms’ intensity), and most of the movement of the solutes with the rainwater is vertical. Therefore, the salinization risk to the surface water sources near the treated unpaved roads by the treatment solutions is likely negligible, unless the infiltration rate of the surface area of the unpaved roads below the granular material layer is lower than the rainfall intensity. Otherwise, on the sublayer, the lateral movement of water with soluble ions could occur. However, this movement is very slow, and usually infiltrates through the cracks into the rocks, so would not be a predominant flow route.
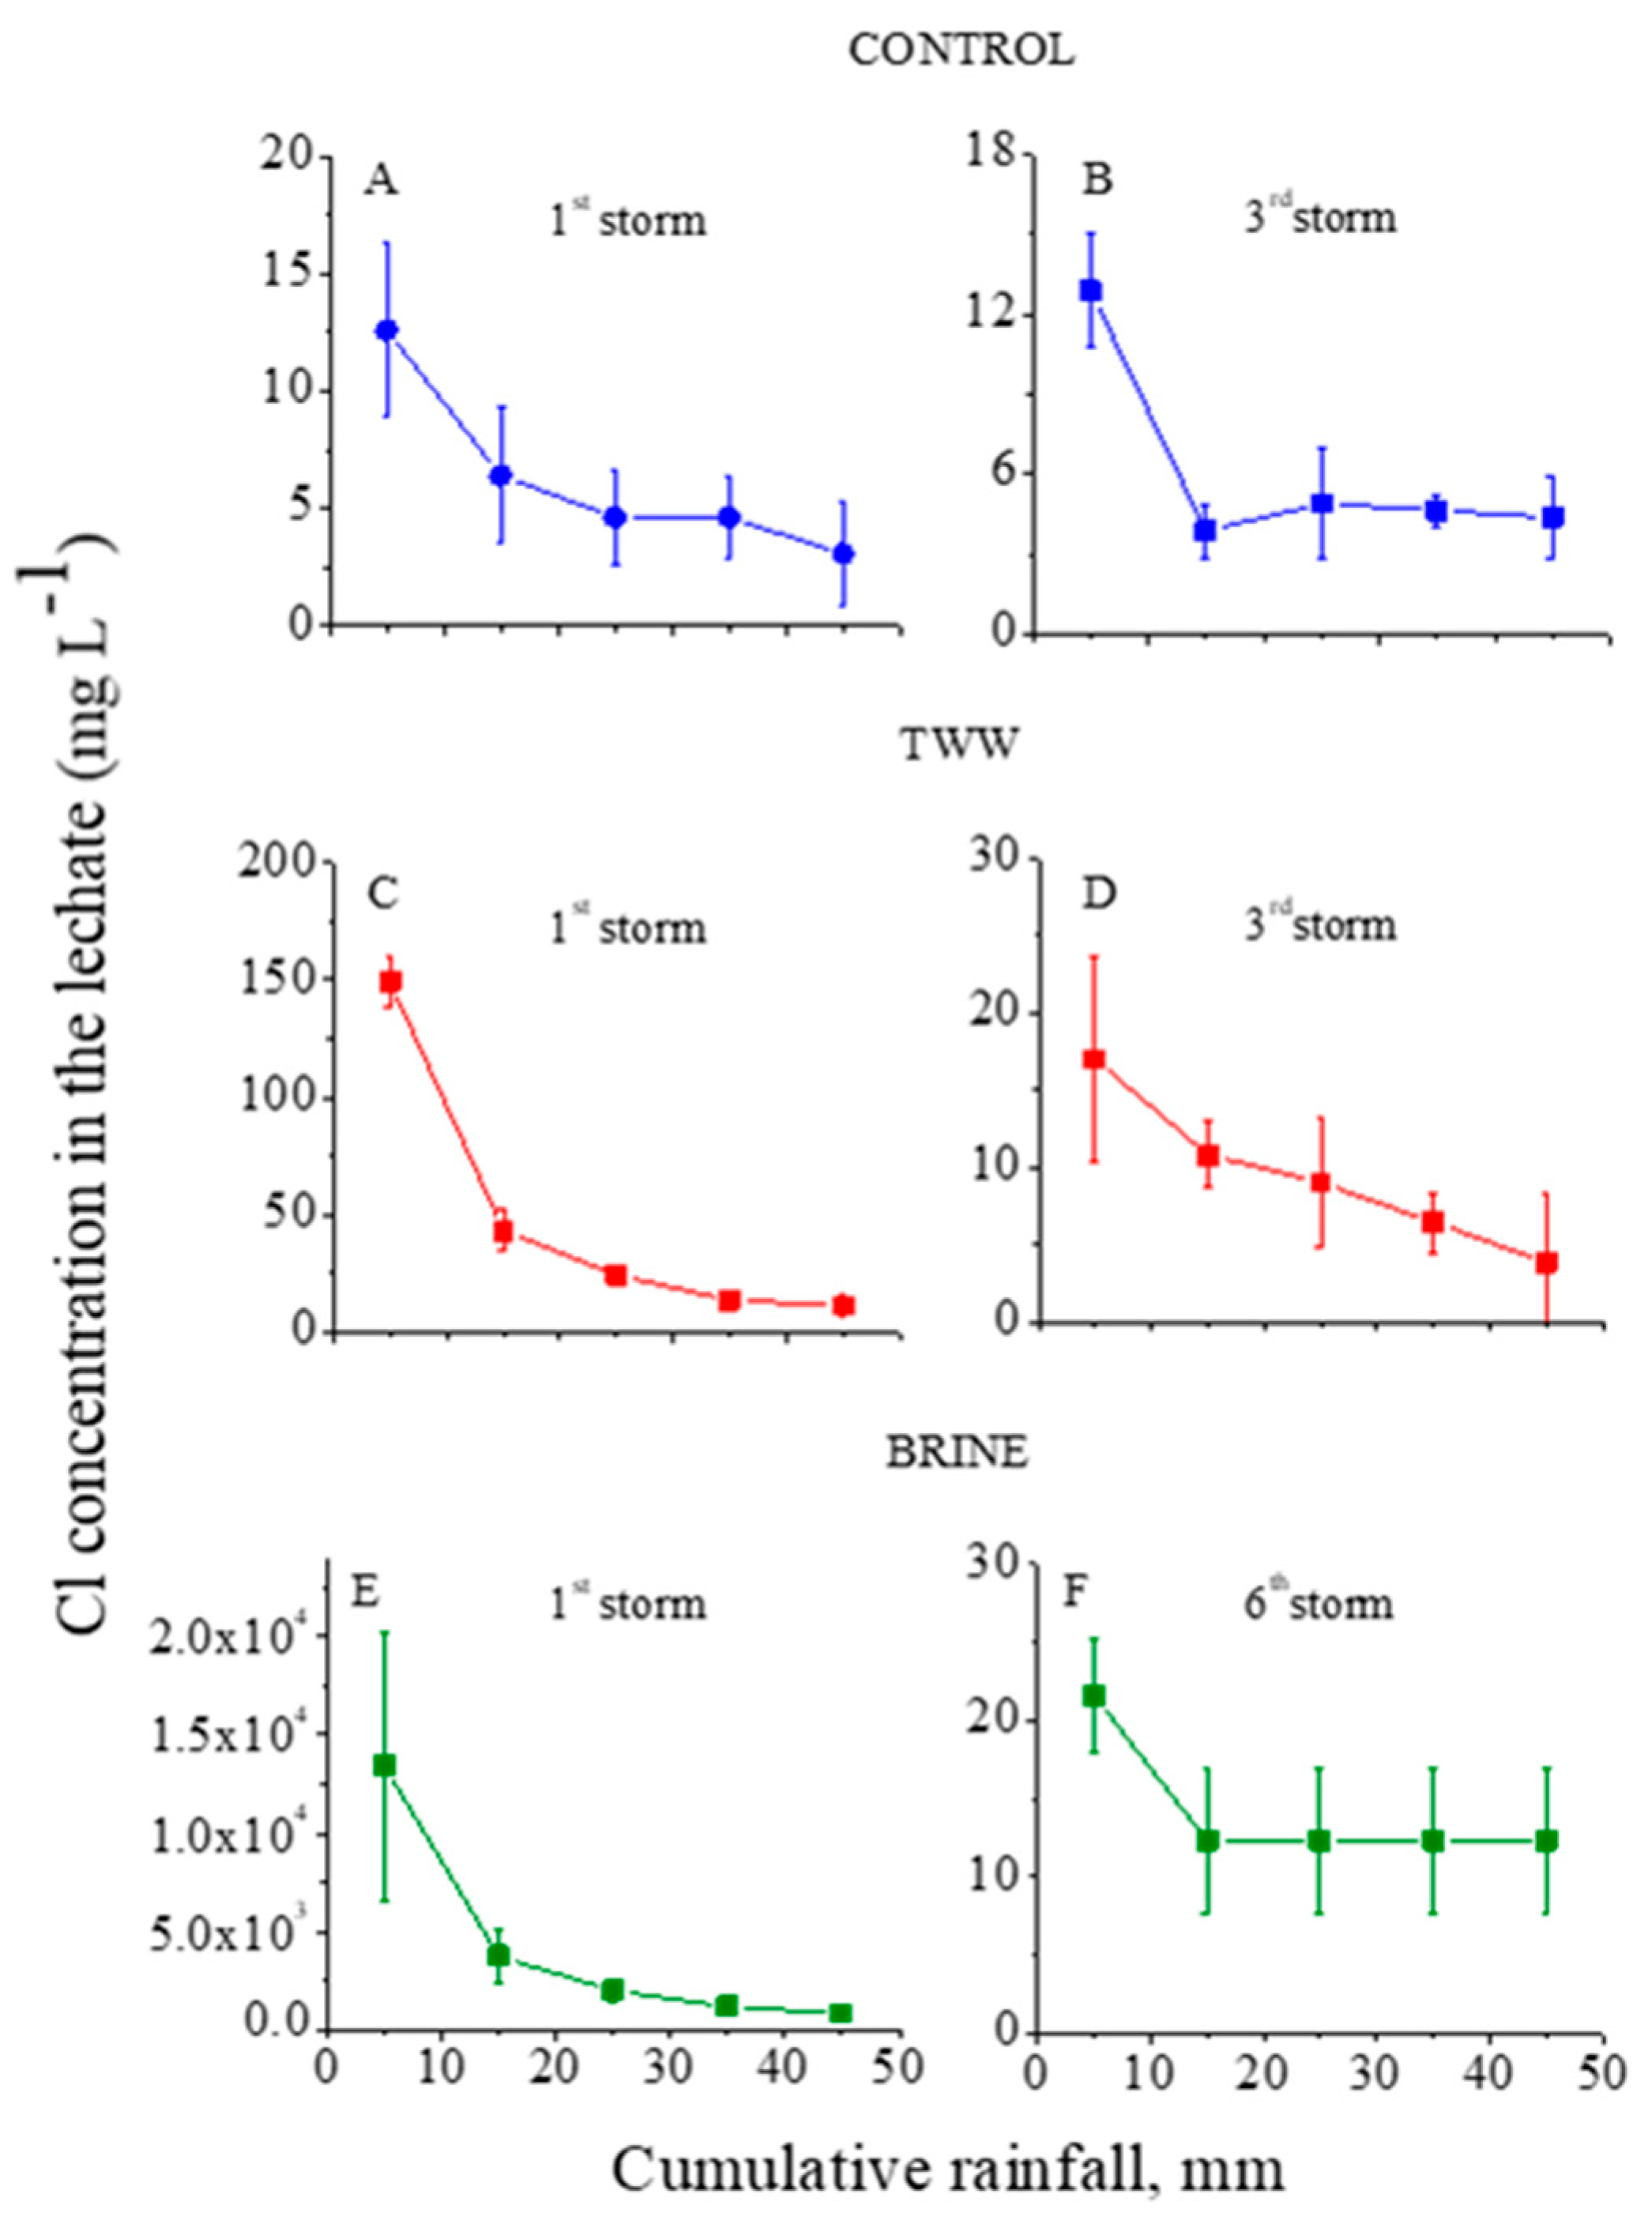
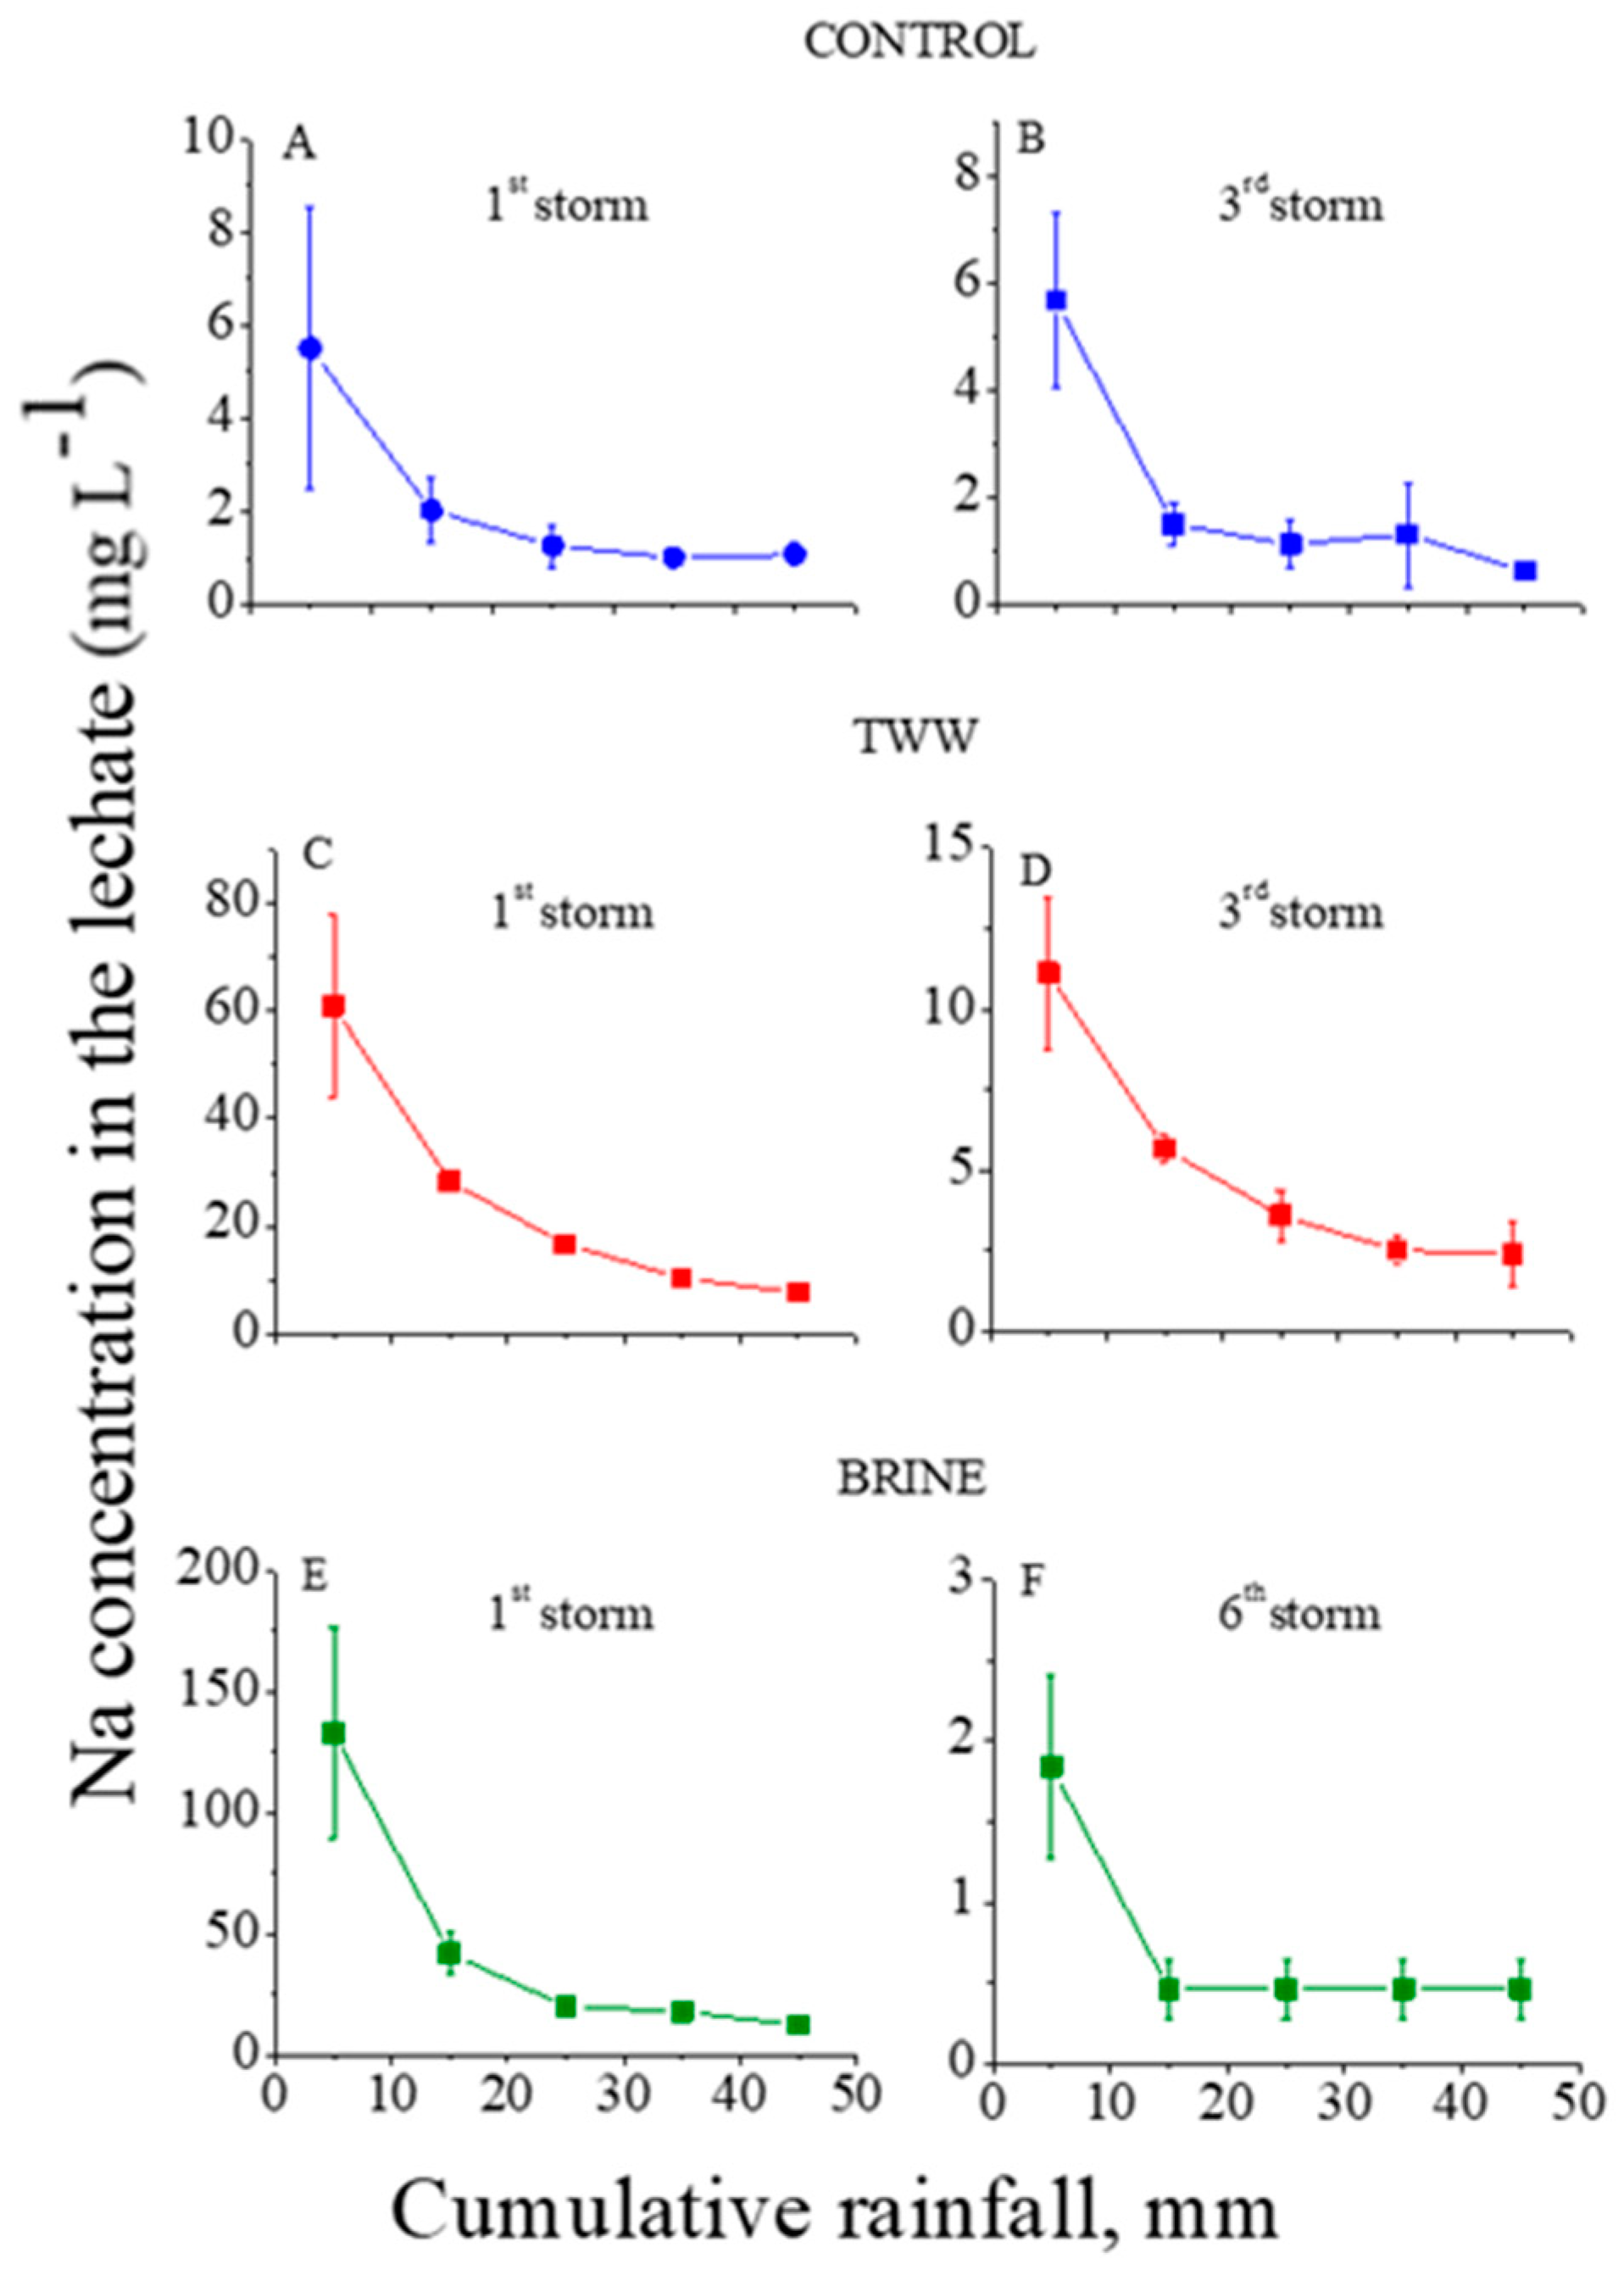
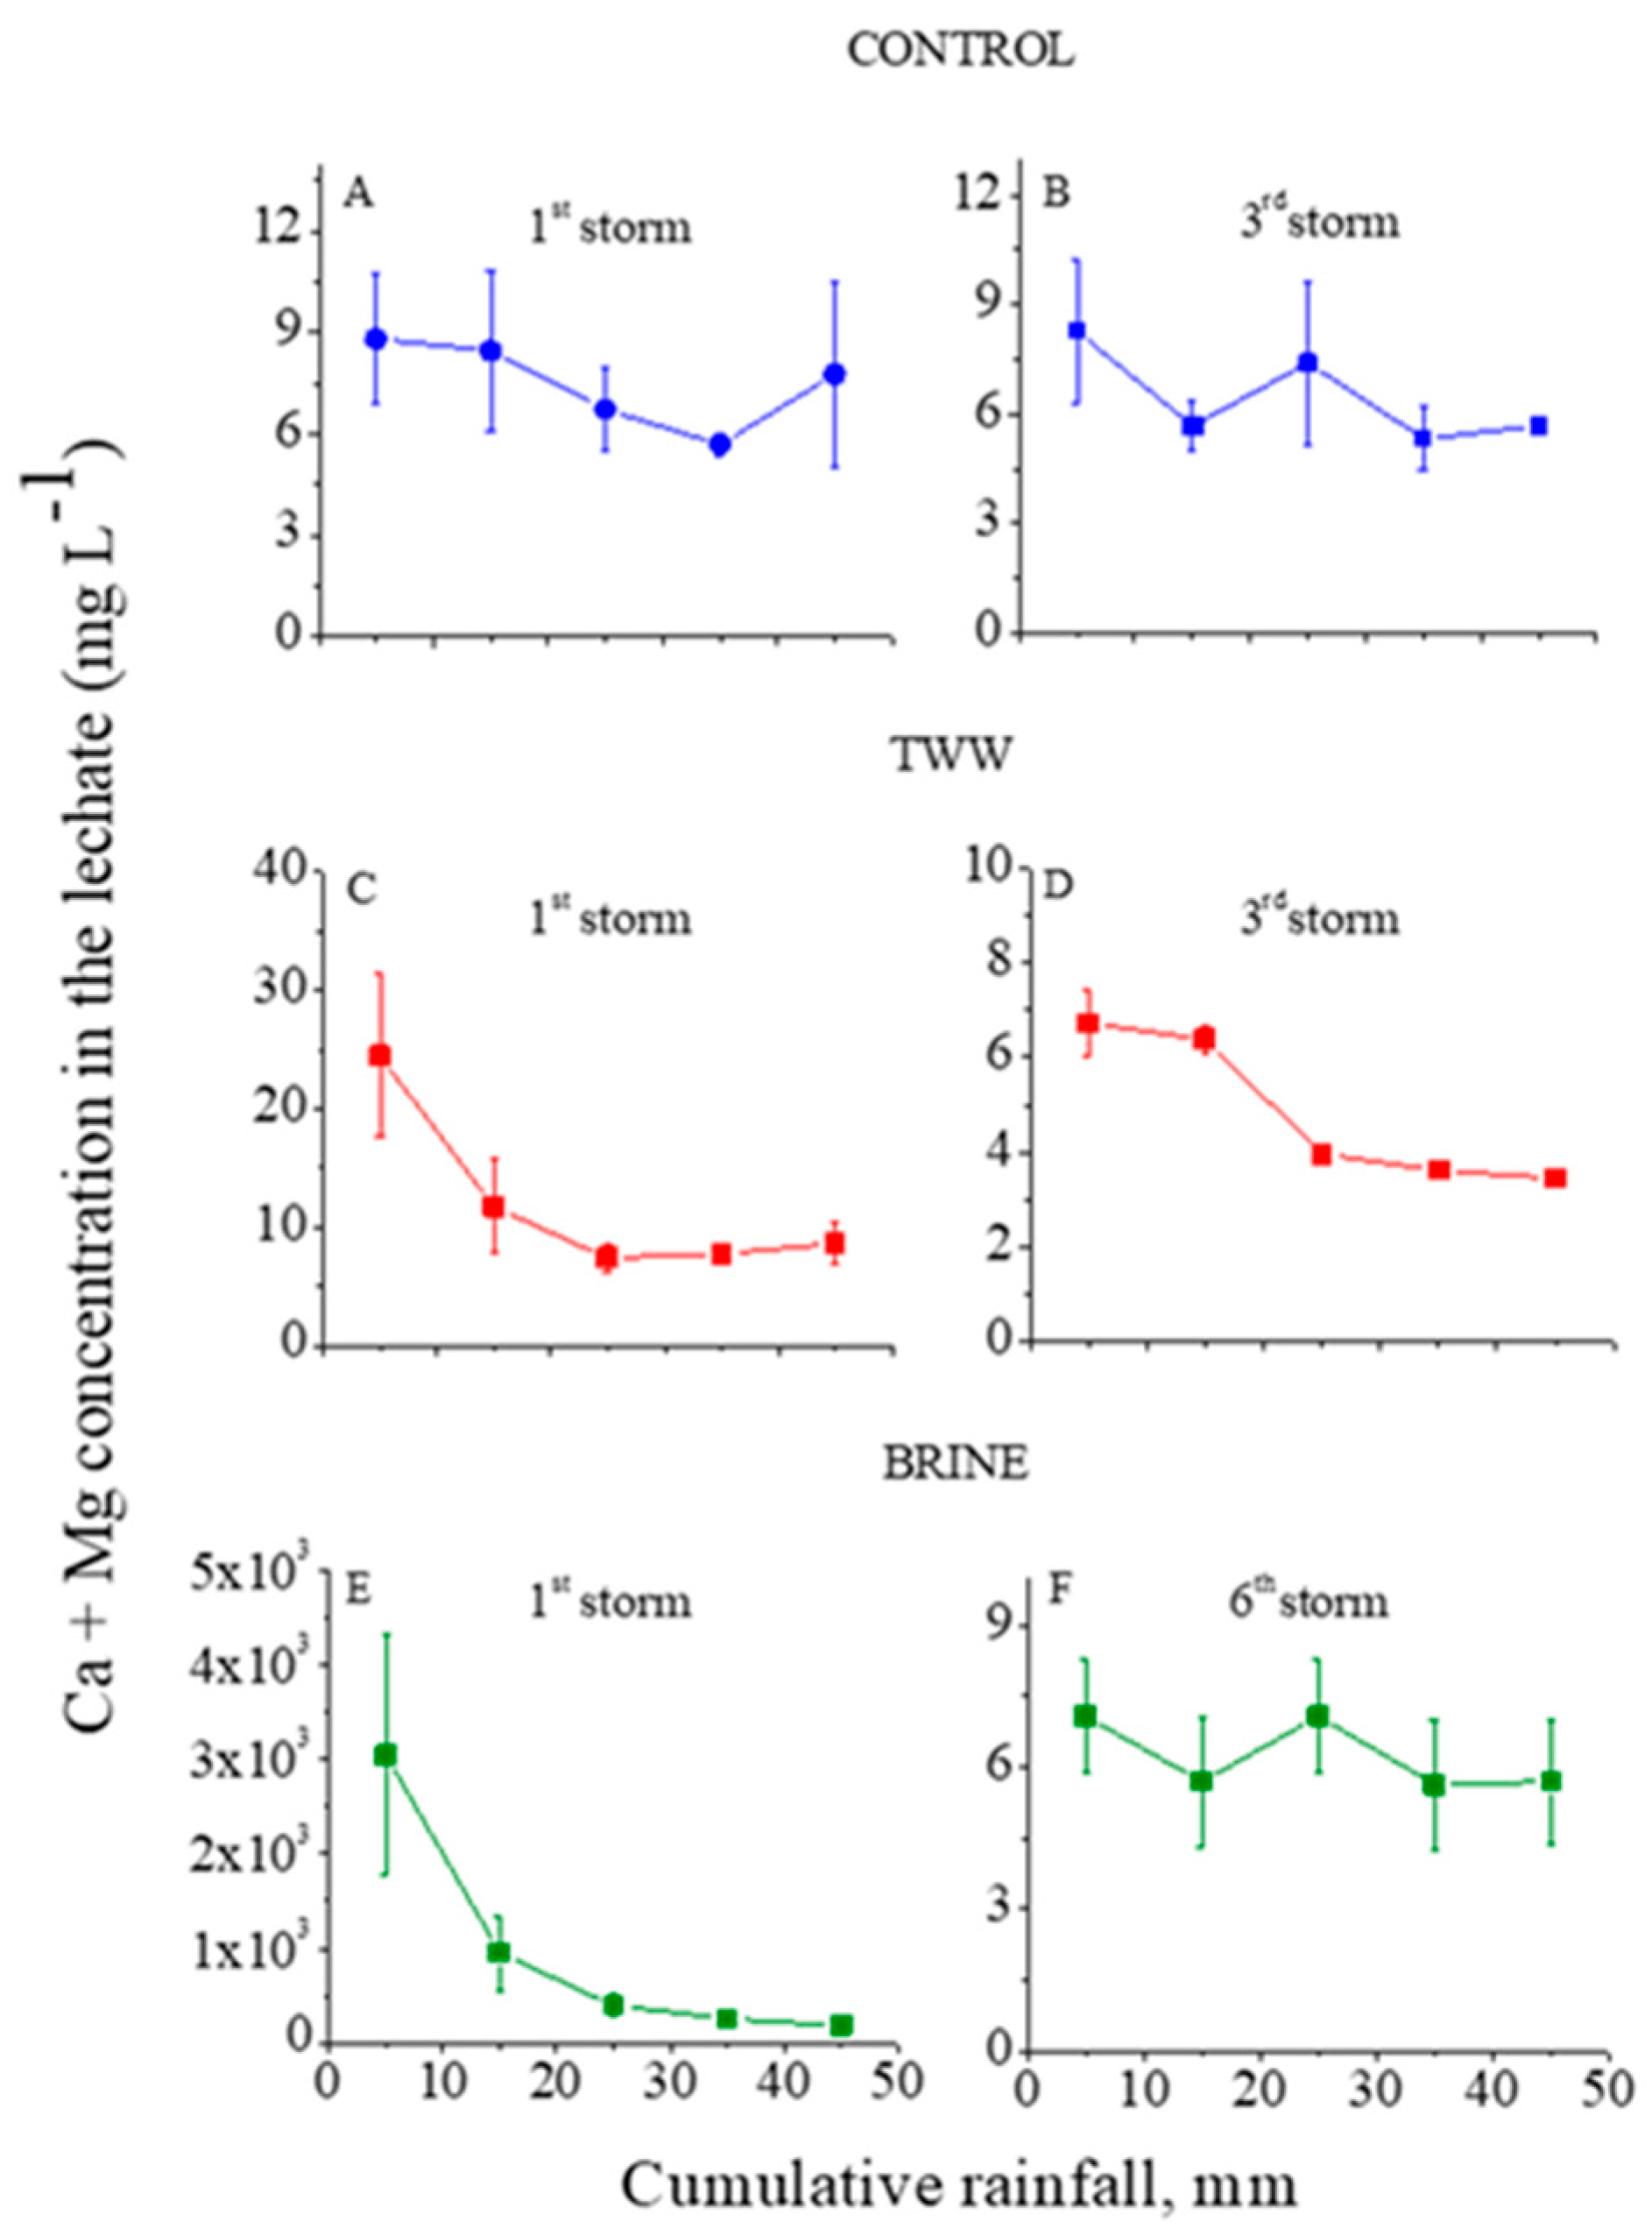
The ion concentrations in the outflow (leachate) from the trays with the treated granular material as functions of the cumulative rainfall are presented in
Figure 1,
Figure 2 and
Figure 3 for Cl, Na, and Ca+Mg, respectively. In these figures, the first and third (last) consecutive rainstorms for the control and TWW treatments, and the first and sixth (last) for the brine treatment are presented. Because the concentrations of each ion in the leachate in the second and the last consecutive rainstorms were fairly similar, only the first and the last consecutive rainstorm are presented in the figures. In addition, in the control treatment, the concentrations of the analyzed ions in the leachate reached steady state values quite fast, and no later than the end of the third consecutive rainstorm.
In the control treatment, the concentrations of Cl and Na in the leachate at the first and third consecutive rainstorms were relatively low: <13 and <6 mg L
−1, respectively (
Figure 1A and
Figure 2A). These low concentrations suggest that the amounts of highly soluble minerals with Na and Cl in the granular material were low. In contrast, the dissolution of the lime in the calcareous granular material in the control treatment kept the concentrations of the Ca+Mg in the leachate relatively high and quite constant, with an average value of ~7.5 mg L
−1 along the consecutive rainstorms (
Figure 3A,B). For the TWW and brine treatments, in the beginning of the first rainstorms (
Figure 1,
Figure 2 and
Figure 3) the concentrations of the ions (Cl, Na, and Ca+Mg) in the leachate were higher than in the control treatment. These high concentrations were a result of the previous applications of the TWW and brine solutions on the granular materials. However, these high concentrations of Cl, Na, and Ca+Mg decreased sharply with the cumulative rainfall, and near the end of the last rainstorm, the concentrations of these ions were similar to their corresponding concentrations in the control treatment (
Figure 1,
Figure 2 and
Figure 3).
According to the rainfall simulator results (
Figure 1,
Figure 2 and
Figure 3), for each studied ion and treatment solution the total leaching amounts (
£j) of ion
j (Cl, Na, or Ca+Mg) from the treated granular material during the consecutive rainstorms, as a percentage of the total added amount of ion
j by the treatment solution, were calculated by Equation (1):
where
k is the consecutive serial number of the consecutive rainstorm;
Vdi and
Cdi are the leachate volumes (L m
−2) and concentrations (gr L
−1) of ion
j, respectively, for brine or TWW applications; and the
Vci and
Cci are the leachate volumes (L m
−2) and concentrations (gr L
−1) of ion
j, respectively, for the control treatment, when I is the consecutive serial number of the rainfall fractions in each consecutive rainstorm.
Sj is the amount of ion
j (mg m
−2) added to the granular material with each application event of the brine or TWW, when
L is the total number of the application events. For determining the
£j values for brine treatment by Equation (1), the values of
Vci and
Cci of the fourth, fifth and sixth consecutive rainstorms in the control treatment were, most likely, equal, corresponding with the values of the third rainstorm in the control treatment (
Figure 1A,
Figure 2A, and
Figure 3A). This is because the values of
Vci and
Cci at the third rainstorm in the control treatment reached steady state values (
Figure 1A,
Figure 2A, and
Figure 3A).
The £j values for Cl, Na, and Ca+Mg ions indicated that >99.5% of the amounts of these ions added onto the granular material by the WWT or brine solutions were leached down during the rainstorms. These results strengthen the previous observation that the calcareous granular material has a negligible capacity to adsorb the studied ions, and to prevent their vertical movement.
The total loaded amounts of the solutes on the unpaved roads by the treatment solutions could be leached down by the rainstorm and increase the salinity of the groundwater. Therefore, the load of each studied ion by each solution treatment should be determined. The total annual load amount (
Pj) (kg m
−2) of ion
j, where
j could be Cl, Na, or Ca+Mg, on 1 m
2 of the surface area of the unpaved road by the application of brine, TWW, or FW, was determined by Equation (2):
where
Cji is the concentration (mg L
−1) of the applied ion
j (Cl, Na, or Ca+Mg), and
Vji is the volume (L m
−2) of the brine, TWW, or FW solution containing the ion
j, which is applied in the application event
i on a specific application day.
β is the number of application days in a year. According to the Israeli regulation, for the three treatment solutions (brine, TWW, and FW), the
Vji equals 4 L m
−2; for the FW and TWW treatment solutions, the
N equals 10 and
β equals 192; and for the brine solution the N equals 1 and
β equals 1.
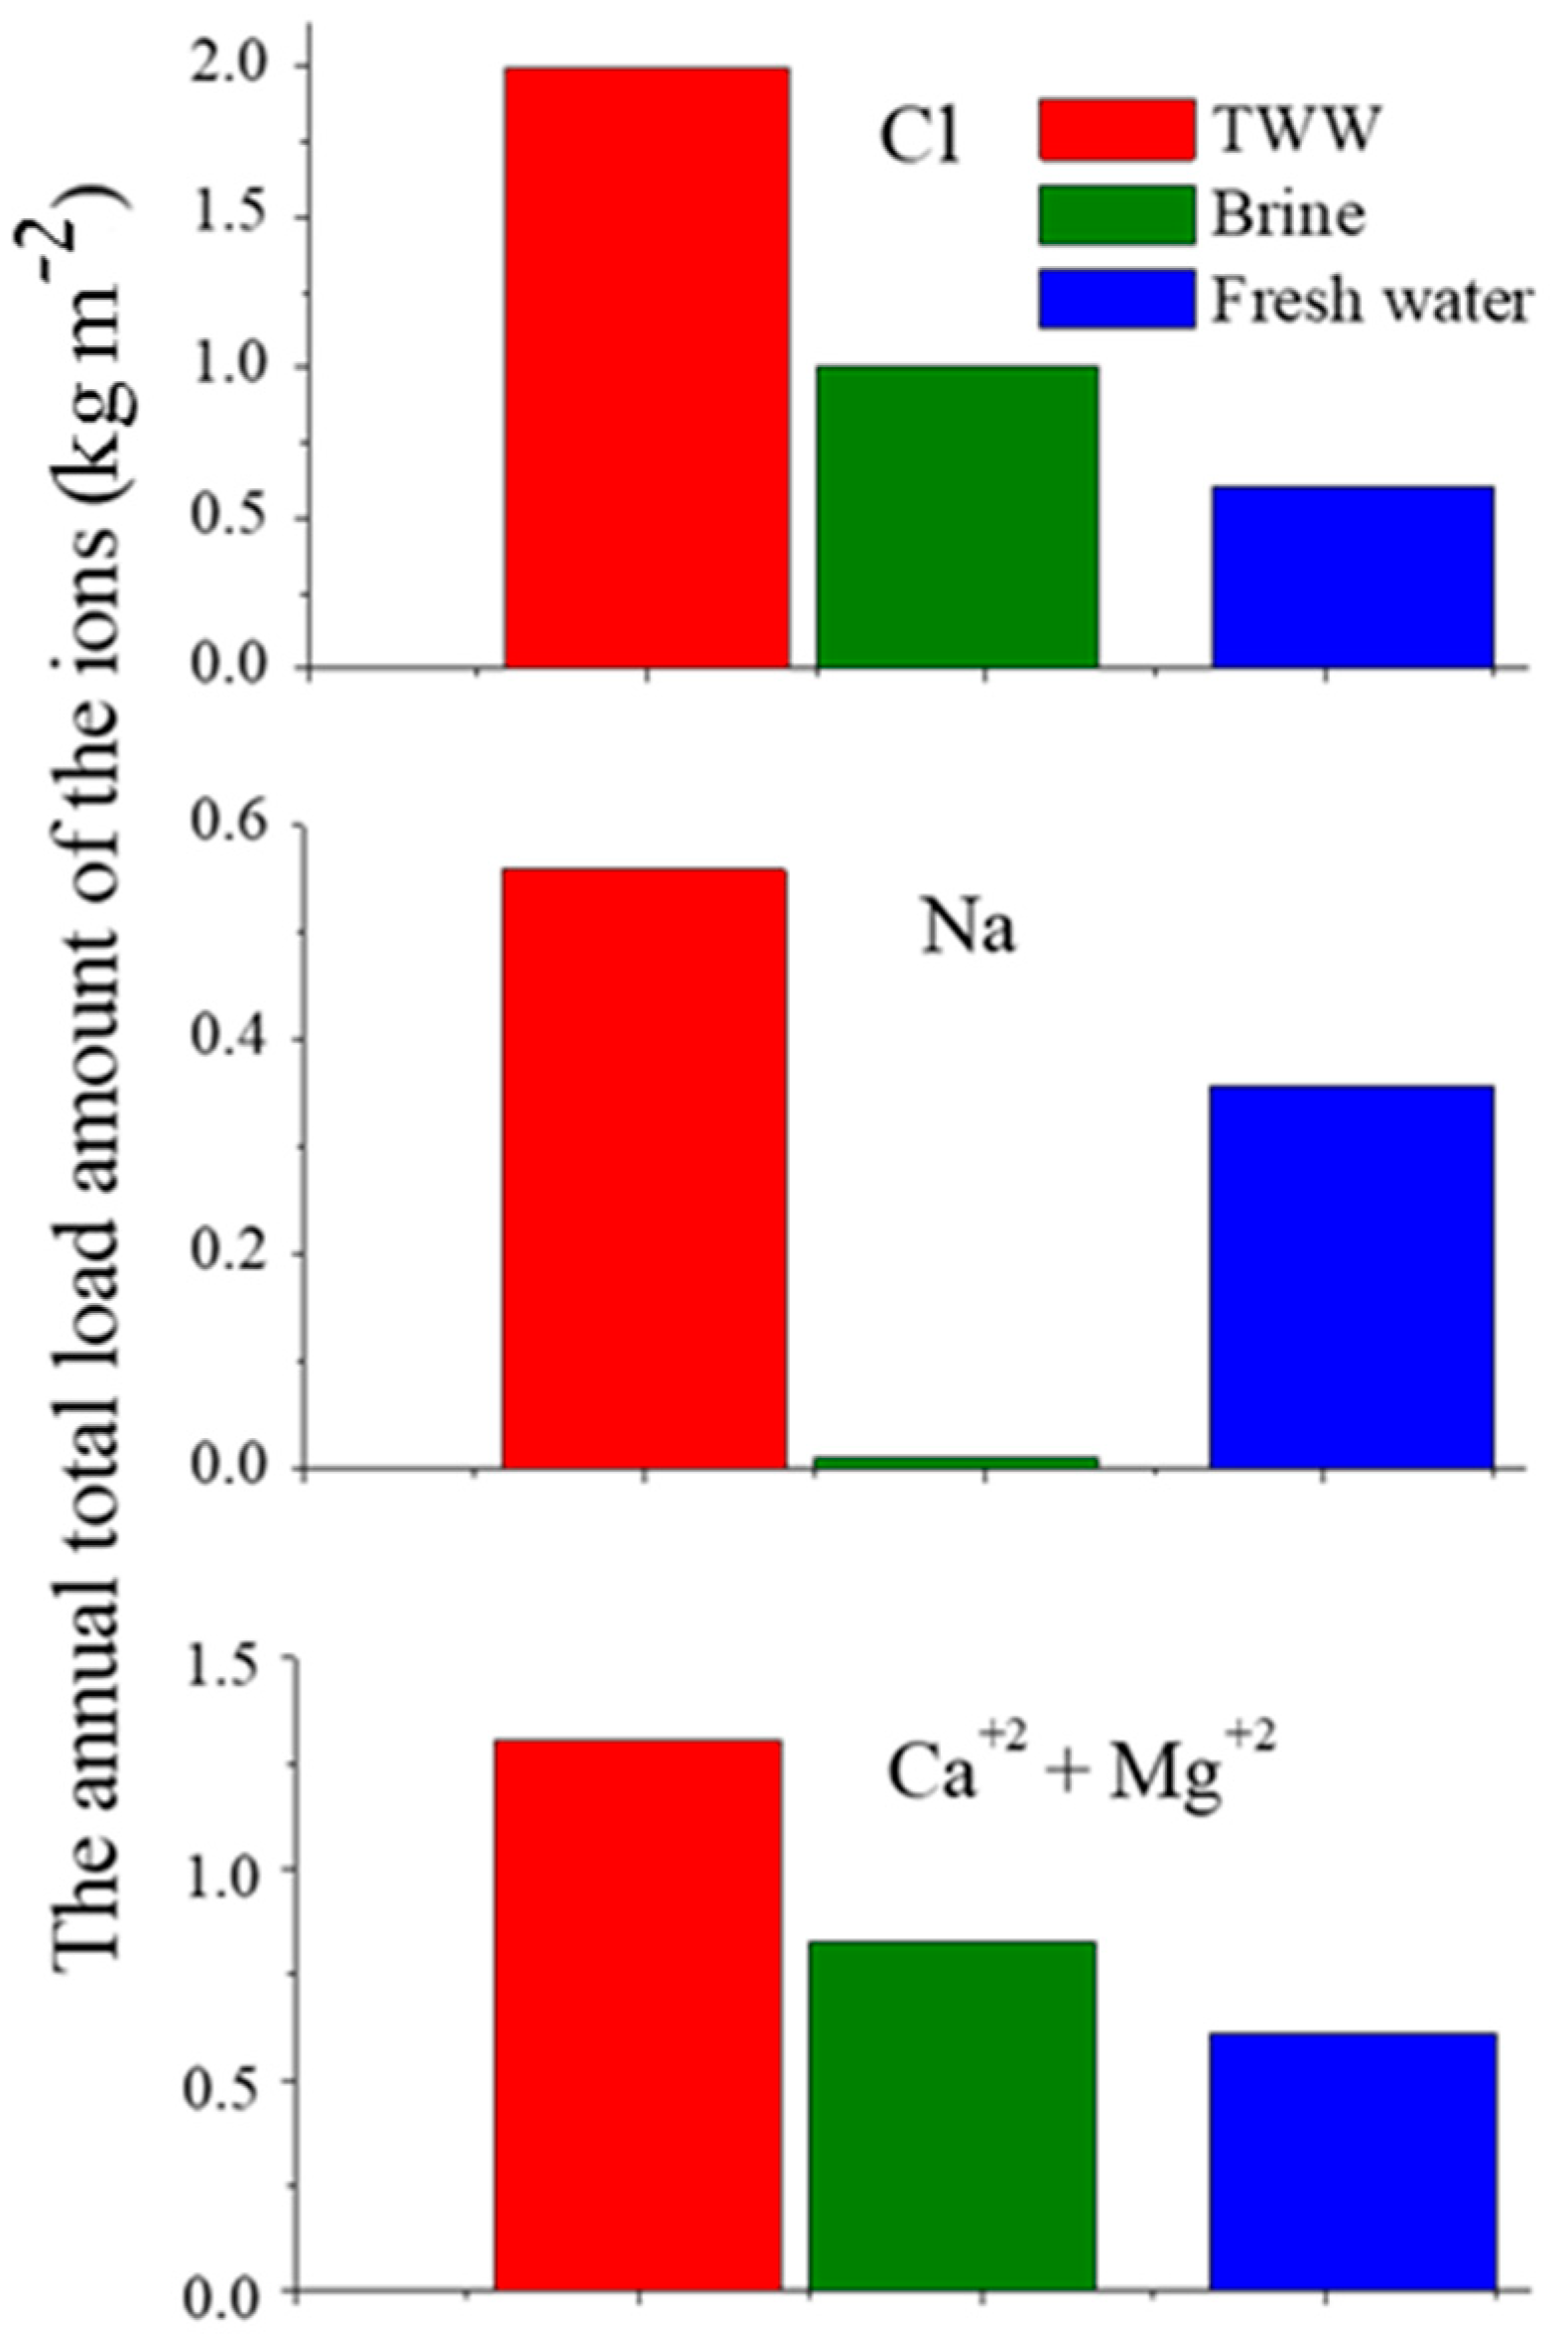
The
Pj values of Cl, Na, and Ca+Mg on the unpaved roads by the TWW, brine, and FW applications are presented in
Figure 4. It can be seen from this figure that (i) the TWW application loaded the highest annual amounts of Cl, Na, and Ca+Mg on the unpaved roads, and (ii) the brine application loaded higher annual amounts of Cl and Ca+Mg than the FW application, and the lowest annual amount of Na (~0). In addition, different mechanisms were responsible for the dust emission control in the various studied solutions (brine, TWW, and FW). The mechanism of the brine solution controlling dust emission is based on the high hygroscopic properties of the Ca and Mg elements. The concentrations of the Ca and Mg ions in the brine solution are very high, 23.2 and 62.2 g L
−1, respectively (
Table 1). The application of the brine solution causes the accumulation of high contents of Ca and Mg on the unpaved road, which absorb large amounts of H
2O molecules from the air. These H
2O molecules are adsorbed on the dust particles by adhesion forces, forming big and heavy aggregates which are beyond the lifting capability of the wind. Consequently, the dust emission under the brine application decreases.
In contrast, the application of the TWW and FW solutions with relatively low concentrations of Ca and Mg, <127.5 and <59.8 mg L
−1, respectively (
Table 2), leads to the lower accumulation of these ions on the unpaved roads. Furthermore, the frequent applications of the TWW and FW on the unpaved roads, 10 times in each day during the dry season, leach down the Ca and Mg ions from the unpaved roads’ surfaces, which in turn decreases their accumulations on the unpaved roads. In this case, the hygroscopic mechanism is negligible. Therefore, the mechanism of the WWT and FW application in controlling dust emission is based on the “active wetting” mechanism, i.e., repetitive and frequent wetting of the unpaved roads throughout the day to keep the roads wet during the quarries’ activities.
The effects of the vertical leaching of the solutes, which accumulated on the unpaved roads following the application of the treatment solutions, on the groundwater salinization could be indicated by the Cl
− concentration increase in the groundwater. The Cl
− is a conservative ion, very mobile in soil/rock systems, and is the most dominant anion in groundwater. Therefore, the concentration of Cl
− is used as a parameter of water salinity; the higher the Cl
− concentration, the higher the water salinity is [
16].
Many quarries in Israel are located above the Yarkon-Taninim aquifer, where the dominant rocks in this aquifer are cracked limestone. The paths for water and solutes movement in this aquifer are heterogeneous, complicated, and difficult to describe and predict. Nevertheless, the comparative effects of the treatment solutions (brine, TWW, and FW) on groundwater salinity could be fairly estimated on the basis of the following assumptions and simplifications: (1) Most of the added solutes on the unpaved roads during the dry season reach the groundwater. (2) Under long-term and steady state conditions, the average amounts of the Cl− that were added on the unpaved roads or pumped with the water from the aquifer are equal. (3) The annual average volume of the water that is pumped from the aquifer and that which recharges the aquifer are equal.
According to the above conditions, a mass balance model (Equation (3)) was used to predict the effects of brine, TWW, or FW applications on the long-term annual average salinity increase (Δ
Cd) in the pumped water from the Yarkon-Taninim aquifer.
where A is the long-term average area (m
2) of all the unpaved roads located above the Yarkon-Taninim aquifer and treated with the treatment solutions (brine, TWW, or FW). The
Pcl is the long-term average amount (mg m
−2/yr) of the Cl
− that was added on the A area, and is calculated by Equation (2).
WR is the long-term average of the water volume (L/yr) that was pumped from the Yarkon-Taninim aquifer.
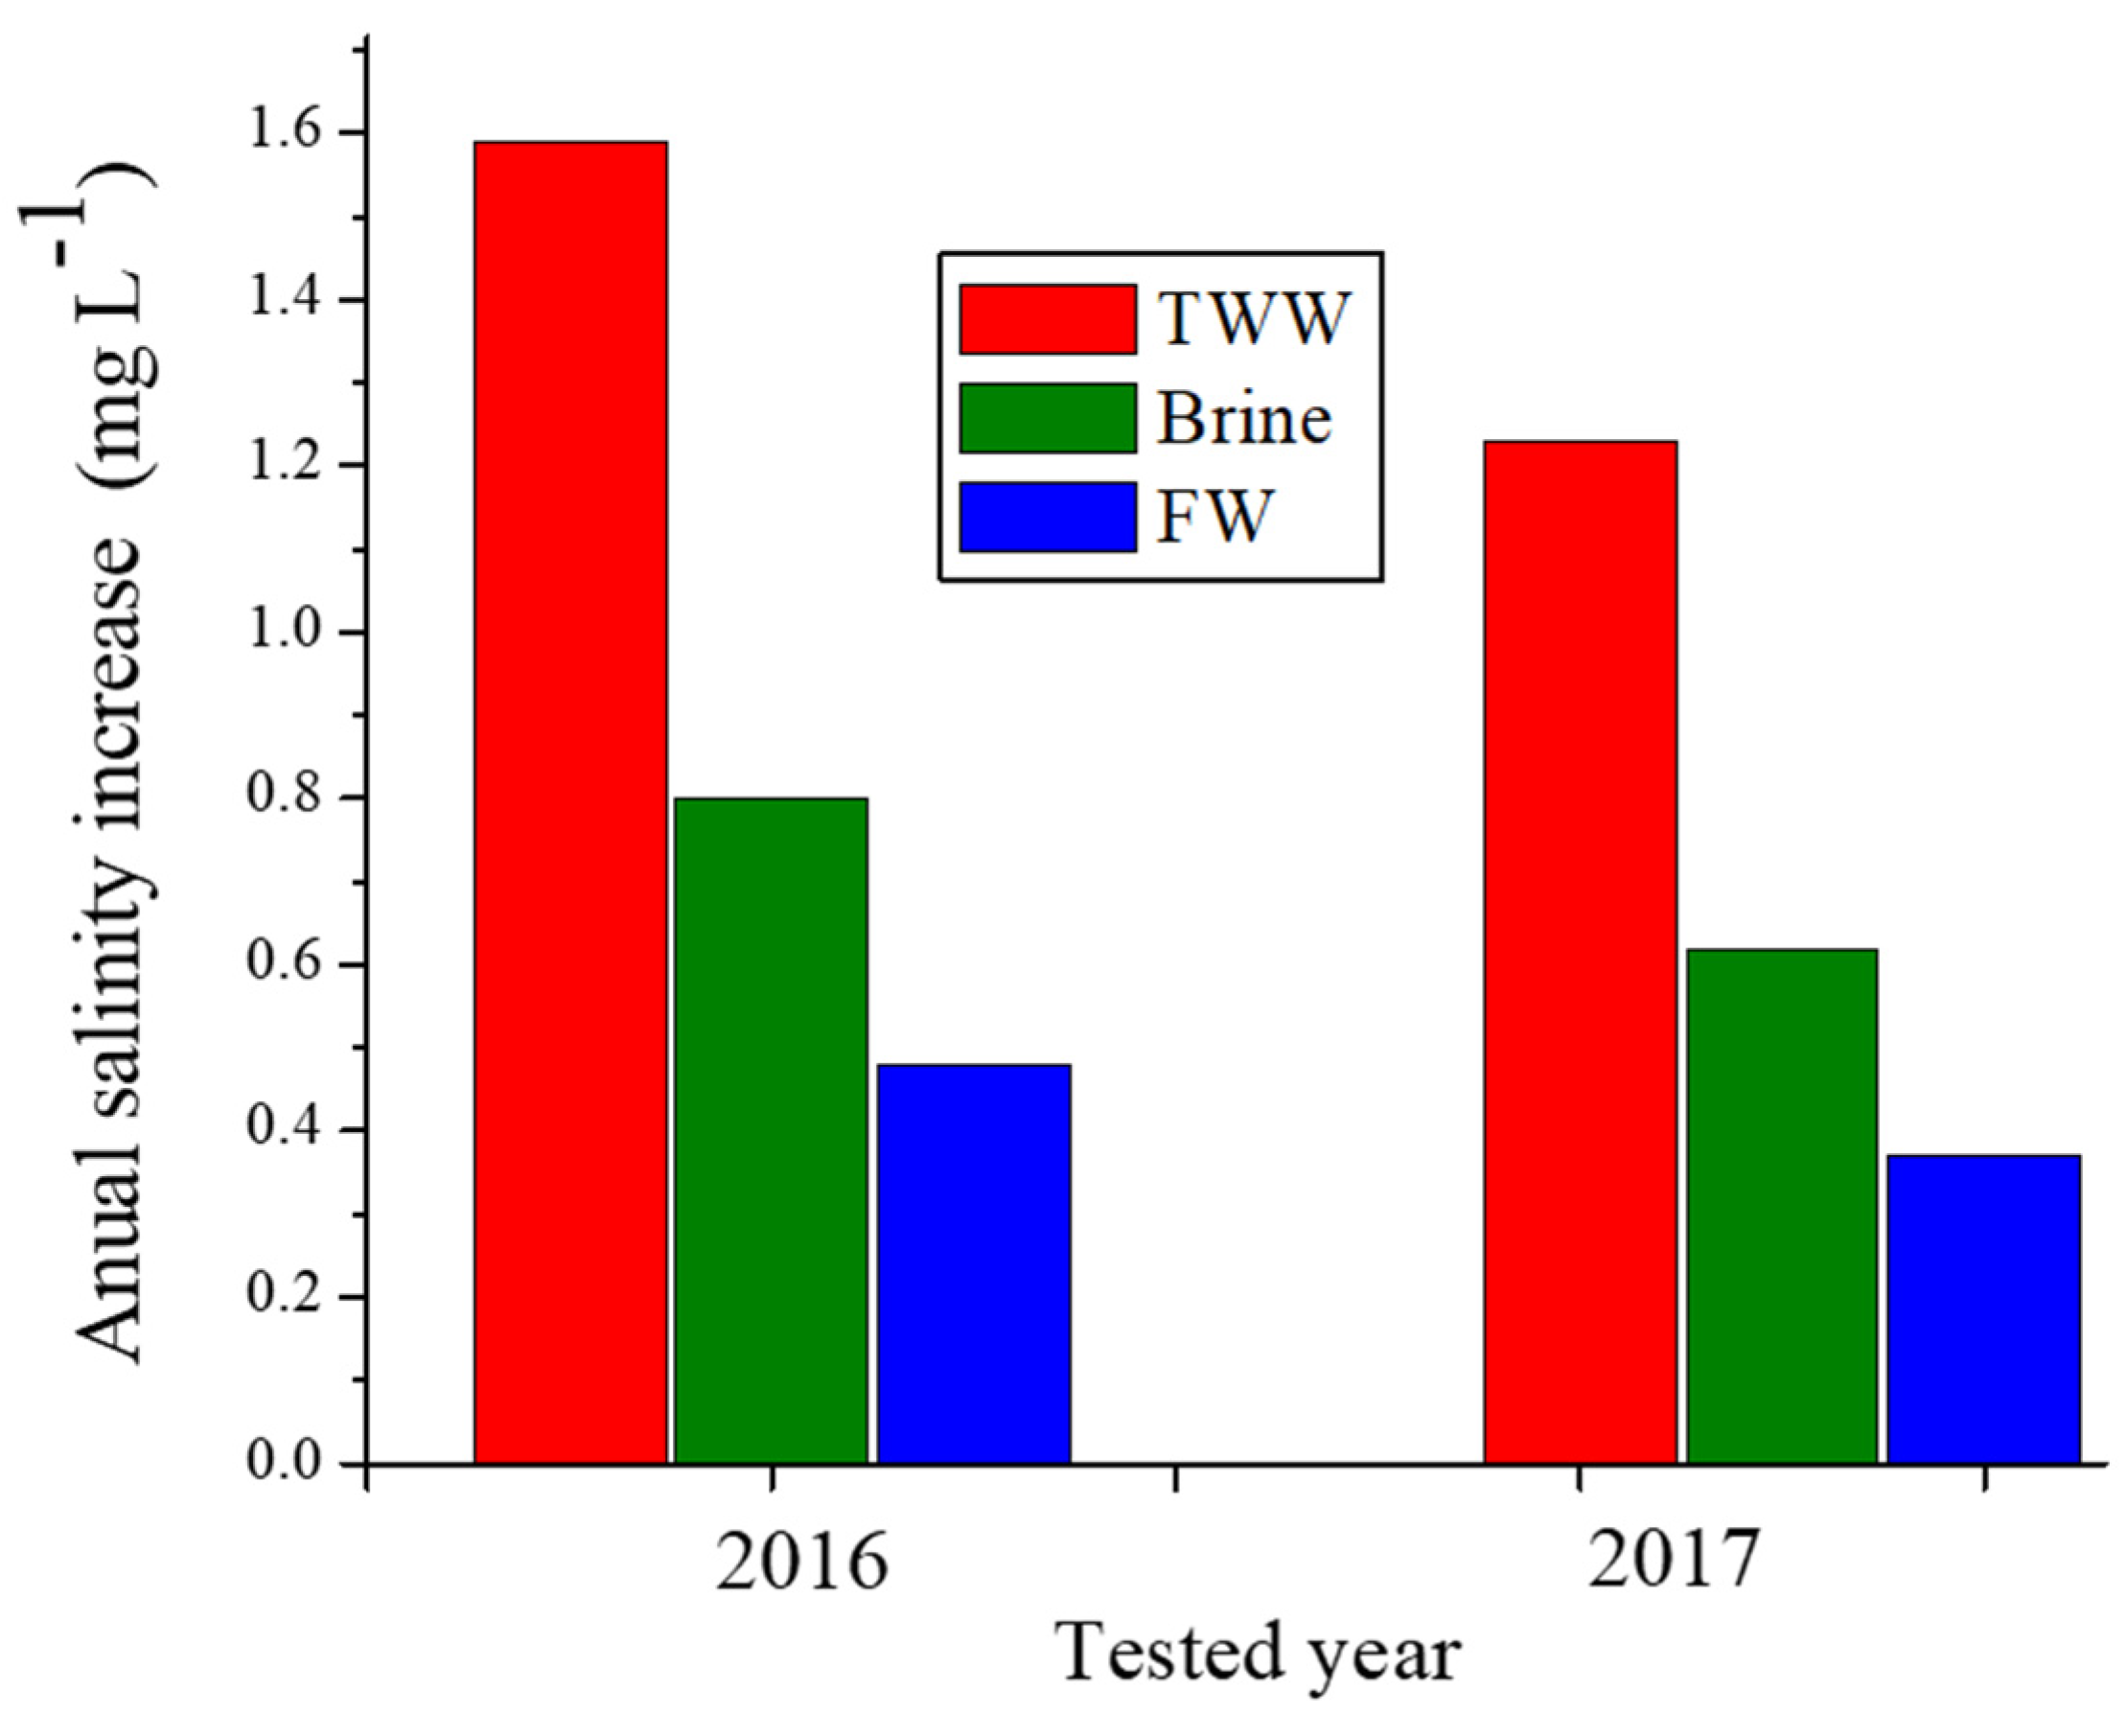
The Δ
Ccl values of the pumped water from the Yarkon-Taninim aquifer, which were calculated by Equation (3), are presented in
Figure 5 for the various treatment solutions (brine, TWW, FW), and two different
A values. For these calculations, a
WR value of 400 × 10
9 L per a year was used (a long-term annual average of the pumped water from this aquifer), as were
A values in the years 2016 and 2017, which were used as two examples. The long-term annual average values of the Δ
Ccl in the pumped water from the Yarkan-Taninim aquifer following the TWW, brine, and FW applications were 1.6, 0.8, and 0.4 mg/L, respectively, in the first example (2016), and 1.2, 0.58, and 0.32 mg/L, respectively, in the second example (2017) (
Figure 5). These Δ
Ccl values in the first and second examples under the application of TWW were approximately two and four times higher than under brine and FW applications, respectively. In spite of these large differences in the Δ
Ccl values between the various treatments (
Figure 5), the long-term annual average additions of Cl
− concentration in the groundwater following the three treatment solutions were relatively low and ranged between 0.32 to 1.6 mg L
−1 in the two examples (
Figure 5).


