1. Introduction
With the enhanced demands of healthcare provision, many hospitals are facing intense pressure to improve efficiency and provide better medical services to more patients [
1,
2,
3,
4]. According to a report from the National Bureau of Statistics of China, the number of yearly visits to all kinds of healthcare institutions increased from 4.9 billion in 2007 to 8.3 billion in 2018. The growing demand for healthcare services leads to increased demand upon new hospital buildings as well as the renovation and re-purposing of existing ones [
4]. Many hospitals are considering reconstructing their old buildings and facilities to optimize the patient treatment process by significantly rearranging hospital layouts. An unprecedented healthcare facility construction boom in the United States has shown the importance of creating optimal physical environments to achieve the best possible outcomes for patients, families, and staff [
5]. Ulrich and Zhu [
6] addressed the serious negative effects of suboptimal transport paths on patient outcomes and highlighted that it is necessary to improve the designs of hospitals in order to reduce patient transport distances and delays.
Solving the facility layout problem (FLP) involves finding the most efficient arrangement of elements on the factory floor subject to different constraints in order to meet one or more objectives [
7,
8]. An effective facility layout design can increase throughput, overall productivity, efficiency [
9], and alleviates congestion [
10]. The FLP has been studied for decades and applied to many diverse problems, such as printed circuit board design; the layout design of hospitals, schools, and airports; backboard wiring problems; typewriters; warehouses; and hydraulic turbine design [
11]. One of the most important indicators of the efficiency of a layout in manufacturing industry is the material handling cost (MHC) [
12], since 20–50% of the total operating costs of a manufacturing company and 15–70% of the total cost of manufacturing a product are attributed to MHC [
13]. Thus, companies can improve productivity and reduce these costs by 10–30% if their facilities are arranged effectively [
14]. Conversely, an ineffective layout may add as much as 36% to MHC [
8]. Research indicates that more than 35% of system efficiency is likely to be lost due to incorrect layouts and location designs [
15]. Hence, the issue of the FLP is one of the most important factors for resolution in the literature of production management and industrial engineering, attracting the attention of many researchers [
16].
The term hospital facility layout problem (HFLP) refers to the application of facility layout theory and practice to a healthcare management context. From the perspective of management, the HFLP belongs to the strategic level of resource capacity planning and decision-making [
17]. It aims to find the most efficient solutions to long-term efficiency and effectiveness decisions. The HFLP has a great impact on medical quality, job satisfaction for medical and other staff, and patient satisfaction [
18,
19,
20,
21,
22,
23]. However, in practice, hospital buildings are often planned by architects based on their general experience and whatever legal regulations are extant at the time of commissioning [
24,
25,
26,
27,
28], thus, without specific healthcare considerations being taken into account, re-design will be unable to guarantee whether the layout is optimal and fit for purpose. Therefore, considering the HFLP is an essential practice and the problem should be modelled through mathematics and address relevant holistic, applied, and specific factors. In the HFLP, total movement distance (or cost, by assigning unit cost to movement) of patients is the indicator most often used for evaluating layout. Long movement distances between departments waste time, are resource-inefficient, and reduce patient satisfaction, especially for people who are seriously ill [
4] adding unnecessary burden to medical and ancillary staff. Apart from total movement distance, which is used to measure the logistics efficiency, a closeness rating chart is often used in assessing the HFLP to measure non-logistical factors such as safety, cleanness, noise, and so forth [
25,
28].
In this paper, we propose a novel multi-objective double-row model for the multi-floor HFLP of a working hospital in Shanghai, China. In this model, both logistical factors (movement distance and path) and non-logistical factors (closeness rating) are taken into account. Additionally, some fixed facilities, the locations and dimensions of which are unchangeable according to the hospital’s requirements, are considered. Because the model is a nondeterministic polynomial problem, a novel heuristic has been designed to search for Pareto-optimal solutions. Data from the hospital is used for computational experiments to test the model and the algorithm we present.
In conclusion, the main contributions of this paper are as follows:
The paper presents a novel multi-objective double-row model suitable for a multi-floor HFLP which minimizes the movement distance of patients and maximizes the closeness relationships between departments by considering the patient’s medical experience and the relationship between various departments of the hospital. Obtained results outperform actual layout in both of the objectives.
An NSGA-II (nondominated sorting genetic algorithm II) algorithm with improved local search ability has been developed to solve the multi-objective model, the effectiveness of which is positively evaluated.
The remaining part of the paper is organized as follows. In
Section 2, we present a detailed review of previous research on HFLPs. In
Section 3, the problem under investigation is described in detail. In
Section 4, the multi-objective double-row model is presented. The detail of our proposed algorithm is illustrated in
Section 5. In
Section 6, real data from the hospital is used to examine the effectiveness of the model and the performance of the algorithm that we propose, and the paper is finalized with conclusions and discussions in
Section 7.
2. Literature Review
The existing research on the HFLP is mainly based on QAP (quadratic assignment problem) models and MIP (mixed integer problem) models. One of the earlier researches on the HFLP was proposed by Elshafei [
29] as a QAP model. Feng and Su [
30] proposed a QAP model to solve the problem of different department sizes. Helber et al. [
31] presented a QAP model that can be used for the overall facility layout of a large general hospital. Rismanchian and Lee [
4] applied process-mining technology to analyze the pathway of patients and discover the patient flows between departments. They developed a multi-objective model which took distance, design preference, and relocation cost into consideration to improve the efficiency of an emergency department. Arnolds and Gartner [
32] also applied a process-mining method and built a QAP model to find the optimal layout.
QAP models are NP-hard and it is difficult to obtain optimal solutions by exact procedure when the problem scale is large. Therefore, some papers have developed different meta heuristics to solve large-scale QAP models. Liang and Chao [
33] proposed a tabu search algorithm to solve the QAP model. Mohamed et al. [
34] integrated the whale algorithm with tabu search to solve the QAP model and determine the location of each department of a hospital. Tayal and Singh [
35] applied big data analysis to find out factors that have the greatest impact on the layout design. Then they used a hybrid firefly simulated annealing algorithm to solve the QAP model. Tongur et al. [
36] used three different algorithms, namely migrating bird optimization, simulated annealing, and tabu search, to solve a large-scale hospital layout problem. Because of the discreteness of the solutions, QAP models can only be used for problems where all the potential locations are determined prior to the calculation.
MIP models are used in a continuous layout representation that is an extension of the discrete QAP model [
11]. However, research in this field is not abundant. In MIP models, departments can be located anywhere as long as all identified constraints are satisfied. In practice, many hospitals arrange their departments into rows [
1,
2,
24,
26,
27,
37,
38,
39]. Therefore, the most relative research in this area considers how to arrange departments into several rows more reasonably, so as to improve the efficiency of the hospital. Arnolds and Nickel [
24] addressed a multi-period layout planning problem of hospital wards, which aims at minimizing either the number of demand violations or costs for installing fixed patient rooms. In their model, the wards are arranged in two rows in each period. A series of layout problems of operating theaters was discussed by Chraibi et al. [
1,
2,
26,
27,
38]. In these researches, all considered departments were arranged into either two rows [
1,
2,
26,
27] on one floor or three rows on several floors [
38]. Among the above researches, no fixed facility is considered, and all floor spaces are available for planning layout. The models of MA et al. [
37] and Zuo et al. [
39] both considered the layout problem of emergency departments similar to ours, as they also arrange departments into rows while considering some fixed facilities. MOEA/D (multi-objective evolutionary algorithm based on decomposition) [
37] and tabu search [
39] are used to search for optimal solutions. However, their models and algorithms are based on a single-floor problem. Additionally, even in researches where some facilities are fixed they have little influence on the layout planning process. In this paper, fixed facilities play an important role and can be regarded as obstacles that limit the potential locations of the departments.
There are previous studies regarding general double-row models, however, this paper is also different from them. The double-row (or multi-row) model considers a special kind of FLP which involves arranging a number of rectangular facilities of varying widths on both sides of a straight-line corridor (or corridors in multi-row models) to minimize the total cost of material handling between facilities [
16]. One of the pioneer researches on this model is proposed by Chung and Tanchoco [
40]. Five heuristics were developed to generate good initial solutions, and they solved the model by CPLEX (IBM, Armonk, New York, USA). Since then, some studies have extended this model and developed more efficient methods to solve the model. An efficient local search heuristic was proposed by Murray et al. [
41] for the double-row model. A multi-objective tabu search algorithm combined with linear programming was proposed by Zuo et al. [
42] to solve the double-row model. The objective is to determine the exact locations of the machines in both rows by minimizing material handling cost and layout area. Wang et al. [
43] considered the application of the double-row model in dynamic environments where material flows change over time in different processing periods and developed an improved simulated annealing (ISA) to solve the problem. Amaral and André [
44] improved the formulation of the double-row model. The new model has the advantage of being more intuitive for handling qualitative inputs that may be required in a layout refinement phase. Compared with the above researches, this paper considers two special requirements of hospital, namely closeness rating and fixed facilities, thus, our model is a new application and improvement of the general double-row model for solving the HFLP.
3. Problem Statement
In this paper, let
N be the number of rectangle departments to be placed, without any overlap, on
F floor space. Each department
i is defined by its dimensions (
,
) with area requirements
,
i = 1, …,
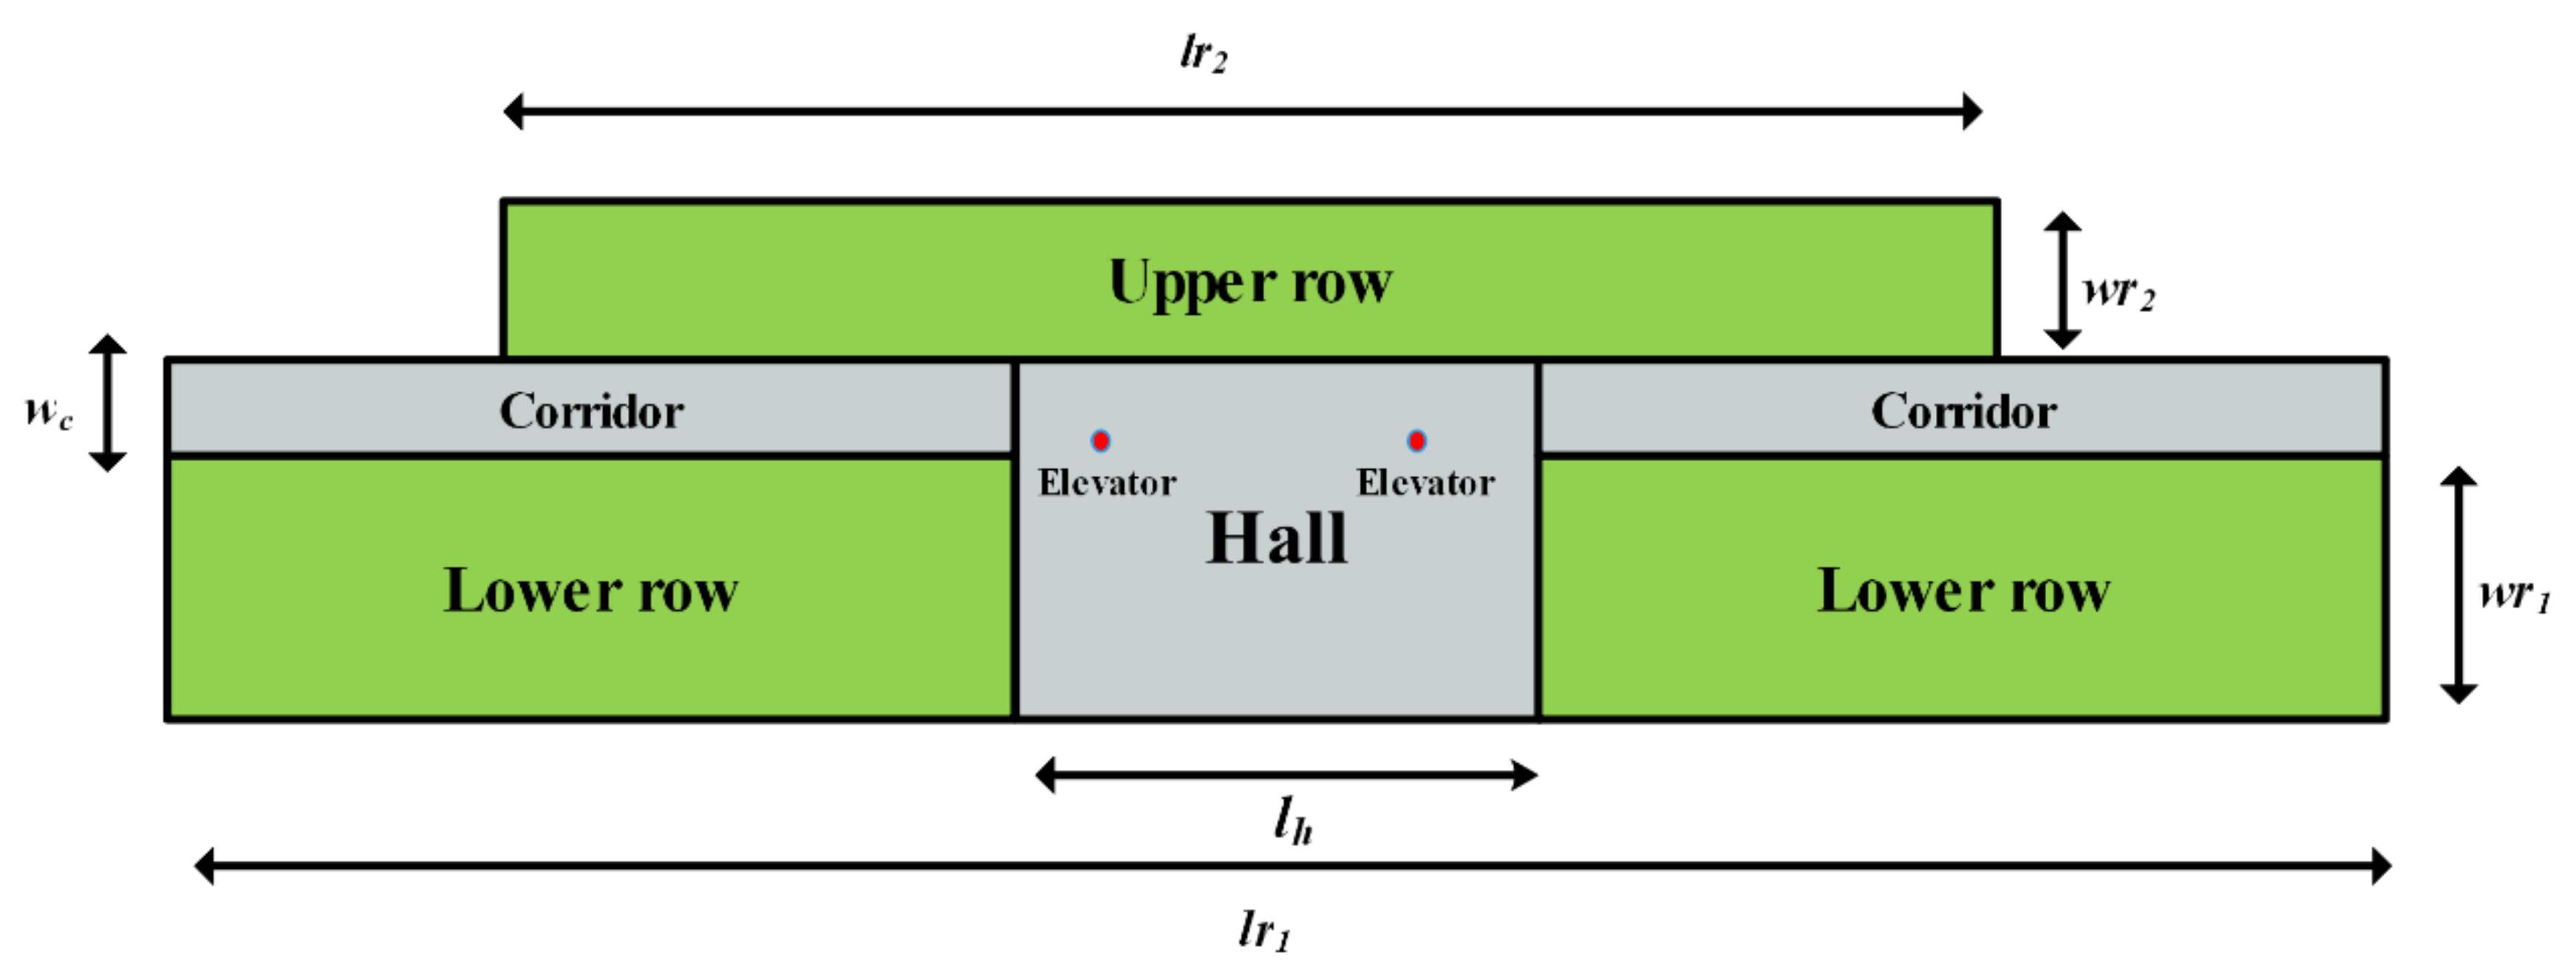
N. Besides the departments to be arranged, there are also a series of fixed facilities, the positions and dimensions of which are unchangeable due to the requirements of the hospital. No department can overlap any fixed facility. All the departments are arranged into two rows on each floor. Different from the general double-row model, the width and length of the two rows are not the same. The dimensions of the two rows, the lower row and the upper row, are (
,
) and (
,
), respectively. Note that the centers of the two rows are aligned vertically. A corridor, with the dimensions (
,
), is horizontally lined between the two rows. Halls with dimensions (
) are located in the middle of each floor, overlapping the lower row and the corridor. Elevators are located inside the hall and are assumed to be a series of points, without area requirement, on coordinates (
,
) (
i = 1, …,
e), respectively. An example of empty floor space is depicted in
Figure 1, where the green areas are available space where departments can be placed; the elevators are represented by two red points. A layout is defined by the x-coordinates
of the centroid, the horizontal
and vertical
dimensions, the located row
, and the located floor
of department
i. We use the total movement distance of patients as the first objective, based on quantitative factors, and the closeness rating score of departments based on qualitative factors as the second objective. The notations used in the formulation are presented in
Table 1.
The assumptions in this paper are described as follows:
Patients move between two departments which are not on the same floor by elevators located inside the hall. The elevators are regarded as a series of points that do not occupy any actual floor space.
The vertical distance between two adjacent floors is equal to a fixed floor height.
The doors of departments are located in the midpoint of each department’s edge that is adjacent to the corridor. Patients move between doors when they want to move to another department.
Patients always follow the shortest path when moving between two departments. Patients cannot pass through any departments and can only move along the X or Y axes. That is to say, all patients’ movements are along corridors.
No department can be located in the hall or overlap the hall
4. Model Formulation
Our new double-row model can be formulated as follows:
In the above formulations, the two objective functions, Equations (1) and (2), are used to minimize the movement distance of patients and maximize the closeness rating score weighted by adjacency factor, respectively. The minimum distance between department i and all elevators is calculated by Equation (3). From Equation (4), the distance between two departments is determined by three factors: their coordinates, located floors, and located rows. When two departments are located on different floors, the distance between them is calculated by adding together three components: the minimum distance between department i and elevators, the minimum distance between department j and elevators, and the vertical distance which is calculated according to the height of each floor and the number of floors between departments. Equation (5) ensures each department can only be assigned to one floor using binary variable . From Equation (6), the located floor of department i is determined. Equation (7) ensures is equal to 1 only if departments i and j are on the same floor. Equation (8) ensures each department is located either in the lower row (r = 1) or the upper row (r = 2). By Equation (9), only if departments i and j are located in the same row of one floor will be 1. The length of department i varies with the located row by Equations (10) and (11) is used to avoid any overlap between departments. Equations (12) and (13) ensure that all departments are located within the floor space. Equations (14) and (15) ensure no overlap between departments and the hall or the fixed facilities. The width of department i is calculated by Equation (16). In order to calculate the closeness rating score, the average width and length of departments in each floor are firstly calculated by Equations (17) and (18), and the rectilinear distance between departments i and j is determined by Equation (19) only if the two departments are on the same floor, otherwise the rectilinear distance is set to a very large value M which means the adjacency factor of the two department is zero in Equation (20). Then in Equation (20), the adjacency factor of each two departments is calculated based on the rectilinear distance between them and the average width/length of the departments on the floor.
5. Proposed NSGA-II Algorithm with Adaptive Local Search
The multi-objective model proposed in
Section 4 is difficult to solve by exact procedure (e.g., CPLEX or Gurobi), due to its nonlinearity, binary variables, and multi-objective nature. In this paper, an NSGA-II algorithm with adaptive local search is proposed to search for Pareto-optimal solutions. NSGA-II is a kind of multi-objective genetic algorithm which was first proposed by Deb et al. [
45] and has been widely used to search for Pareto-optimal solutions. NSGA-II has some advantages, such as fast nondomination sorting, the ability to maintain a good spread of solutions, and better convergence to the true Pareto front.
In general, genetic algorithm can perform a global search in the entire search space, but it is poor at exploring the search space within the convergence area generated by the genetic algorithm loop [
8]. In practice, additional local search operators are commonly used to improve algorithm performance. In this paper, an NSGA-II algorithm with an adaptive local search scheme is proposed to solve the hospital facility layout problem. Unlike Ripon et al. [
8], the design of our local search scheme is based on a simulated annealing algorithm. In the rest of this section, the main components of the algorithm, including coding solutions and constructing layouts, constraints handling, genetic operators, and the local search scheme are presented in detail. The complete algorithm procedure is summarized in
Section 5.8.
5.1. Chromosome Representation and Layout Construction
In this paper, individuals are coded by integer sequences which represent the order in which departments are placed using the layout construction method described below. Each individual consists of
n genes, the same as the number of departments. For example, if there are three departments to be placed, an individual [
1,
2,
3] that represents department 2 is placed first, then department 3 and department 1 are placed in order.
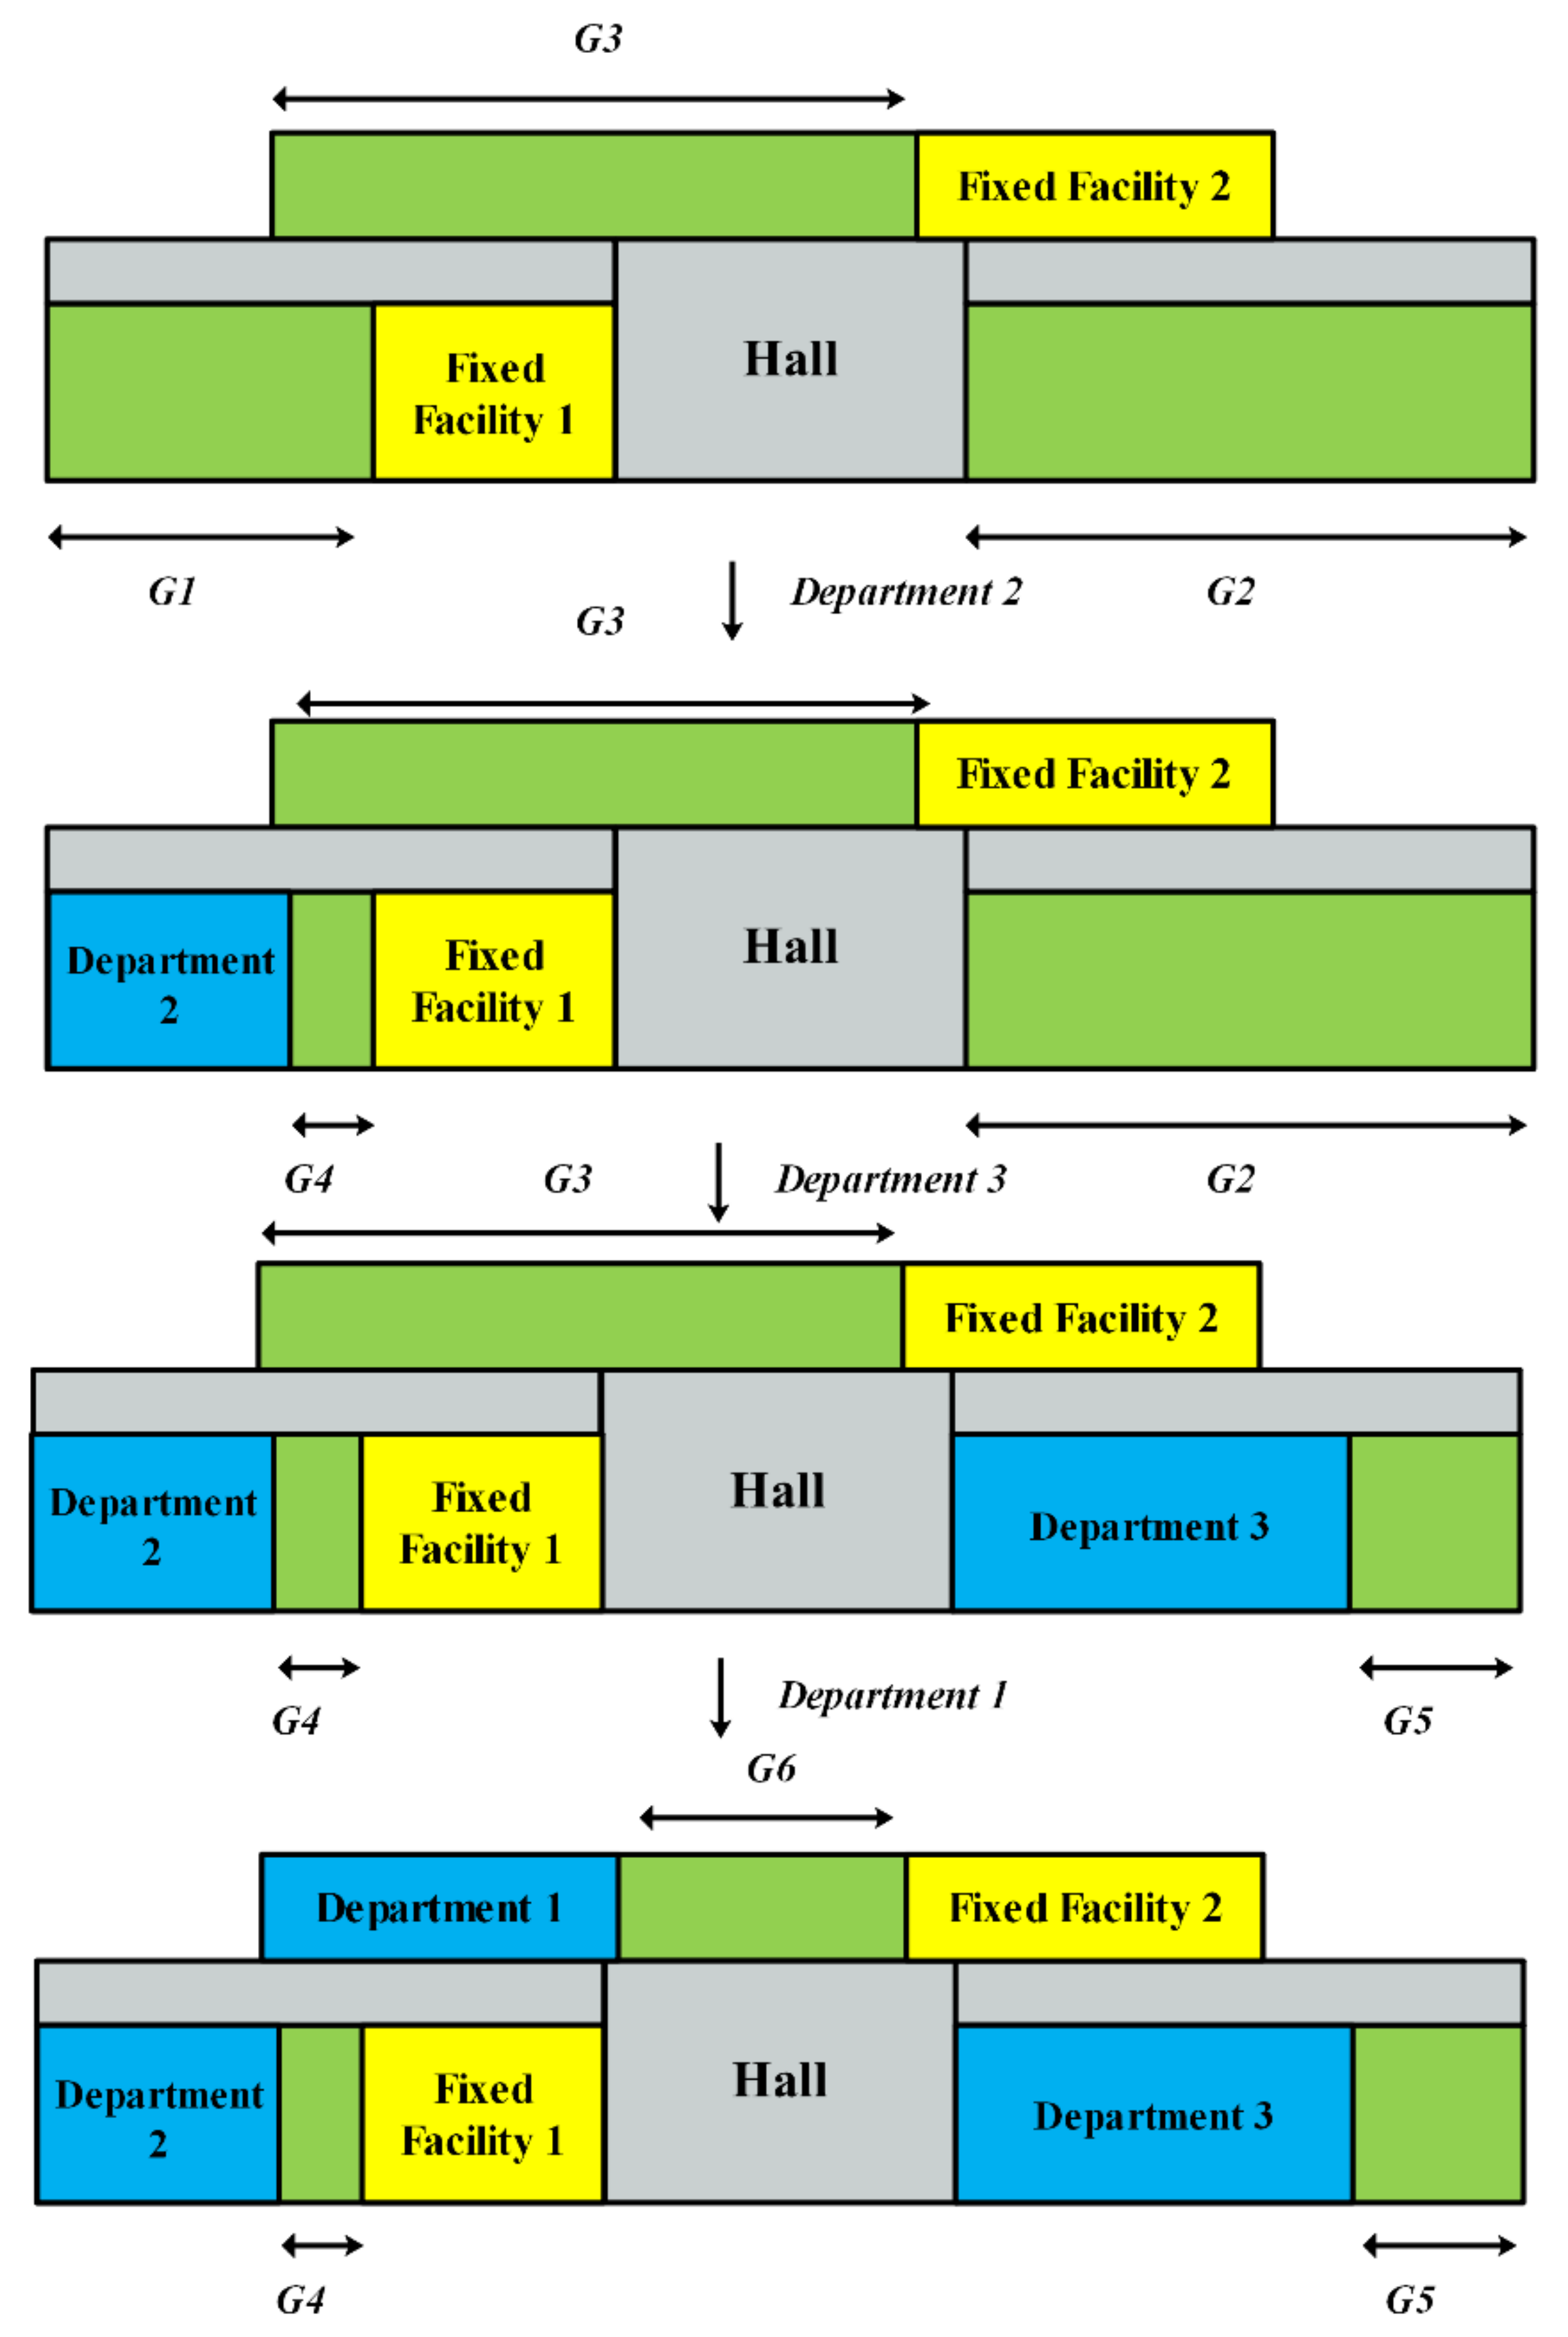
The layout construction process is similar to packing a series of items into boxes, in which departments can be regarded as “items” and floors can be regarded as “boxes”. Before placing departments, the fixed facilities are identified, placed in given positions on floor spaces, and exist as obstacles in the later steps. Similarly, the halls are also regarded as fixed facilities which are located in the center of the lower row. The layout construction procedure begins by placing departments in the lower row of the first floor. The departments are placed according to the order represented by each individual. Fixed facilities located in each floor divide the available floor space into several smaller available spaces. We define a set
G which contains all the available spaces. When placing a department, the space which can accommodate the department and with the lowest located floor is preferred. For spaces on the same floor, the one in the lower row is preferred; also, the one with a smaller x- coordinate of the left side is preferred compared to other spaces in the same row. Then the department is placed closely to the left side of the selected space and
G is updated by removing the selected space and adding the new space generated from this placement. Repeat the above steps until all departments are placed, then the total movement distance of patients and the total closeness rating score can be calculated. In order to place all departments, the length of the upper row of the last floor will be set to a large number which can accommodate all departments when constructing layout (the actual floor space will not be changed). This may cause some departments to be located outside the floor space, which is not reasonable and will be penalized by the penalty term in the
Section 5.2.
A simple example of the layout construction process is depicted in
Figure 2. Assume that there are three departments to be placed at one floor and the order of considered individuals is departments 2, 3, then 1. Additionally, two fixed facilities are located in the two rows, respectively. At first, there are three available spaces,
G1,
G2, and
G3, in set
G. The leftmost space in the lower row,
G1, is selected and department 2 is located inside it. Then
G1 is removed from
G and a new space,
G4, is generated.
G4 cannot accommodate department 3, thus department 3 is placed at
G2. Similar for department 1, it is then placed at
G3. So far, the layout construction process of individual departments 2, 3,and 1 is finished.
5.2. Constraints Handling
Using the layout construction method mentioned in
Section 5.1, the obtained layouts can satisfy all the constraints in
Section 4, except for Equation (13) which ensures all departments are placed inside the floor space. To ensure the departments are arranged in the available region of each floor, we introduce a penalty term. When any department is not fully located in the floor area (the right edge of the department is beyond the right edge of the floor space), a penalty term will be added to the two objective functions. For each department, the penalty term is calculated by using the following Equation (21)
Equation (21) is used to ensure that all departments are located in the floor area. Therefore, the above two objective functions in
Section 4 should also be modified accordingly by adding the penalty term as follows:
We calculate the nondomination rank and crowding-distance of each solution based on the objective values calculated by Equations (22) and (23) which are used in NSGA-II as selection and replacement operators.
5.3. Selection Operator
In this paper, a tournament selection strategy is implemented. The first two individuals are randomly selected from the current population. Then the one with the better nondomination rank wins the tournament and is copied to the next generation. If the two individuals belong to the same nondomination rank, the one with higher crowding-distance is preferred. The individuals who win the tournament (the same as the population size Ps) form the new population.
5.4. Cross-Over Operator
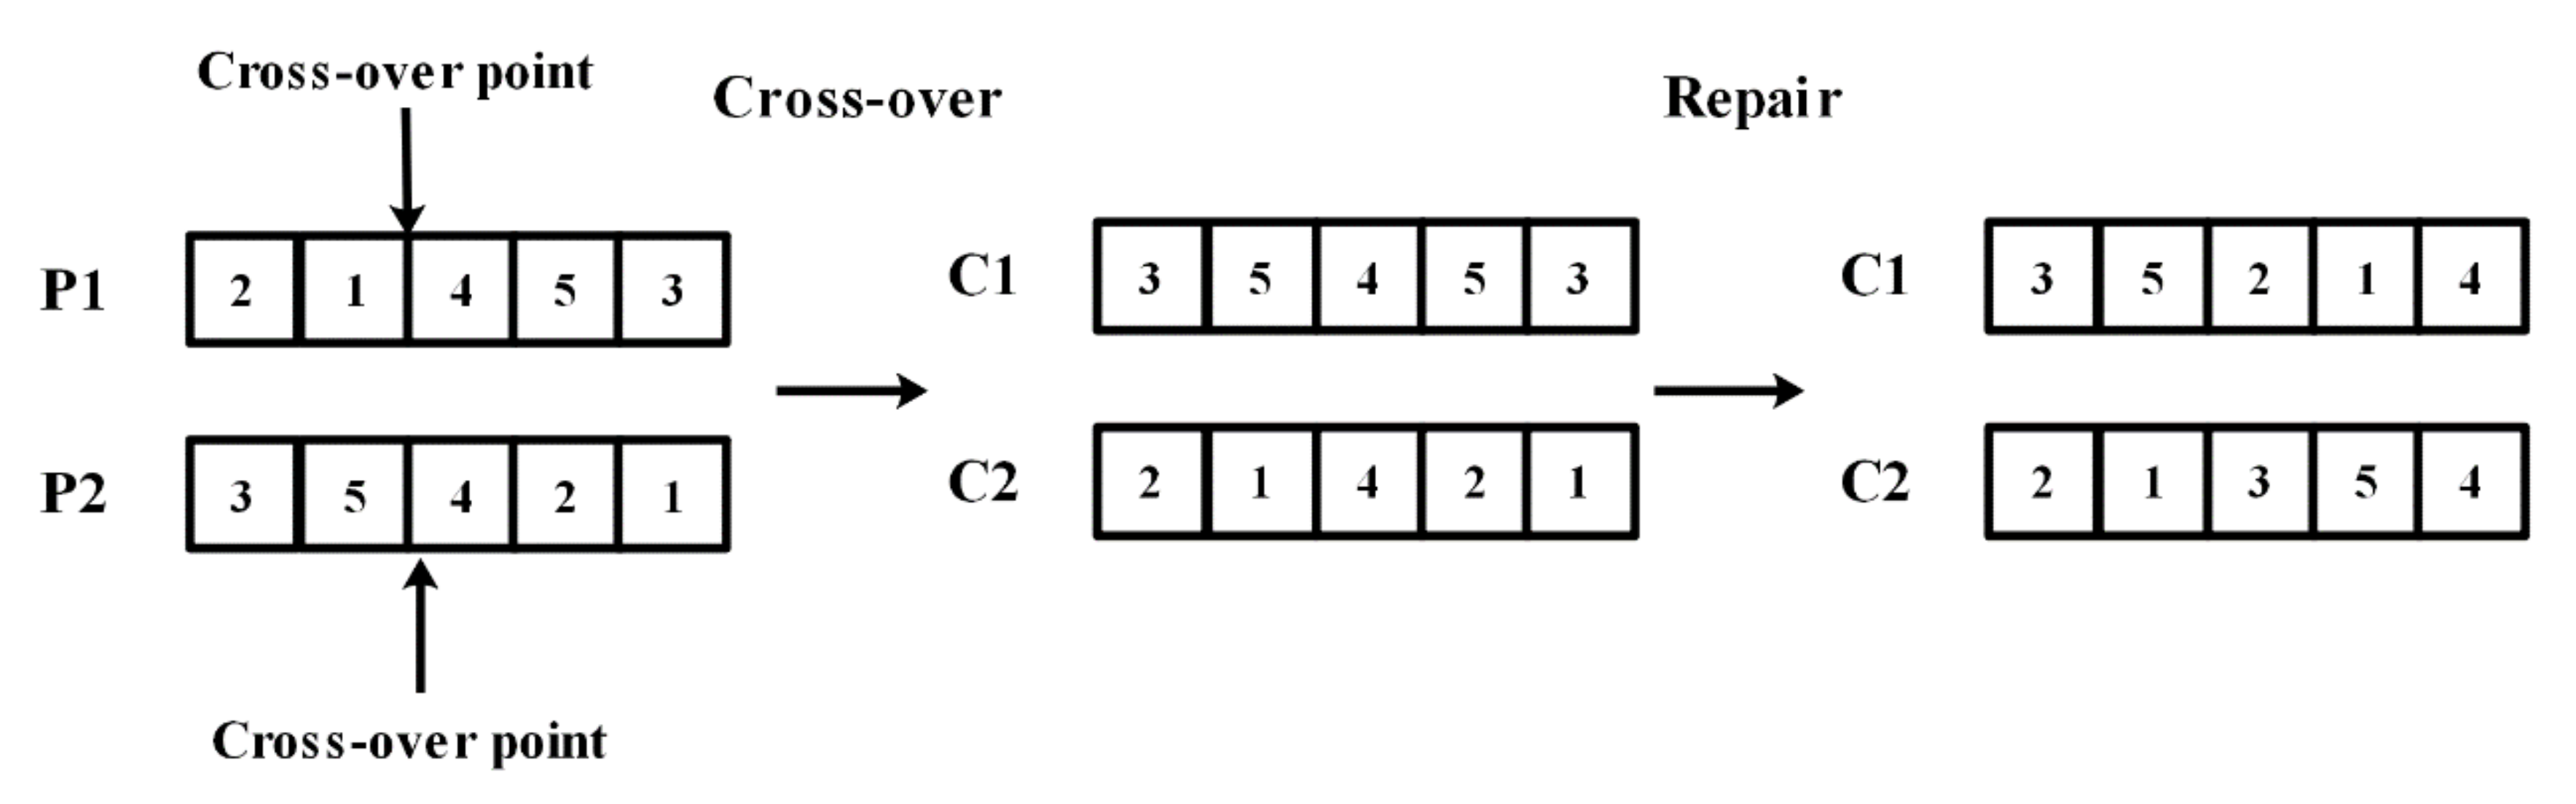
A single point cross-over strategy is adopted for the cross-over operator. Two parent individuals are randomly selected from the current population, then a cross-over point is randomly selected from the chromosomes, and the two parent individuals exchange their genes in front of the cross-over point to generate two new child individuals with a probability
pc, where
pc is known as the cross-over probability. Otherwise, the two child individuals remain the same as the two parent individuals. After cross-over, a repair procedure is performed on the two child individuals. Genes behind the cross-over point will be replaced by the missing genes and remain in the same order as in the corresponding parent individual.
Figure 3 shows an example of a cross-over operator.
5.5. Mutation Operator
After cross-over, the mutation operator is implemented on the population to prevent premature convergence and to ensure the diversity of the population. In this process, each individual will be chosen to perform this procedure with an equal probability
pm, where
pm is known as the mutation probability. Three different mutation methods are designed and one of them will be chosen with the probability given as
p1,
p2, and
p3, respectively.
Table 2 shows the three mutation methods in detail. Method 1 exchanges two genes of an individual and generates a new individual. Several consecutive genes are moved to a different position by using Method 2. Method 3 inverts the chromosome of the selected individual.
5.6. Replacement Operator
After cross-over and mutation, there are Ps parent individuals and Ps offspring individuals in the current population, now referred to as the intermediate population. Next, the replacement operator is implemented to select the best Ps individuals from the intermediate population for the next generation. Similar to the selection operator, whether an individual can be selected for the next generation is determined by its nondomination rank and crowding distance in the replacement operator. We select individuals with the best nondomination rank first. In other words, individuals ranked 1 are selected for the next generation first, then individuals ranked 2 and individuals ranked 3, and so on sequentially. This procedure is continued until no more individuals can be accommodated. Assume that the individual ranked l is the last nondominated individual set, beyond which no other set can be accommodated. Individuals with the largest crowding distance are selected to fill all population slots.
5.7. Adaptive Local Search Operator
To improve the performance of our algorithm we used an adaptive local search method based on a simulated annealing algorithm. Similar to Ripon et al. [
8], the method is also based on the concept of similarity. When the genetic algorithm is continuously converging, the similarity among the individuals of a genetic algorithm population increases. Therefore, the fitness values of the individuals are similar to each other to a significant extent and the heterogeneity of the population is reduced [
8]. The local search procedure will be invoked in a genetic algorithm loop when the similarity of the population exceeds a pre-defined threshold value (
β), otherwise only genetic algorithm is applied.
Compared with applying a local search in every iteration, the adaptive local search method takes much less time and produces high quality results. The similarity coefficient
SCpq in our paper is calculated as follows:
where
fpk and
fqk are the facilities at location
k in chromosomes
p and
q,
k is the index of location in the layout, and
n is the number of facilities. The calculation of
is as follows:
The average similarity coefficient
of the current population can be obtained by Equation (26) as follows:
where
Ps refers to the size of population. When
exceeds the threshold
β, the local search procedure is applied to some individuals which are randomly selected from the population.
The process of the local search is described as follows. At first, all the relevant parameters are initialized. A new individual will be generated by the mutation methods in
Section 5.5 and compared to the current individual. If the new individual dominates the current solution, the current individual will be replaced by the new individual. Otherwise, the current individual will be replaced by an acceptance probability calculated as Equation (27):
where the
T is the current temperature and
and
are the two objective function values of the new individual and the current individual, respectively. This process is repeated for
loop_inner iterations, then the temperature is lowered by multiplying the cooling rate
. The above process will be repeats until the temperature is lower than the final temperature
T_final.
5.8. Summary of the Proposed Algorithm
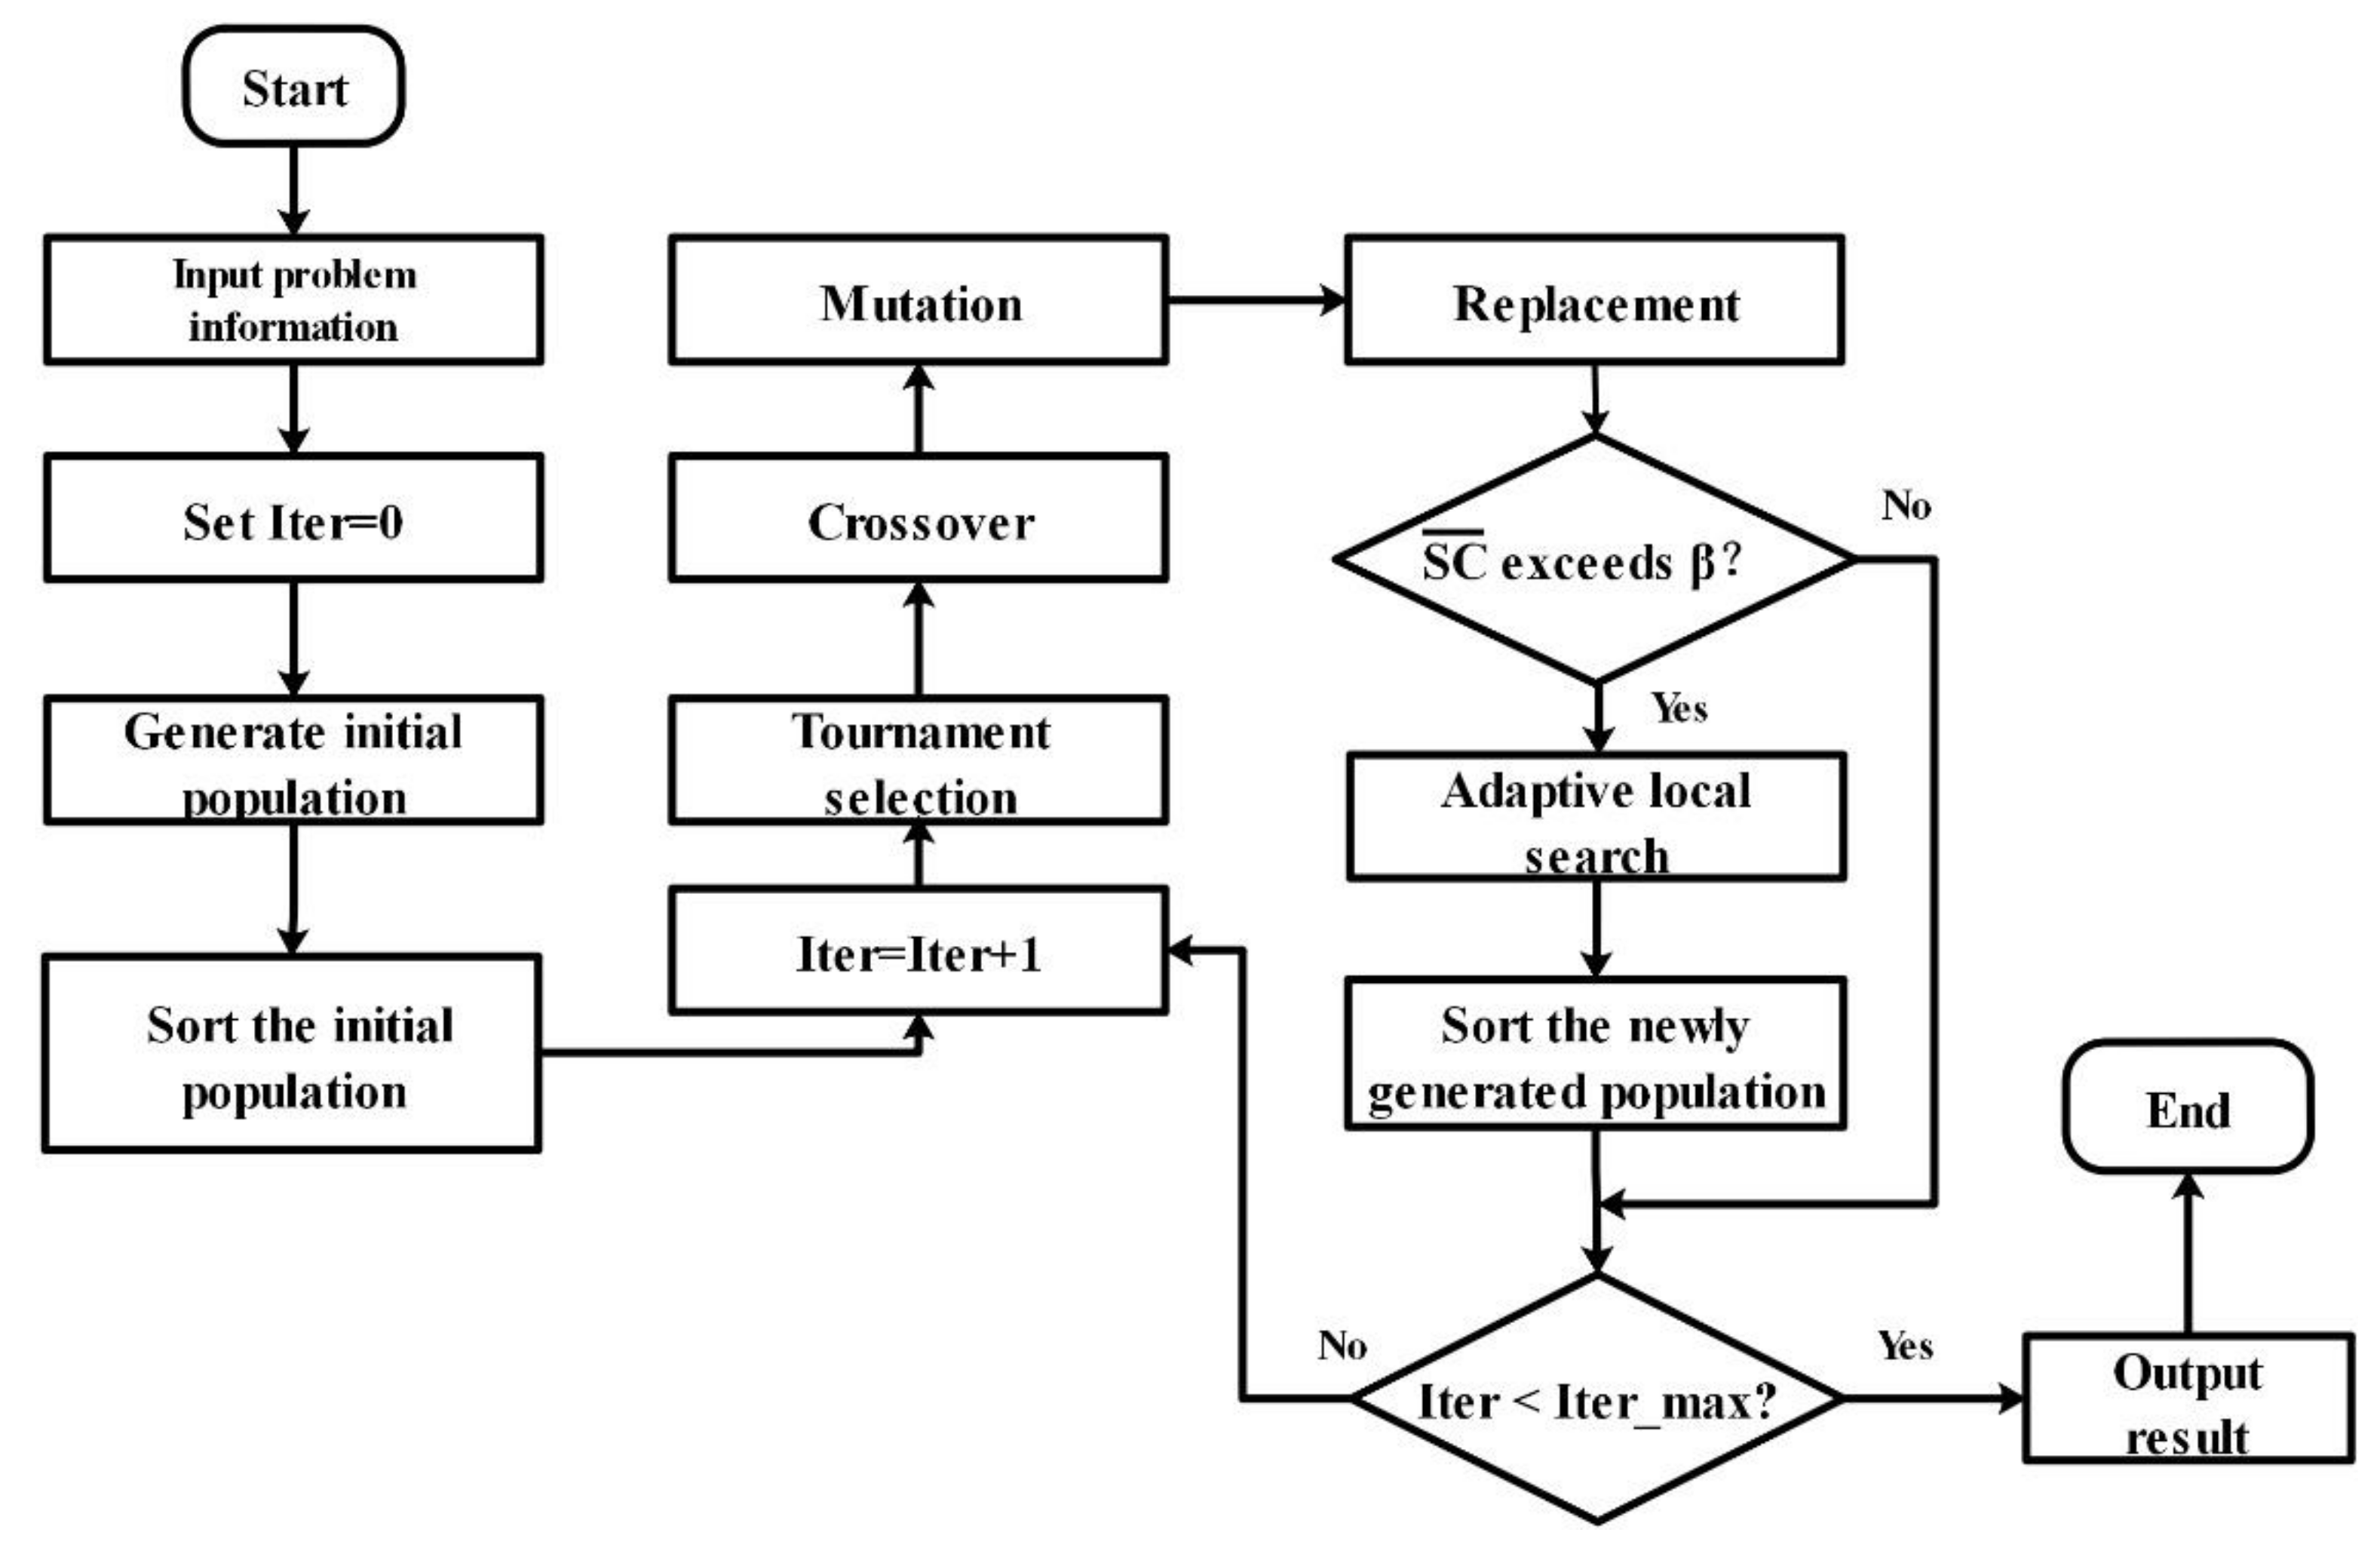
This NSGA-II algorithm with local search based on Pareto-optimization is our proposal for solving the new double-row model of a multi-floor HFLP with two objectives. The flowchart for the entire process is shown in
Figure 4. First, after initializing all relevant parameters,
Ps initial individuals are created randomly. Those individuals form the initial population. For all individuals, the layouts can be obtained by using the construction procedure in
Section 5.1 from which the objective function values are calculated. After that, the population is sorted based on nondomination rank, and each solution is assigned a rank equal to its nondomination rank and its crowding distance. The tournament selection operator, cross-over operator, and mutation operator are used successively to create
Ps new offspring individuals. The best
Ps individuals are selected from the intermediate population which is composed of the
Ps parent individuals and the
Ps new offspring individuals. If the average similarity coefficient
of the current population exceeds a pre-defined threshold
β, the adaptive local search procedure is applied to some individuals which are randomly selected from the current population. To this point, one iteration of the algorithm is completed. We repeat the above steps until the stopping condition is satisfied. The final product is a set of Pareto-optimal solutions.
7. Conclusions and Discussions
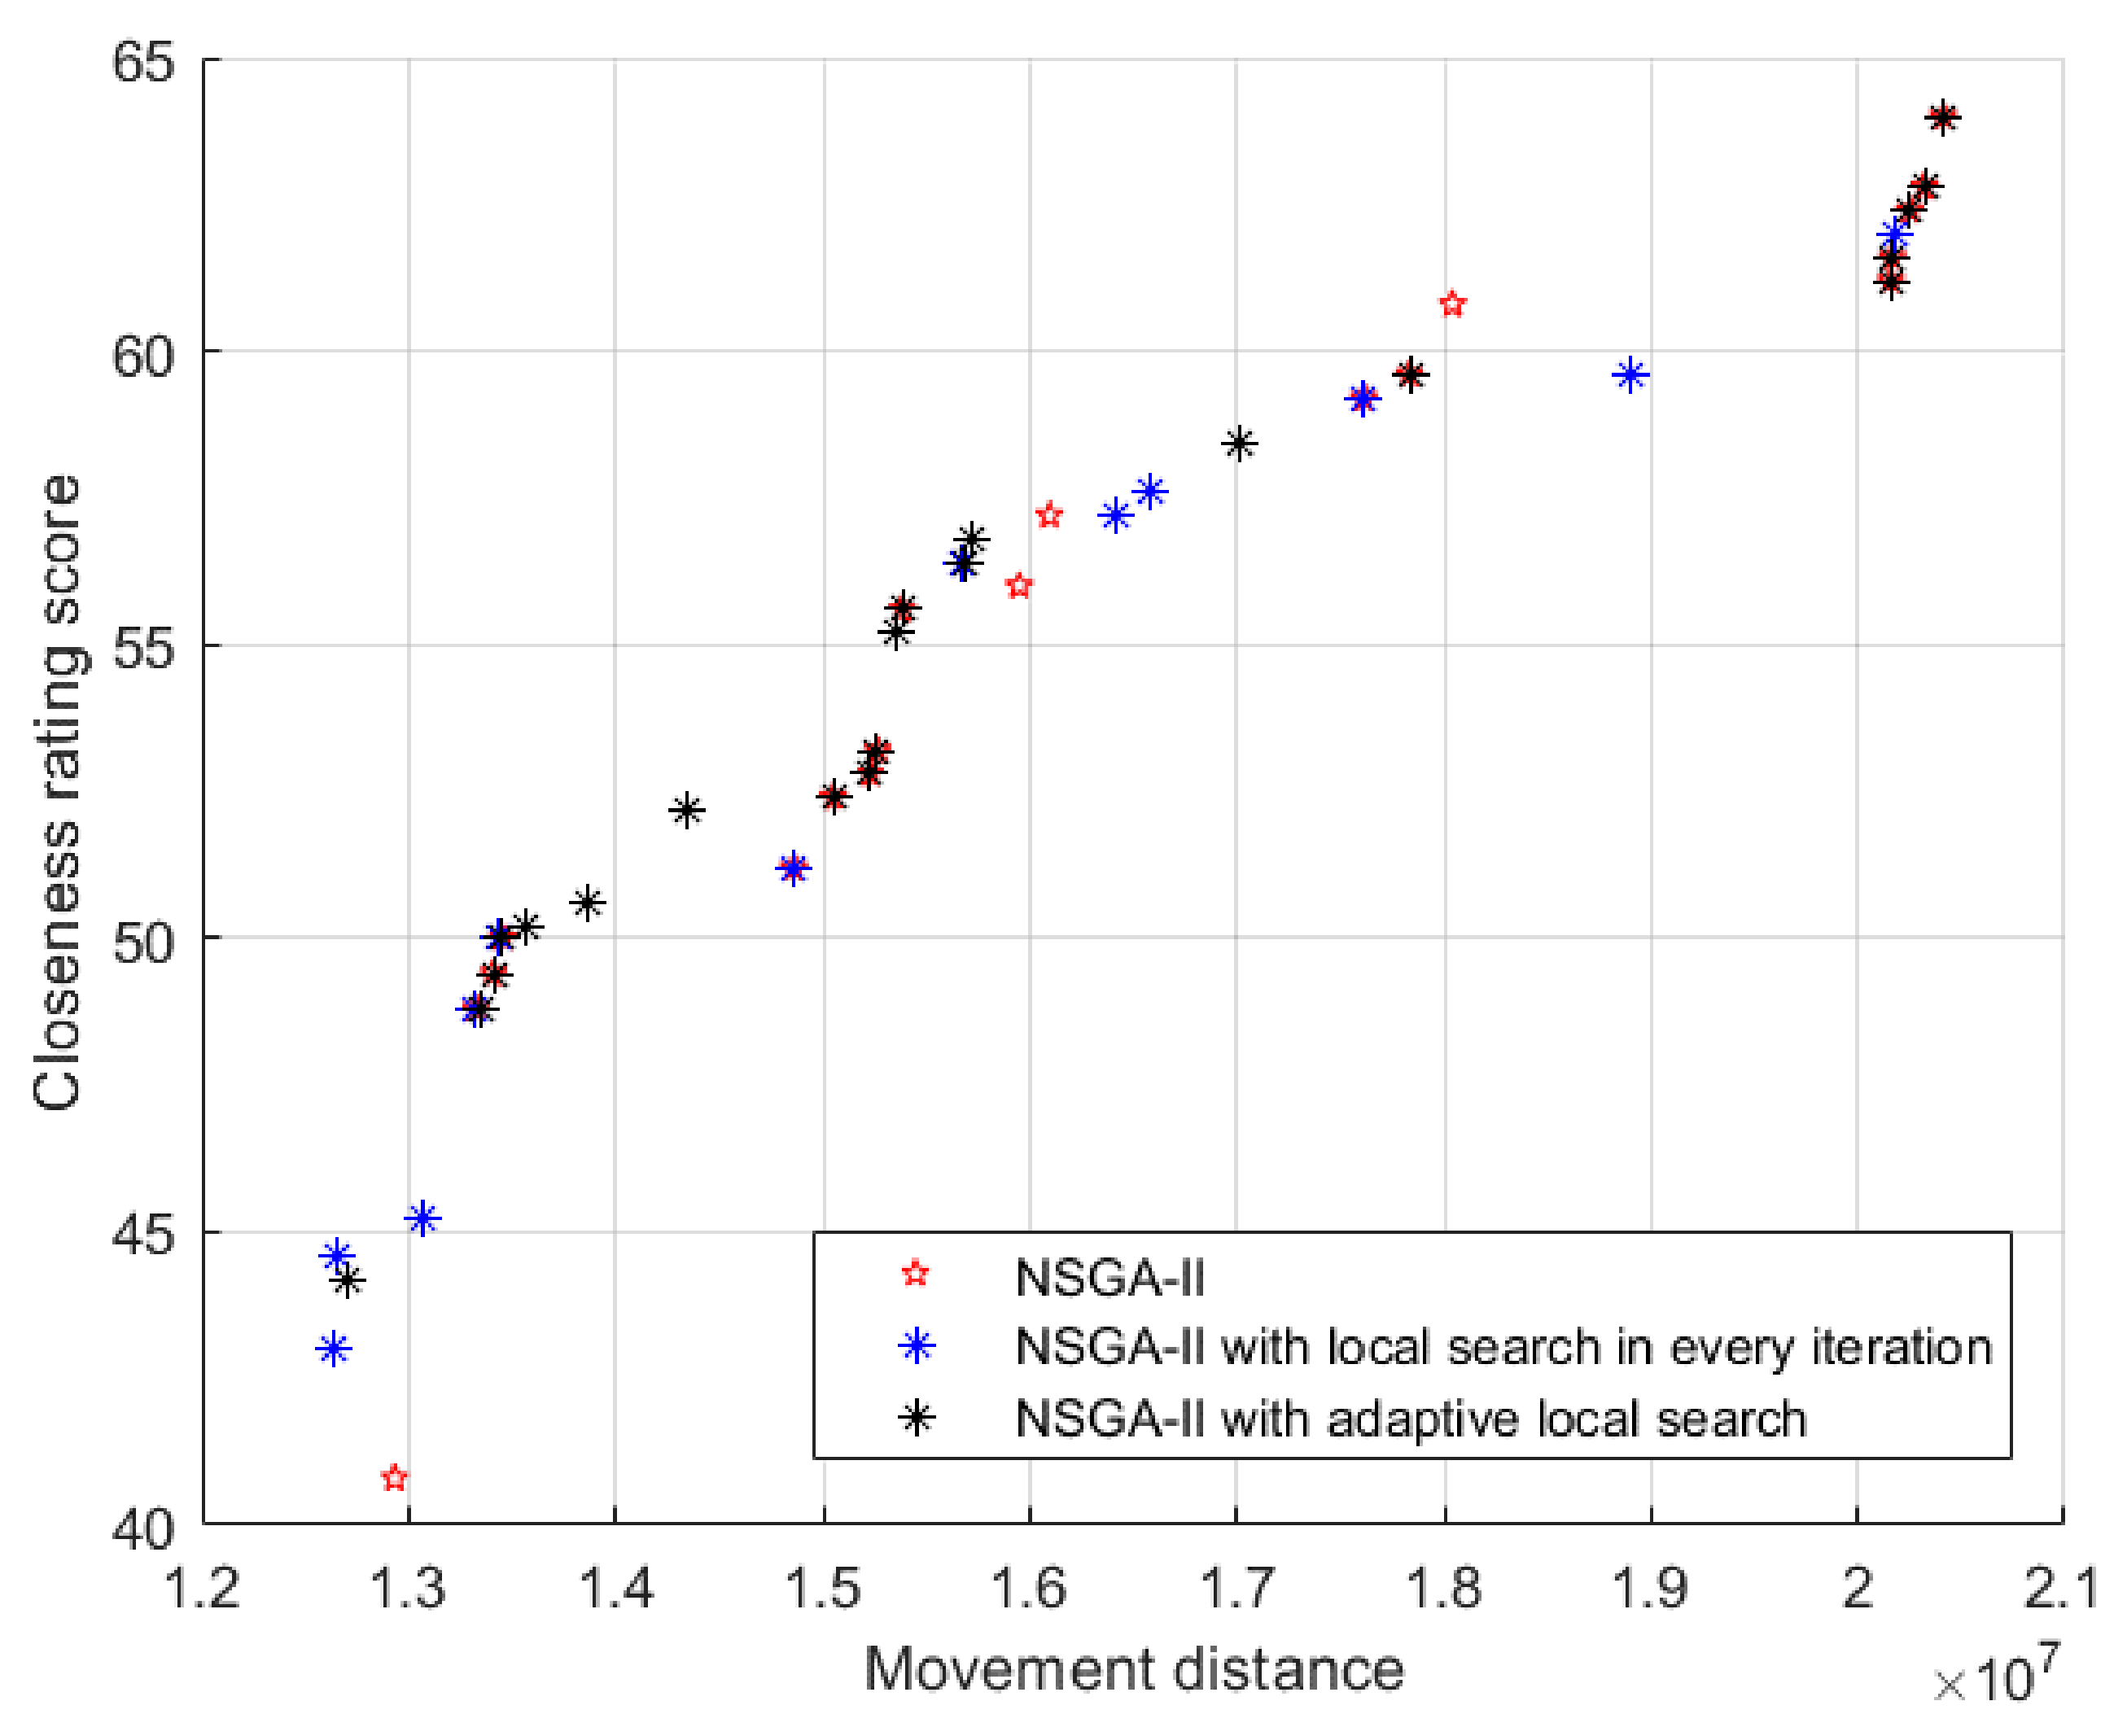
In this paper, we demonstrate that our novel double-row model for a multi-floor HFLP considers some fixed facilities. This model enables two objectives, namely movement distance of patients and closeness rating of departments, to be considered simultaneously. These intractable problems have many intrinsic complexity factors within them, and it is often too time-consuming to solve them with exact procedures. Therefore, we offer this NSGA-II algorithm with an adaptive local search operator to solve the model and produce a set of Pareto-optimal solutions. Experiment results clearly show that our method can solve the problem successfully and the adaptive local search operator performs well. In terms of the two objectives, our method can improve upon the actual layout by up to 37.71% and 83.91%, with an average of 20.96% and 60.16%. This means that our method can lead to less unnecessary movement of patients and higher closeness between departments, thus higher efficiency of the hospital. Moreover, by replacing one of the objective functions, that is, minimizing the total movement distance of patients, with minimizing the total material handling cost, our model can also be applied to facility layout problems in the manufacturing industry.
In this paper, we integrate qualitative factors into a single closeness rating chart. This may not fully reflect the requirement of the hospital layout design. An effort could be made to specify additional qualitative factors and consider more objectives or constraints to enhance the model. Besides, our model and method have certain requirements for the spatial structure of the layout. That is to say, it can only be a double-row structure. The model and method proposed in this paper are not applicable to the facility layout problems of other structures, such as three-row, ring, unequal-area, etc. In future, the hospital layout problem of other layout structures may be a good area for further research. We note that the area requirements of departments may be flexible in practice. The area requirements of some departments can be appropriately reduced when the available floor space is relatively small, rather than fixed as in this paper. How to handle this flexible area requirement within the hospital facility layout problem may be another future research point.


