Article

Development of Multi-Tee-Type Precast Concrete Slabs with Insulating Materials for Structural Safety at the Construction Stage

1
Department of Civil Engineering and Environmental Sciences, Korea Military Academy, Seoul 01805, Korea
2
School of Architecture, Soongsil University, Seoul 06978, Korea
*
Author to whom correspondence should be addressed.
Appl. Sci. 2021, 11(4), 1693; https://doi.org/10.3390/app11041693
Submission received: 9 January 2021 / Revised: 7 February 2021 / Accepted: 10 February 2021 / Published: 13 February 2021
(This article belongs to the Special Issue Advances in Design, Repair and Materials of Structural Concrete)

Abstract

:

Featured Application

The results of this study provide evidence for the structural design of multi-tee-type precast concrete slab systems under construction loads, particularly for the design of shear reinforcement at the dapped ends.

Abstract

Multi-tee-type precast concrete (PC) slab systems are widely used for the construction of modular high-load long-span buildings. However, the structural safety of the dapped end is uncertain, owing to the unanchored shear reinforcement at the construction stage. This study proposes the use of clip-type shear reinforcement at the dapped ends of multi-tee PC slabs to secure their structural performance at the construction stage. To investigate the performance of this approach, a monotonic loading test was performed on simply supported PC slabs, considering structural safety at the construction stage. The reinforcement details of the PC slab’s dapped end (with existing Z-type or proposed clip-type shear reinforcement) and the shear-to-span ratio (12.8 or 6.4) were considered as test parameters. The load–deflection relationship, failure mode, strength ratios to the predicted strength, and shear reinforcement strains were analyzed. The results showed that the tested flexural strength ratio of the PC slabs at the construction stage to the design flexural strength was 1.20–1.40. The enclosed shape and diagonal arrangement of the clip-type shear reinforcement enabled sufficient anchorage performance at the dapped end, indicating that clip-type shear reinforcement can be viable for use at the dapped ends of PC slabs under construction loads.

1. Introduction

Recently, owing to the rising labor costs in the construction market, precast concrete (PC) systems have been increasingly used in modular high-load long-span buildings (e.g., underground parking lots, logistics centers, and large shopping malls). To improve the construction and economic efficiency by reducing the number of PC structural members, one-way PC structure systems using prestressed PC girders and PC slabs are mainly used (Figure 1a).
PC slabs make up most of this one-way PC structural system. Hence, reducing the PC slab volume has a great influence on the construction cost. The slabs used in the one-way PC method include hollow core slabs [1,2,3,4,5,6,7,8,9,10,11,12], double-tee slabs [13,14,15,16,17,18,19,20], and inverted-tee slabs [21,22,23,24,25,26,27,28]. The double-tee slab, which has a section with the largest distance between the compression zone in the concrete and the tensile reinforcing bar for flexural bending, has great section efficiency when compared with its member weight.
However, in the double-tee slab, the depth of the slab is larger than that of other slab-system types, resulting in an increase in the total building height. To overcome this disadvantage, the Precast/Prestressed Concrete Institute (PCI) design handbook [29] allows the height of the member to be reduced to half the overall height of the slab in order to reduce the floor height of the double-tee slab. The structural strength is secured through the shear reinforcement of the deformed end, which is called a dapped end (see Figure 1b). However, unless it is appropriately designed, local damage may occur at the dapped end.
To stably secure the structural performance of the dapped end of a double-tee slab, a multi-tee slab system, which uses a slab with an additional web installed on the outermost end of the double-tee slab [30], was developed (Figure 1c). In recent years, new construction methods have been proposed to combine structural and thermal insulation work by installing expanded polystyrene (EPS) between the webs of the multi-tee slab for improved constructability and to shorten the construction time (Figure 1c).
However, technical issues should be addressed when applying this new construction method. In general, the dapped end can be severely stressed when the concentrated load is applied, and the cross-sectional shape changes rapidly. Thus, shear failure may occur at the dapped end, as shown in Figure 2a [31]. Special care should be taken to design the dapped end by providing appropriate shear reinforcement [29] when it is introduced in a multi-tee PC slab.
To analyze and improve the shear behavior of the dapped end of the PC slab, a strut–tie model was proposed in the existing literature [31] (Figure 2b). In the strut–tie model of the dapped end, the dotted line and solid line indicate the compressive force and tensile force, respectively, and the value on the line represents the magnitude of the load acting on the element. According to the strut–tie model, to prevent a diagonal tensile failure at the corner of the bent portion by the reaction force R, a tensile-resistant member that has the same force magnitude as the reaction force R should be placed at the BC element in Figure 2b. Therefore, in the design of the dapped end, shear reinforcing bars are generally placed to resist the tensile force loaded on the BC element (Figure 2c).
However, as can be seen in Figure 2c, because the shear-reinforcing bar is anchored to cast-in-place (CIP) topping concrete and additional flexural reinforcing bars to integrate members on the PC member, an intact anchorage cannot be expected prior to the placement and curing of the CIP topping concrete (i.e., at the construction stage). Therefore, at the construction stage, the structural safety of the dapped end may be vulnerable unless additional shear-reinforcing bars are placed.
Currently, to improve the vulnerable structure of the dapped end, due to the unanchored shear reinforcement at the construction stage, Z-shaped shear-reinforcing bars are placed inside the PC slab (Figure 3a). However, the Z-shaped shear reinforcement is not anchored in the flexural rebars. Therefore, in place of the Z-shaped shear reinforcement, clip-type shear reinforcement (Figure 3b) was proposed. The clip-type shear reinforcement, as a closed type, was arranged in the direction of the tensile stress generated at the dapped end for an optimal design to improve the anchorage performance. The structural efficiency of the diagonal and continuous shear reinforcement can be found in the existing literature [32,33,34].
In this study, to investigate the structural safety of a multi-tee PC slab at the construction stage, three multi-tee PC slab specimens were tested. The major parameters were the details of the dapped end reinforcement and the shear span ratio. The load–deflection relationship, failure mode, tested to predicted strength ratios, and shear reinforcement strains were analyzed. This study specifically focused on the performance characteristics of the existing Z-shaped shear reinforcement and the proposed clip-type shear reinforcement installed at the PC slab’s dapped end. Furthermore, the insulation material (EPS) attached to the lower part of the multi-tee PC slab at the construction stage was investigated. Based on the test results, design considerations were proposed.

2. Test Program

2.1. Test Parameters

Table 1 lists the test parameters of the specimens. The major parameters were the reinforcing details of the slab’s dapped ends (Z-type shear reinforcement or clip-type shear reinforcement) and the shear-to-span ratios (12.8 or 6.4). The letters within the names of the specimens indicate the test parameters. The first letters, ZS and CS, refer to Z-type shear reinforcement and clip-type shear reinforcement, respectively. The second number, 12.8 and 6.4, indicates the shear-to-span ratio of the PC slabs. In Specimen ZS-12.8, the existing Z-type shear reinforcement was used for the slab’s dapped ends. In Specimen CS-12.8, the proposed clip-type shear reinforcement was used to improve the performance of the anchorage and structural capacity. In Specimens ZS-12.8 and CS-12.8, the shear-to-span ratio was 12.8, which is close to that found in actual practice. In CS-6.4, to induce a shear failure in the PC slabs, the shear-to-span ratio was decreased to 6.4.

2.2. Specimen Design and Fabrication

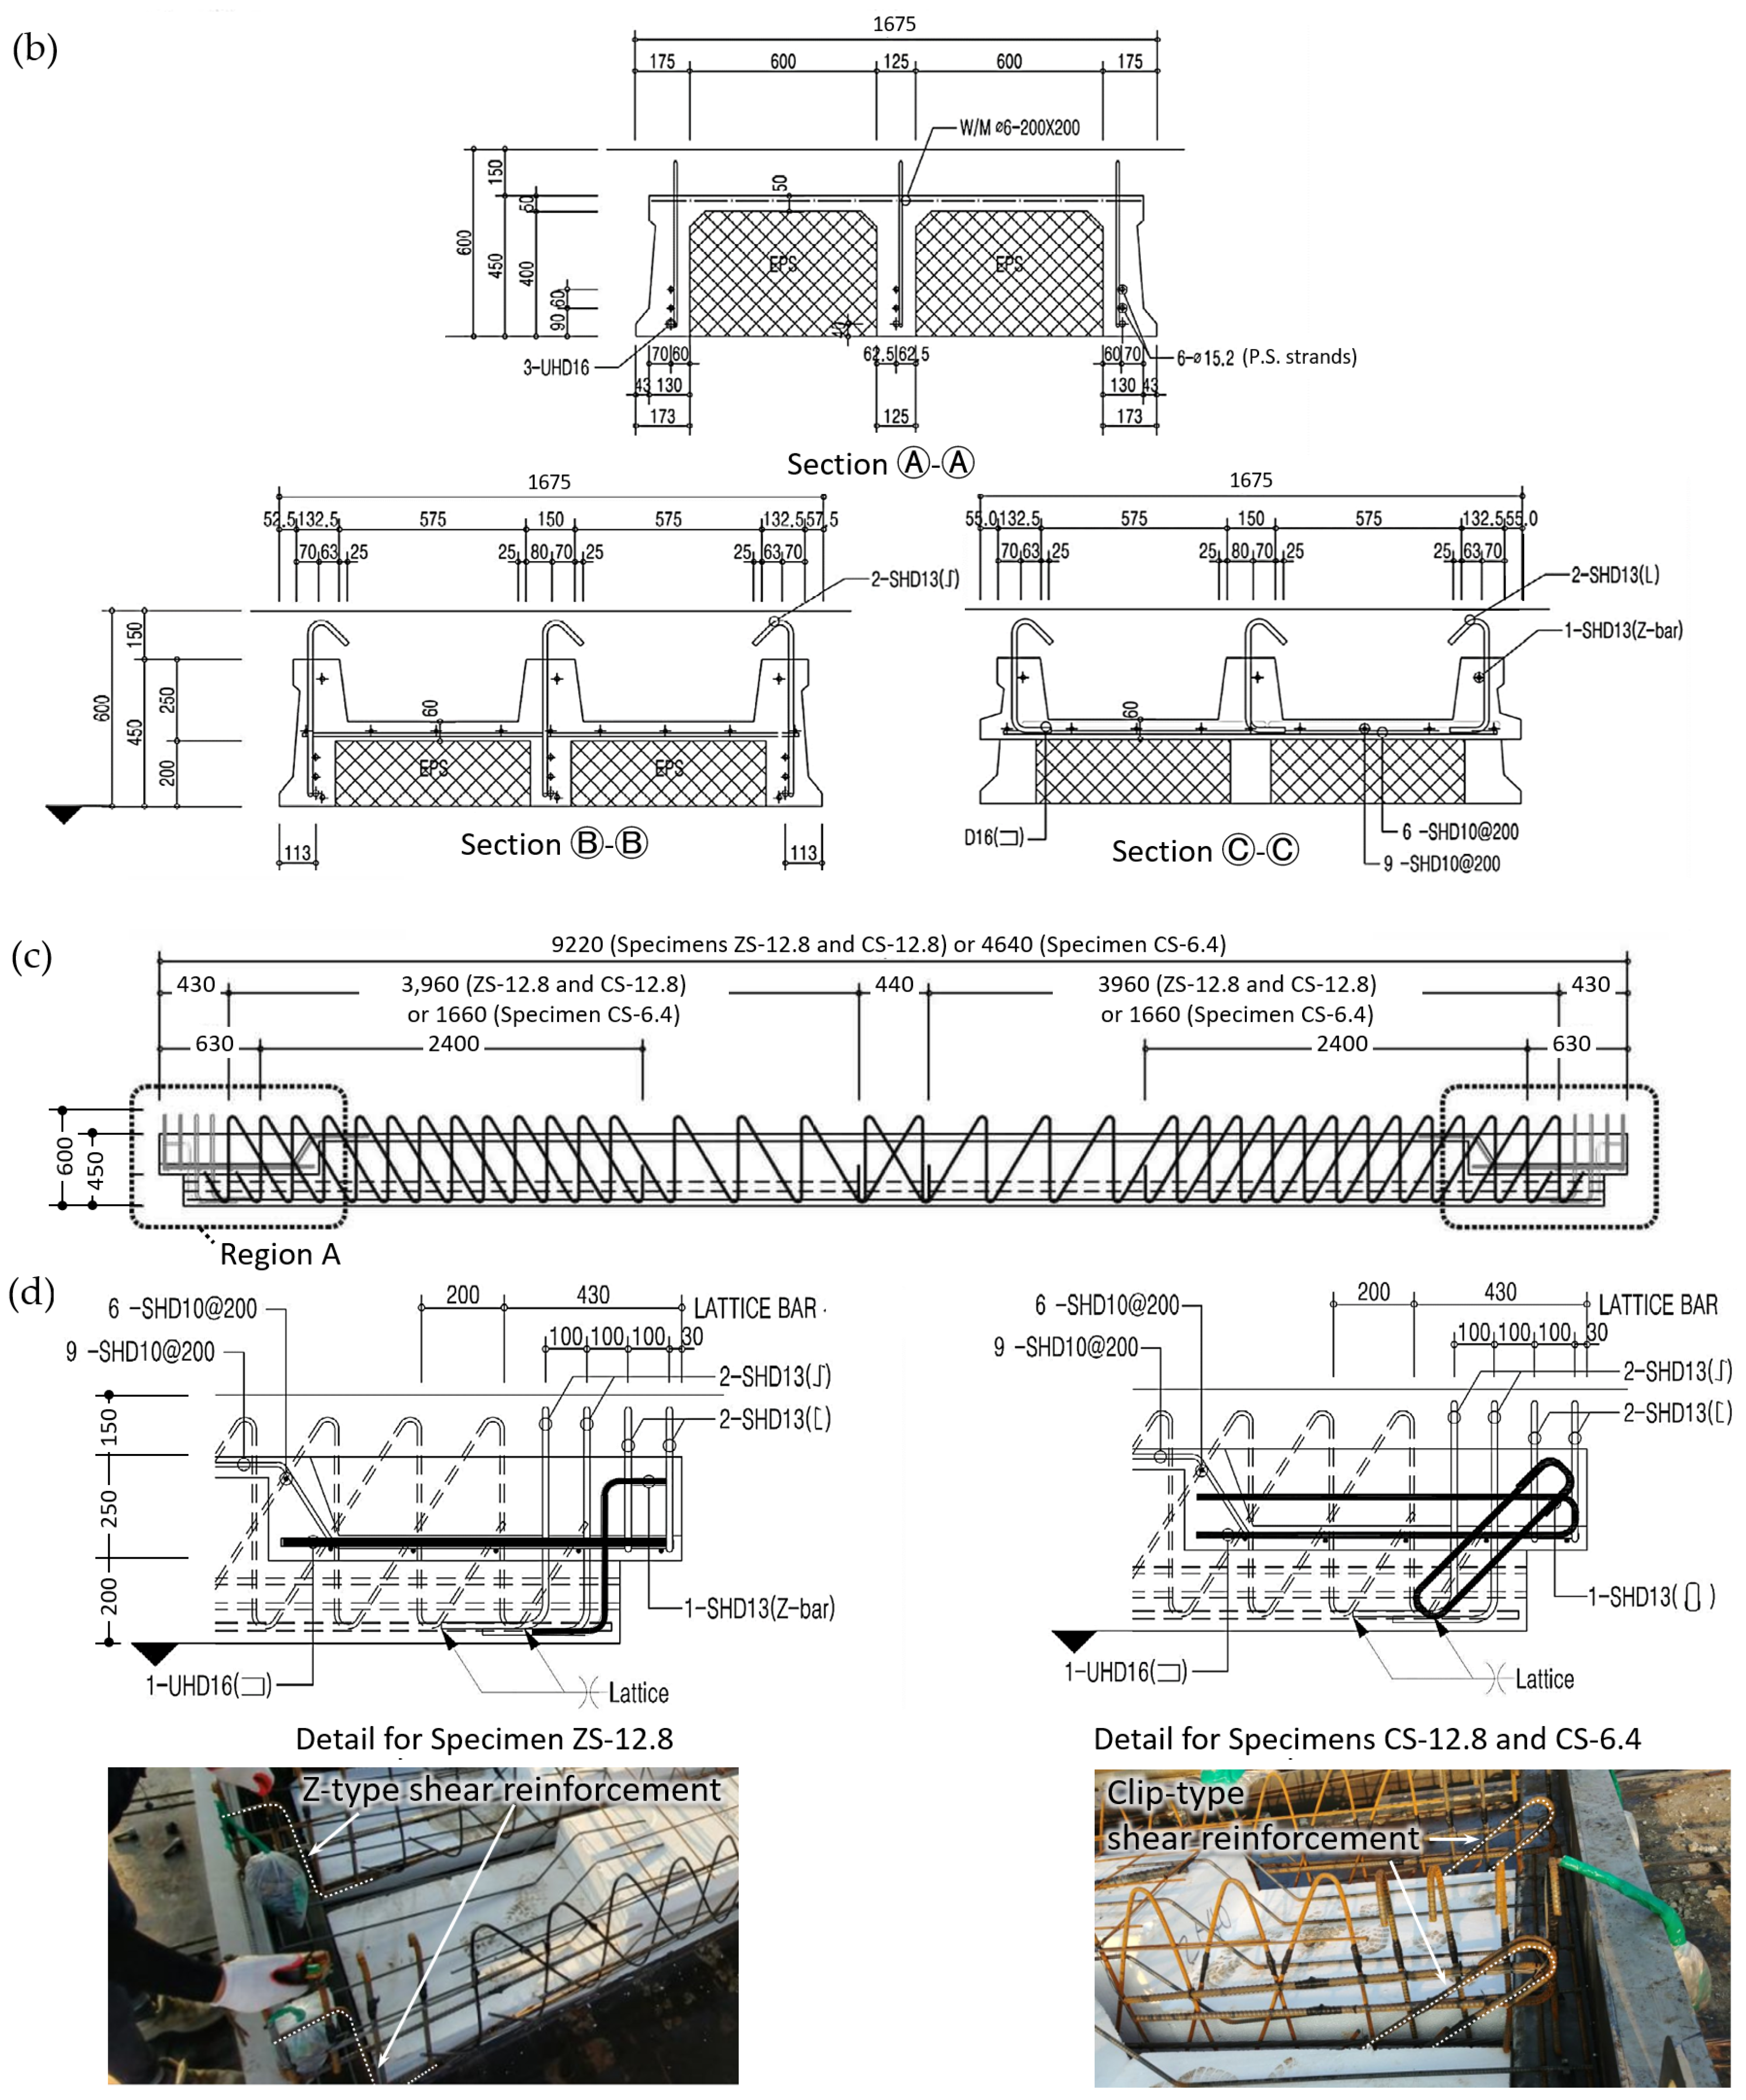
Figure 4 shows the dimensions and reinforcement details of the test specimens. The slab length was 9220 mm for Specimens ZS-12.8 and CS-12.8 and 4640 mm for Specimen CS-6.4 (Figure 4a). The dimensions of the section of the PC slab specimen prior to the placement of the CIP concrete are shown in Figure 4b. The section had three webs, with EPS installed between the webs. Two prestressed strands of ϕ15.2 wire were installed at the bottom of each web (i.e., six strands of wire). A D16 non-prestressed reinforcing bar was additionally placed at the outermost layer of each web (i.e., 3-D16 bars in three webs). Wire mesh was placed at the top flange (Figure 4b), and 6-D16 flexural reinforcement was placed at the bottoms of the dapped ends. Horizontal reinforcement was also placed to prevent cracking.
The lattice reinforcement and stirrups for shear reinforcement were not anchored to the top CIP concrete at the construction stage (Figure 4c). Thus, the stirrups were designed to be exposed. On the other hand, the Z-type and clip-type shear reinforcements were designed to anchor inside the PC slabs (Figure 4d). In ZS-12.8, Z-type shear reinforcement was placed at the dapped ends. In Specimens CS-12.8 and CS-6.4, clip-type shear reinforcement was diagonally placed at an angle of 45°, with the member axis considering the stress directions (Figure 2b). Furthermore, the 6-D16 flexural reinforcement at the bottom of the dapped ends was placed upright in the vertical direction for better constructability (Figure 4d).
A steel form was used to fabricate the specimens. The wire strands used in the PC slabs were subjected to a tensile force of 65% of the ultimate strength. After demolding the formwork, the wire strands were cut when the concrete compressive strength reached 75% of the design strength (i.e., 30 MPa).

2.3. Test Conditions and Test Setup

Figure 5 shows the loading and supporting conditions of the PC slabs under a service load (Figure 5a) and a construction load (Figure 5b). At the service stage after structure completion, the PC slab was integrated with a beam formed by the CIP topping concrete. Thus, the PC slab was subjected to positive and negative bending moments at the center and slab ends, respectively (Figure 5a). On the other hand, at the construction stage before the CIP topping concrete placement, the PC slab was simply supported on the beam under its self weight and the construction load with a positive bending moment (Figure 5b). In this study, to investigate the structural performance of the proposed system at the construction stage, simply supported PC slabs, prior to the CIP concrete placement, were tested (Figure 5b).
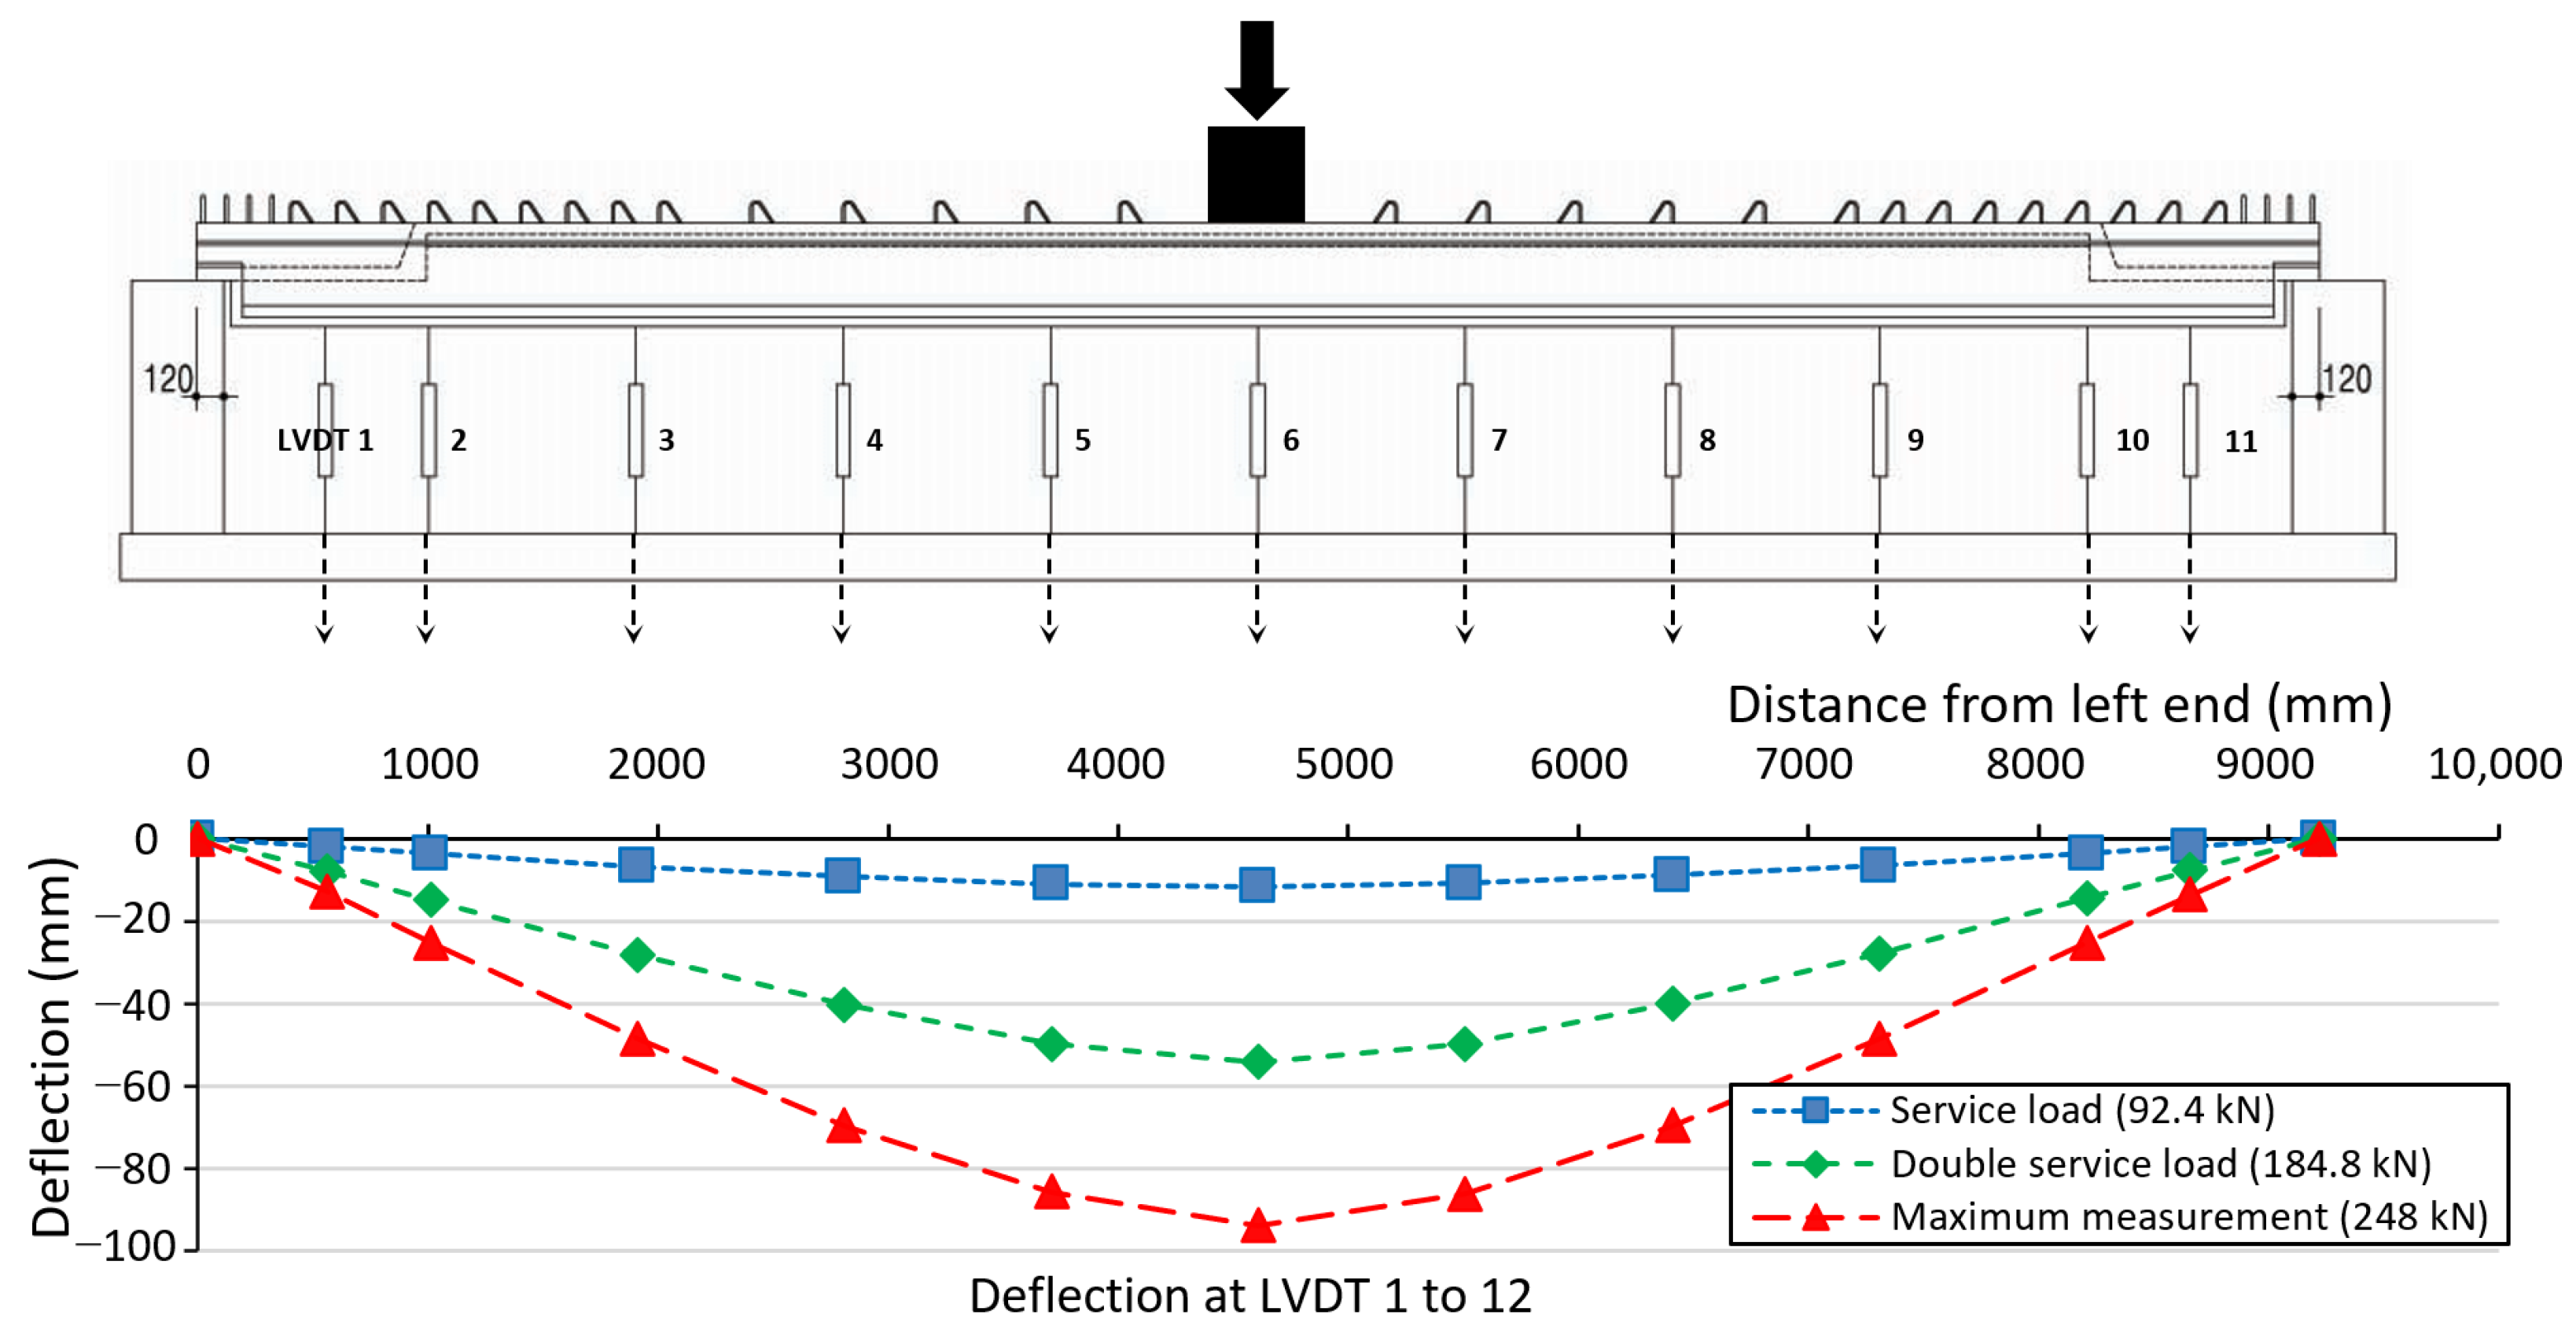
Figure 6 shows the test setup simulating an actual construction stage in practice. The specimens were simply supported by steel zigs at both ends. Monotonic loading was applied at the center of the PC slab using the displacement control method. Strain gauges were attached to the wire strands and reinforcing bars to evaluate the strains of the flexural reinforcement and the contributions of the shear reinforcement. Linear variable differential transformers (LVDTs) were placed at the bottoms of the specimens to measure deflection (Figure 6). To prevent potential damage to the LVDTs underneath the slab in case the specimen collapsed, the test was paused at a certain high loading, and the LVDTs were carefully removed, except for the LVDT measuring the central deflection. Then, the test was continued with the single LVDT at the center.

2.4. Strength Prediction of the Specimen

As the concentrated loading was applied to the center of the simply supported PC slab at both ends (Figure 6), one of the following failure modes was expected: (1) a flexural yielding of the center, (2) a shear failure of the PC slab, or (3) a shear failure of the dapped end, as summarized in Table 2.
The flexural moment corresponding to the flexural yielding at the center of the PC slab can be predicted as follows:
M n = { A p s f p s ( d p a / 2 ) + A s f y ( d a / 2 ) }
where Aps is the area of the prestressed longitudinal tension reinforcement (mm2), fps is the stress in the prestressed reinforcement at a nominal flexural strength (MPa), dp is the distance from the extreme compression fiber to the centroid of the prestressed reinforcement (mm), d is the effective depth of the slab (mm), a′ is the depth of the equivalent rectangular stress block (mm), As is the area of the non-prestressed longitudinal tension reinforcement of the slab (mm2), and fy is the specified yield strength for non-prestressed reinforcement (MPa).
The predicted flexural moment at the center of the specimens could be calculated using Equation (1), as shown in Table 2 (1). The corresponding load at the center could be calculated, excluding the flexural moment by the self weight of the slabs as follows:
P m = { ( M n M s e l f ) / ( l / 2 ) } × 2
where Mself is the flexural moment at the center caused by the self weight of the specimen (wl2/8, w, and l are the distributed load due to the self weight and the span length of the specimen, respectively). Using Equation (2), the flexural strength when flexural yielding occurs at the center can be obtained, as shown in Table 2 (2).
On the other hand, a shear failure may occur at the slabs or the dapped end. The shear strength contributed by the concrete was calculated as follows:
V c = 1 / 6 f c b w d
where fc is the compressive strength of concrete (MPa) and bw is the width of the slab web (mm). The shear strength of the concrete in the PC slab Vc, except for the dapped end parts, could be calculated as shown in Table 2 (3), using Equation (3). For this calculation, the lattice type for the shear reinforcement was excluded, because the lattice was not anchored to the top. In this study, when Vc was calculated, the shear strength contribution of the prestressing force was ignored because, in the dapped end parts, the strand was not placed, and at the center of the PC member, its contribution was minimized or omitted. On the other hand, the shear strength of the concrete in the dapped end parts Vc-dap could also be calculated using Equation (3), as shown in Table 2 (5).
The shear strength contribution by shear reinforcement in the dapped end could be calculated as follows:
V s = A s t f v t ( sin θ + cos θ )
where Ast is the area of the shear reinforcing bar at the end of the dap (mm2), fyt is the yield strength of the shear reinforcing bar (MPa), and θ is the angle between the reinforcing steel and the member axis (see Figure 3), with 90° for the Z shear reinforcement and 45° for the clip-type shear reinforcement.
Assuming a sufficient anchorage performance of the shear reinforcement (Z-type or clip-type), the shear strength of the dapped end Vn-dap could be the sum of the shear contributed by the concrete (Equation (3)) and the shear reinforcement (Equation (4)), as shown in Table 2 (6). The load applied to the specimen was transferred to both ends. Thus, the load at the center when a shear failure occurred near the supports could be approximately calculated by considering the self weight of the specimen as follows:
P v = ( V n W s e l f / 2 ) × 2
where Vn is the nominal shear strength (i.e., Vc + Vs) and Wself is the weight of the specimen.
To apply Equation (5), it was assumed that the shear failure occurred near the simple support points. The load applied to the PC slab center for a shear failure of the specimen Pv-cent, excluding the dapped end, could be obtained as shown in Table 2 (4) using Table 2 (3) and Equation (5). Likewise, the shear strength when a shear failure occurred at the dapped end could be obtained as shown in Table 2 (7) if the shear reinforcement did not work (Pv-dap(c)) and Table 2 (8) if the shear reinforcement worked (Pv-dap(n)).
Ultimately, the expected maximum load was the smallest value among the loads when a flexural failure occurred at the center (Pm), a shear failure occurred at the member (Pv-cent), or a shear failure occurred at the dapped end (Pv-dap(c) or Pv-dap(n)). Therefore, when the shear reinforcement of the dapped end did not work, the expected maximum load of the specimen Plower could be calculated as the smallest value among Pm, Pv-cent, and Pv-dap(c), as shown in Table 2 (9), for each specimen. Likewise, when the shear reinforcement of the dapped end worked efficiently, the maximum expected strength could be calculated as the smallest value among Pm, Pv-cent, and Pv-dap(n), as shown in Table 2 (10), for each specimen. Table 2 (9) and (10) also specify the expected failure mode that governs the predicted strength.

3. Results and Analysis of the Tests

3.1. Material Strength

Table 3 shows the formulation of the concrete (nominal compressive strength of 40 MPa) used in the PC slab specimens. To measure the actual concrete compressive strength, three 100 mm × 200 mm concrete cylinders were tested for each specimen on the day of the test, according to ASTM C39M-20 [35]. The average value of the three concrete cylinders is presented in Table 2 for each specimen, with a concrete compressive strength fc of 43.9–59.0 MPa.
Table 4 shows the yield and tensile strengths of the reinforcing bars and prestressed wire strands used in the specimens. To evaluate the mechanical properties of the reinforcing bars, lattice bar, and the prestressed wire strands, three coupons were tested for each type, according to ASTM E8M-16 [36], and the average values are presented in Table 4. The yield strengths of the steel were defined using the 0.2% offset method for materials with unclear yield plateaus.

3.2. Load–Displacement Relations and Overall Behaviors

Figure 7 and Figure 8 show the load–displacement relationship and ultimate failure mode of each of the specimens, respectively. In Figure 7, the vertical axis indicates the load measured from the actuator, and the horizontal axis indicates the displacement measured from the central LVDT located underneath the PC slab (LVDT 6 in Figure 6). Figure 7 also shows the predicted flexural strength Pm (Equation (2) or Table 2 (2)), shear strength Pv-dap(c) (Table 2 (7)), and service load at the construction stage, which accounts for the CIP topping concrete and working load. At the construction stage, PC slabs should be able to support the CIP topping concrete at approximately 15 cm and a working load (1.5 kN/m2) during the CIP topping concrete pouring. All the specimens were within the elastic range under the service load, as shown in Figure 7.
In Specimens ZS-12.8 and CS-12.8, which had a high shear-to-span ratio of 12.8, a ductile flexural behavior with flexural cracks at the center of the PC slab was observed without any failure of the dapped ends (Figure 7a,b and Figure 8a,b). For CS-6.4, with the shear-to-span ratio reduced to 6.4 to induce a shear failure, the load carrying capacity rapidly decreased after the peak strength, and more flexural shear cracking occurred than in Specimens ZS-12.8 and CS-12.8. However, the flexural cracks occurred at the center of the PC slabs, and the specimen ultimately failed, with concrete crushing at the extreme compression fiber. Similar cracking patterns also occurred at the other outer surfaces of the specimens.
In Specimens ZS-12.8 and CS-12.8 with Z-type and clip-type shear reinforcements, respectively, almost identical behavior was observed (Figure 7a,b). However, in Specimen ZS-12.8 with Z-type shear reinforcement, cracks occurred at the dapped end approximately when the load was increased to 160 kN, whereas no damage was observed at the dapped end in Specimen CS-12.8 with clip-type shear reinforcement until the end of the test. This disparity in the damage pattern at the dapped end will be analyzed in Section 4 in detail.
As can be seen in Figure 8a, the insulation (EPS) attached to the lower part of the PC slab remained attached without any damage until the ultimate failure of the PC slab, which indicates that the adhesion between the EPS insulation and the PC slab was secure until the ultimate failure of the PC slab.
Table 5 summarizes the test results of the specimens, including the yield load Py, measured maximum load Ptest, the load at failure or the load at the end of the test Pu, the corresponding drift ratios δy (yield drift ratio at Py), δtest (the drift ratio at Ptest), δu (ultimate yield drift ratio at Pu), initial and yield secant stiffness (Ki and Ky), ductility ratio δuy, and the mean value of the normalized strain in Z-type or clip-type shear reinforcements at each load level (i.e., Py, Ptest, and Pu). The yield drift δy was defined using the yield secant stiffness Ky, corresponding to 75% of the maximum strength (i.e., at Py). The ultimate drift δu was defined as the post-peak drift, corresponding to 75% of the maximum strength (i.e., at Pu) [37]. The drift ratios were obtained by dividing the displacement by the shear span lengths of specimens.
In Specimens ZS-12.8 and CS-12.8 with Z-type and clip-type shear reinforcement, respectively, the load at each level (i.e., Py, Ptest, and Pu) and the corresponding drift ratios were almost identical. Thus, the ductility ratios were similar to each other (δuy = 3.29 and 3.17 in ZS-12.8 and CS-12.8, respectively). On the other hand, in Specimen CS-6.8 with the shear-span ratio reduced to 6.4, the ductility ratio δuy was increased to 5.73, owing to the lower yield drift ratio δy and larger ultimate drift ratio δu than those of Specimen CS-12.8 with a shear-to-span ratio of 12.8. Although all the specimens failed in flexure, in Specimen CS-6.4 with the shear-to-span ratio reduced to 6.4, the strain of the clip-type shear reinforcement significantly increased due to the increased shear demand (Table 5).
Figure 9 shows the displacement distributions measured by the LVDTs for ZS-12.8 for the service load, double the service load, and the load corresponding to the removal of the LVDTs. Under the service load, the specimen showed elastic deformations due to the noncracking concrete (Figure 7a and Figure 9), which indicates that the structural safety of the PC slab system was secure under the construction load. Under double the service load considering a potential higher load, owing to the flexural cracking at the center of the PC slabs, the central displacement was increased by the decreased stiffness, resulting in a larger curvature at the center. This behavior was more significant under the maximum measurement (248 kN).

3.3. Comparison of Tested Strength to Predicted Strength

In Figure 7, the predicted strengths of each specimen are shown. For Specimens ZS-12.8 and CS-12.8, if the anchorage performance of the dapped end’s shear reinforcement was insufficient, the predicted strength would decrease, owing to a shear failure at the dapped end, as indicated by the green dashed line. On the other hand, if shear failure was prevented at the dapped end, a flexural failure would be expected, as shown by the red, long dashed line in Figure 7a,b. Because Specimens ZS-12.8 and CS-12.8 ultimately failed in flexure at the center (Figure 7a,b and Figure 8a,b), the tested to predicted strength ratios were 1.22 and 1.20, respectively (Table 2 (13)). This indicates that, by using Z-type or clip-type reinforcement, the flexural strengths of the PC slabs at the construction stage could be predicted with an adequate safety margin.
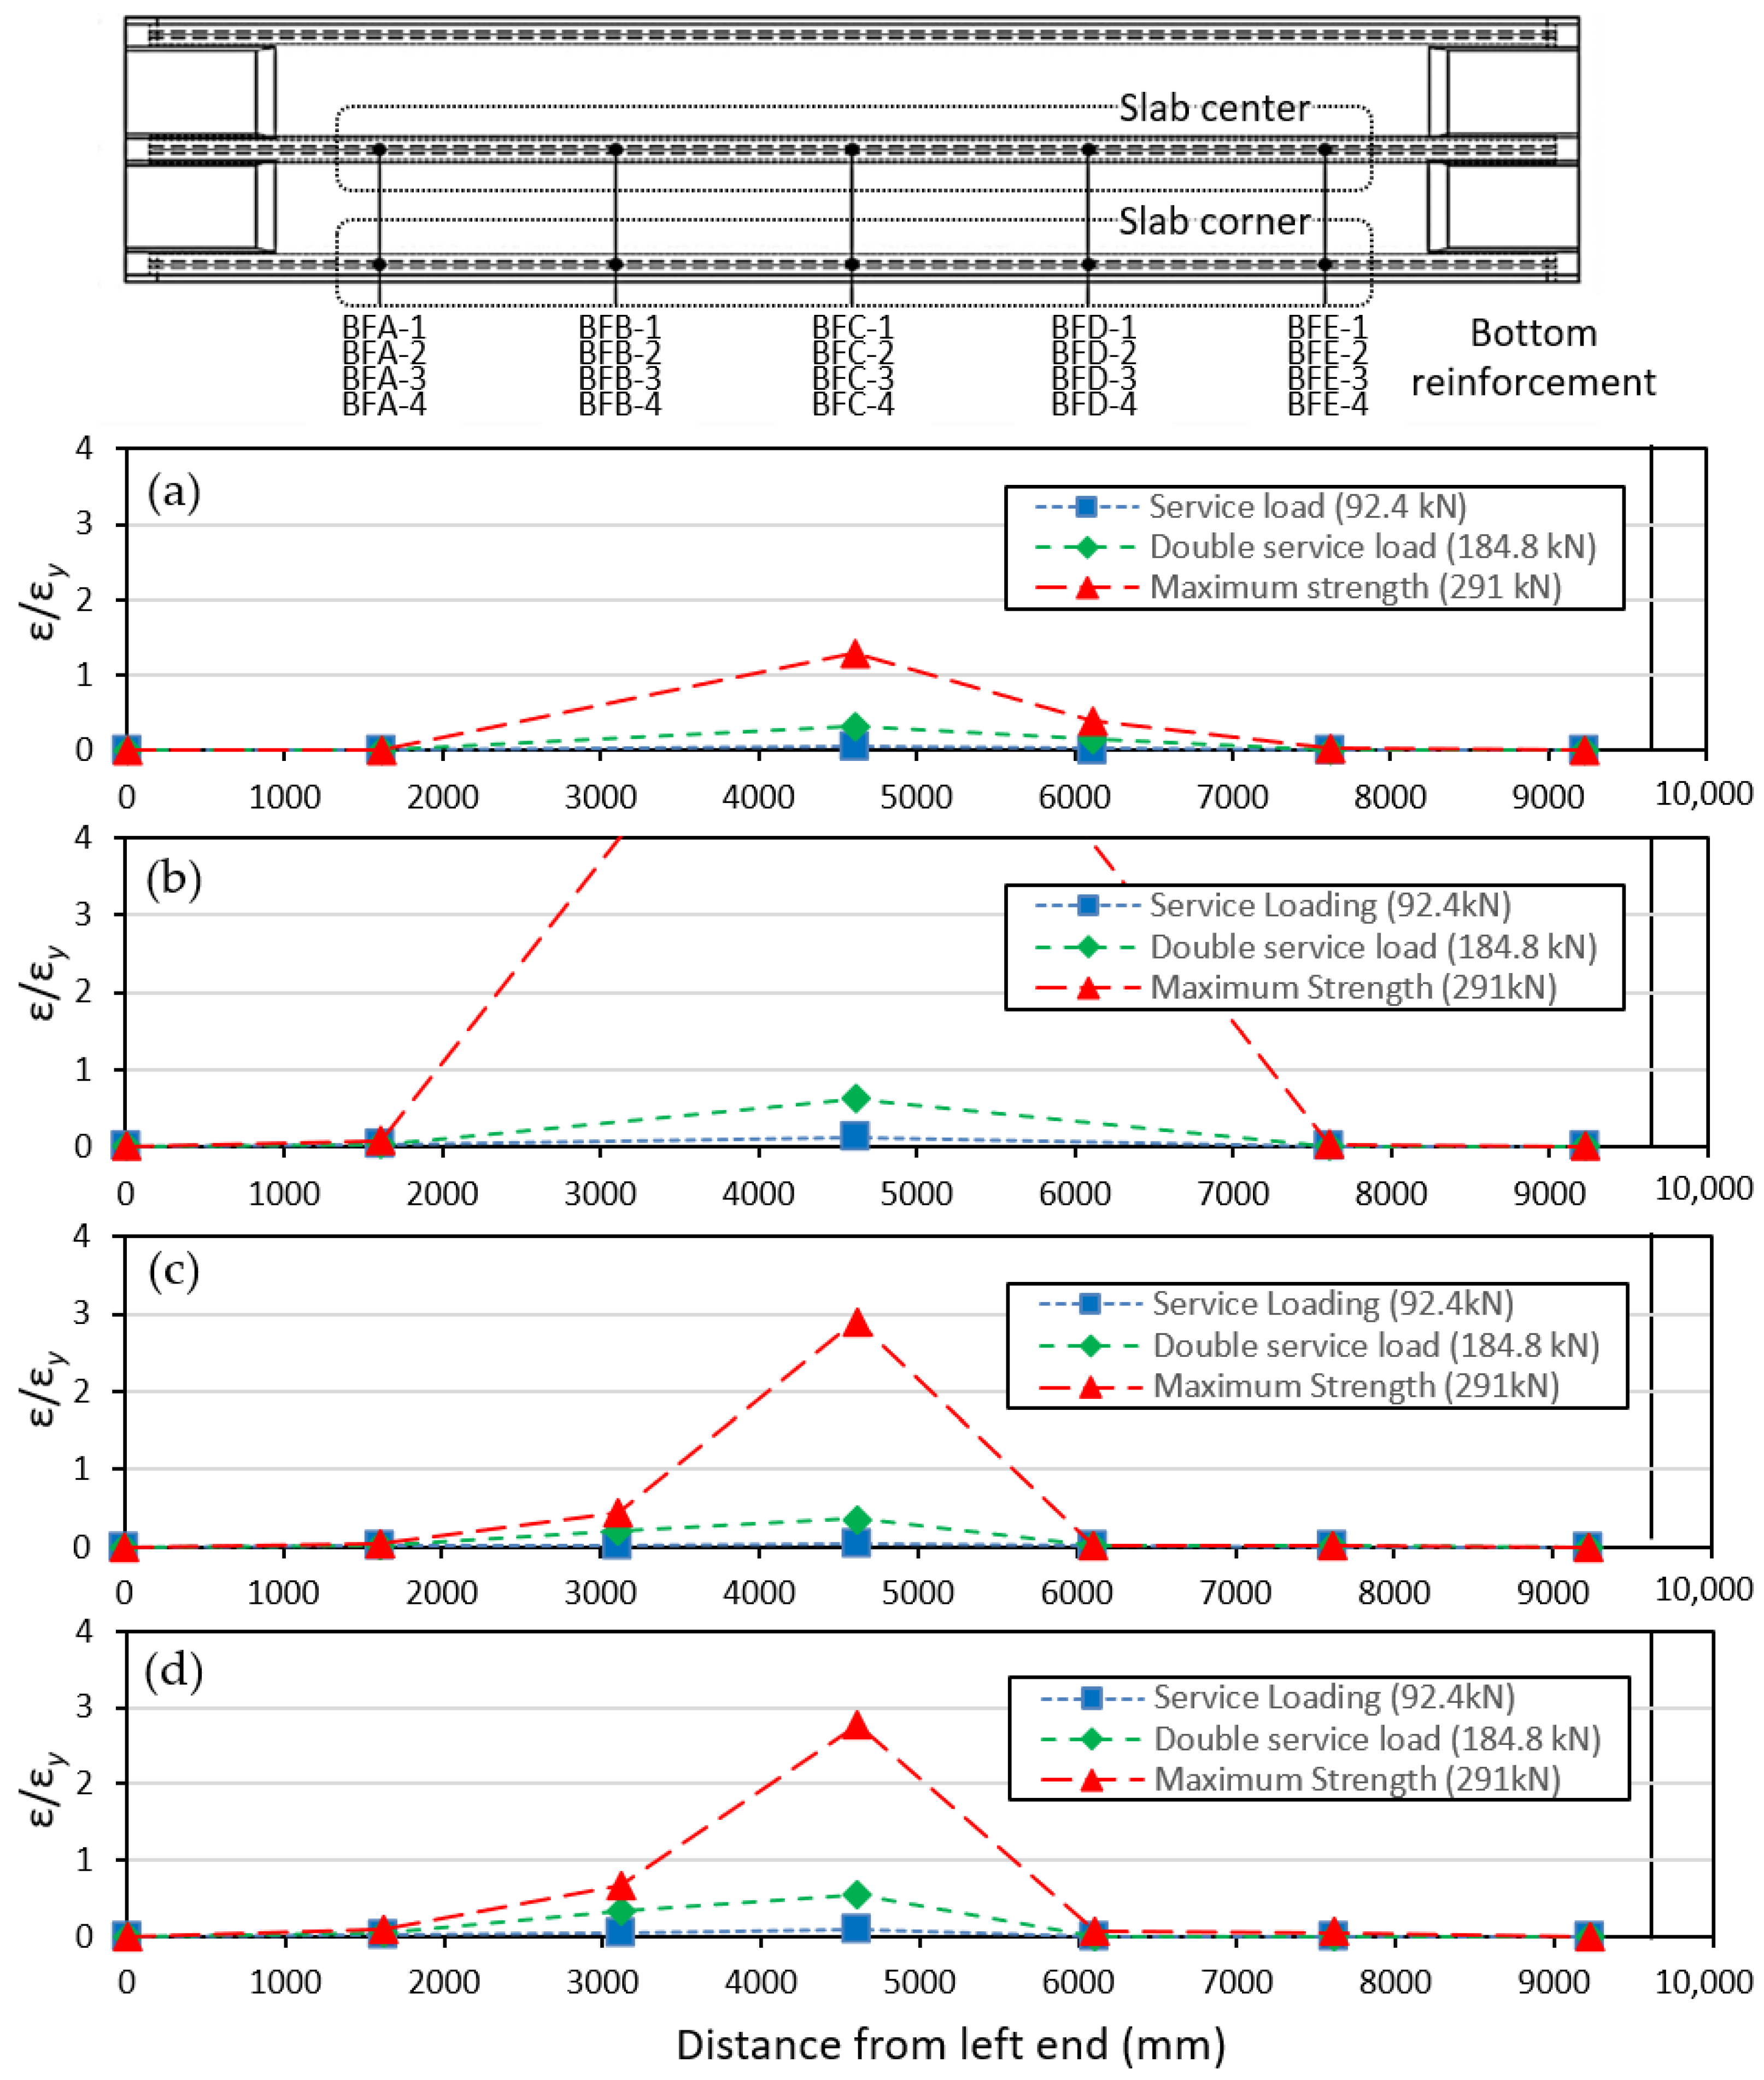
Figure 10 shows the strain distributions of the wire strands and tensile reinforcement bars of ZS-12.8 under the service load, double the service load, and the ultimate load. At the ultimate load, the strains of the wire strands and the tensile reinforcement at the center were greater than the yield strain. The yield strain of strand εy was calculated as 0.45εyy − 0.65εy+ 0.1εy), considering the loss of the strain 0.65εy, owing to the introduction of prestress, and the strain due to the short-term loss of 0.10εy. Therefore, in the case of Specimen ZS-12.8, the ductile behavior after flexural yielding was confirmed. Likewise, the strain distributions of CS-12.8 were almost identical to those of ZS-12.8.
In CS-6.4, with the shear-to-span ratio reduced to half (Table 2 and Figure 7c), a shear failure was expected to occur in members other than the dapped end if the shear reinforcement exhibited appropriate performance. However, as shown in Figure 7c and Figure 8c, although a number of flexure shear cracks appeared in the member, the ultimate failure occurred at the center of the PC slab with concrete crushing. In CS-6.4, the strains of the strands and the tensile reinforcing bars were slightly smaller than those of Specimens ZS-12.8 and CS-12.8. However, they exhibited 2.5 to 2.8 times the yield strains, showing ductile behavior similar to that of Specimens ZS-12.8 and CS-12.8. The tested strength to predicted strength ratio was 1.40 (Table 2 (13)).
None of the specimens suffered the shear failure expected from the predicted strengths, including CS-6.4, with a smaller shear-to-span ratio. This was because the contributions of the unanchored shear reinforcement (straight shear reinforcement and lattice shear reinforcement) were excluded from the strength prediction. Thus, it is necessary to further study the partial contribution of the unanchored shear reinforcement to the shear strengths of the PC slabs.

4. Discussion

The purpose of this study was to compare the performance of the Z-type shear reinforcement and the proposed clip-type shear reinforcement installed at a PC slab’s dapped end during the construction stage. The performance characteristics of the two types of shear reinforcement were analyzed through the damage pattern of the dapped end and the strain pattern of the shear reinforcement.
Figure 11 shows the dapped ends at the end of the test. In ZS-12.8, local cracks appeared near the dapped end. In Specimens CS-12.8 and CS-6.4 with clip-type shear reinforcement, no damage was observed at the dapped end. Particularly in CS-6.4, despite the 2.5 times higher loading than that of Specimens ZS-12.8 and CS-12.8, damage was effectively prevented by using clip-type shear reinforcement.
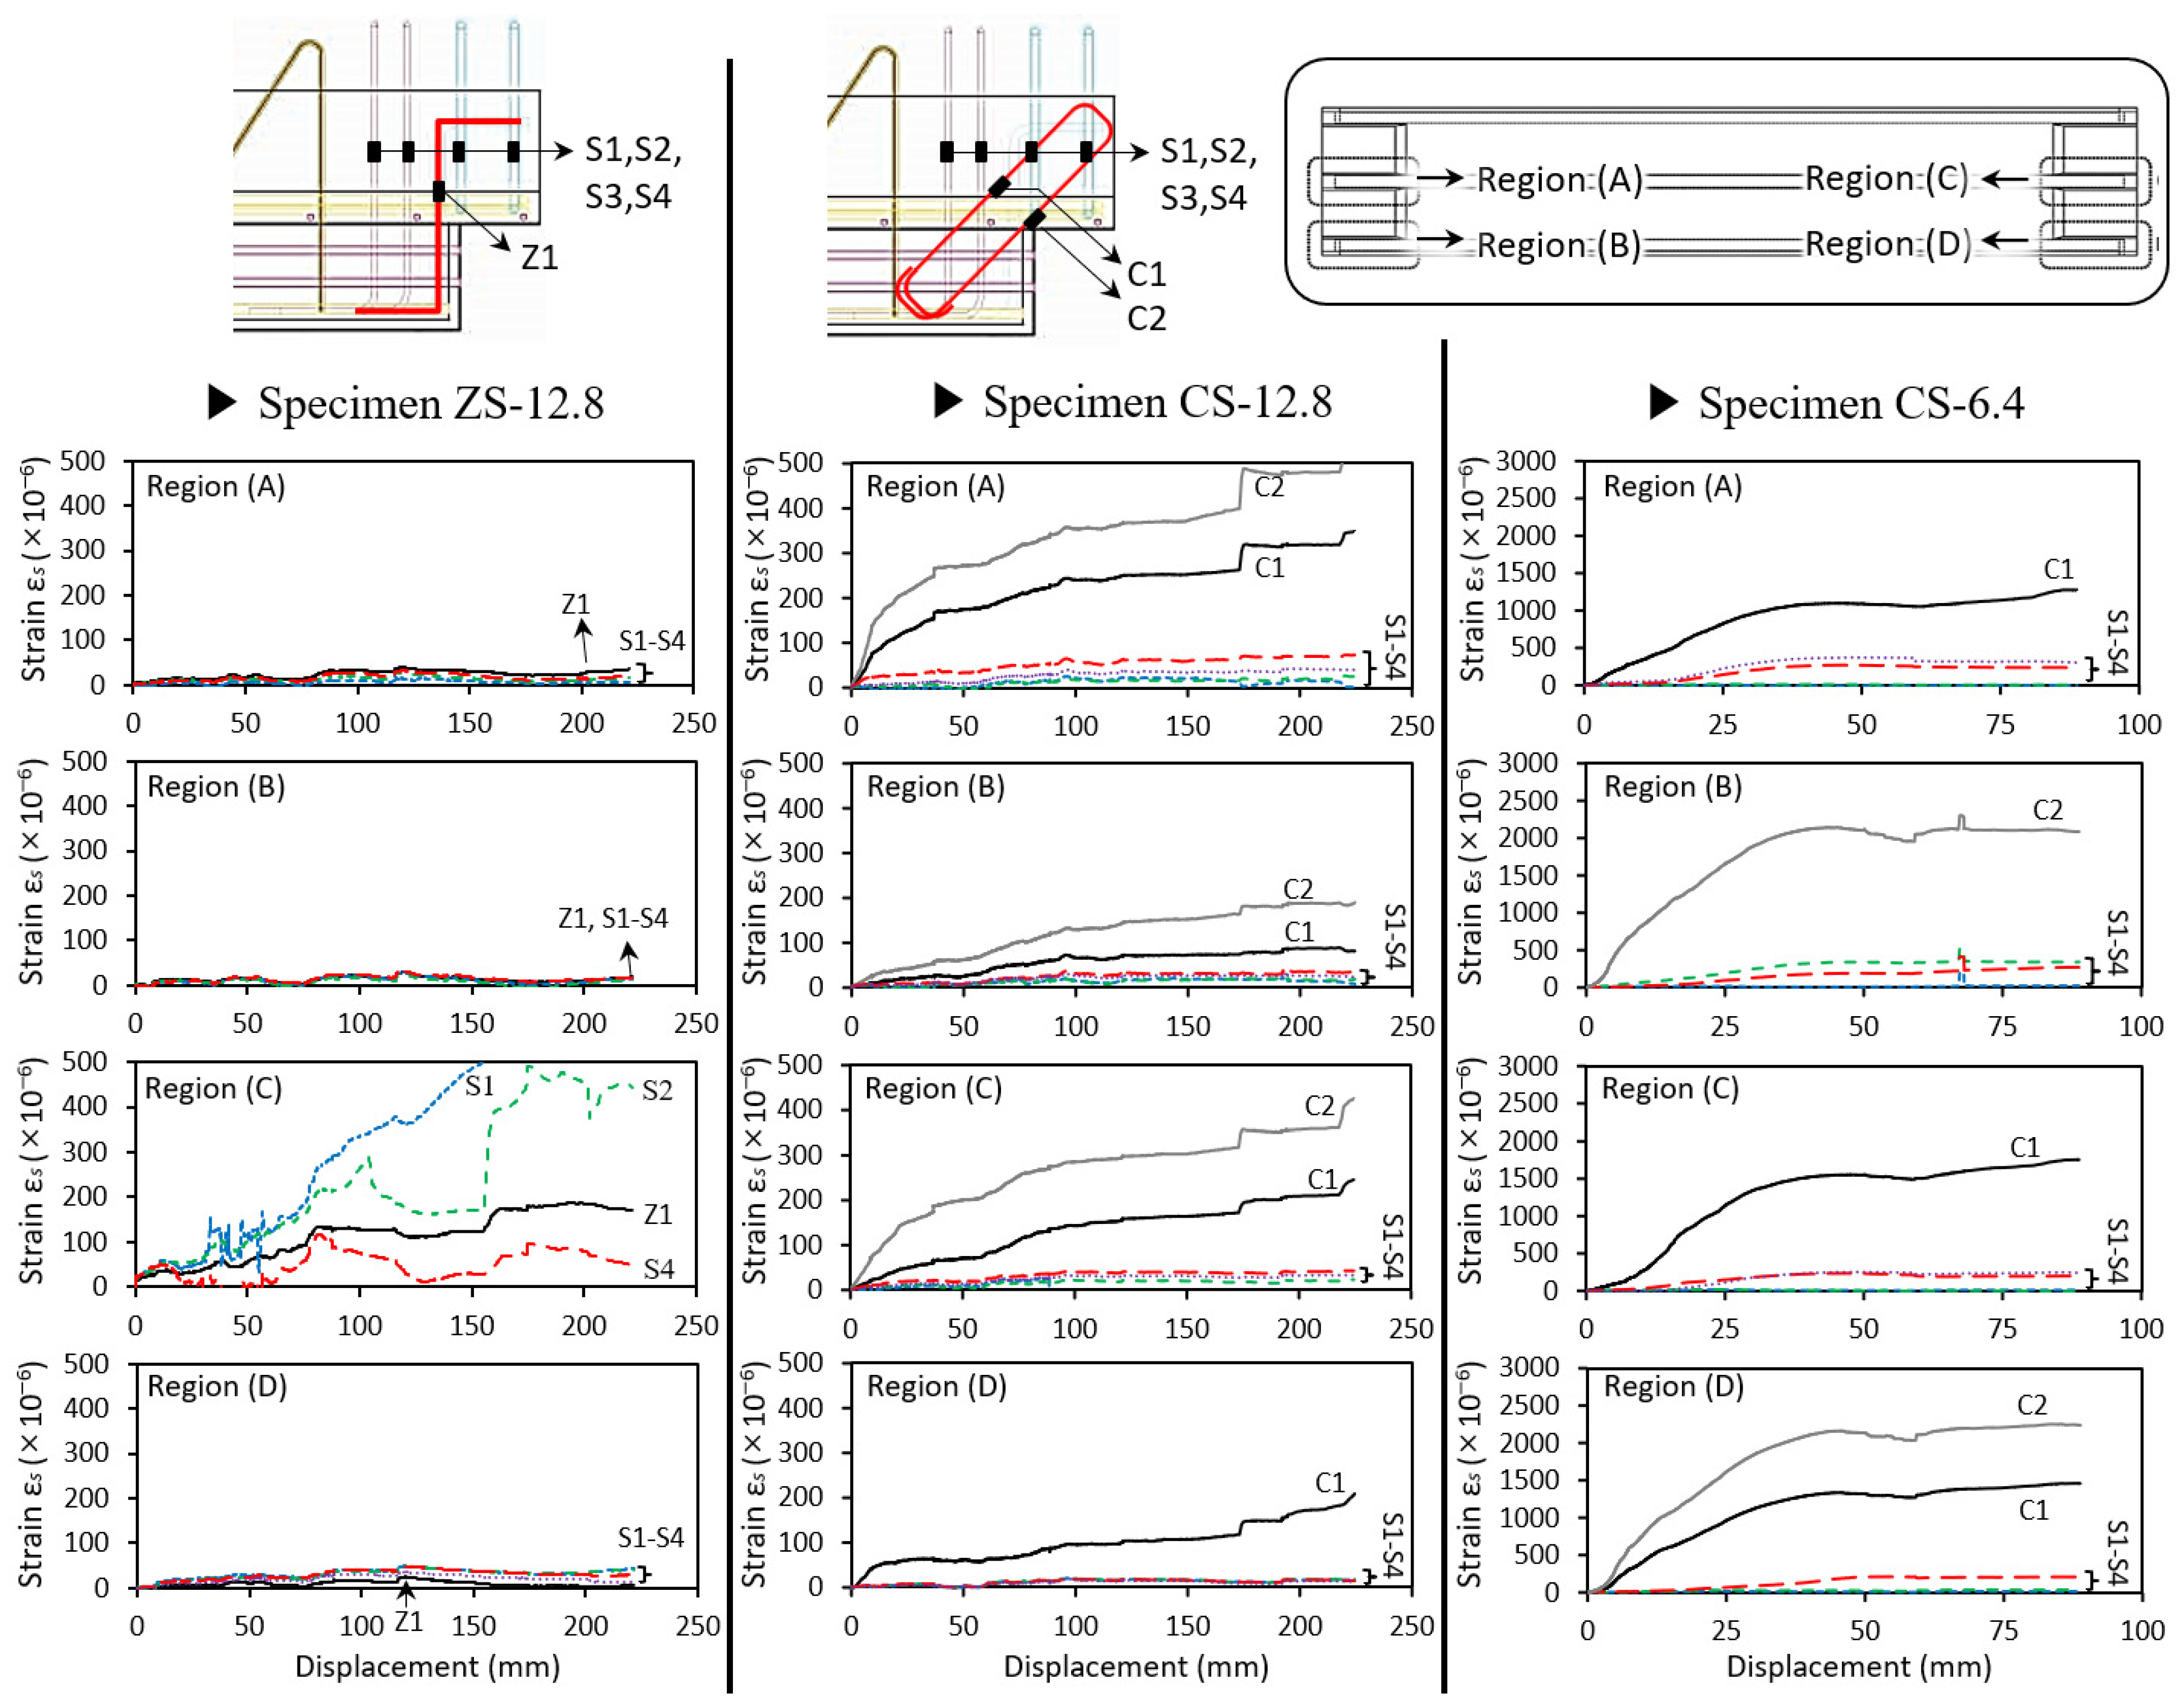
Figure 12 shows the strain distributions of the unanchored shear reinforcement (S1–S4) and shear reinforcement (Z1 or C1–C2), placed at the dapped end for each region (A–D) of each specimen. The horizontal axis indicates the central displacement of the PC slabs, and the vertical axis indicates the measured strains of the shear reinforcement. In ZS-12.8, the strains for the Z-type shear reinforcement (Z1) were very limited and were close to those of the unanchored shear reinforcement (S1–S4), except for those of Region (C), where the strains of the shear reinforcements were much greater than those of other regions (i.e., Regions (A), (C), and (D)). Owing to the limited anchorage performance of Z-type and unanchored shear reinforcement, the damage was likely to concentrate only on a support without stress distribution to the other supports. Furthermore, in Region (C), the strain of the Z-type shear reinforcement (Z1) was not significantly greater than the unanchored shear reinforcement (S1–S4). This result indicates that the Z-type shear reinforcement demonstrated poor anchorage performance and ineffective load transferring at the dapped end because it was not properly anchored into the concrete without enclosing flexural reinforcement.
On the other hand, in Specimens CS-12.8 and CS-6.4, the strains of the clip-type shear reinforcement (C1 and C2) were much greater than those of the unanchored shear reinforcement (S1–S4). Furthermore, unlike Specimen ZS-12.8 with Z-type shear reinforcement, the strains of all the clip-type shear reinforcements in Regions (A–D) were uniformly distributed, showing greater load distribution capacities in Specimens CS-12.8 and CS-6.4. This was because (1) the clip-type shear reinforcement improved the anchorage performance, owing to the enclosed details, and (2) the clip-type shear reinforcement was arranged in the same direction as the resultant force of the tensile strut (Figure 2b).
As shown in Figure 12 and Table 5, in the clip-type shear reinforcement in Specimens CS-12.8 and CS-6.4, the strains of C2, measured closer to the loading point, were greater than those of C1, which was measured further away. This result indicates that the clip-type shear reinforcement should be located close to the loading point. Particularly in CS-6.4 under a higher shear force, the measured strains of the clip-type shear reinforcement reached approximately 0.002, which was approximately 80% of the yield strain. This shows the structural efficiency of the diagonally positioned clip-type shear reinforcement.

5. Conclusions

Recently, PC systems have been increasingly used in modular high-load long-span buildings. In particular, a one-way PC structural system that utilizes prestressed PC beams and PC slabs facilitates secure construction and economics. When constructing a one-way PC structural system, multi-tee PC slabs with dapped ends have been increasingly applied to reduce the floor height and improve structural performance and constructability. However, at the construction stage, the structural safety of the PC slabs is compromised, owing to the unanchored shear reinforcement.
This study proposed the use of clip-type shear reinforcement at the dapped ends for multi-tee PC slabs. To investigate the structural performance of the multi-tee PC slabs at the construction stage, the performance characteristics of the proposed reinforcement at the dapped end, and the damage level of the insulation (expanded polystyrene) attached to the bottom of the multi-tee PC slab, a monotonic loading test was performed for simply supported PC slabs, considering the construction stage. The major test parameters were the reinforcement details of the PC slab’s dapped end (Z-type or clip-type shear reinforcement) and the shear-to-span ratio (12.8 and 6.4). Based on the test, the load–displacement relationship of the multi-tee PC slab, failure mode, strength ratios to the predicted strength, and shear reinforcement strains were analyzed. The major findings of this study are summarized as follows:
  • In the case of a general multi-tee PC slab at the construction stage, the behavior was governed by flexural failures rather than a shear failure of the dapped end or a member, owing to the slender shapes and high shear-to-span ratio;
  • The insulation material (EPS) attached to the bottom of the multi-tee PC slab was intact with the PC slab until the slab’s ultimate failure without any particular damage. This indicates that the adhesion between the insulation and the PC slab could be secured until the ultimate state, as well as at the construction stage;
  • The tested-to-predicted flexural strength ratios of the PC slabs at the construction stage were 1.20–1.40. This indicates that the flexural strength can be predicted with an adequate safety margin according to the predicted equations in the current design codes. By excluding the shear contributions of the unanchored shear reinforcement (straight shear reinforcement and lattice shear reinforcement), the shear performance of the PC slab at the construction stage showed a very conservative prediction. Thus, further study is needed to determine the contribution of unanchored shear reinforcement;
  • The existing Z-type shear reinforcement at the dapped end showed limited anchorage performance, similar to that of unanchored shear reinforcement. This was because the Z-type shear reinforcement was not anchored into the concrete and had no enclosing flexural reinforcement, resulting in ineffective load transfers at the dapped end;
  • The clip-type shear reinforcement proposed in this study at the dapped end showed superior structural performance. Clip-type shear reinforcement improved the anchorage performance because of the enclosed detail and because it was arranged in the same direction as the resultant force of the tensile strut. The closer it was located to the loading point of the dapped end, the more effective the clip-type shear reinforcement was expected to be.

Author Contributions

Conceptualization, methodology, supervision, project administration, funding acquisition, and writing—review and editing, S.-M.K.; writing—original draft preparation, investigation, validation, data curation, software, and visualization, J.-W.B. All authors have read and agreed to the published version of the manuscript.

Funding

This research was financially supported by the National Research Foundation of Korea (NRF) grant funded by the Korean government (MSIT) (No. 2018R1A2B6007559 and No. 2019R1F1A1059249). The authors are grateful for their support.

Institutional Review Board Statement

Not applicable.

Informed Consent Statement

Not applicable.

Data Availability Statement

Restrictions apply to the availability of these data. Data was obtained from Daelim Industrial Company, DongSeo PCC, ESEN DESIGN & TECH, and are available from the authors with the permission of the mentioned parties.

Conflicts of Interest

The authors declare no conflict of interest. The funders had no role in the design of the study; in the collection, analyses, or interpretation of data; in the writing of the manuscript; or in the decision to publish the results.

References

  1. Yang, L. Design of prestressed hollow core slabs with reference to web shear failure. J. Struct. Eng. 1994, 120, 2675–2696. [Google Scholar] [CrossRef]
  2. Fellinger, J.; Stark, J.; Walraven, J. Shear and anchorage behaviour of fire exposed hollow core slabs. Heron 2005, 50, 279–301. [Google Scholar]
  3. Becker, R.J.; Buettner, D.R. Shear tests of extruded hollow-core slabs. PCI J. 1985, 30, 40–54. [Google Scholar] [CrossRef]
  4. Cuenca, E.; Serna, P. Failure modes and shear design of prestressed hollow core slabs made of fiber-reinforced concrete. Compos. Part B. Eng. 2013, 45, 952–964. [Google Scholar] [CrossRef]
  5. Girhammar, U.A.; Pajari, M. Tests and analysis on shear strength of composite slabs of hollow core units and concrete topping. Constr. Build. Mater. 2008, 22, 1708–1722. [Google Scholar] [CrossRef]
  6. Baran, E. Effects of cast-in-place concrete topping on flexural response of precast concrete hollow-core slabs. Eng. Struct. 2015, 98, 109–117. [Google Scholar] [CrossRef]
  7. Xu, X.; Yu, J.; Wang, S.; Wang, J. Research and application of active hollow core slabs in building systems for utilizing low energy sources. Appl. Energy 2014, 116, 424–435. [Google Scholar] [CrossRef]
  8. Bertagnoli, G.; Mancini, G. Failure analysis of hollow-core slabs tested in shear. Struct. Concr. 2009, 10, 139–152. [Google Scholar] [CrossRef]
  9. Mones, R.M.; Breña, S.F. Hollow-core slabs with cast-in-place concrete toppings: A study of interfacial shear strength. PCI J. 2013, 58, 124–141. [Google Scholar] [CrossRef]
  10. Ibrahim, I.; Elliott, K.; Abdullah, R.; Kueh, A.; Sarbini, N. Experimental study on the shear behaviour of precast concrete hollow core slabs with concrete topping. Eng. Struct. 2016, 125, 80–90. [Google Scholar] [CrossRef]
  11. Brunesi, E.; Bolognini, D.; Nascimbene, R. Evaluation of the shear capacity of precast-prestressed hollow core slabs: Numerical and experimental comparisons. Mater. Struct. 2015, 48, 1503–1521. [Google Scholar] [CrossRef]
  12. Lee, Y.-J.; Kim, H.-G.; Kim, M.-J.; Kim, D.-H.; Kim, K.-H. Shear performance for prestressed concrete hollow core slabs. Appl. Sci. 2020, 10, 1636. [Google Scholar] [CrossRef] [Green Version]
  13. Mohammed, H.A. Optimum Prestressing Amount and Its Effective Force on Prestressed Concrete Double Tee Beam with Web Opening. Int. J. Civ. Eng. Technol. 2019, 10, 1801–1816. [Google Scholar]
  14. Kumar, P.; Kodur, V.K. A rational approach for fire-resistance evaluation of double-tee, prestressed concrete slabs in parking structures. PCI J. 2020, 65, 20–41. [Google Scholar] [CrossRef]
  15. Naito, C.J.; Cao, L.; Peter, W. Precast Concrete Double-tee Connections, Part I: Tension Behavior. PCI J. 2009, 54, 49–66. [Google Scholar] [CrossRef]
  16. Zheng, W.; Oliva, M.G. A practical method to estimate elastic deformation of precast pretopped double-tee diaphragms. PCI J. 2005, 50, 44–55. [Google Scholar] [CrossRef] [Green Version]
  17. Wright, H.E., Jr.; Burns, N.H. Deflection of double tees and hollow-cored slabs with high tension allowed in concrete. PCI J. 1974, 19, 100–118. [Google Scholar] [CrossRef]
  18. Arockiasamy, M.; Badve, A.; Rao, B.; Reddy, D. Fatigue strength of joints in a precast prestressed concrete double tee bridge. Railw. Age 1991, 36, 84–99. [Google Scholar] [CrossRef]
  19. Naser, A.F.; Mohammed, H.A. Nonlinear Analysis Comparison to Predict Design Charts for Normal and Lightweight Prestressed Concrete Double Tee Beams. Nonlinear Anal. 2020, 62, 715–731. [Google Scholar]
  20. Afefy, H.M.; Sennah, K.; Cofini, A. Retrofitting actual-size precracked precast prestressed concrete double-Tee girders using externally bonded CFRP sheets. J. Perform. Constr. Fac. 2016, 30, 4015020. [Google Scholar] [CrossRef]
  21. Pessiki, S.; Thompson, J. Experimental investigation of precast, prestressed inverted tee girders with large web openings. PCI J. 2006, 51, 2–17. [Google Scholar]
  22. Kamel, M.R.; Tadros, M.K. The inverted tee shallow bridge system for rural areas. PCI J. 1996, 41, 28–43. [Google Scholar] [CrossRef]
  23. Piccinin, R.; Schultz, A.E. The Minnesota inverted-tee system: Parametric studies for preliminary design. PCI J. 2012, 57, 162–179. [Google Scholar] [CrossRef]
  24. Ambare, S.; Peterman, R.J. Evaluation of the Inverted Tee Shallow Bridge System for Use in Kansas; Kansas Department Transportation: Topeka, KS, USA, 2006; p. 99.
  25. Martindale, G.P. Structural Identification and Assessment of the Inverted Tee Girder Bridge System. Master’s Thesis, University of Nebraska-Lincoln, Lincoln, NE, USA, 2018. [Google Scholar]
  26. Thompson, J.M.; Pessiki, S. Behavior and Design of Precast Prestressed Inverted Tee Girders with Multiple Web Openings for Service Systems. Civ. Environ. Eng. 2004, 156. [Google Scholar] [CrossRef]
  27. Polivka, K.A.; Faller, R.; Rohde, J.; Reid, J.; Sicking, D.; Holloway, J. Safety Performance Evaluation of the Nebraska Open Bridge Rail on an Inverted Tee Bridge Deck; Nebraska Department of Roads: Lincoln, NE, USA, 2004; p. 94.
  28. Han, S.-J.; Jeong, J.-H.; Joo, H.-E.; Choi, S.-H.; Choi, S.; Kim, K.S. Flexural and Shear Performance of Prestressed Composite Slabs with Inverted Multi-Ribs. Appl. Sci. 2019, 9, 4946. [Google Scholar] [CrossRef] [Green Version]
  29. PCI Concrete Handbook Committee. PCI Design Handbook: Precast and Prestressed Concrete (MNL-120-17); Prestressed Concrete Institute: Chicago, IL, USA, 2017. [Google Scholar]
  30. Kim, M.-K.; Hong, S.-G.; Lee, J.-M.; Cho, Y.-H. Effect of the spandrel end beams on shear strength behavior in MTS systems. In Proceedings of the Korea Concrete Institute Conference; Korea Concrete Institute: Seoul, Korea, 2008; pp. 189–192. [Google Scholar]
  31. Wight, J.K.; MacGregor, J.G. Reinforced Concrete Mechanics and Design; Pearson Education, Inc.: Upper Saddle River, NJ, USA, 2012. [Google Scholar]
  32. Demir, A.; Caglar, N.; Ozturk, H.; Sumer, Y. Nonlinear finite element study on the improvement of shear capacity in reinforced concrete T-Section beams by an alternative diagonal shear reinforcement. Eng. Struct. 2016, 120, 158–165. [Google Scholar] [CrossRef]
  33. Karayannis, C.G.; Chalioris, C.E. Shear tests of reinforced concrete beams with continuous rectangular spiral reinforcement. Constr. Build. Mater. 2013, 46, 86–97. [Google Scholar] [CrossRef]
  34. Karayannis, C.; Chalioris, C.; Mavroeidis, P. Shear capacity of RC rectangular beams with continuous spiral transversal reinforcement. Wit Trans. Model. Simul. 2005, 41, 379–386. [Google Scholar]
  35. ASTM International. Standard Test. Method for Compressive Strength of Cylindrical Concrete Specimens: ASTM C39/C39M-20; ASTM International: West Conshohocken, PA, USA, 2020; p. 8. [Google Scholar]
  36. ASTM International. Standard Test. Methods for Tension Testing of Metallic Materials: ASTM E8/E8M–16; ASTM International: West Conshohocken, PA, USA, 2016; p. 30. [Google Scholar]
  37. ACI Committee 374. Guide for Testing Reinforced Concrete Structural Elements under Slowly Applied Simulated Seismic Loads: ACI 374.2R-13; American Concrete Institute: Farmington Hills, MI, USA, 2013; p. 18. [Google Scholar]
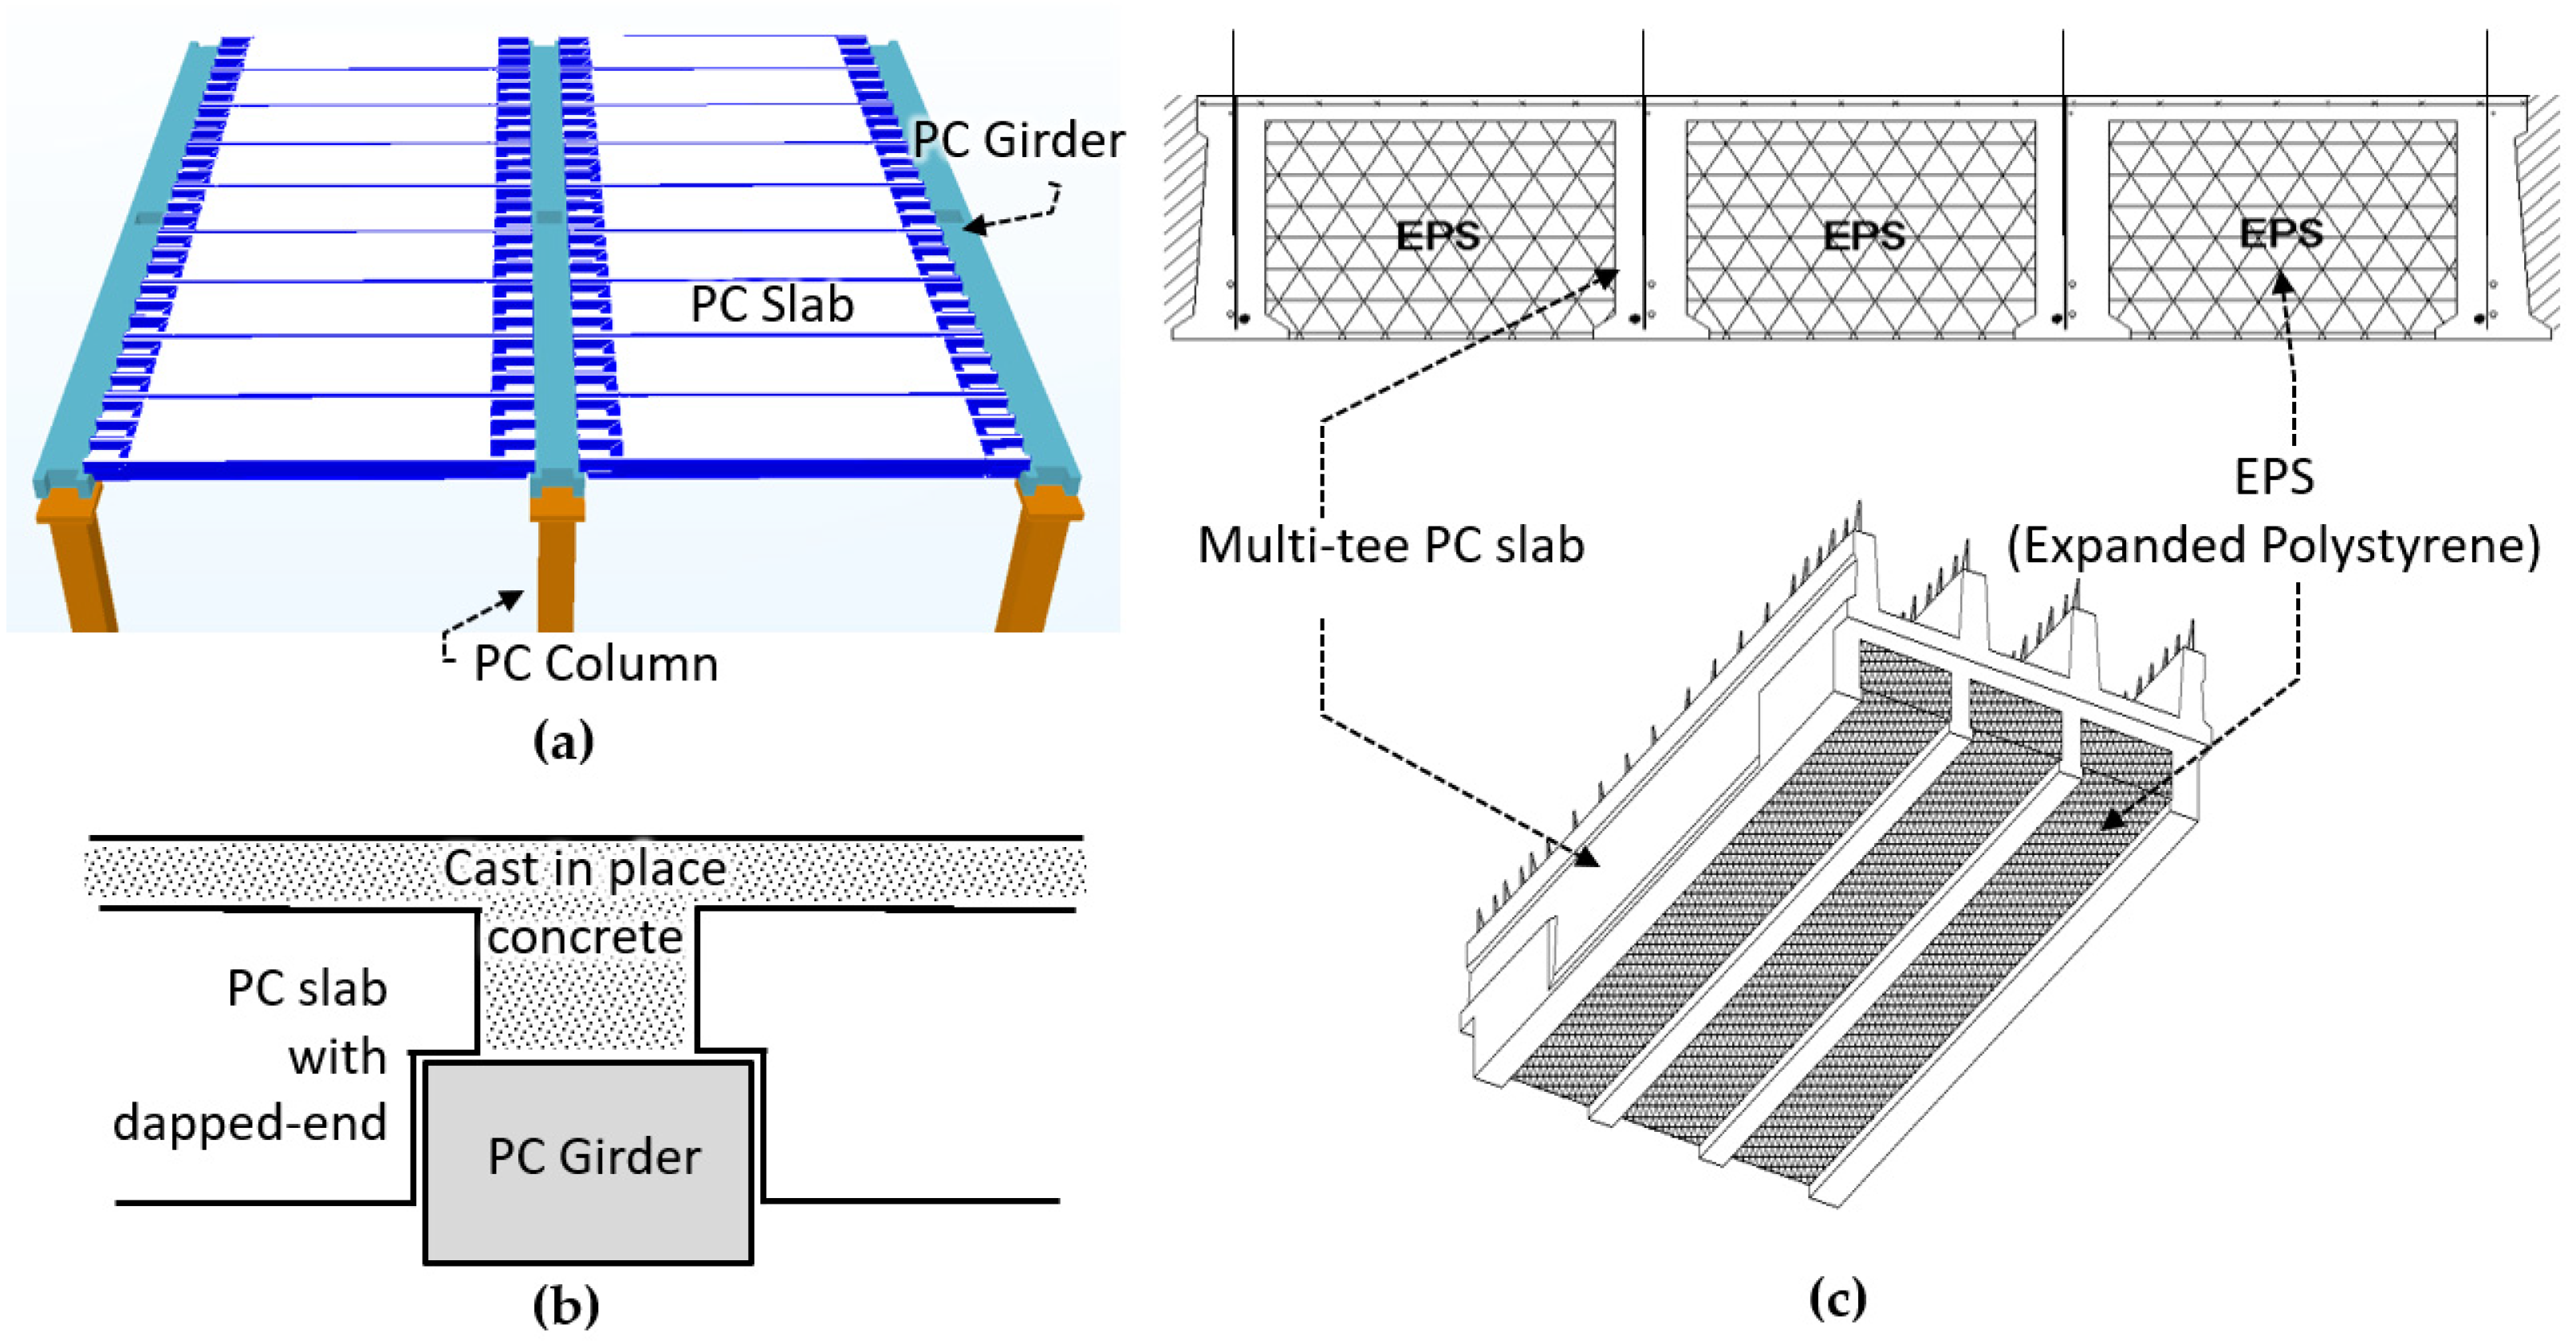
Figure 1. One-way precast concrete (PC) slab with insulating materials. (a) Construction of a PC frame with a one-way PC slab. (b) PC slab with a dapped end. (c) Multi-tee PC slab with expanded polystyrene (EPS).
Applsci 11 01693 g001
Figure 2. Structural design of dapped end of the PC slab. (a) Crack pattern at the dapped end. (b) Strut–tie model for the dapped end. (c) Shear reinforcement for the dapped end.
Applsci 11 01693 g002
Figure 3. Proposed shear reinforcement for the dapped end of the PC slab. (a) Existing Z-type shear reinforcement. (b) Proposed clip-type shear reinforcement.
Applsci 11 01693 g003
Figure 4. Specimen details: (a) plan; (b) sections (ZS-12.8); (c) sectional reinforcement (ZS-12.8); and (d) reinforcement detail of the dapped end (Region ‘A’) (units in mm).
Applsci 11 01693 g004aApplsci 11 01693 g004b
Figure 5. Loading and support conditions of the PC slabs under the (a) service stage (fixed support) and (b) construction stage (simple support).
Applsci 11 01693 g005
Figure 6. Test setup (units in mm).
Applsci 11 01693 g006
Figure 7. Load–deflection relationships of the specimens: (a) ZS-12.8, (b) CS-12.8, and (c) CS-6.4.
Applsci 11 01693 g007
Figure 8. Failure modes of the specimens: (a) ZS-12.8, (b) CS-12.8, and (c) CS-6.4.
Applsci 11 01693 g008
Figure 9. Deformed shape of Specimen ZS-12.8 under loading.
Applsci 11 01693 g009
Figure 10. Flexural strain of ZS-12.8 under the following loadings: (a) strand at the slab’s center; (b) rebar at the slab’s center; (c) strand at the slab’s corner; and (d) rebar at the slab’s corner.
Applsci 11 01693 g010
Figure 11. Damage at the dapped ends of Specimens (a) ZS-12.8, (b) CS-12.8, and (c) CS-6.4.
Applsci 11 01693 g011
Figure 12. Strains for Z-type and clip-type shear reinforcement under loading.
Applsci 11 01693 g012
Table 1. Test parameters of the specimens.
SpecimenShear Reinforcement for the Dapped EndShear-to-Span Ratio (= a/d) 1
ZS-12.8Z-type reinforcement12.8 (4610/360)
CS-12.8Clip-type reinforcement12.8 (4610/360)
CS-6.4Clip-type reinforcement6.4 (2320/360)
1a = length from the loading point to the support (mm), and d = effective depth of the slab (mm).
Table 2. Comparison of the predicted and tested strengths of the specimens.
Specimenfc
(MPa)
Predicted StrengthExpected
Maximum Load
Test Results
Flexural YieldingShear at PC SlabShear at Dapped End
Mn
(1)
(kN·m)
Pm
(2)
(kN)
Vc
(3)
(kN)
Pv-cent
(4)
(kN)
Vc-dap
(5)
(kN)
Vn-dap
(6)
(kN)
Pv-dap(c)
(7)
(kN)
Pv-dap(n)
(8)
(kN)
Plower
(9)
(kN)
Pupper
(10)
(kN)
Ptest
(11)
(kN)
Failure Mode
(12)
Ptest/Pm
(13)
ZS-12.850.9613239182312111313169573169 1239 2291Flexure1.22
CS-12.859.06172411963401206911861329186 1241 2289Flexure1.20
CS-6.443.96085111703131036751801323180 1313 3715Flexure1.40
Mn and Pm are the flexural moment and corresponding load, respectively, at the flexural yielding at the slab center, Vc is the shear strength of the concrete in the slab, Pv-cent is the load applied to the PC slab center for a shear failure of the member, Vc-dap and Vn-dap are the shear strength at the dapped ends excluding and including the contribution of the shear reinforcement, respectively, Pv-dap(c) and Pv-dap(n) are the corresponding loads at the slab center for Vc-dap and Vn-dap, respectively, Plower is the smallest value among Pm, Pv-cent, and Pv-dap(c), Pupper is the smallest value among Pm, Pv-cent, and Pv-dap(n), and Ptest is the tested peak strength. 1 Shear failure at the dapped end. 2 Flexural yielding. 3 Shear failure at the PC slab.
Table 3. Concrete mixture proportions.
Nominal Strength
(MPa)
W/C (%)Unit Weight (kg/m3)
W 1C 2S 3G 4SP 5
4034.01604718299334.24
1 W = water. 2 C = concrete. 3 S = sand. 4 G = gravel. 5 SP = super plasticizers.
Table 4. Mechanical properties of the reinforcing bars (units in MPa).
TypeYield Strength fyTensile Strength fu
D10460.16570.50
D13531.57675.45
D16579.95755.43
Lattice bar589.97661.23
Strand Φ15.2 (1860 MPa)1733.691884.39
Table 5. Summary of test results.
SpecimenLoad (kN)Drift Ratio (%)Ductility
δuy
Secant Stiffness (kN/mm)Mean Value of Normalized Strain in
Z-Type or Clip-Type Shear Reinforcement 1 (ε/εy)
At PyAt PtestAt Pu
PyPtestPuδyδtestδuKiKyZ1 or C1 2C2 3Z1 or C1 2C2 3Z1 or C1 2C2 3
ZS-12.82182912251.494.184.933.297.103.250.012-0.024-0.027-
CS-12.82162892141.564.214.953.176.863.090.0400.0830.0730.1310.0980.154
CS-6.45367155380.521.205.955.7337.7523.030.3270.4770.5200.6110.5800.704
Py is the yield load, calculated similar to Section 4.7 of ACI 374.2R-13 [37], Ptest is the measured maximum load, Pu is the load at failure or end of the test, δy is the yield drift ratio at Py, δtest is the drift ratio at Ptest, δu is the ultimate drift ratio at Pu, Ki is the initial secant stiffness at 0.35% drift, and Ky is the secant stiffness at the yield drift δy (=Py/δy). 1 The mean value of the strains in Z-type or clip-type shear reinforcement at the center and corner of the slab was used. The strain was normalized by the yield strain of the rebars (εy = 0.002383). 2,3 C1 and C2 are the strain of clip-type shear reinforcement, measured further away from and closer to the loading point, respectively.
Publisher’s Note: MDPI stays neutral with regard to jurisdictional claims in published maps and institutional affiliations.