
Experimental Analysis of Plantar Fascia Mechanical Properties in Subjects with Foot Pathologies


Abstract
1. Introduction
2. Materials and Methods
2.1. Subjects
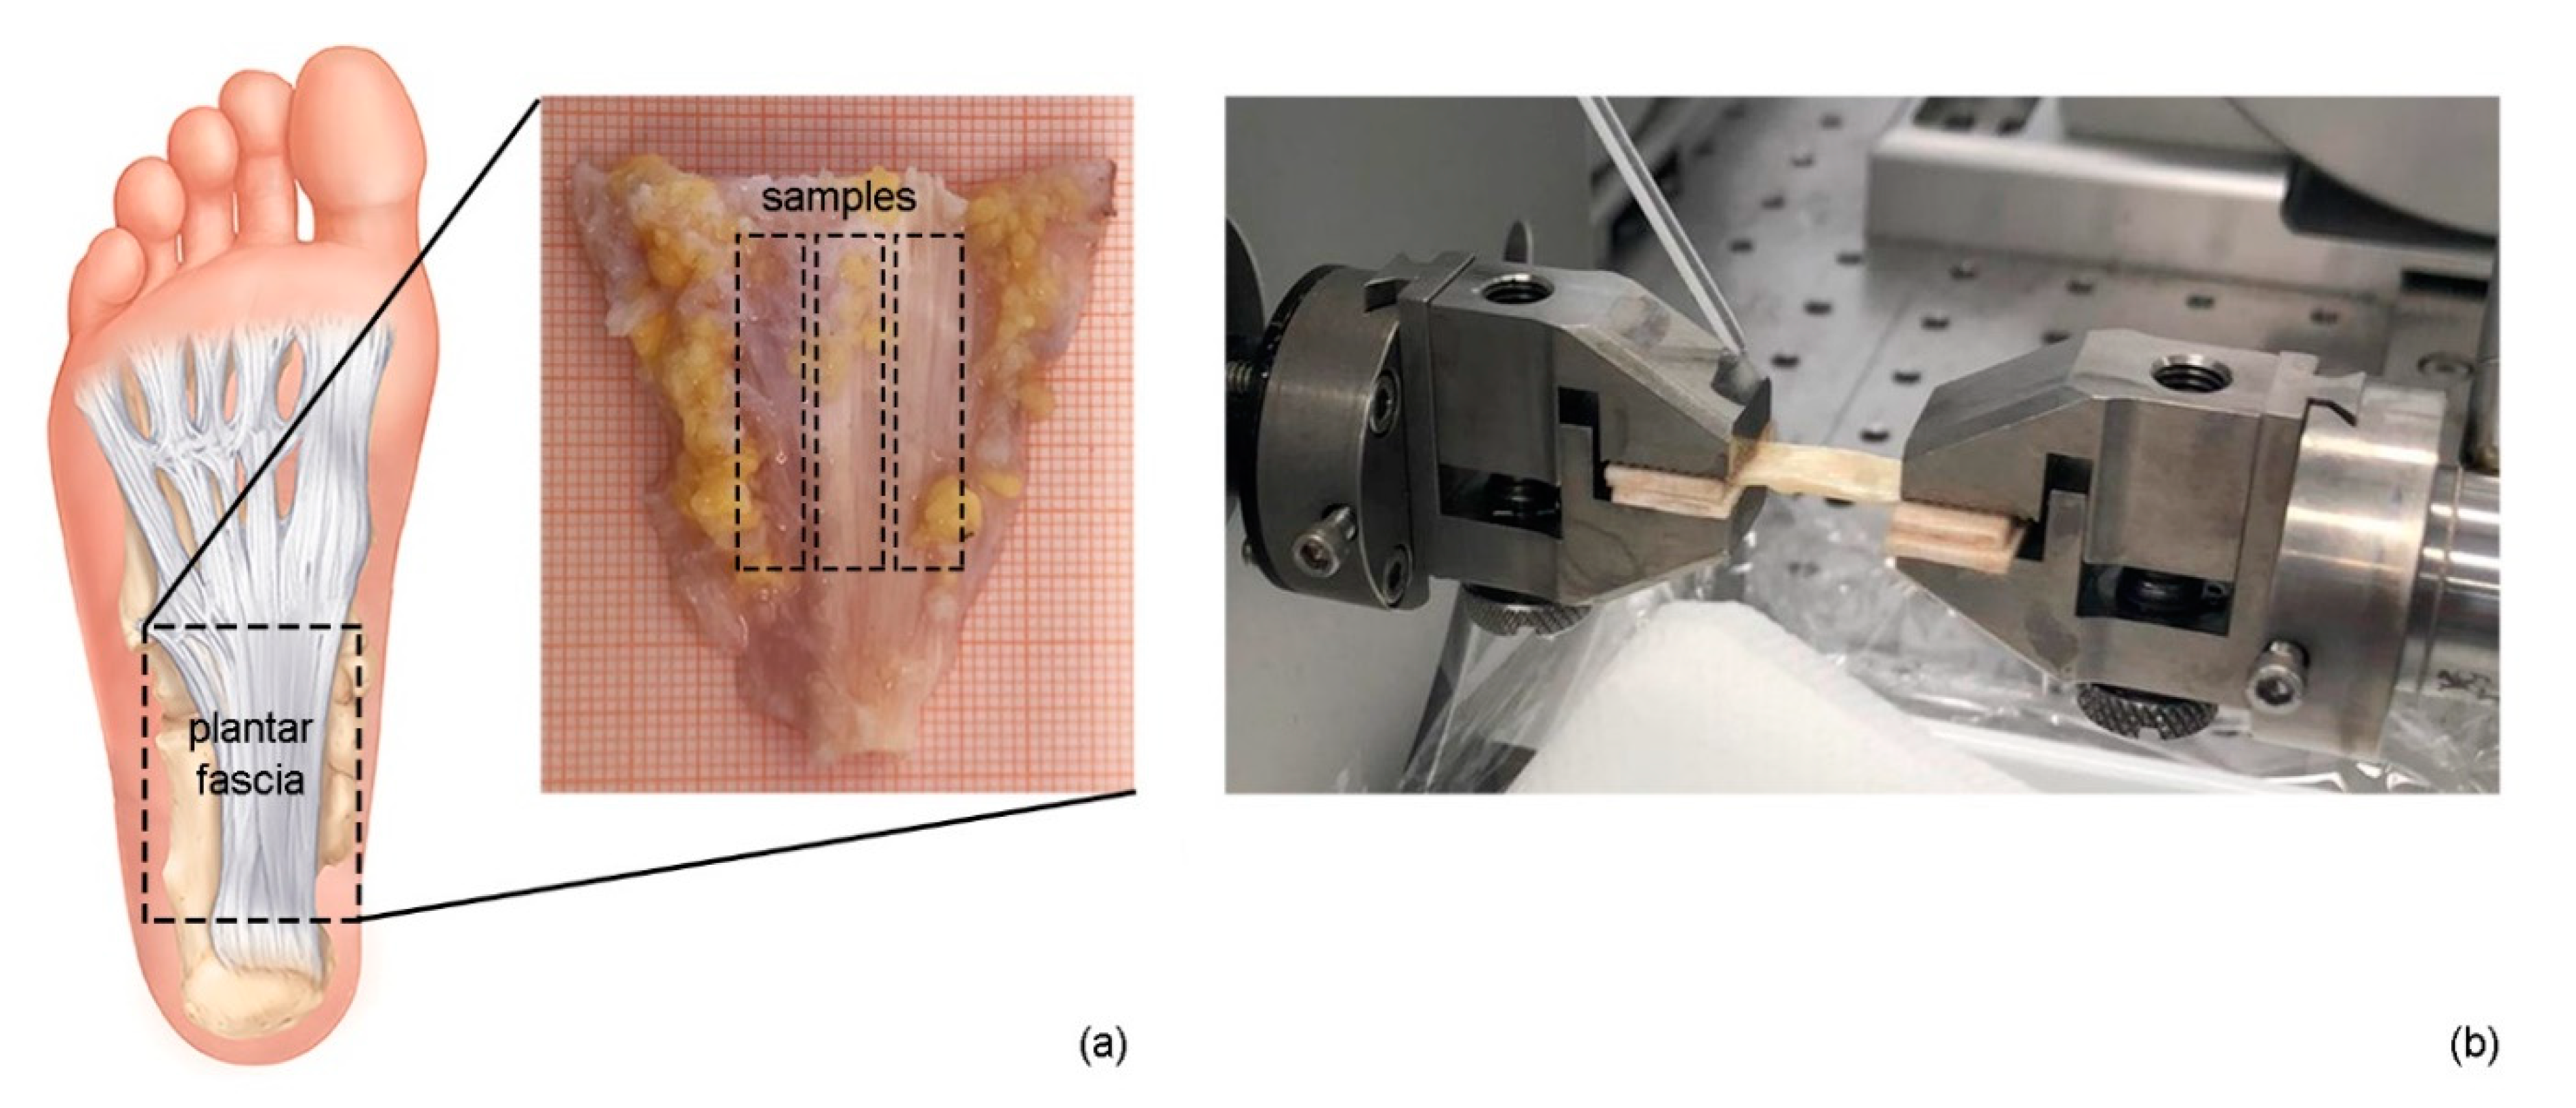
2.2. Dissection and Treatment of Samples
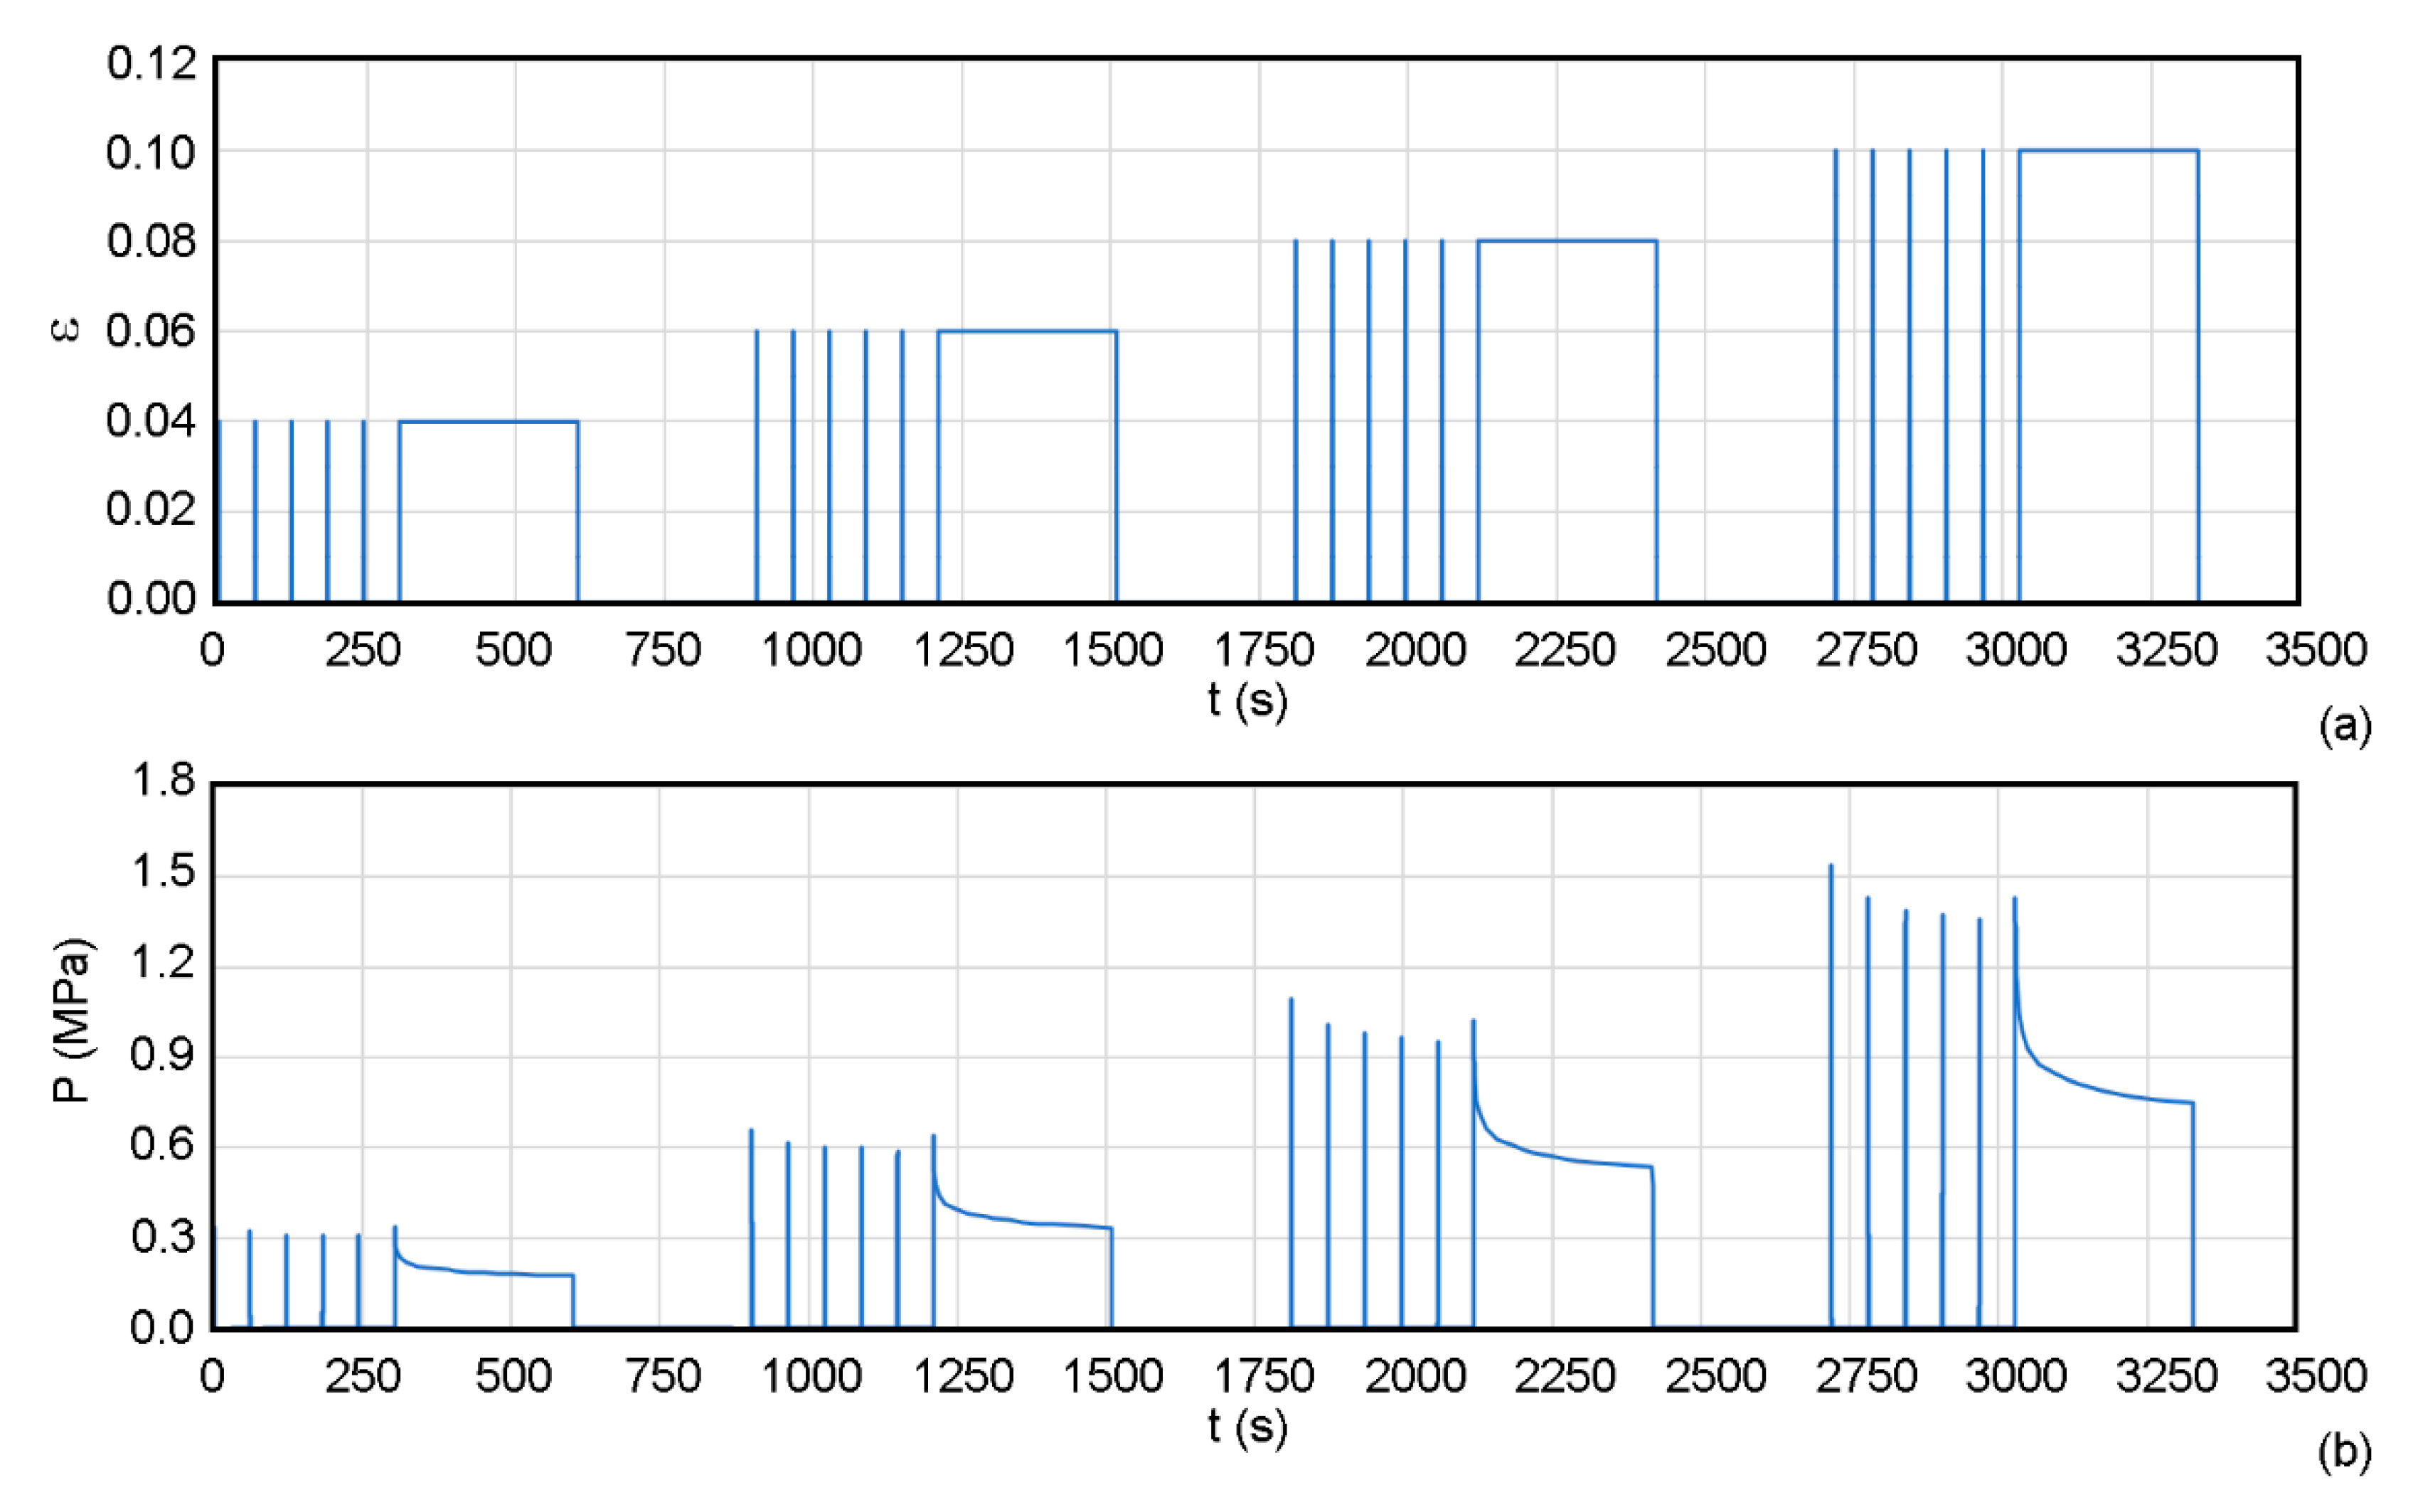
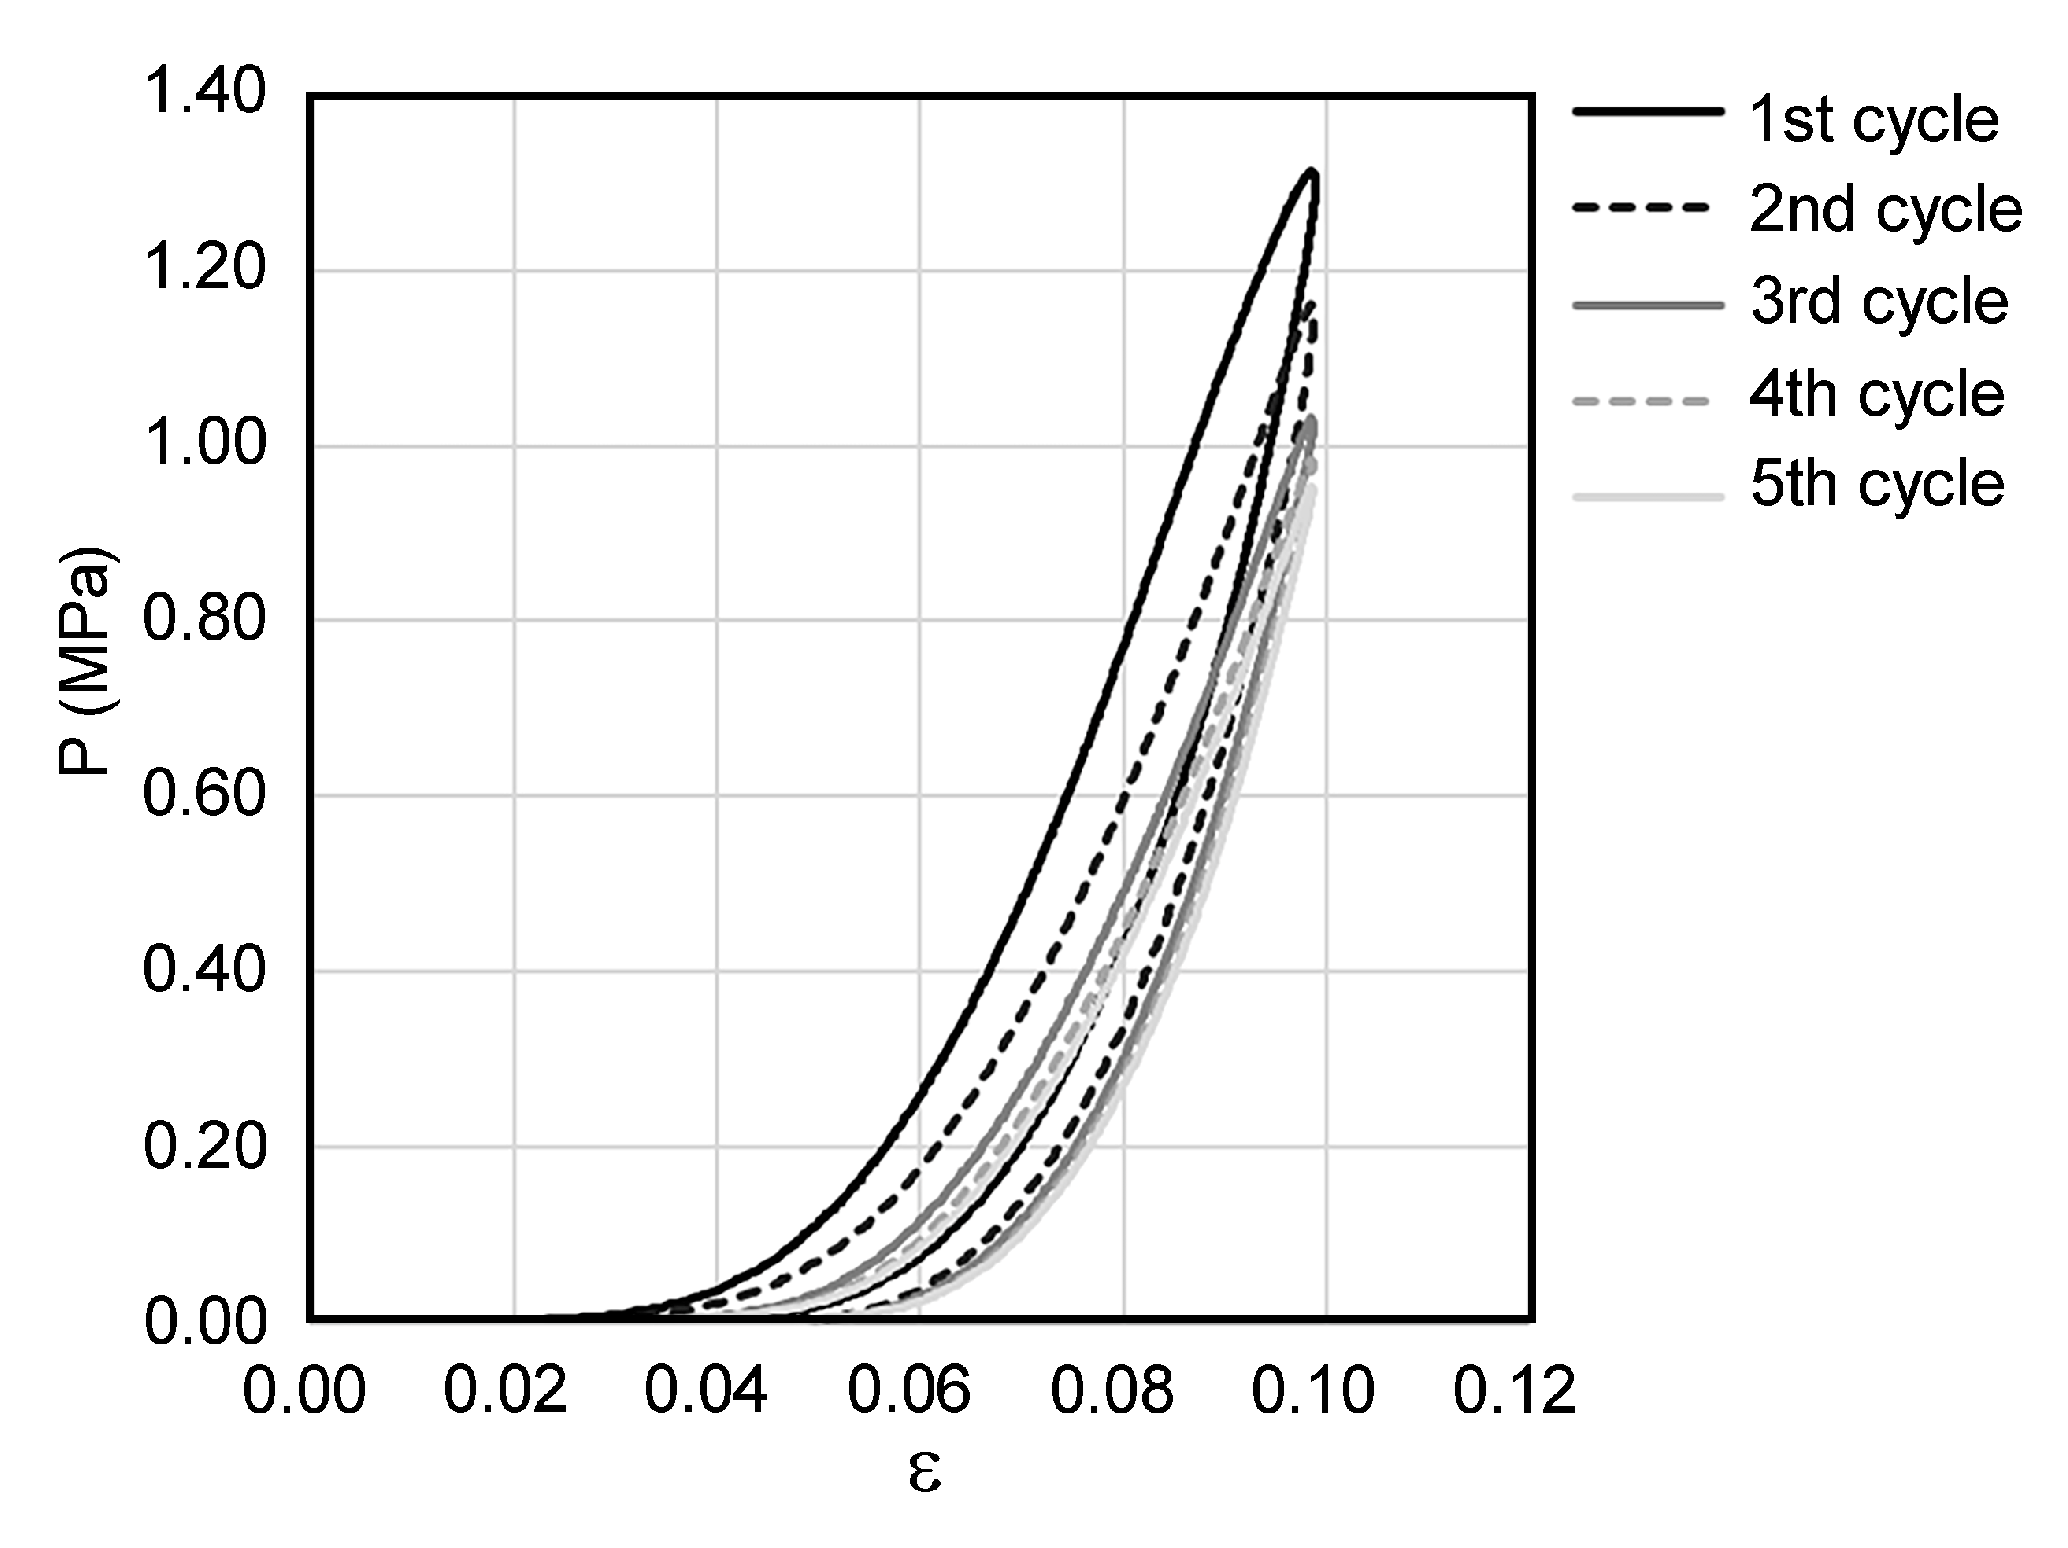
2.3. Mechanical Testing
2.4. Statistical Analysis
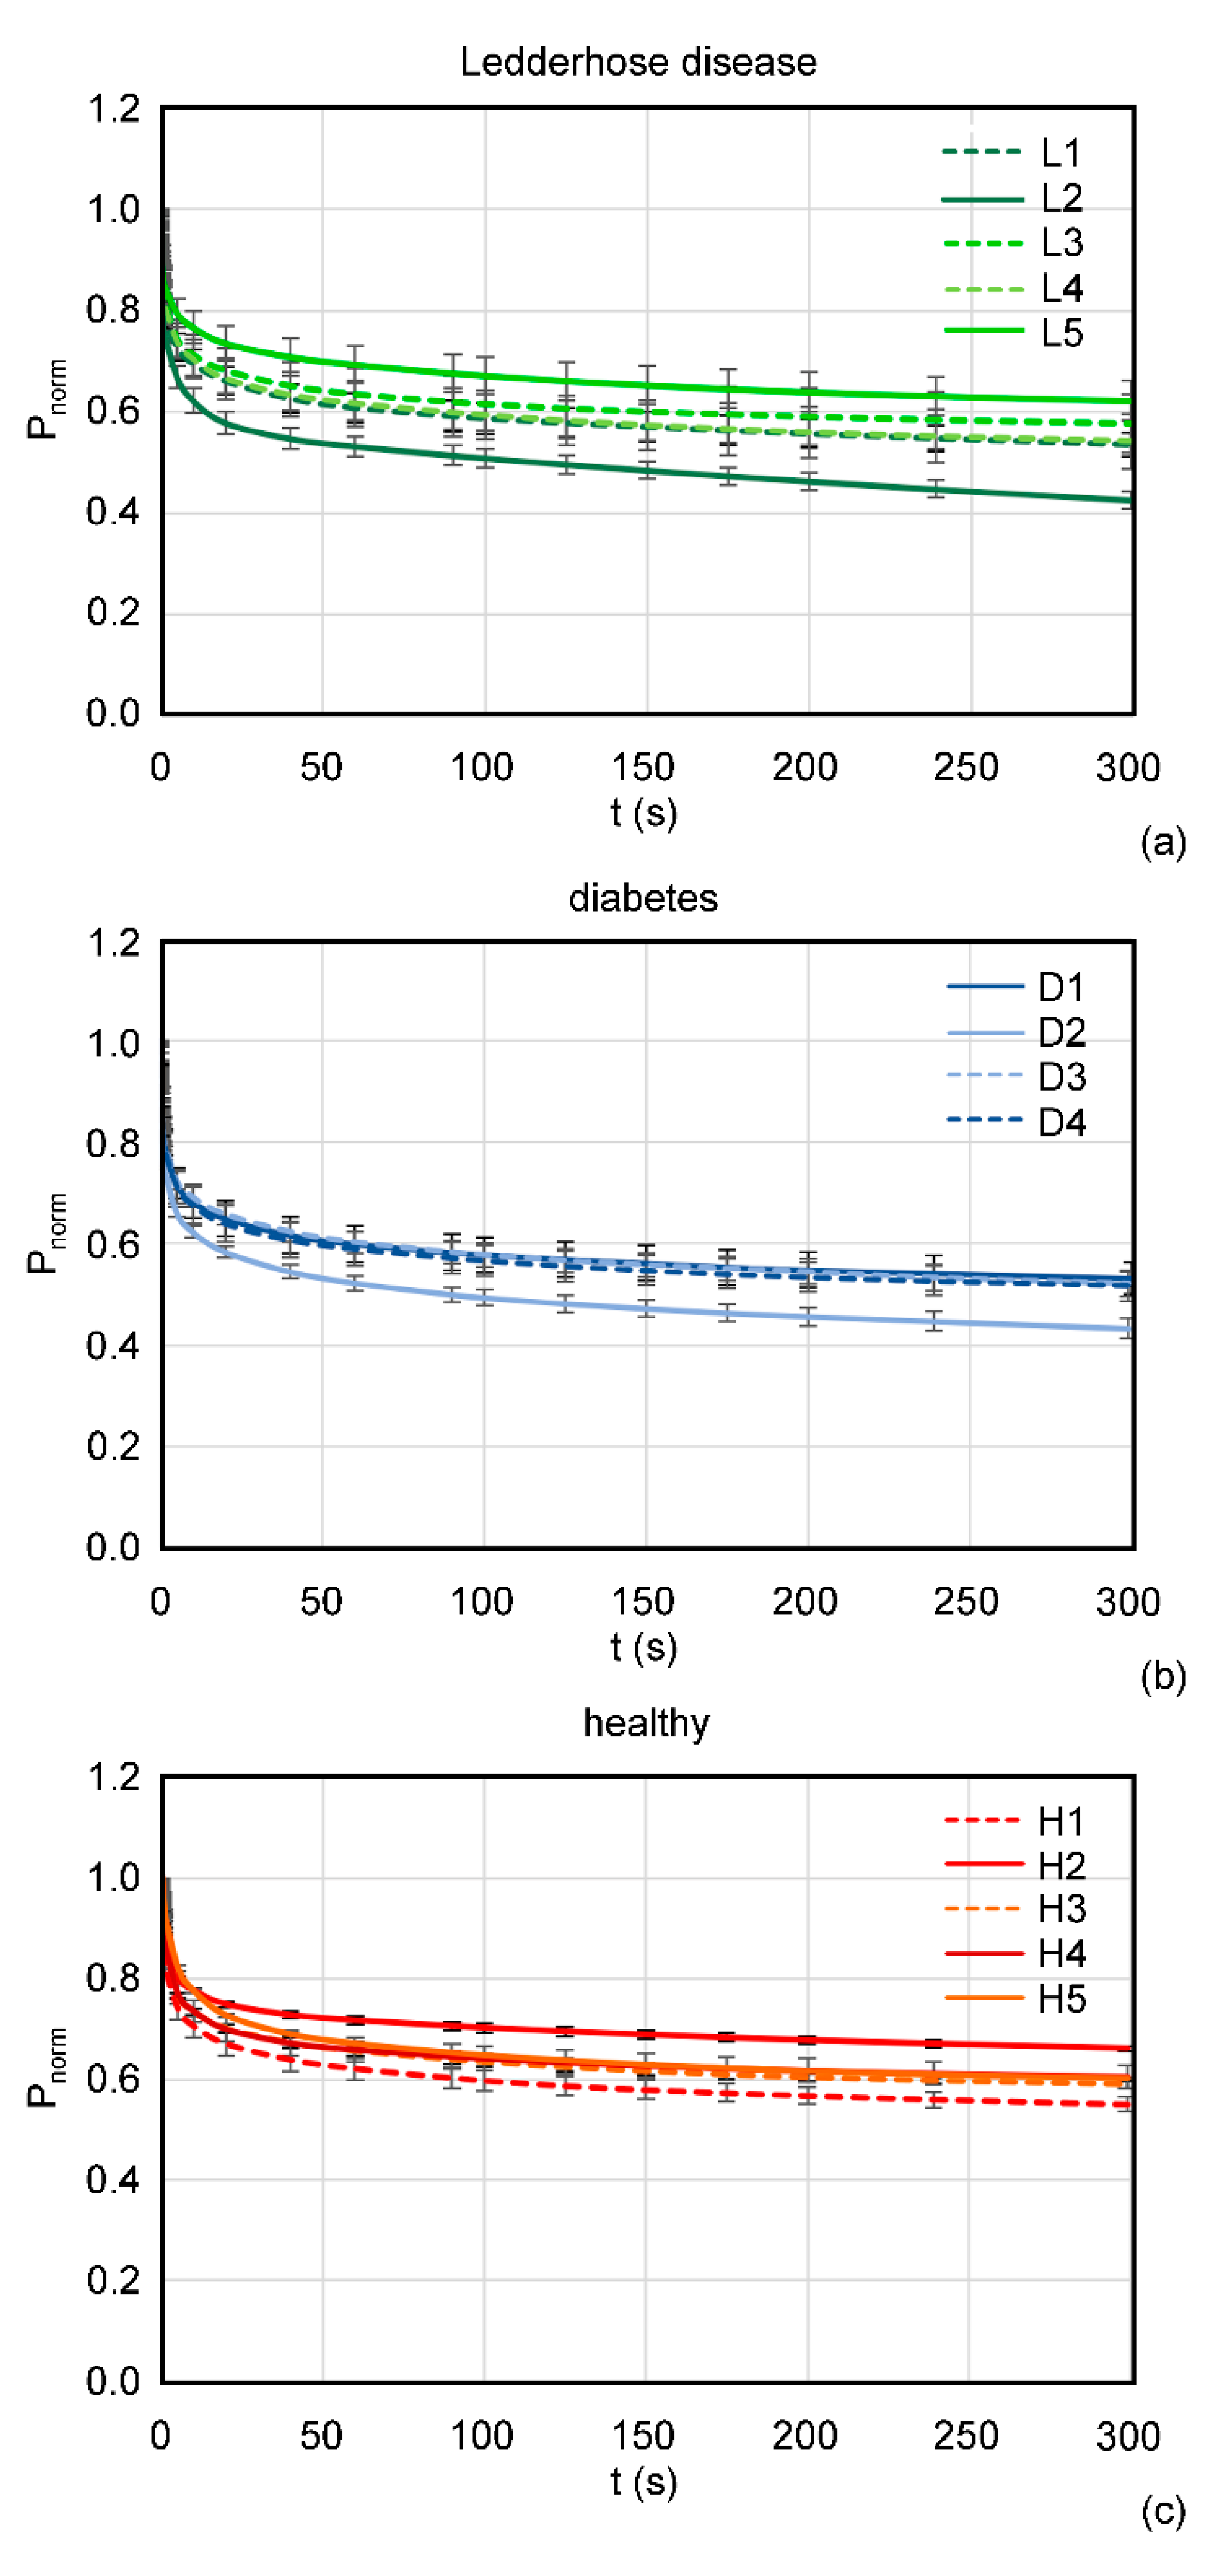
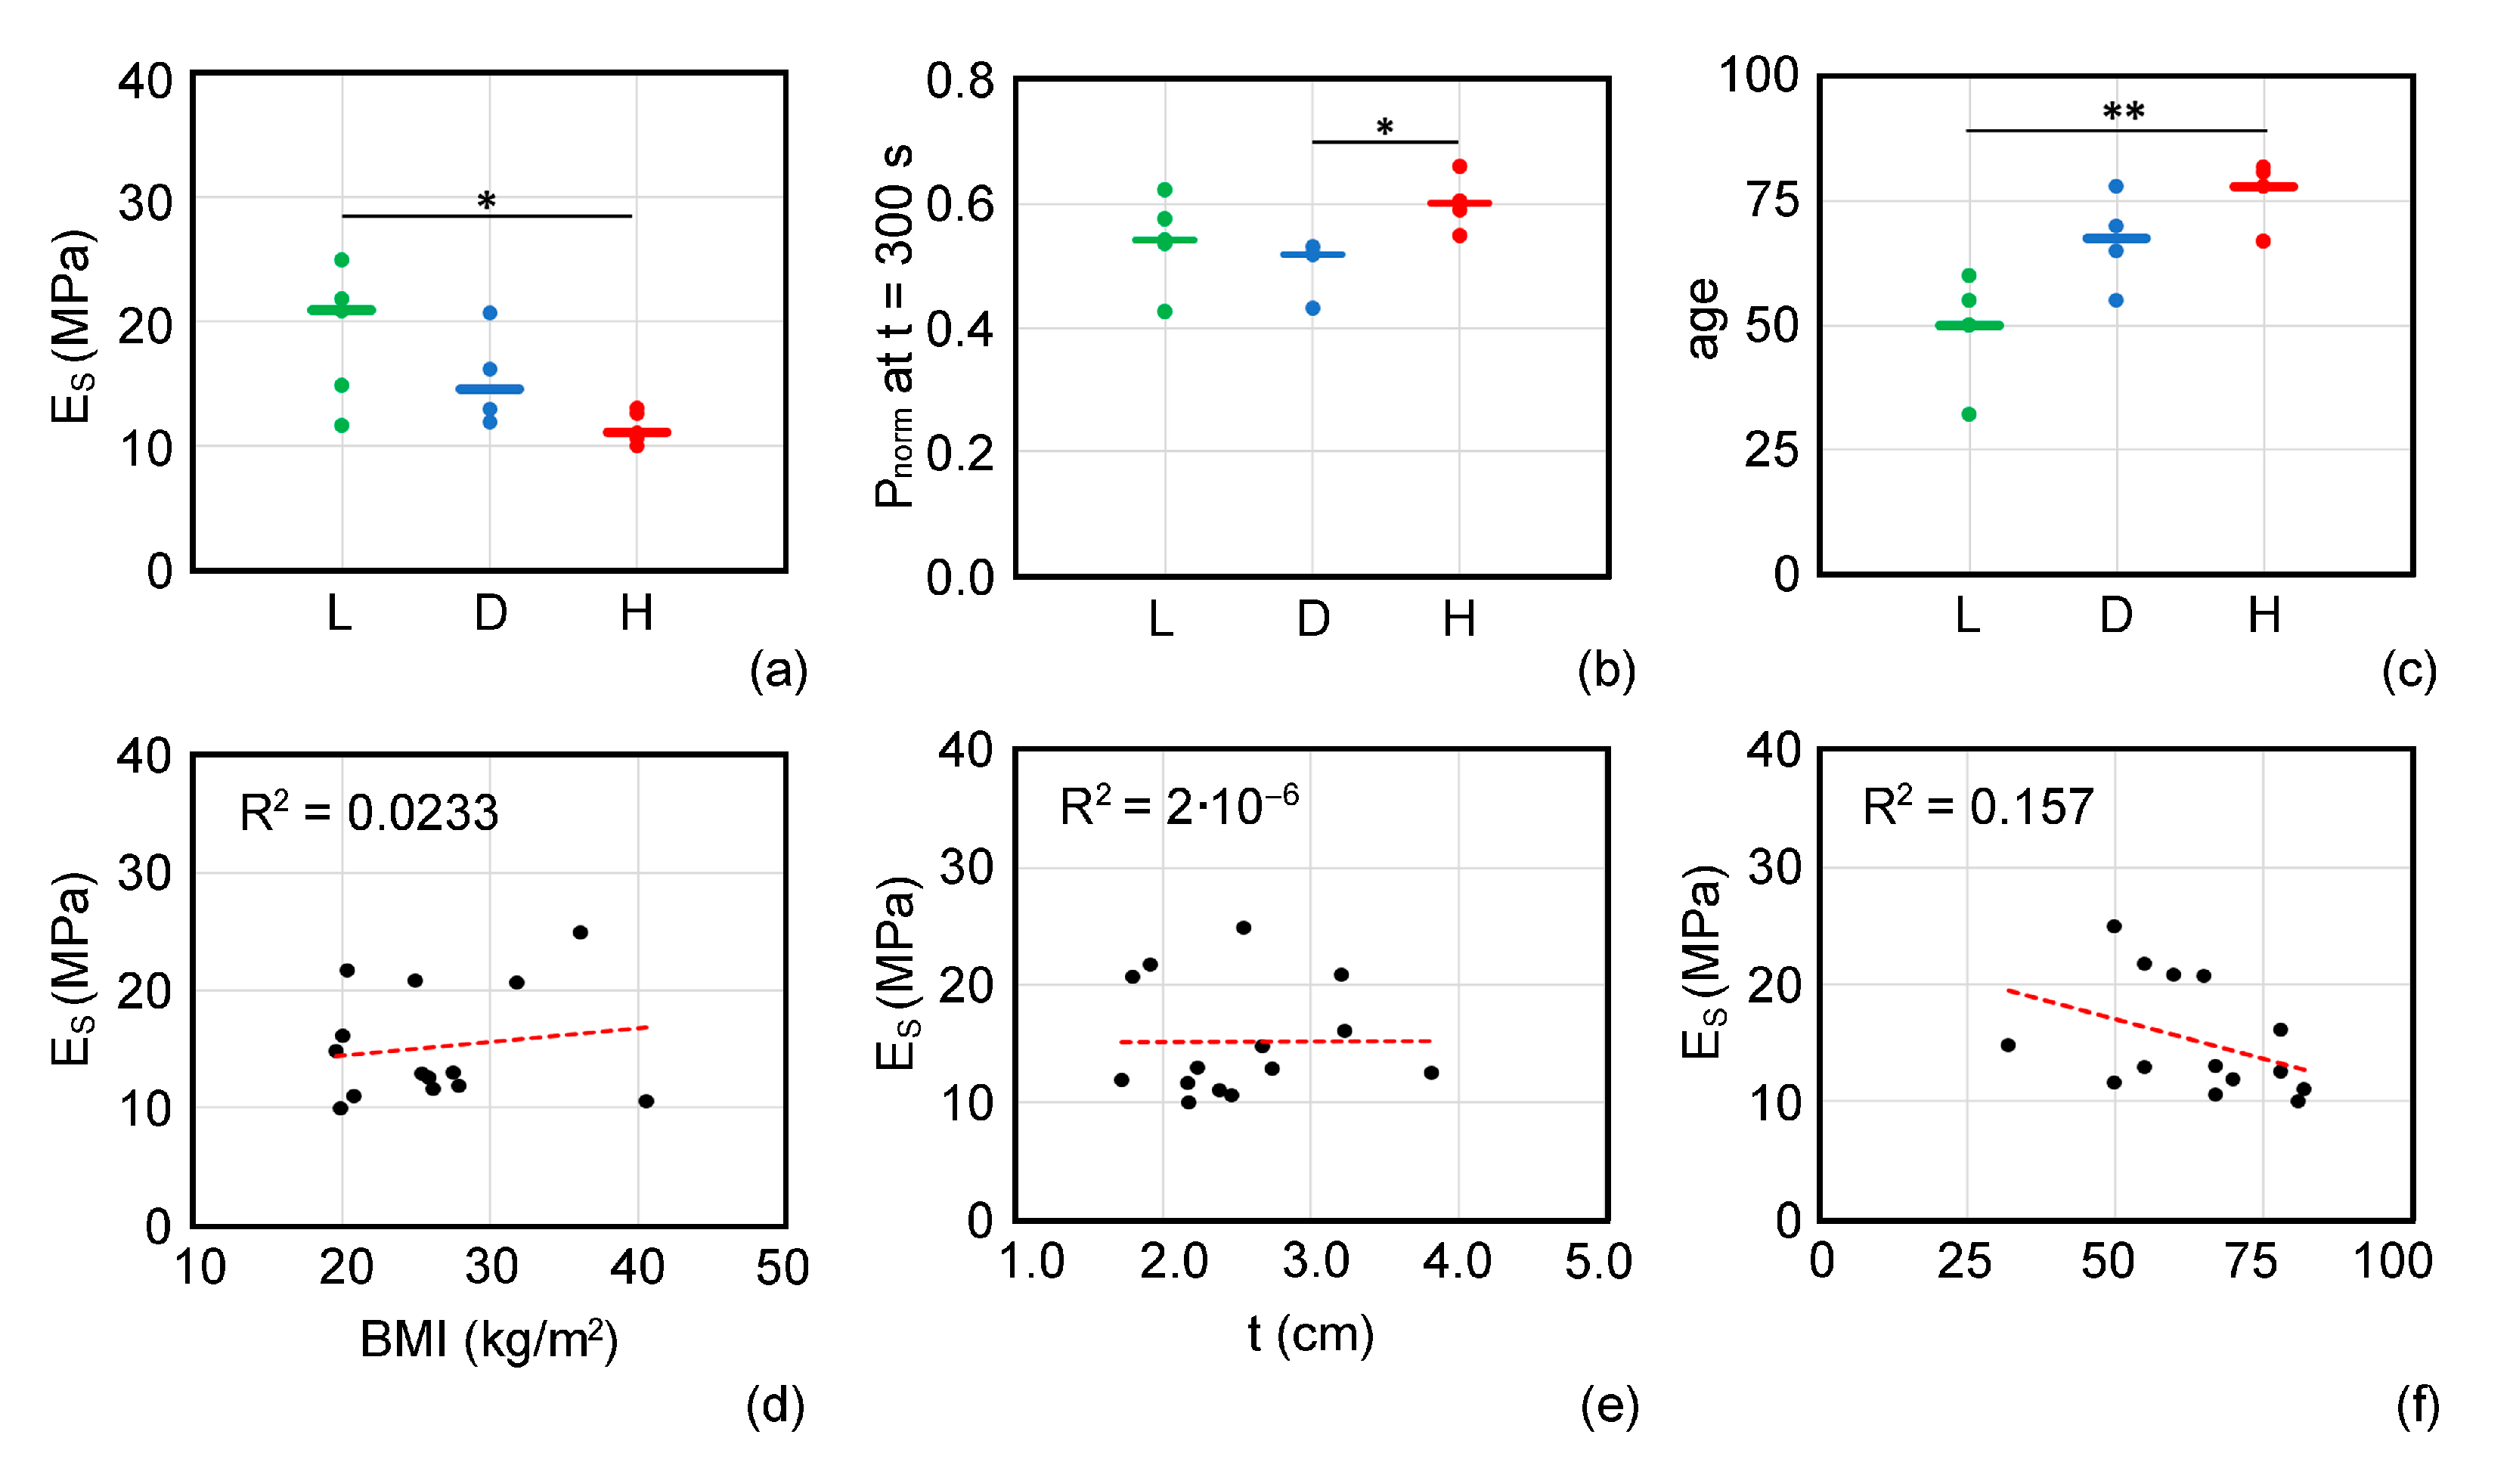
3. Results
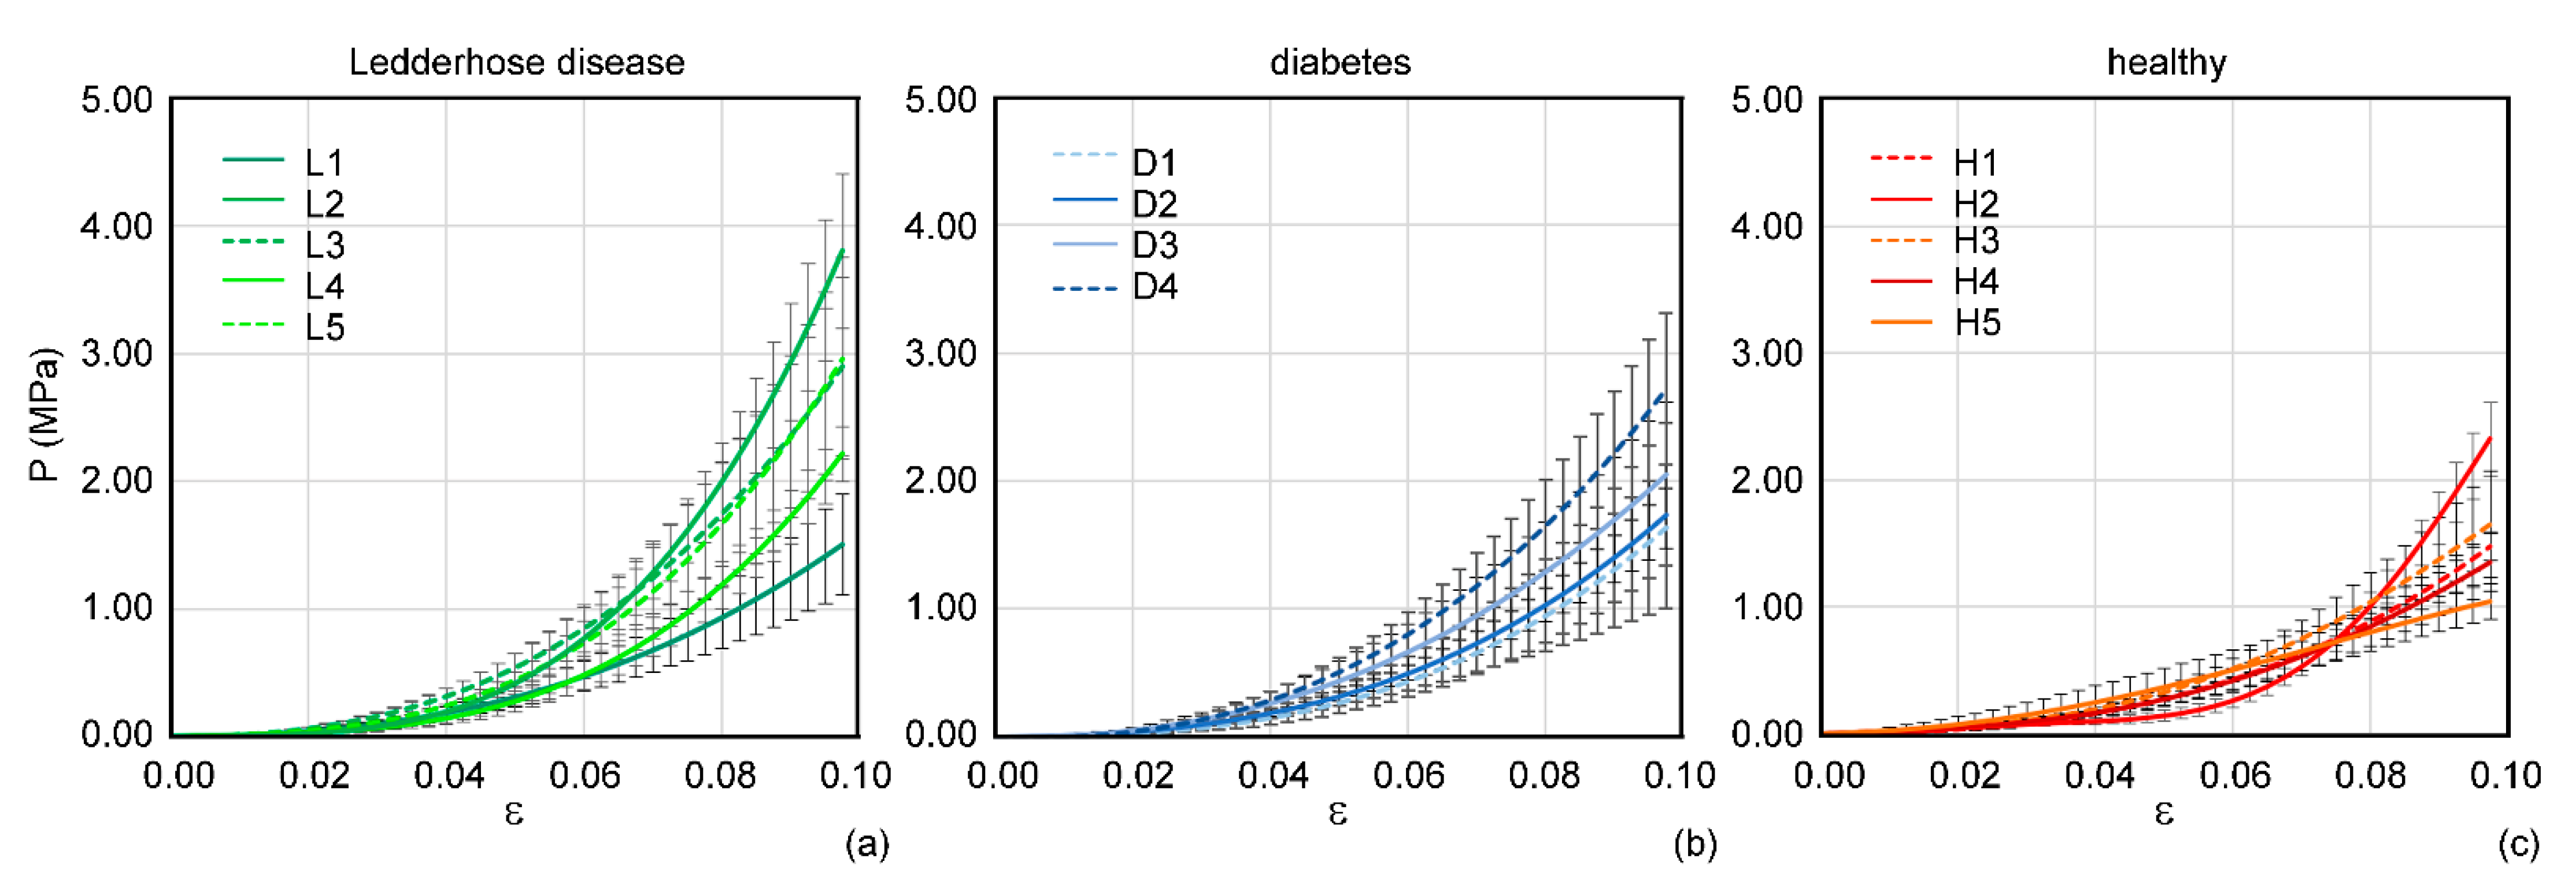
4. Discussion
5. Conclusions
Author Contributions
Funding
Institutional Review Board Statement
Informed Consent Statement
Data Availability Statement
Conflicts of Interest
References
- Stecco, C.; Fede, C.; Macchi, V.; Porzionato, A.; Petrelli, L.; Biz, C.; Stern, R.; De Caro, R. The fasciacytes: A new cell devoted to fascial gliding regulation. Clin. Anat. 2018, 31, 667–676. [Google Scholar] [CrossRef]
- Stecco, C.; Corradin, M.; Macchi, V.; Morra, A.; Porzionato, A.; Biz, C.; De Caro, R. Plantar fascia anatomy and its relationship with Achilles tendon and paratendon. J. Anat. 2013, 223, 665–676. [Google Scholar] [CrossRef]
- Zwirner, J.; Zhang, M.; Ondruschka, B.; Akita, K.; Hammer, N. An ossifying bridge—On the structural continuity between the Achilles tendon and the plantar fascia. Sci. Rep. 2020, 10, 14523. [Google Scholar] [CrossRef]
- Bolgla, L.A.; Malone, T.R. Plantar fasciitis and the windlass mechanism: A biomechanical link to clinical practice. J. Athl. Train. 2004, 39, 77–82. [Google Scholar]
- Cheung, J.T.-M.; Zhang, M.; An, K.-N. Effects of plantar fascia stiffness on the biomechanical responses of the ankle–foot complex. Clin. Biomech. 2004, 19, 839–846. [Google Scholar] [CrossRef] [PubMed]
- Monk, A.; Van Oldenrijk, J.; Riley, N.D.; Gill, R.H.; Murray, D. Biomechanics of the lower limb. Surgery 2016, 34, 427–435. [Google Scholar] [CrossRef]
- Natali, A.N.; Pavan, P.G.; Stecco, C. A constitutive model for the mechanical characterization of the plantar fascia. Connect. Tissue Res. 2010, 51, 337–346. [Google Scholar] [CrossRef]
- Pavan, P.G.; Pachera, P.; Stecco, C.; Natali, A.N. Constitutive Modeling of Time-Dependent Response of Human Plantar Aponeurosis. Comput. Math. Methods Med. 2014, 2014, 530242. [Google Scholar] [CrossRef]
- Lemont, H.; Ammirati, K.M.; Usen, N. Plantar fasciitis: A degenerative process (fasciosis) without inflammation. J. Am. Podiatr. Med. Assoc. 2003, 93, 234–237. [Google Scholar] [CrossRef] [PubMed]
- Bartold, S.J. The plantar fascia as a source of pain—biomechanics, presentation and treatment. J. Bodyw. Mov. Ther. 2004, 8, 214–226. [Google Scholar] [CrossRef]
- Muñoz, J.P.; González, M.A.G.; García, J.C.C.; Nova, A.M. Relationship of the foot posture with the most frequent injuries in athletes. A pilot study. Arch. Med. Deport. 2015, 32, 76–81. [Google Scholar]
- García-Gil, M.F.; Biosca, V.L. Plantar fibromatosis or Ledderhose disease: Diagnosis with ultrasonography. Radiología 2020, 62, 415–416. [Google Scholar] [CrossRef] [PubMed]
- Young, J.R.; Sternbach, S.; Willinger, M.; Hutchinson, I.D.; Rosenbaum, A.J. The etiology, evaluation, and management of plantar fibromatosis. Orthop. Res. Rev. 2018, 11, 1–7. [Google Scholar] [CrossRef]
- Carroll, P.; Henshaw, R.M.; Garwood, C.; Raspovic, K.; Kumar, D. Plantar Fibromatosis: Pathophysiology, Surgical and Nonsurgical Therapies: An Evidence-Based Review. Foot Ankle Spéc. 2018, 11, 168–176. [Google Scholar] [CrossRef]
- Fuiano, M.; Mosca, M.; Caravelli, S.; Massimi, S.; Benedetti, M.G.; Di Caprio, F.; Mosca, S.; Zaffagnini, S. Current concepts about treatment options of plantar fibromatosis: A systematic review of the literature. Foot Ankle Surg. 2019, 25, 559–564. [Google Scholar] [CrossRef]
- Macgilchrist, C.; Paul, L.; Ellis, B.M.; Howe, T.E.; Kennon, B.; Godwin, J. Lower-limb risk factors for falls in people with diabetes mellitus. Diabet. Med. 2010, 27, 162–168. [Google Scholar] [CrossRef] [PubMed]
- Paola, L.D.; Carone, A.; Vasilache, L.; Pattavina, M. Overview on diabetic foot: A dangerous, but still orphan, disease. Eur. Heart J. Suppl. 2015, 17, A64–A68. [Google Scholar] [CrossRef][Green Version]
- Whiting, D.R.; Guariguata, L.; Weil, C.; Shaw, J. IDF Diabetes Atlas: Global estimates of the prevalence of diabetes for 2011 and 2030. Diabetes Res. Clin. Pr. 2011, 94, 311–321. [Google Scholar] [CrossRef]
- Arts, M.L.J.; De Haart, M.; Waaijman, R.; Dahmen, R.; Berendsen, H.; Nollet, F.; Bus, S.A. Data-driven directions for effective footwear provision for the high-risk diabetic foot. Diabet. Med. 2015, 32, 790–797. [Google Scholar] [CrossRef]
- Biz, C.; Gastaldo, S.; Dalmau-Pastor, M.; Corradin, M.; Volpin, A.; Ruggieri, P. Minimally Invasive Distal Metatarsal Diaphyseal Osteotomy (DMDO) for Chronic Plantar Diabetic Foot Ulcers. Foot Ankle Int. 2018, 39, 83–92. [Google Scholar] [CrossRef]
- Giacomozzi, C.; D’Ambrogi, E.; Uccioli, L.; Macellari, V. Does the thickening of Achilles tendon and plantar fascia contribute to the alteration of diabetic foot loading? Clin. Biomech. 2005, 20, 532–539. [Google Scholar] [CrossRef] [PubMed]
- Guo, J.; Liu, X.; Ding, X.; Wang, L.; Fan, Y. Biomechanical and mechanical behavior of the plantar fascia in macro and micro structures. J. Biomech. 2018, 76, 160–166. [Google Scholar] [CrossRef] [PubMed]
- Fausto de Souza, D.; Micaelo, L.; Cuzzi, T.; Ramos-e-Silva, M. Ledderhose disease: An unusual presentation. J. Clin. Aesthet. Dermatol. 2010, 3, 45–47. [Google Scholar] [PubMed]
- Neagu, T.P.; Ţigliş, M.; Popescu, A.; Enache, V.; Popescu, Ş.A.; Lascăr, I. Clinical, histological and therapeutic modern approach of Ledderhose disease. Rom. J. Morphol. Embryol. 2018, 59, 691–697. [Google Scholar]
- Fabrikant, J.M.; Park, T.S. Plantar fasciitis (fasciosis) treatment outcome study: Plantar fascia thickness measured by ultrasound and correlated with patient self-reported improvement. Foot 2011, 21, 79–83. [Google Scholar] [CrossRef]
- Huerta, J.P.; García, J.M.A. Effect of gender, age and anthropometric variables on plantar fascia thickness at different locations in asymptomatic subjects. Eur. J. Radiol. 2007, 62, 449–453. [Google Scholar] [CrossRef]
- Taş, S. Effect of Gender on Mechanical Properties of the Plantar Fascia and Heel Fat Pad. Foot Ankle Spéc. 2018, 11, 403–409. [Google Scholar] [CrossRef]
- World Medical Association. World medical association declaration of Helsinki: Ethical principles for medical research involving human subjects. JAMA 2013, 310, 2191–2194. [Google Scholar] [CrossRef]
- Schneider, C.A.; Rasband, W.S.; Eliceiri, K.W. NIH Image to ImageJ: 25 years of image analysis. Nat. Methods 2012, 9, 671–675. [Google Scholar] [CrossRef]
- Carniel, E.L.; Albanese, A.; Fontanella, C.G.; Pavan, P.G.; Prevedello, L.; Salmaso, C.; Todros, S.; Toniolo, I.; Foletto, M. Biomechanics of stomach tissues and structure in patients with obesity. J. Mech. Behav. Biomed. Mater. 2020, 110, 103883. [Google Scholar] [CrossRef]
- Jiang, M.; Lawson, Z.T.; Erel, V.; Pervere, S.; Nan, T.; Robbins, A.B.; Feed, A.D.; Moreno, M.R.; Veysel, E. Clamping soft biologic tissues for uniaxial tensile testing: A brief survey of current methods and development of a novel clamping mechanism. J. Mech. Behav. Biomed. Mater. 2020, 103, 103503. [Google Scholar] [CrossRef]
- Todros, S.; Pianigiani, S.; De Cesare, N.; Pavan, P.G.; Natali, A.N. Marker Tracking for Local Strain Measurement in Mechanical Testing of Biomedical Materials. J. Med. Biol. Eng. 2018, 39, 764–772. [Google Scholar] [CrossRef]
- Menz, H.B. Biomechanics of the Ageing Foot and Ankle: A Mini-Review. Gerontology 2014, 61, 381–388. [Google Scholar] [CrossRef]
- Pavan, P.G.; Stecco, C.; Darwish, S.; Natali, A.N.; De Caro, R. Investigation of the mechanical properties of the plantar aponeurosis. Sur. Radiol. Anat. 2011, 33, 905–911. [Google Scholar] [CrossRef]
- Gefen, A. The in vivo elastic properties of the plantar fascia during the contact phase of walking. Foot Ankle Int. 2003, 24, 238–244. [Google Scholar] [CrossRef] [PubMed]
- Caravaggi, P.; Pataky, T.; Günther, M.; Savage, R.; Crompton, R. Dynamics of longitudinal arch support in relation to walking speed: Contribution of the plantar aponeurosis. J. Anat. 2010, 217, 254–261. [Google Scholar] [CrossRef] [PubMed]


| Pathologic | Healthy | |||||||||||||
|---|---|---|---|---|---|---|---|---|---|---|---|---|---|---|
| Ledderhose Disease | Diabetes | |||||||||||||
| subject ID code | L1 | L2 | L3 | L4 | L5 | D1 | D2 | D3 | D4 | H1 | H2 | H3 | H4 | H5 |
| sex | M | F | F | M | F | M | F | M | M | F | M | M | M | F |
| mass (kg) | 80 | 88 | 55 | 60 | 72 | 70 | 55 | 78 | 92 | 50 | 82 | 136 | 75 | 68 |
| height (cm) | 175 | 156 | 160 | 175 | 170 | 165 | 160 | 180 | 170 | 155 | 178 | 183 | 165 | 185 |
| BMI (kg/m2) | 26.1 | 36.2 | 21.5 | 19.6 | 24.9 | 25.7 | 21.5 | 24.1 | 31.8 | 20.8 | 25.9 | 40.6 | 27.5 | 19.9 |
| age (y) | 50 | 50 | 42 | 32 | 60 | 76 | 65 | 72 | 65 | 82 | 78 | 67 | 67 | 81 |
| ES (MPa) | ||||||||||||||
|---|---|---|---|---|---|---|---|---|---|---|---|---|---|---|
| Sample | L1 | L2 | L3 | L4 | L5 | D1 | D2 | D3 | D4 | H1 | H2 | H3 | H4 | H5 |
| #1 | 11.04 | 30.96 | 31.40 | 11.54 | 27.43 | 7.43 | 21.83 | 14.62 | 26.37 | 11.82 | 14.02 | 8.78 | 9.87 | 6.75 |
| #2 | 17.04 | 17.91 | 19.75 | 19.18 | 26.32 | 16.60 | 9.05 | 8.55 | 23.73 | 10.52 | 13.85 | 14.43 | 18.70 | 9.99 |
| #3 | 6.79 | 25.93 | 14.11 | 13.70 | 8.79 | 11.60 | 7.75 | 25.17 | 11.93 | 10.70 | 9.72 | 8.42 | 10.28 | 13.17 |
Publisher’s Note: MDPI stays neutral with regard to jurisdictional claims in published maps and institutional affiliations. |
© 2021 by the authors. Licensee MDPI, Basel, Switzerland. This article is an open access article distributed under the terms and conditions of the Creative Commons Attribution (CC BY) license (http://creativecommons.org/licenses/by/4.0/).
Share and Cite
Todros, S.; Biz, C.; Ruggieri, P.; Pavan, P.G. Experimental Analysis of Plantar Fascia Mechanical Properties in Subjects with Foot Pathologies. Appl. Sci. 2021, 11, 1517. https://doi.org/10.3390/app11041517
Todros S, Biz C, Ruggieri P, Pavan PG. Experimental Analysis of Plantar Fascia Mechanical Properties in Subjects with Foot Pathologies. Applied Sciences. 2021; 11(4):1517. https://doi.org/10.3390/app11041517
Chicago/Turabian StyleTodros, Silvia, Carlo Biz, Pietro Ruggieri, and Piero G. Pavan. 2021. "Experimental Analysis of Plantar Fascia Mechanical Properties in Subjects with Foot Pathologies" Applied Sciences 11, no. 4: 1517. https://doi.org/10.3390/app11041517
APA StyleTodros, S., Biz, C., Ruggieri, P., & Pavan, P. G. (2021). Experimental Analysis of Plantar Fascia Mechanical Properties in Subjects with Foot Pathologies. Applied Sciences, 11(4), 1517. https://doi.org/10.3390/app11041517