Abstract
An increasing number of industrial plants integrate the anaerobic digestion (AD) of the organic fraction of municipal solid waste (OFMSW) with a subsequent composting phase. To improve the plant productivity, a fraction of OFMSW digestate can be converted into a carbonaceous material, called hydrocar (HC), through Hydrothermal Carbonization (HTC), and then composted together with the OFMSW digestate itself, to produce “hydrochar co-compost”. The aim of this paper is to present the design and assembly of batch bioreactors, built in-house to investigate the co-composting process of OFMSW digestate and its HC, and to provide some preliminary results. The OFMSW digestate from an industrial plant was carbonized at 200 °C for 3 h in a 2 L HTC reactor, to produce wet HC after filtration. The ratio of OFMSW digestate and green waste (1:1) used as bulking medium was reproduced in four bioreactors with an increasing percentage of HC substituting the OFMSW digestate (0, 25, 50, 75%). The bioreactors managed to effectively compost the solid wet biomasses in a wet environment with temperature and oxygen control, while measuring online the oxygen consumption and thus the dynamic respirometric index (DRI). The DRI24,max measured with AIR-nl solid respirometer (standardized offline measurement) started from values above 800 mg O2 kgVS −1 h−1 before composting and dropped at the end of the process to values in the range 124–340 mg O2 kgVS −1 h−1 for the four mixes, well below the recommended limit of 500 mg O2 kgVS −1 h−1 for high-quality compost stability. These offline DRI values were confirmed by the online DRI measurements. This research is part of the international C2Land Project funded by the European Institute of Innovation and Technology Climate Knowledge and Innovation Community (EIT Climate-KIC), which is greatly acknowledged.
1. Introduction
The organic fraction of municipal solid waste (OFMSW) is commonly treated in Europe through anaerobic digestion (AD) and/or composting as best available techniques—BAT [1]. According to ECN Status Report 2019 [2] on European Bio-Waste Management, out of a total of 47.5 million tons of treated bio-waste, 64% is anaerobically digested, 26% is composted and around 10% is subject to an integrated anaerobic/aerobic treatment. The case of Italy is emblematic, since the produced digestate cannot be directly applied on farmland, so post-composting is almost always applied after AD [3]. In Italy, the stream of OFMSW sent to integrated plants increased by +81.8% in 2019 with respect to 2015, and there is still room for an increase in the future [4]. In actual integrated plants where OFMSW is digested and then composted, this second phase can be a bottleneck for the management of the whole system, thus requiring new strategies to improve the plant productivity.
The C2Land project (supported by EIT Climate-KIC, Call 2019) moves towards this direction: it aims to design an industrial scaling model producing a valuable co-compost from green wastes with OFMSW digestate and its hydrochar produced through Hydrothermal Carbonization (HTC). With HTC, any kind of biomass can be treated in the temperature range 180–250 °C in liquid water at saturation pressure, producing hydrochar (HC, solid phase), liquor (liquid phase) and a gaseous phase (consisting mainly of carbon dioxide) [5]. The main operative parameter governing the HTC process is the temperature, and directly connected to temperature is pressure since it should maintain water in the liquid phase; other important factors are residence time, solid load (or dry biomass to water ratio), pH, but also feedstock composition, HTC heating rate and the possible use of catalysts [6,7,8].
One of the C2Land’s scenarios proposes that a fraction of the OFMSW digestate is diverted to an HTC reactor to be carbonized. Then the liquor is recirculated back to the anaerobic digester, while the HC produced is sent to the composting plant together with the remaining OFMSW digestate. The phytotoxicity characteristics exhibited by the HC [9,10,11] should be eliminated by the aerobic stabilization, as shown in the study by Busch et al. [12]. The final product, named “hydrochar co-compost”, may have the same characteristics of a high-quality compost as the actual standard compost. Moreover, the C2Land project will analyze the effect of the hydrochar co-compost on greenhouse gas (GHG) emissions from soil application, to measure any positive effect on this parameter, as measured in the study by Adjuik et al. [13]. Besides, the biogas enhancement could improve the economic and social benefits for all the plants which perform biomethane upgrading for injection into natural gas network, as stated in the study by Martìn-Pascual et al. [14].
The aim of this paper is to present the design and assembly of the bench-scale batch bioreactors built to investigate the co-composting process of OFMSW digestate and its HC mixed in different proportions. In addition, some preliminary results of the process performed and data of the “hydrochar co-compost” product are shown, as regards to total solids, volatile solids, and stabilization index through dynamic respirometric index (DRI). This parameter was measured by the adiabatic solid respirometer AIR-nl [15,16] on samples before and after composting.
DRI is recognized as a good indicator of stability of biomass and compost and could be used in industrial-scale composting plants for the determination of the respiration/metabolic activity of the feedstock online [17].
Many previous studies reported the design of lab- or pilot-scale bioreactors used for composting biomass, whose stability was evaluated by measuring the respirometric index. A first group regards studies where the respirometric tests were performed in a separate equipment, on solid samples periodically withdrawn from the composting piles [18,19,20,21,22], also resorting to portable and low-cost respirometric systems [23].
A second group of studies reports the design of bioreactors with an online measurement of the metabolic activity: e.g., Gutierrez et al. [24], performed a 10-day composting process in a 124-L capacity solid-dynamic respirometer (Respirometer 3022, Costech International SpA, Naviglio, Italy), equipped with online oxygen detector, while Sun et al. [25] fully measured the respirometric activity of a 66-day composting process with a specifically designed 28-L bioreactor with an online CO2 sensor.
In such a research framework, the novelty proposed by this study is the possibility to have an online measurement of the respirometric index similar to the standardized offline AIR-nl method [15,16]. Actually, the semi-continuous aeration of the bioreactors controlled in oxygen content allows the measurement of the oxygen consumption rate (when the air loop is in recirculation mode) while performing the composting process itself, without the need to withdraw a sample from the compost pile and of an external additional equipment. We think this innovation in equipment and procedure could represent a significant step forward in composting process design, control, and optimization.
2. Materials and Methods
2.1. Experimental Apparatus
The scheme of the bioreactors is visible in Figure 1.
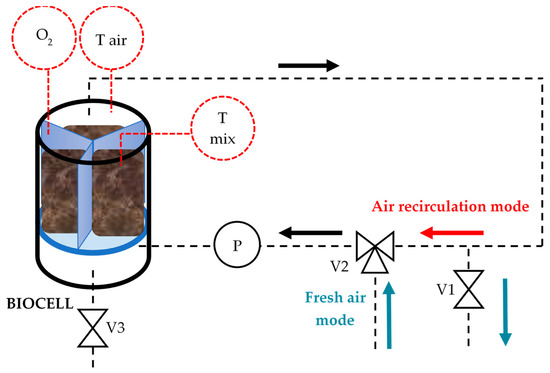
Figure 1.
Scheme of the bioreactor configuration.
The biocell is a modified boiler (30 L, stainless steel AISI 304, Brewmonster boiler 30 L) with a settable thermal resistance at the bottom, used to heat a water bath (in the temperature range from 20 to 100 °C). The red dotted lined circles O2, Tair and Tmix represent the sensors to measure respectively the internal air oxygen content, the internal air temperature, and the temperature of the composting mix. V1 and V2 are valves to divert the air circulation, while valve V3 is used for spilling out the leachate and for cleaning procedures. P indicates the air circulation pump, which will be discussed later in this section.
Three rhombohedral sectors (Vsector = 5.3 L) were built to perform a triplicate composting test inside each bioreactor, as it is shown in Figure 2a.
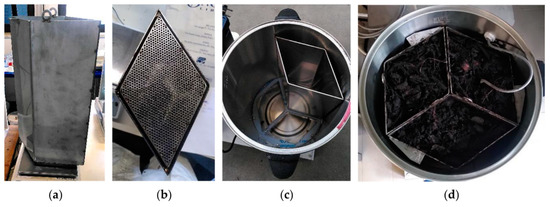
Figure 2.
The internal rhombohedral sectors for triplicate co-composting test; (a) Lateral view of one sector; (b) Bottom view of the sector; (c) One sector put on the internal support; (d) Top view of the biocell, subdivided into the three sectors for triplicate tests at the same conditions, filled with the feedstock to be composted.
The bottom side of each sector is drilled with 1.5 mm diameter holes for air passage (Figure 2b). Moreover, it has a protuberance (Figure 2b), which perfectly matches with the support inside the biocell, and an external o’ring gasket put in the hollow allows the up-flow air to pass only through the drilled bottom into the biomass to be aerated, preventing any air leaking out of the bin (Figure 2c). In Figure 2d, the top view of the biocell is visible: the three sectors were filled with the feedstock and put on their support before starting the composting process. The grey cable in Figure 2d is the PT100, i.e., the temperature sensor for composting mix temperature measurement, Tmix in Figure 1.
The internal working volume of the biocell was evaluated by measuring the volume of water filling the voids and by geometrical calculations, and is equal to 28.1 ± 0.3 L.
Figure 3 shows further details about the bioreactor construction. As visible in Figure 3a, the air recirculation is an internal forced up-flow, from a spiral tube with holes submerged in the water bath at the bottom of the system, where also a thermal resistance is located in order to maintain the desired bottom set temperature and vapor saturation conditions in the up-flow air leaving the water bath. Figure 3b shows the bottom view of the rhombohedral sector before being assembled to its drilled bottom.
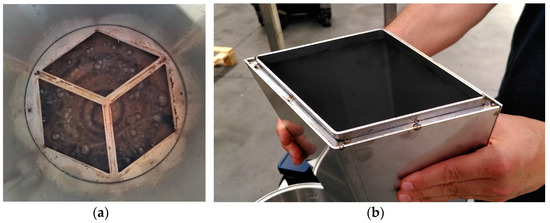
Figure 3.
Further details of bioreactor assembly; (a) Internal airflow through the bottom water bath; (b) Bottom view of the rhombohedral sector before being assembled to its drilled bottom.
The airflow is always on, thanks to the membrane pump P (6.0 L/min, 230 V AC 50 Hz, SP 700 ED-VD (AC), Schwarzer Precision GmbH) in an external air circuit with polyethylene tubes with 8 mm external diameter (Figure 1): it can operate in a closed air recirculation mode (indicated with the red arrow) or in a fresh air mode (blue arrows) to restore the oxygen content back to the set upper threshold value.
An Industruino Programmable logic controller (PLC) (Industrial I/O levels D21G, Arduino based) controls the electro valves V1 and V2 for fresh air with three probes fixed at the covering sealing disk of the biocell: a zirconia probe for oxygen content measurements (instrument sensitivity ±0.01%, operating range for O2 content 0.1–25% and for temperature −100 to +250 °C, (OXY-FLEX-0, SST Sensing Ltd. Company, Coatbridge, UK), one PT-100 for air temperature measurement (instrument sensitivity ±0.01 °C, operating range −20 to +85 °C) and another PT-100 put inside one sector for biomass temperature measurements (Figure 2d). Figure 4a shows the covering sealing disk with the zirconia probe, one PT100 (for air temperature measurement), the exhaust air tube and an additional ball valve for further applications. Figure 4b shows the front view of an open single biocell with its electronic control unit.
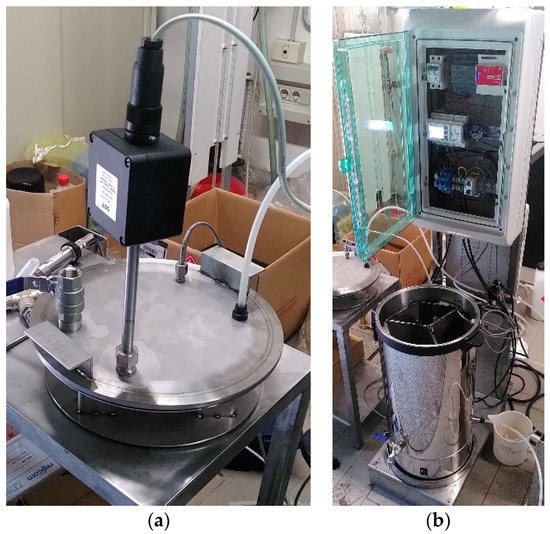
Figure 4.
Further details of a bioreactor, showing: (a) Sensors on the covering sealing disk; (b) Front view of an open single biocell with its electronic control unit (Programmable logic controller).
The PLC has an LCD screen and buttons, which allow data to be visualized (current date and time, air temperature, biomass temperature, oxygen content, relays activation for thermal resistance control) and to set some parameters, such as which temperature measurement set as reference for temperature control and the thresholds values for temperature and oxygen content. The data are saved in two parallel modalities as a *.txt file for each bioreactor: into an SD card unit for storage for each biocell, and into a raspberry unit connected in series to all the bioreactors and accessible with a Wi-Fi connection for online data visualization.
Additionally, a movable structure in stainless steel AISI 304 was built for each bioreactor (Figure 5); this keeps the biocell lifted from the ground and fixed inside a round site, it has two wheels and handles to facilitate handling and it holds the electric and electronic components up on its vertical support.
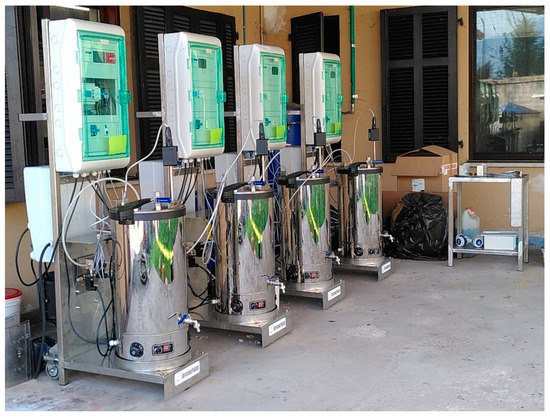
Figure 5.
The four designed bench-scale bioreactors in action.
2.2. Experimental Campaign
2.2.1. Feedstock Preparation and Characterization
The OFMSW digestate from an industrial plant (BET—BioEnergia Trentino plant at Trento, Italy) was carbonized in HTC trials at 200 °C for 3 h in a 2 L bench-scale reactor [26] filled with about 1.2 L of digestate each time, to produce in total around 12 kg of HC after gravity filtration with qualitative filter paper. Total solids (TS) and volatile solids (VS on dry basis %db) are shown in Table 1. TS were measured in triplicate by drying samples for at least 8 h at 105 °C in a ventilated oven, while VS after other 4 h at 550 °C in a muffle.

Table 1.
Characterization of total solids (TS) and volatile solids (VS on dry basis %db) of the biomass before and after Hydrothermal Carbonization (HTC) (mean and standard deviation from measures in triplicate).
The bulking or structuring material for composting was taken directly from the BET plant and consisted of a part of local fresh green waste (greenery, branches, and grass), a part of the intermediate over screening material that is sieved at the end of the oxidation biocell in the BET composting plant (mesh 4 cm), and a part of the over screening material that is sieved at the end of the whole process (mesh 1 cm). Four different conditions were tested in the lab co-composters, and the description of the masses of the fractions mixed is detailed in Table 2. The first condition is a “blank” which reproduces the real BET plant mixture of OFMSW digestate with an addition of bulking material in equal parts (MIX 00%), while the following ones have an increasing percentage of HC substituting the digestate (respectively MIX 25%, 50%, 75%—the percentage refers to weight %).
Table 2.
Fractions (in kg) mixed for each condition of percentage of hydrochar substituting the organic fraction of municipal solid waste (OFMSW) digestate.
The density of the material of the blank mix was evaluated according to ASTM D 854-92 and resulted equal to 1.128 kg/L, and each sector was filled with about 3.5 kg, resulting in 10.5 kg for each condition with a void volume percentage equal to 40% (apparent density 0.622 kg/L). The same density was assumed for the other mixes. This value was used to calculate the volume occupied by the biomass, to estimate the free volume inside the bioreactor during composting.
2.2.2. Process Setup and Management
The temperature profile of the industrial composting plant is divided into two phases. The first one is a ten day long thermophilic phase at around 60 °C, subdivided in 2 days of heating, 5 days of peak condition at 60 °C, and 3 days of cooling down. The second step is a mesophilic stabilization phase that lasts two weeks in the temperature range 30–40 °C (here considered equal to 37 °C). To reproduce this temperature profile, the biomass temperature was set as the reference temperature. In the last 10 days, the process was controlled in air temperature, monitoring the biomass temperature to be stable around the wanted temperature value. The oxygen content was fixed to be in the range 14–16% for the whole process, to reach the upper threshold during the fresh air mode even at thermophilic conditions, at which the partial pressure of water vapor is quite high. The biomass was kept inside the bioreactors in batch condition, with only one intermediate mixing at the end of the thermophilic phase.
TS and VS were measured taking one sample from each sector, to have a triplicate measure for each condition at the beginning and at the end of the composting process. A mass balance was performed for each sector to calculate the TS and VS consumption during the process.
2.2.3. Oxygen Consumption during the Process
The stability of the biomass was measured during the process itself thanks to an oxygen sensor, partially reproducing the methodology applied for the adiabatic solid respirometer in non-limited oxygen conditions (AIR-nl), realized by Dallago [15,16] at the University of Trento and adopted by the Autonomous Province of Trento (Italy) as the standard procedure for respirometric tests [27]. Each sample was kept in the closed cell (the bioreactor itself) with a forced bottom-up airflow, and the exhaust air was measured in oxygen content; differing from Dallago’s work, the air here was not dried, but kept wet, and the temperature was settable and not fixed at 30 °C.
To calculate the quantity of oxygen inside each bioreactor starting from the oxygen content measurement χO2% divided by 100 to obtain the molar fraction χO2, the ideal gas law (Equation (1)) was used to find the number of moles of oxygen nO2:
with:
- pO2, partial pressure of oxygen inside the reactor, found as the product of χO2 and the atmospheric pressure in lab (average considered constant patm = 98,300 Pa, 190 m a.s.l.);
- Vair, volume of voids occupied by air inside the bioreactor;
- R = 8.314463 J mol−1 K−1, ideal gas constant;
- Tair, temperature of air inside the reactor.
Thus, through Equation (2), the mass of oxygen inside each bioreactor can be calculated (molecular mass of oxygen MMO2 = 15.999 g/mol).
After the mO2 in the air inside the bioreactor has been calculated for each measurement, it is possible to calculate the rate of oxygen consumption from the decreasing slope of the oxygen content measured at every consuming cycle (under a certain threshold the oxygen content is restored with fresh air and then a new consuming cycle starts). This calculation was performed with a linear regression using the function fitlm in Matlab®. A data quality analysis was performed, neglecting all the cycles where R2 < 0.95.
The oxygen consumption rate was then divided by the initial quantity of volatile solids (in kg) inside the bioreactor; the Dynamic Respirometric Index (DRI) was expressed in mg O2 kgVS−1 h−1 consumed. The steps are visualized in Appendix A.
In order to characterize the compost stabilization according to the Italian legislation (Legislative Decree 75/2010 [28]), a sample of each mix before and at the end of the composting process was tested with the standardized solid respirometric test AIR-nl [27], in an adiabatic bioreactor with semi-continuous aeration at the controlled temperature of 30 °C.
3. Results
3.1. Operating Conditions of the Bioreactors
The temperature profiles during composting process are represented in Figure 6 with solid lines and are compared to the theoretical thermal profile of the actual plant (dashed lines) provided by the BET plant manager (see Section 2.2.2).
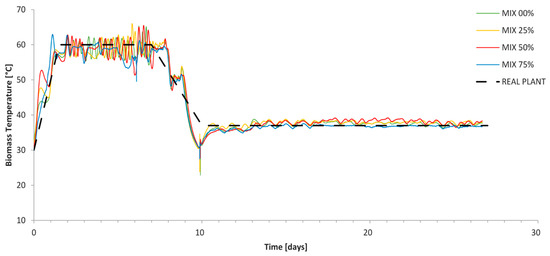
Figure 6.
Temperature profiles during composting process.
3.2. Co-Composts Properties
Table 3 shows the measurements of TS (moisture content MC as complement to 100%) and VS on dry basis (%db) of the triplicate samples taken from each bioreactor at the beginning (initial time t0) and at the end of the process (final time tf).
Table 3.
Total solids (TS), moisture content (MC), and volatile solids (VS) of the four mixes before and after composting.
Mass balances of total solids TS and volatile solids VS of the four mixes are shown in Table 4. Also here t0 indicates the initial time (i.e., before composting), tf indicates the final time, i.e., the end of the composting process; the values are calculated as average and sample standard deviation from the triplicate tests for each condition.
Table 4.
Mass balance of total solids (TS) and volatile solids (VS) of the four mixes before and after the composting process.
The dry matter consumption and the volatile matter consumption (detailed in Table 4) are summarized in Figure 7, showing a decreasing trend at increasing HC percentage. The columns represent the average values of the three bioreactor sectors and error bars represent the standard deviations.
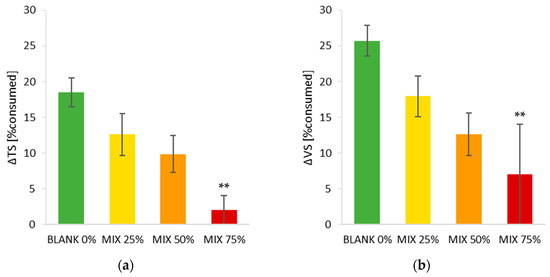
Figure 7.
Percentage consumption of: (a) total solids (TS) and (b) volatile solids (VS) on dry basis of the biomass due to composting process. ** No statistically significant difference.
3.3. Oxygen Consumption during the Process
In Figure 8, the DRI values are shown for all the mixes during composting. The steps necessary to obtain the DRI values are reported in Appendix A. The DRI values started, at the beginning of the thermophilic process, from around 800–1000 mg O2 kgVS−1 h−1, decreasing to values lower than 200 mg O2 kgVS−1 h−1 at the eighth day for all the mixes. The maturation phase in mesophilic conditions showed values always below 200 mg O2 kgVS−1 h−1.
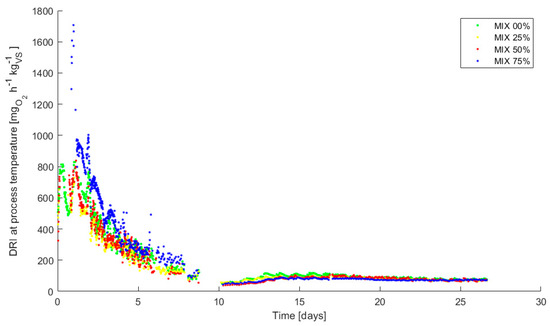
Figure 8.
Online measurements of Dynamic Respirometric Index (DRI) (expressed in mg O2 kgVS−1 h−1) during composting.
The samples taken from the feedstock pile for the respirometric tests with AIR-nl methodology showed the following values of the maximum 24-h-average dynamic respirometric indexes DRI24,max (respectively before vs. after composting process): 1340 vs. 340 for MIX 00%, 826 vs. 124 for MIX 25%, 1287 vs. 128 for MIX 50%, 1201 vs. 186 for MIX 75% (values expressed in mg O2 kgVS−1 h−1).
4. Discussion
The data reported in Figure 6 show that the bioreactors were able to reproduce the thermal profile of the actual industrial composting plant (10 days thermophilic, five of which at 60 ± 5 °C, and 17 days mesophilic at 37 ± 3 °C, Figure 6), with oxygen content set always >14%. Working with a water bath, the air was always in water vapor saturation condition.
As regards Table 3, since this composting process did not have a final drying phase but was instead always performed with air in saturated vapor condition, the MC at the end was still high. This helps the stabilization process, because moisture content is a limiting factor for microbial activity if below 60% [29]. Actually, Liang et al. [29] found that a moisture content in the range of 60–70% provides maximum activity, while if in the range 30–60%, the lower the moisture content, the lower the microbial activities. Many studies reported 55–65% as the best range of moisture content for composting, explaining that the problem associated with moisture content higher than 65% is the possibility to decrease oxygen diffusion through biomass particles, leading to the activation of anaerobic processes [30,31,32,33]. In this study, two operative parameters were adopted in order to overcome this risk: the air flow rate was kept continuously high (about 0.6 L min−1 kg−1) to help oxygen diffusion, while the mechanical turning/mixing of the pile in the sector at the transition from thermophilic to mesophilic conditions allowed a reallocation of particles and air pathways, enabling the access of microorganisms to further sources of organic matter (as noted in the study by Seruga et al. [34]).
The results shown in Table 4 suggest that the TS and VS in HC are more recalcitrant than in digestate, but further analyses are going to be performed in C2Land project to confirm this finding (chemical, agronomic and soil tests). The main feature to be confirmed is the elimination of the phytotoxicity of HC after composting. In this way, the project will pave the way for industrial-scale aerobic stabilization of hydrochar co-compost. In particular, the advantage of insertion of HTC before composting from a plant management point of view is double. On the one hand, if OFMSW mass flow is kept constant, HTC can reduce the material flows entering the composting facility, which gives rise to lower volumes needed for composting areas. On the other hand, for integrated anaerobic/aerobic plants with residual capacity in biodigesters, besides the benefit deriving from biogas enhancement due to HTC liquor recirculation [35,36,37], the upstream flow of OFMSW could be increased, maintaining the unchanged capacity of the composting plant; the higher the quantity of digestate diverted to the HTC unit, the higher the amount of digestate that can be handled by the combined HTC-composting path. Consequently, the fraction of hydrochar substituting digestate in composting mix increases as well: this is the reason why we decided to test various mixes which differed in the amount of HC substituting the digestate.
With regards to respirometric activity during the process, it is shown in Figure 8 that all the mixes, after composting, present DRI values much lower than 500 mg O2 kgVS−1 h−1, recommended limit for high-quality compost [38], meaning that the process was effective in stabilizing the feedstock. The MIX 75% has a very low consumption in solids (Figure 7 and Table 4), even if the DRI indicates an initial metabolic activity comparable to the other mixes, even slightly higher.
The results reported in Section 3.3 regarding the values of the DRI24,max measured with the AIR-nl respirometer confirm the trends found by the online DRI.
The online measurement of the respirometric index was designed and implemented as previously described for multiple reasons:
- It is based on O2 measurements instead of CO2, preferable as stated by international standards like ASTM 1996 [39].
- Since the aeration in the bioreactor is continuous, the respirometric index is dynamic (i.e., not static: without any forced air ventilation) —which is preferable as stated by Scaglia et al. [40] and Adani et al. [38]—and adopted for standards around the world as a biological activity index (ASTM 1996 [39], in Italy UNI/TS 11184:2006 [41]).
- It is based on the AIR-nl respirometer, which slightly overestimates the oxygen consumption rate compared to the other Italian respirometric method (DiProVe) [16], which results in conservative stability values.
- The upper and lower oxygen content thresholds are settable, and in this case the oxygen was never below 14% as stated by the Italian standard [41] for composting processes.
- It prevents any decrease in moisture content during aeration, since the air is constantly kept in a saturated vapor condition, and this is important since humidity affects microbial activity [29,30,31,32,33,34]; a future improvement to avoid high moisture content in final compost could be the recirculation of external air while excluding the water bath in the last days of the process, allowing the dehumidification of the biomass.
- It is effectively an online measurement and it does not require to withdraw a sample from the composting pile and it does not require any extra time for another time consuming respirometric test.
The configuration proposed in this study, with a zirconia sensor inside the closed bioreactor, was effective and stable in measuring oxygen content, even if in wet and extreme conditions for the eventual presence of ammonia and other compounds that often cause failure in probes. This may suggest a possible improvement in composting plant management, i.e., the possibility of monitoring the respirometric activity during the process. If the laws and regulations would be accordingly updated, the DRI online measurement, as here proposed, could be used to control and optimize the composting process, e.g., by ending the thermophilic phase when the oxygen consumption rate is constantly under a pre-defined threshold. In addition, the use of the DRI online measurement could avoid the offline measurement of the stabilization index of the final products, i.e., the compost or, as here proposed, the hydrochar co-compost.
5. Conclusions
In the framework of the C2Land project, four bioreactors were designed and assembled to reproduce the composting process of an actual integrated anaerobic/aerobic industrial plant treating OFMSW. The biocells were built with three sectors for triplicate test, matching with the internal support allowing the internal up-flow air to pass through their holed bottom side. The fresh air circulation mode was controlled by automatic valves and probes measuring internal air and biomass temperature and oxygen content (to keep it always higher than 14%), connected to an Arduino based PLC.
The OFMSW digestate from an industrial plant was treated in an HTC lab reactor at 200 °C for 3 h, the wet hydrochar obtained after filtration was used as feedstock for co-composting experiments in the bioreactors. The mixes to be co-composted consisted of half of waste green as bulking agent and half of OFMSW digestate. This latter part was substituted with an increasing percentage of hydrochar (0, 25, 50, 75%). The co-composting process was performed with a continuous air flow passing through a static feedstock, with 10 days at thermophilic conditions and 17 days of mesophilic stabilization.
The total solids TS before composting were respectively equal to 38, 40, 41, 39% and reached the values of 29, 33, 34, 36% after composting, testifying the high moisture content of the produced hydrochar co-composts. This condition could have possibly led to anaerobic reactions during composting, but it was counterbalanced by the adoption of a high air flow rate and one feedstock mixing performed at the end of the thermophilic phase and before starting the mesophilic stabilization. Volatile solids (VS), as expected, were consumed during composting; the variation in VS linearly decreased at increasing hydrochar percentage, with values equal to 26, 18, 13% respectively for MIX 00, 25, 50%, while the last feedstock tested (MIX 75%) did not show statistically different VS values before and after composting.
The values of the maximum 24h-mean of the Dynamic Respirometric Index (DRI24,max in mg O2 kgVS−1 h−1) measured with the standardized AIR-nl solid respirometer before and after composting were respectively 1340 vs. 340 for MIX 00%, 826 vs. 124 for MIX 25%, 1287 vs. 128 for MIX 50%, 1201 vs. 186 for MIX 75% (values in mg O2 kgVS−1 h−1). The Dynamic Respirometric Indexes measured from the oxygen consumption rates during the process were in accordance with the aforementioned standardized DRI values. This result suggests that the aerobic stabilization of the mixture hydrochar-OFMSW digestate was effective during composting. This indicates also that the bioreactors designed to compost solid wet biomasses in a wet environment with temperature and oxygen control worked well for the purpose. The experimental campaign reported in this study proposes an interesting solution to composting plant managers for process optimization, using a zirconia probe for oxygen content measurement online.
The production of hydrochar co-compost and the industrial model proposed within this project can be beneficial to plants suffering from excessive quantities of waste to be treated, but also to plants with residual capacity in digesters for productivity enhancement. To complete the objectives of the C2Land project, further analyses are going to be performed on the hydrochar co-composts (elemental analysis, germination tests, plant growth bioassays, HPLC on extracts, GHG emissions from soil tests) to better understand the quality of these products in respect to regulatory standards and to the actual “normal” compost.
Author Contributions
Conceptualization, methodology, D.S., G.A. and L.F.; software, D.S.; validation, D.S., G.A. and L.F.; data curation, D.S.; writing—original draft preparation, D.S.; writing—review and editing, G.A. and L.F.; visualization, D.S.; supervision, G.A. and L.F.; project administration, L.F.; funding acquisition, L.F. All authors have read and agreed to the published version of the manuscript.
Funding
This article is part of a project that has received funding from the European Union’s Horizon 2020 research and innovation programme under the European Institute of Innovation and Technology Specific Grant Agreement No. EIT/EIT Climate-KIC/SGA2020/1. The content of this article reflects only the authors’ view. The European Institute of Innovation and Technology and the European Commission are not responsible for any use that may be made of the information it contains.
Data Availability Statement
Raw data available upon request made to the corresponding author.
Acknowledgments
The authors want to thank Andrea Denaro and Riccardo Basso (MSc students) for the help in designing and managing the operating bioreactors; Edoardo Zuppardi, Loris Dallago, Andrea and Francesco Parisi for the competent and kind help in designing and prototyping the bioreactors and software programming; Michele Zorzi, the technical director of the plant of BioEnergia Trentino S.r.l. for fruitful discussions and providing OFMSW digestate and green waste. Last, but not least, the authors acknowledge EIT Climate-KIC for the financial support of the C2Land project.
Conflicts of Interest
The funders had no role in the design of the study; in the collection, analyses, or interpretation of data; in the writing of the manuscript, or in the decision to publish the results.
Appendix A
In this section, the steps for the calculation of the Dynamic Respirometric Index (DRI) during composting are presented. The mass of oxygen calculated as detailed in Section 2.2.3 is divided in single cycles of oxygen consumption and a linear regression is performed through the function fitlm in Matlab® (Figure A1).

Figure A1.
Plot of the oxygen mass inside the bioreactor calculated through Equation (2).
Then a data quality assessment is performed, neglecting all the cycles with R2 < 0.95. Table A1 shows the neglected cycles for all the four mixes tested; Figure A2 shows the quality assessment performed for MIX 25%. It is interesting to note that more than 580 cycles had been measured during the composting process for all the cycles, and at least 80% of cycles are accepted as linear consumption of oxygen, allowing for some useful information which is relevant to the whole composting process.

Figure A2.
All the cycles calculated with the function fitlm in Matlab® are shown. Quality assessment of the oxygen consumption rate of the cycles for MIX 25%: in black the dots with R2 < 0.95 to reject.
Table A1.
Quality assessment of the oxygen consumption rates: the data for each cycle were rejected if R2 < 0.95.
Table A1.
Quality assessment of the oxygen consumption rates: the data for each cycle were rejected if R2 < 0.95.
| # Neglected (R2 < 0.95) | # Total Cycles | % Neglected | |
|---|---|---|---|
| MIX 00% | 119 | 720 | 17 |
| MIX 25% | 35 | 583 | 6 |
| MIX 50% | 156 | 742 | 21 |
| MIX 75% | 73 | 673 | 11 |
The accepted oxygen consumption rates (blue dots in Figure A3) are then normalized to the mass of VS (in kg) present at the beginning of the process inside each bioreactor. This calculation is visualized in Figure A3 for the bioreactor processing MIX 25%, starting from the blue dots graph to the normalized black dots graph. In this way, DRI values are obtained for each bioreactor.

Figure A3.
The oxygen consumption rate (blue dots) is normalized to the initial volatile solids present in the bioreactor, obtaining the final DRI at the process temperature (black dots)—data referred to the MIX 25%.
The previous black dots graph is isolated in Figure A4 (now in green dots). The DRI data curves of all the mixes tested are superposed in Figure 8.

Figure A4.
The final curve of the DRI for the MIX 25% after the calculation process using Matlab®. All the DRI curves are superposed in Figure 8.
References
- Pinasseau, A.; Zerger, B.; Roth, J.; Canova, M.; Roudier, S. Best Available Techniques (BAT) Reference Document for Waste Treatment; European Commission Industrial Emissions Directive: Seville, Spain, 2010. [Google Scholar]
- ECN European Compost Network. ECN Status Report 2019—European Bio-Waste Management. Available online: https://www.compostnetwork.info/policy/biowaste-in-europe/treatment-bio-waste-europe/ (accessed on 27 December 2020).
- Saveyn, H.; Eder, P. End-of-waste criteria for biodegradable waste subjected to biological treatment (compost & digestate): Technical proposals. In JRC Scientific and Policy Reports; Report EUR 26425 EN; IPTS: Sevilla, Spain, 2014. [Google Scholar]
- ISPRA—Istituto Superiore per la Protezione e la Ricerca Ambientale. Rapporto Rifiuti Urbani 2020; n. 331/2020; ISPRA: Rome, Italy, 2020. [Google Scholar]
- Ischia, G.; Fiori, L. Hydrothermal Carbonization of Organic Waste and Biomass: A Review on Process, Reactor, and Plant Modeling. Waste Biomass Valorization 2020, 6, 1–28. [Google Scholar] [CrossRef]
- Basso, D.; Castello, D.; Baratieri, M.; Fiori, L. Hydrothermal carbonization of waste biomass: Progress report and prospects. In Proceedings of the 21th European Biomass Conference and Exhibition, Copenhagen, Denmark, 3–7 June 2013; pp. 1478–1487. [Google Scholar]
- Funke, A.L.; Ziegler, F. Hydrothermal carbonization of biomass: A summary and discussion of chemical mechanisms for process engineering. Biofuels Bioprod. Biorefining 2010, 4, 160–177. [Google Scholar] [CrossRef]
- Lucian, M.; Volpe, M.; Fiori, L. Hydrothermal Carbonization Kinetics of Lignocellulosic Agro-Wastes: Experimental Data and Modeling. Energies 2019, 12, 516. [Google Scholar] [CrossRef]
- Busch, D.; Kammann, C.; Grünhage, L.; Müller, C. Simple Biotoxicity Tests for Evaluation of Carbonaceous Soil Additives: Establishment and Reproducibility of Four Test Procedures. J. Environ. Qual. 2012, 41, 1023–1032. [Google Scholar] [CrossRef] [PubMed]
- Lucian, M.; Volpe, M.; Gao, L.; Piro, G.; Goldfarb, J.L.; Fiori, L. Impact of hydrothermal carbonization conditions on the formation of hydrochars and secondary chars from the organic fraction of municipal solid waste. Fuel 2018, 233, 257–268. [Google Scholar] [CrossRef]
- Hitzl, M.; Mendez, A.; Owsianiak, M.; Renz, M. Making hydrochar suitable for agricultural soil: A thermal treatment to remove organic phytotoxic compounds. J. Environ. Chem. Eng. 2018, 6, 7029–7034. [Google Scholar] [CrossRef]
- Busch, D.; Stark, A.; Kammann, C.I.; Glaser, B. Genotoxic and phytotoxic risk assessment of fresh and treated hydrochar from hydrothermal carbonization compared to biochar from pyrolysis. Ecotoxicol. Environ. Saf. 2013, 97, 59–66. [Google Scholar] [CrossRef] [PubMed]
- Adjuik, T.; Rodjom, A.M.; Miller, K.E.; Reza, M.T.M.; Davis, S.C. Application of hydrochar, digestate, and synthetic fertilizer to a miscanthus X giganteus crop: Implications for biomass and greenhouse gas emissions. Appl. Sci. 2020, 10, 8953. [Google Scholar] [CrossRef]
- Martín-Pascual, J.; Fernández-González, J.M.; Ceccomarini, N.; Ordoñez, J.; Zamorano, M. The study of economic and environmental viability of the treatment of organic fraction of municipal solid waste using montecarlo simulation. Appl. Sci. 2020, 10, 9028. [Google Scholar] [CrossRef]
- Dallago, L. Sviluppo e Applicazione di Tecniche Respirometriche per Valutare la Stabilità di Matrici Solide in Fase di Compostaggio. Ph.D. Thesis, University of Trento (Italy), Trento, Italy, 2002. [Google Scholar]
- Rada, E.C.; Ragazzi, M.; Venturi, M. Critical Analysis of Two Respirometric Methods for Solid Substrates Based on Continuous and Semi-Continuous Aeration. J. Bioremediation Biodegrad. 2012, 3, 12. [Google Scholar]
- Barrena Gómez, R.; Vázquez Lima, F.; Sánchez Ferrer, A. The use of respiration indices in the composting process: A review. Waste Manag. Res. 2006, 24, 37–47. [Google Scholar] [CrossRef] [PubMed]
- Berthe, L.; Druilhe, C.; Massiani, C.; Tremier, A.; De Guardia, A. Coupling a respirometer and a pycnometer, to study the biodegradability of solid organic wastes during composting. Biosyst. Eng. 2007, 97, 75–88. [Google Scholar] [CrossRef]
- Villaseñor, J.; Pérez, M.A.; Fernández, F.J.; Puchalski, C.M. Monitoring respiration and biological stability during sludge composting with a modified dynamic respirometer. Bioresour. Technol. 2011, 102, 6562–6568. [Google Scholar] [CrossRef] [PubMed]
- Scaglia, B.; Acutis, M.; Adani, F. Precision determination for the dynamic respirometric index (DRI) method used for biological stability evaluation on municipal solid waste and derived products. Waste Manag. 2011, 31, 2–9. [Google Scholar] [CrossRef]
- Gutiérrez, M.C.; Serrano, A.; Martín, M.A.; Chica, A.F. Odour in composting processes at pilot scale: Monitoring and biofiltration. Environ. Technol. 2014, 35, 1676–1684. [Google Scholar] [CrossRef]
- Sánchez Arias, V.; Fernández, F.J.; Rodríguez, L.; Villaseñor, J. Respiration indices and stability measurements of compost through electrolytic respirometry. J. Environ. Manag. 2012, 95, S134–S138. [Google Scholar] [CrossRef]
- Bermudez, J.F.; Saldarriaga, J.F.; Osma, J.F. Portable and low-cost respirometric microsystem for the static and dynamic respirometry monitoring of compost. Sensors 2019, 19, 4132. [Google Scholar] [CrossRef] [PubMed]
- Gutiérrez, M.C.; Serrano, A.; Siles, J.A.; Chica, A.F.; Martín, M.A. Centralized management of sewage sludge and agro-industrial waste through co-composting. J. Environ. Manag. 2017, 196, 387–393. [Google Scholar] [CrossRef] [PubMed]
- Sun, Z.Y.; Zhang, J.; Zhong, X.Z.; Tan, L.; Tang, Y.Q.; Kida, K. Production of nitrate-rich compost from the solid fraction of dairy manure by a lab-scale composting system. Waste Manag. 2016, 51, 55–64. [Google Scholar] [CrossRef]
- Merzari, F.; Lucian, M.; Volpe, M.; Andreottola, G.; Fiori, L. Hydrothermal carbonization of biomass: Design of a bench-Scale reactor for evaluating the heat of reaction. Chem. Eng. Trans. 2018, 65, 43–48. [Google Scholar]
- ‘Decreto del Presidente della Provincia Autonoma di Trento 9 giugno 2005, n. 14-44/Leg’—Regulatory Provisions Relating to Waste Landfills, Pursuant to Art. 11 of the Provincial Law of 15 December 2004, n. 10. Available online: https://www.consiglio.provincia.tn.it/leggi-e-archivi/codice-provinciale/Pages/legge.aspx?uid=12458 (accessed on 27 December 2020).
- ‘Decreto Legislativo 29 Aprile 2010, n. 75—Riordino e Revisione Della Disciplina in Materia di Fertilizzanti, a Norma Dell’articolo 13 Della Legge 7 Luglio 2009, n. 88’. Gazzetta Ufficiale. Available online: https://www.gazzettaufficiale.it/eli/id/2010/05/26/010G0096/sg (accessed on 27 December 2020).
- Liang, C.; Das, K.C.; McClendon, R.W. The influence of temperature and moisture contents regimes on the aerobic microbial activity of a biosolids composting blend. Bioresour. Technol. 2003, 86, 131–137. [Google Scholar] [CrossRef]
- Willson, G.B.; Parr, J.F.; Epstein, E.; Marsh, P.B.; Chaney, R.L.; Colacicco, D.; Burge, W.D.; Sikora, L.J.; Tester, C.F.; Hornick, S.; et al. Manual for Composting Sewage Sludge by the Beltsville Aerated-Pile Method. EPA-60018-80-022. 1980. Available online: http://citeseerx.ist.psu.edu/viewdoc/similar?doi=10.1.1.391.3832&type=cc (accessed on 27 December 2020).
- Pace, M.G.; Miller, B.E.; Farrell-Poe, K.L. The Composting Process. 1995. Available online: https://digitalcommons.usu.edu/cgi/viewcontent.cgi?article=1047&context=extension_histall (accessed on 27 December 2020).
- Richard, T.L.; Hamelers, H.V.M.; Veeken, A.; Silva, T. Moisture relationships in composting processes. Compost Sci. Util. 2002, 10, 286–302. [Google Scholar] [CrossRef]
- Aya El Zein, M.S.; Seif, H.; Gooda, E. Moisture content and thermal balance during composting of fish, banana mulch & municipal solid wastes. Eur. Sci. J. Febr. 2015, 11, 169–187. [Google Scholar]
- Seruga, P.; Krzywonos, M.; Wilk, M. Treatment of By-Products Generated from Anaerobic Digestion of Municipal Solid Waste. Waste Biomass Valorization 2020, 11, 4933–4940. [Google Scholar] [CrossRef]
- Merzari, F.; Langone, M.; Andreottola, G.; Fiori, L. Methane production from process water of sewage sludge hydrothermal carbonization. A review. Valorising sludge through hydrothermal carbonization. Crit. Rev. Environ. Sci. Technol. 2019, 49, 947–988. [Google Scholar] [CrossRef]
- Ferrentino, R.; Merzari, F.; Fiori, L.; Andreottola, G. Coupling Hydrothermal Carbonization with Anaerobic Digestion for Sewage Sludge Treatment: Influence of HTC Liquor and Hydrochar on Biomethane Production. Energies 2020, 13, 6262. [Google Scholar] [CrossRef]
- Ahmed, M.; Andreottola, G.; Elagroudy, S.; Negm, M.S.; Fiori, L. Coupling hydrothermal carbonization and anaerobic digestion for sewage digestate management: Influence of hydrothermal treatment time on dewaterability and bio-methane production. J. Environ. Manag. 2021, 281, 111910. [Google Scholar] [CrossRef] [PubMed]
- Adani, F.; Confalonieri, R.; Tambone, F. Dynamic Respiration Index as a Descriptor of the Biological Stability of Organic Wastes. J. Environ. Qual. 2004, 33, 1866–1876. [Google Scholar] [CrossRef]
- American Society for Testing and Materials. Standard Test Method for Determining the Stability of Compost by Measuring Oxygen Consumption; D 5975-96; ASTM International: West Conshohocken, PA, USA, 1996. [Google Scholar]
- Scaglia, B.; Tambone, F.; Genevini, P.L.; Adani, F. Respiration index determination: Dynamic and static approaches. Compost Sci. Util. 2000, 8, 90–98. [Google Scholar] [CrossRef]
- Italian National Standard Body. UNI/TS 11184: Waste and Recovered Fuel from Waste—Determination of Biological Stability through Dynamic Respirometric Index; Italian National Standard Body: Milan, Italy, 2006. [Google Scholar]
Publisher’s Note: MDPI stays neutral with regard to jurisdictional claims in published maps and institutional affiliations. |
© 2021 by the authors. Licensee MDPI, Basel, Switzerland. This article is an open access article distributed under the terms and conditions of the Creative Commons Attribution (CC BY) license (http://creativecommons.org/licenses/by/4.0/).