Article

Analytical Investigation of a Novel System for Combined Dew Point Cooling and Water Recovery

by
Aleksandra Cichoń
1,* and
William Worek
2
1
Department of Cryogenics and Aerospace Engineering, Faculty of Mechanical and Power Engineering, Wroclaw University of Science and Technology, 27 Wyspiański st., 50-370 Wroclaw, Poland
2
Department of Mechanical and Industrial Engineering, Texas A&M University-Kingsville, Kingsville, TX 78363, USA
*
Author to whom correspondence should be addressed.
Appl. Sci. 2021, 11(4), 1481; https://doi.org/10.3390/app11041481
Submission received: 28 December 2020 / Revised: 23 January 2021 / Accepted: 3 February 2021 / Published: 6 February 2021

Abstract

:

Featured Application

The proposed system for combined Dew Point Cooling and Water Recovery is suitable for various applications, wherever there is a need for air cooling (air conditioning) and water recovery. Due to its modular structure, it can be applied in micro, small, and large installations. It is designed to operate with ambient air in various climatic zones.

Abstract

This paper presents the analytical investigation of a novel system for combined Dew Point Cooling and Water Recovery (DPC-WR system). The operating principle of the presented system is to utilize the dew point cooling phenomenon implemented in two stages in order to obtain both air cooling and water recovery. The system performance is described by different indicators, including the coefficient of performance (COP), gained output ratio (GOR), energy utilization factor (EUF), specific energy consumption (SEC) and specific daily water production (SDWP). The performance indicators are calculated for various climatic zones using a validated analytical model based on the convective heat transfer coefficient. By utilizing the dew point cooling phenomenon, it is possible to minimize the heat and electric energy consumption from external sources, which results in the COP and GOR values being an order of magnitude higher than for other cooling and water recovery technologies. The EUF value of the DPC-WR system ranges from 0.76 to 0.96, with an average of 0.90. The SEC value ranges from 0.5 to 2.0 kWh/m3 and the SDWP value ranges from 100 to 600 L/day/(kg/s). In addition, the DPC-WR system is modular, i.e., it can be multiplied as needed to achieve the required cooling or water recovery capacity.

1. Introduction

The growing demand for cooling and drinking water has become a global issue in recent years [1,2]. It is expected that the energy demand for cooling in the building sector will more than triple by 2050, if appropriate energy efficiency measures are not taken [3]. By 2050, global water withdrawals for domestic and industrial sectors are also projected to increase by around 100% compared to the present [4]. The highest ratio of water stress is noted across the Middle East, North Africa, South Asia, and Southeast of North America [2]. These regions are located in the desert and semi-arid climatic zones where, in addition to high water stress, there is also a high energy demand for cooling purposes. In order to meet these demands, new highly efficient technologies are sought for cooling and drinking water production.
The most popular methods for drinking water production are membrane methods, including reverse osmosis (RO) and electrodialysis (ED). Thermal methods for drinking water production are multi-effect distillation (MED), multistage flash distillation (MSF), and mechanical or thermal vapor compression [5]. Other evolving technologies for water production are membrane distillation (MD), forward osmosis (FO), humidification-dehumidification (HDH), capacitance deionization (CDI), freezing, gas hydrates (GH), or ultra-, nano- and ionic filtration [6].
Existing methods for drinking water production are considered highly energy-consuming. The most popular method for drinking water production is RO, which is run by electricity and consumes 4–6 kWh/m3. Thermal methods (e.g., MSF or MED) consume less electricity, but they require significant heat input (up to 20 kWh/m3 of the electrical energy equivalent of thermal energy consumption) [5]. Due to this fact, recent studies focus mostly on reducing energy consumption or using renewable energy sources to facilitate water production processes. Heidary et al. [7] proposed a membrane (RO) and thermal (MSF) water recovery system for desalination purposes. The aim of this study was to reduce the MSF scale, improve the RO efficiency, and reduce the cost of desalted water production. Son et al. [8] described a hybrid MED and adsorption desalination (AD) system that was installed at the King Abdullah University of Science and Technology (Saudi Arabia). It was found that the total water production and the efficiency ratio of the MED-AD system were 3–5 times higher than those of the stand-alone MED system. Campione et al. [9] proposed an ED system coupled with a hybrid photovoltaic/wind energy source. The conducted simulation proved that the ED system could be coupled with highly nonconstant power sources and can additionally serve as an energy buffer device in freshwater production systems. Zheng et al. [10] presented an experimental study of a novel GH desalination system. It was found that the GH system showed a satisfactory desalination efficiency and could be used for water recovery from seawater. Skuse et al. [11] discussed whether FO, MD, and CDI could potentially substitute the most popular RO methods for water recovery. It was stated that these technologies offered significant advantages over RO, such as higher salt rejection, higher water recovery, ability to use low-grade energy, and a less extensive pre-treatment process.
In recent years, many studies focused on combining water recovery and cooling processes. Chiranjeevi et al. proposed a combined two-stage desalination and cooling plant [12]. The authors proposed a system that consisted of a two-stage HDH desalination system extended with a single-effect vapor absorption refrigeration (VAR) plant. Additionally, a solar flat-plate collector and concentrating collectors were used to produce heat for the desalination process. A combination of HDH and VAR resulted in an increased yield of desalinated water and a high-energy utilization factor (EUF for HDH-VAR cycle and plant was 0.58 and 0.33, respectively). Naef et al. [13] proposed a novel hybrid humidification HDH and AD system. The system was designed to produce freshwater and to obtain chilled water for an air-conditioning purpose. Two HDH-AD schemes were proposed: First, where seawater was precooled in the AD evaporator before feeding the HDH system; second, where seawater was used to cool the adsorption process. The gained output ratio (GOR) for the HDH-AD system was >7.6 and the coefficient of performance (COP) was >0.45. Naeimi et al. [14] proposed a modified configuration for an energy-efficient adsorption desalination and cooling system. The proposed system was made of a double-cycle multi-bed dual-evaporator with internal heat recovery. The specific daily water production of the proposed system was 20% higher in comparison to a single-cycle multi-bed dual evaporator system. It was also stated that the system could produce considerable amounts of high- and low-grade cooling. Anand et al. [15] proposed a new design of a vapor compression (VC) refrigeration system integrated with HDH desalination. The proposed system used low-temperature indoor air to cool the condenser, which significantly enhanced the system performance. It was stated that the highest COP of the proposed system was 2.16, the highest GOR was 6.11, and the highest EUF was 8.27.
Dew point cooling (i.e., indirect evaporative cooling) utilizes the renewable psychrometric energy resulting from the latent heat of water evaporating into the air. Dew point cooling has been proven a low energy-consuming cooling method for air-conditioning applications with COP (defined as cooling capacity divided by electric power input) reaching the level of 50 or higher [16,17,18]. Chen et al. [19] proposed the integration of an indirect evaporative cooler (IEC) and HDH system for the simultaneous production of cooling and freshwater. It was stated that the GOR of the IEC-HDH system was 1.6–2.5 and the COP was 2.1–2.5. So far, dew point cooling has been proposed as an addition to the standard water production systems. However, no stand-alone unit based solely on the dew point cooling for combined cooling and water production has been proposed.
Recent studies show that both cooling and drinking water production are critical issues worldwide. Many regions experience both limited access to freshwater and high energy demand for cooling purposes, which means that the search for low-energy methods of combined cooling and water production is most justified. This study provides the analytical investigation of a novel system for combined Dew Point Cooling and Water Recovery (DPC-WR system). So far, the system has been analyzed only for water recovery in the desalination process [20], but no studies of combined cooling and water recovery by the system have been done to date. The goal of this study is to present the operating principles of the DPC-WR system, provide the analytical study of the system performance, and determine its applicability in various climatic conditions.

2. Materials and Methods

2.1. Operational Principles of the DPC-WR System

Dew point cooling utilizes renewable psychrometric energy related to the latent heat of water evaporating into air. Heat and mass exchangers for dew point cooling (i.e., dew point coolers) are made of the two types of adjacent channels, namely primary and secondary channels, arranged in alternating series [16,17,18]. The inner plates of the secondary channels are covered with a water layer. At the interface between the water layer and the air in the secondary channels, there is a thin film of saturated air. As the water vapor partial pressure at this interface is higher than the partial pressure of the water vapor in the air, there is a mass transfer of water vapor into the flowing air. This transfer is related to the latent heat of evaporation that is the driving force of the dew point cooling phenomenon. The proposed DPC-WR system utilizes dew point cooling by enhancing the process of water evaporation in the secondary channels in order to condense it later in the process. At the same time, apart from the increased process of evaporation and condensation, the cooling process is also realized. The scheme of a single module of the DPC-WR system is presented in Figure 1.
The standard DPC-WR module consists of two dew point coolers that are coupled in two stages (1st and 2nd stage). Each dew point cooler is a counter-flow regenerative exchanger, made of alternating series of the primary and secondary channels. The air enters the DPC-WR system in the 1st stage (1i in Figure 1). Flowing through the primary channels, the air is cooled without increasing its moisture content. Cooled air that leaves the primary channels (1o in Figure 1) is divided into two parts. One part is delivered to the secondary channels in the 1st stage (1o = 2i in Figure 1), while the second part is directed to the secondary channels in the 2nd stage (1o = 3i in Figure 1). The water (salt water, wastewater, or any other medium from which water can be recovered) is delivered to the secondary channels in the 1st stage. Due to the dew point cooling principles, there is a water vapor transfer from the water into the air that flows through the secondary channels in the 1st stage. The mineral compounds or other contaminants do not evaporate and so they can be removed from the module (discharge liquid). The air that enters the secondary channels in the 2nd stage (3i in Figure 1) has a low temperature due to the pre-cooling in the 1st stage. On the other hand, the air that enters the adjacent primary channels (2o in Figure 1) is highly humidified due to water evaporation in the 1st stage. This humidified air contacts with the plate surface of low temperature, which results in water vapor condensation. This condensate will be of similar quality to distilled water, so it can be collected and further processed as needed.
In addition to the condensation process, standard dew point cooling is realized in the 2nd stage, resulting in the cooling of the air that flows through the primary channels. The air that leaves the secondary channels (4o in Figure 1) is significantly cooled and slightly more humid that the ambient air that enters the DPC-WR system (1i in Figure 1). In order to realize the dew point cooling in the 2nd stage, water has to be supplied to the secondary channels. This can be the same water as that supplied to the 1st stage, or it is possible to further concentrate the discharge liquid from the 1st stage. To make this happen, the discharge liquid from the 1st stage would be returned to the secondary channels in the 2nd stage, where the remaining water will evaporate. In such a case, an additional highly concentrated discharge liquid would be obtained after passing the 2nd stage, which could be used, e.g., in the recovery of valuable elements or other materials contained therein.
The proposed DPC-WR system does not use an external heat source for water evaporation but instead uses the renewable psychrometric energy related to the latent heat of water evaporation. The energy is delivered to the DPC-WR system with ambient air, and electric energy is used to transport the air through the following stages. The system can operate with ambient air so that no additional heat source is needed; nevertheless, any kind of low-grade heat with temperatures (32–60 °C) is expected to enhance the system performance. This type of low-parameter heat can be obtained by using, for example, solar collectors or hybrid photovoltaic-solar systems.
As it can be seen, the DPC-WR system allows both air cooling and water recovery. The cooled air is suitable for a variety of applications including air conditioning appliances. The DCP-WR system allows for the recovery of water from seawater or wastewater, among others. The water fed to the system should only be free of solid particles that could clog the channels, so to prevent this, it should be filtered beforehand. The system can also be used to concentrate various types of leachate, e.g., leachate after a membrane process. In such cases, in addition to the cooled air, both recovered water (of similar quality to distilled water) and a concentrated discharge liquid are produced. In addition, the DPC-WR system is modular, i.e., it can be multiplied as needed to achieve the required cooling or water recovery capacity. The modularity of the DPC-WR system allows the size/scaling issue to be avoided.

2.2. Mathematical Model of the DPC-WR System

The DPC-WR system is described by an analytical model based on the convective heat transfer coefficient. Each stage is described by separate models with different initial conditions. All the equations are ordinary differential equations described in an orthogonal coordinate system. The numerical procedure used to solve the differential equations is executed in the MatLab environment with the Ordinary Differential Equations Solver (ode15s). The general assumptions of the model are listed below [20,21,22]:
  • Steady-state operation;
  • Airflow is modeled as an ideal gas;
  • Properties of water and air streams are equal to bulk averaged values;
  • Thermal conductivity along channel length through plate and water is negligible;
  • Heat losses to the surroundings are neglected;
  • Mass transfer of water vapor is driven by partial pressure gradient.

2.2.1. Mathematical Model of the First Stage of the DPC-WR System

The balance equation for sensible heat related to the air stream in the primary channels (primary air) in the 1st stage is given with Equation (1). The governing equation describing sensible heat related to the primary air in the 1st stage is described with Equation (2).
( d Y L Y ) G 1 c p 1 d t 1 d X d X = d Q ˙ 1 S
d t 1 d X ¯ = NTU 1 ( t p 1 t 1 )
The balance equation for sensible heat related to the air stream in the secondary channels (secondary air) in the 1st stage is given with Equation (3). The governing equation describing sensible heat related to the secondary air in the 1st stage is described with Equation (4). The balance equation for mass transfer related to the secondary air in the 1st stage is given with Equation (5). The governing equation for mass transfer related to the secondary air in the 1st stage is described with Equation (6).
( d Y L Y ) G 2 c p 2 d t 2 d X d X = d Q ˙ 2 S
d t 2 d X ¯ = NTU 2 ( t w t 2 )
( d Y L Y ) G 2 d x 2 d X d X = d M 2
d x 2 d X ¯ = NTU 2 ( 1 Le 2 ) ( x w x 2 )
The balance equation for mass transfer related to the water stream in the secondary channels in the 1st stage is given with Equation (7) and the governing equation is described with Equation (8).
( d Y L Y ) d G w d X d X = d M w
d G w d X ¯ = G 2 NTU 2 ( 1 Le 2 ) ( x w x 2 )
The balance equation for total heat transfer (sensible and latent) related to the 1st stage is given with Equation (9).
d t w d X ¯ = W 1 / W w NTU 1 ( t p 1 t 1 ) + W 2 / W w NTU 2 [ ( t w t 2 ) + ( r c p 2 ) ( x w x 2 ) ]
where: W1/Ww = (G1cp1)/(Gwcw); W2/Ww = (G2cp2)/(Gwcw).

2.2.2. Mathematical Model of the Second Stage of the DPC-WR System

The balance equation for sensible heat related to the air stream in the primary channels (primary air) in the 2nd stage is given with Equation (10). The governing equation describing sensible heat related to the primary air in the 2nd stage is described with Equation (11). The balance equation for mass transfer related to the primary air in the 2nd stage is given with Equation (12). The governing equation for mass transfer related to the primary air in the 2nd stage is described with Equation (13).
( d Y L Y ) G 4 c p 4 d t 4 d X d X = d Q ˙ 4 S
d t 4 d X ¯ = NTU 4 ( t p 4 t 4 )
( d Y L Y ) G 4 d x 4 d X d X = d M 4
d x 4 d X ¯ = NTU 4 ( 1 Le 4 ) ( x p 4 x 4 )
The balance equation for sensible heat related to the air stream in the secondary channels (secondary air) in the 2nd stage is given with Equation (14). The governing equation describing sensible heat related to the secondary air in the 2nd stage is described with Equation (15). The balance equation for mass transfer related to the secondary air in the 2nd stage is given with Equation (16). The governing equation for mass transfer related to the secondary air in the 2nd stage is described with Equation (17).
( d Y L Y ) G 3 c p 3 d t 3 d X d X = d Q ˙ 3 S
d t 3 d X ¯ = NTU 3 ( t w t 3 )
( d Y L Y ) G 3 d x 3 d X d X = d M 3
d x 3 d X ¯ = NTU 3 ( 1 Le 3 ) ( x w x 3 )
The balance equation for mass transfer related to the water stream in the secondary channels in the 2nd stage is given with Equation (18) and the governing equation is described with Equation (19).
( d Y L Y ) d G w d X d X = d M w
d G w d X ¯ = G 3 NTU 3 ( 1 Le 3 ) ( x w x 3 )
The balance equation for total heat transfer (sensible and latent) related to the 2nd stage is given with Equation (20).
d t w d X ¯ = W 4 / W w NTU 4 [ ( t p 4 t 4 ) + ( r c p 4 ) ( x p 4 x 4 ) ] + W 3 / W w NTU 3 [ ( t w t 3 ) + ( r c p 3 ) ( x w x 3 ) ]
where: W4/Ww = (G4cp4)/(Gwcw); W3/Ww = (G3cp3)/(Gwcw).

2.2.3. Initial Conditions for the Mathematical Model of the DPC-WR System

The initial conditions for the 1st stage are given as follows:
t 1 | = t 1 i X ¯ = 0 Y ¯ = 0 ÷ 1 ;   x 1 | = x 1 i = c o n s t X ¯ = 0 ÷ 1 Y ¯ = 0 ÷ 1 ;   t 2 | = t 2 i = t 1 o X ¯ = 1 Y ¯ = 0 ÷ 1 ;   x 2 | = x 2 i = x 1 o = x 1 i X ¯ = 1 Y ¯ = 0 ÷ 1 ;   t w | = t w i X ¯ = 0 Y ¯ = 0 ÷ 1 ;   G w | = G w i X ¯ = 0 Y ¯ = 0 ÷ 1
The initial conditions for the 2nd stage are given as follows:
t 4 | = t 4 i = t 2 o X ¯ = 0 Y ¯ = 0 ÷ 1 ;   x 4 | = x 4 i = x 2 o X ¯ = 0 ÷ 1 Y ¯ = 0 ÷ 1 ;   t 3 | = t 3 i = t 1 o X ¯ = 1 Y ¯ = 0 ÷ 1 ;   x 3 | = x 3 i = x 1 o = x 1 i X ¯ = 1 Y ¯ = 0 ÷ 1 ;   t w | = t w i X ¯ = 0 Y ¯ = 0 ÷ 1 ;   G w | = G w i X ¯ = 0 Y ¯ = 0 ÷ 1

2.3. Validation of the Mathematical Model

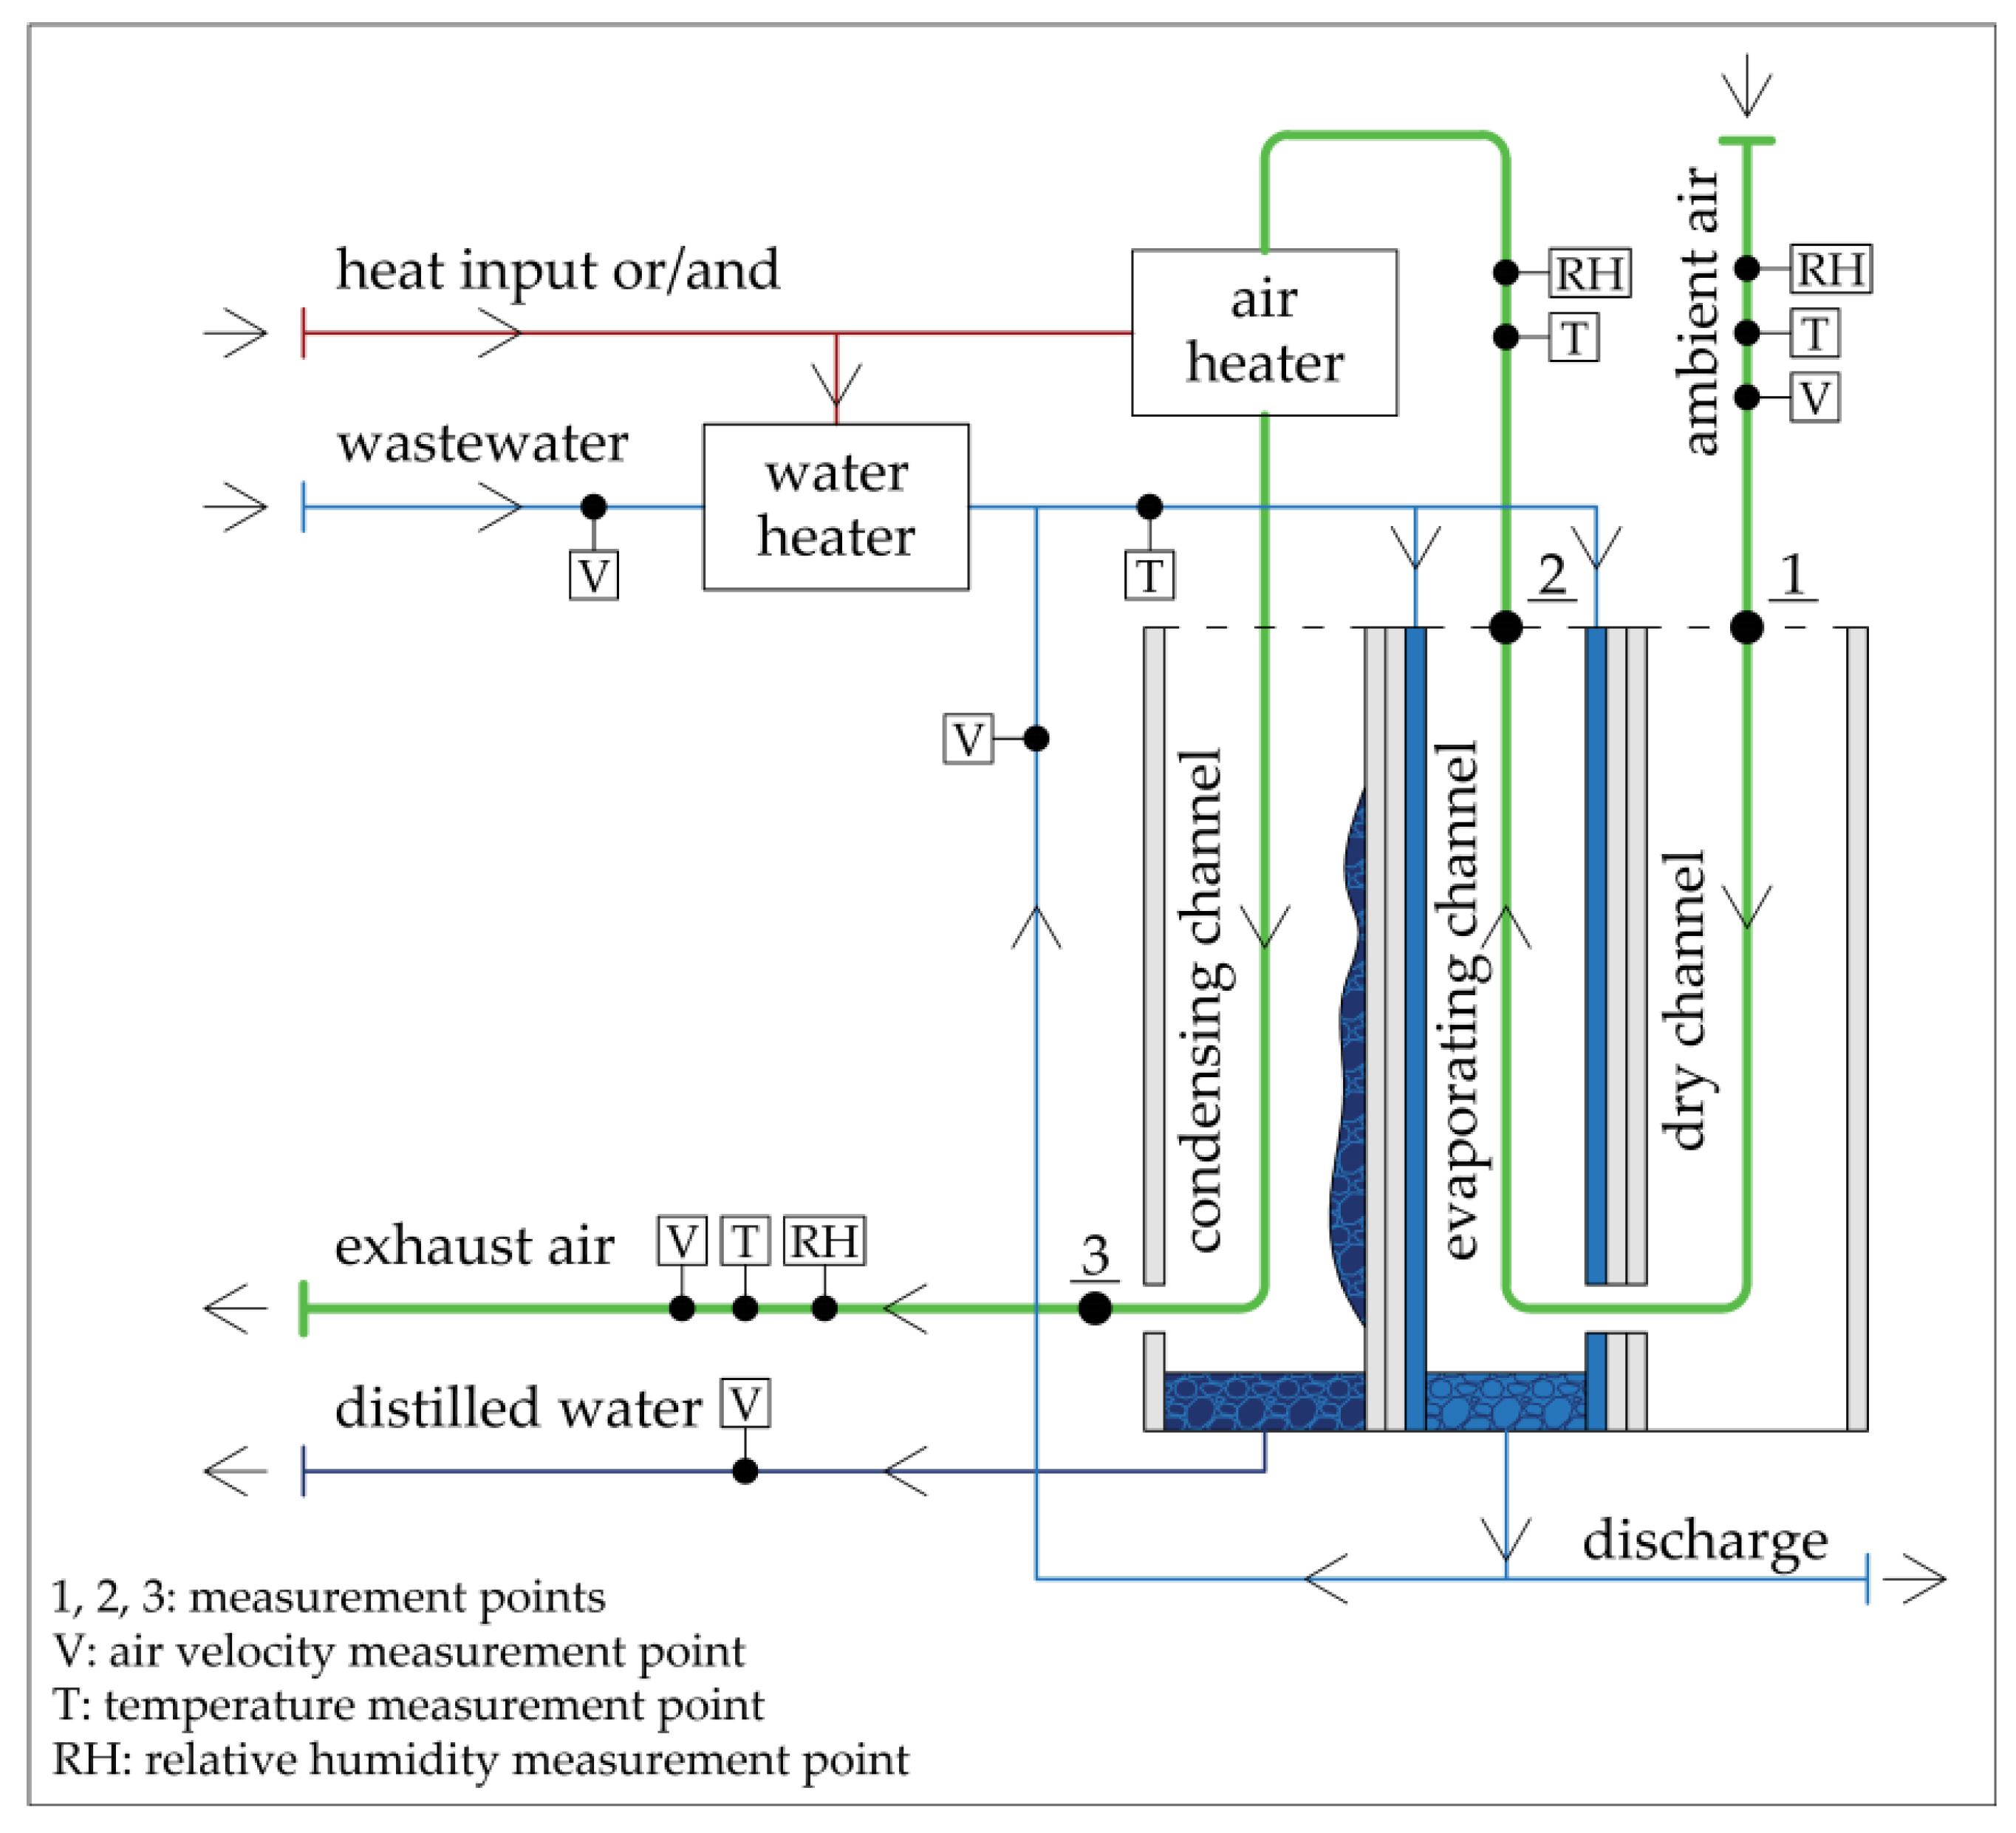
The analytical model of the DPC-WR system is validated with measurements taken at the test station located at the Gas Technology Institute Laboratory (GTI, USA) [23]. The test station was designed and fabricated by Idalex Inc. (USA, Denver, CO, USA) to investigate the idea of wastewater recovery using dew point cooling. The scheme and operating principles of the test station are shown in Figure 2. The tested dew point cooler was made with an alternating series of three adjacent channels: Dry, evaporating, and condensing channels. The ambient air was delivered to the dry channels where it was pre-cooled without increasing its moisture content (which corresponds to the pre-cooling of air in the primary channels of the 1st stage of the DPC-WR system). The pre-cooled air was then redirected to the evaporating channels where it contacted with the pre-heated wastewater distributed on the plate surface of the channels (which corresponds to the air humidification in the secondary channels of the 1st stage of the DPC-WR system). After leaving the evaporative channels, the humidified air was additionally heated and directed to the condensing channels, where water condensed at the plate surface of the channels (which corresponds to water vapor condensation in the 2nd stage of the DPC-WR system). The condensed water was collected and measured to evaluate the wastewater recovery potential of the tested dew point cooler.
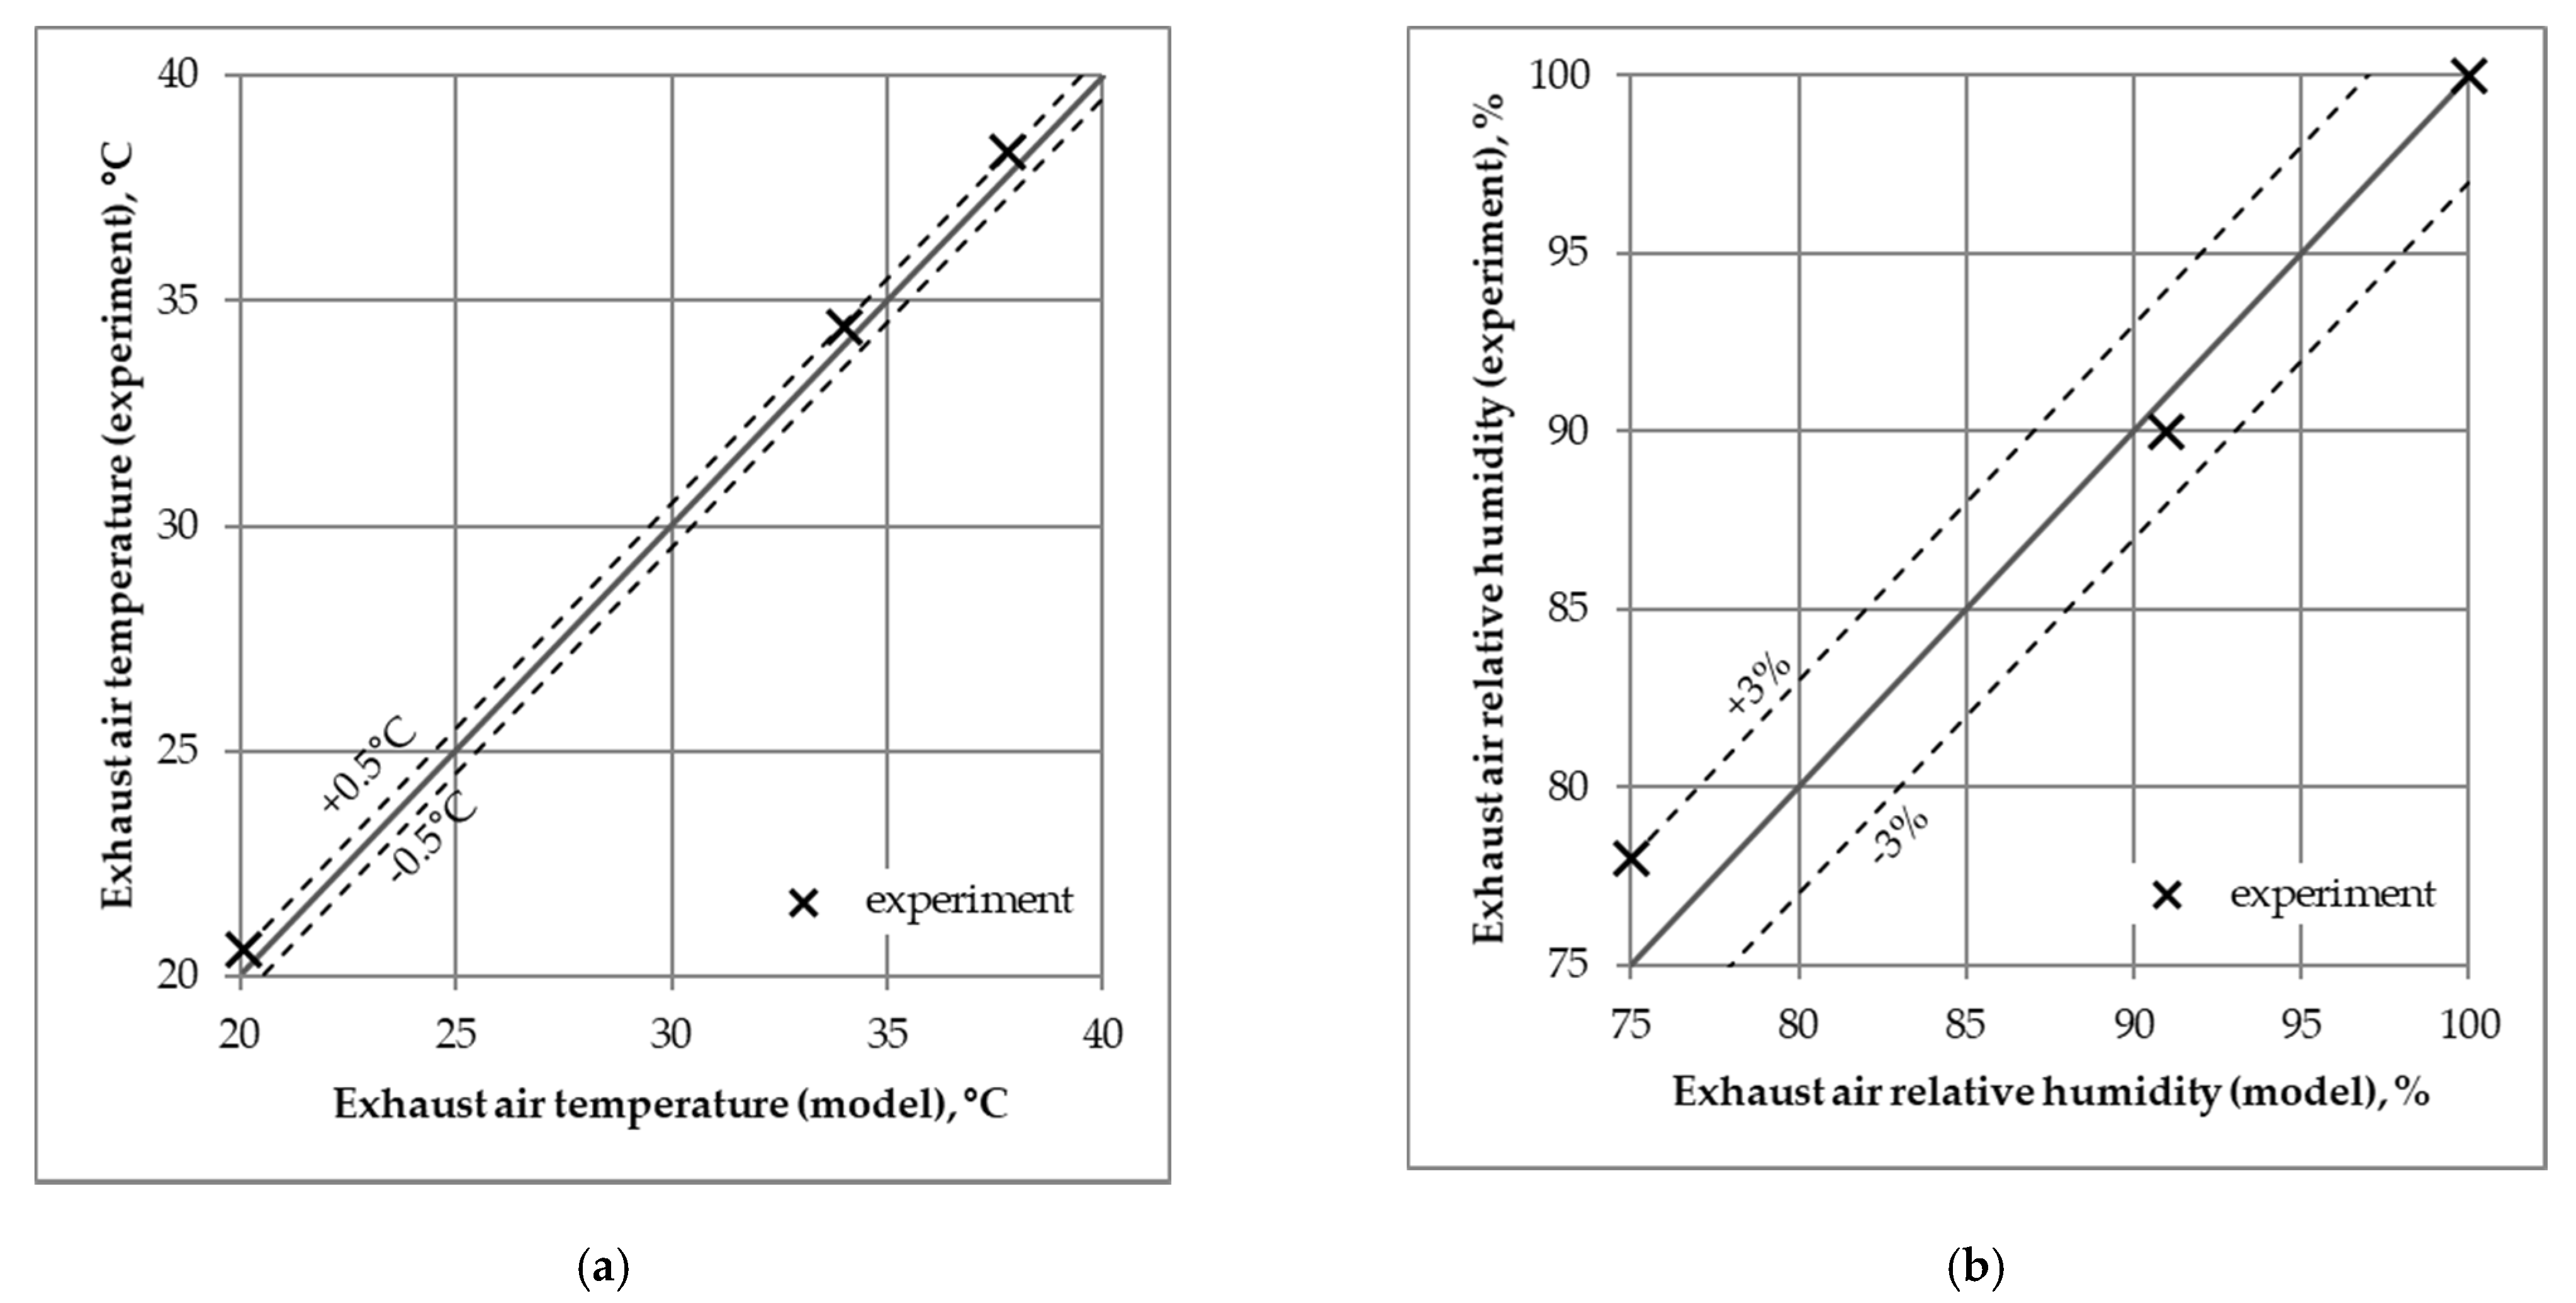
The airflow rate through the tested dew point cooler was maintained in the range of 170–510 m3/h. The ambient air temperature was 19–27 °C and the air relative humidity was 20–70%. The wastewater supplied to the test station was preheated to the temperature of 32–60 °C. Three cases selected for model validation are listed in Table 1. The following measuring equipment was used: Omega moisture, temperature, and relative humidity meter and Omega K-type thermocouple (probe 1.55 mm with ceramic mini connector). The relative humidity measurement accuracy was ±2.5% (from 11 to 90%) and ±3% elsewhere. The temperature measurement accuracy was ±0.5 °C. The location of the measurement point is shown in Figure 2. The overall dimensions of the tested dew point cooler were: 0.53 m long, 0.51 m wide, and 0.28 m high.
Experimental data (exhaust air temperature and relative humidity) collected at the test station were compared with the corresponding calculations made with the analytical model of the DPC-WR system. It was found that the model showed good compliance with the experimental data. The maximum exhaust air temperature discrepancies did not exceed 0.5 °C (Figure 3a), and the maximum exhaust air relative humidity discrepancies did not exceed 3% (Figure 3b).

3. Results

3.1. Performance Indicators

Several different indicators were used to describe DPC-WR system performance. The cooling effectiveness of the DPC-WR system is described with COP (coefficient of performance), defined as an amount of the cooling capacity divided by the electric power input (Equation (21)).
COP = Q ˙ 4 S W ˙ n e t
The driving force behind the DPC-WR system is the renewable psychrometric energy related to the latent heat of water evaporation. This renewable energy is delivered to the DPC-WR system with ambient air, which is also a necessary medium in the dew point cooling process. Therefore, the only external energy supplied to the DPC-WR system is the electric power input to the fan to transport the air through the following stages of the system. For the same reason, the cooling capacity in Equation (21) applies only to the 2nd stage of the DPC-WR system. The air in the 1st stage is also cooled and its temperature after leaving the 1st stage is lower than at the inlet to the system. However, the heat transfer associated with the cooling in the 1st stage is also the driving force of the entire process. For this reason, only the cooling capacity of the 2nd stage is used in the calculations, which is to simplify the understanding of the COP, also in relation to other indicators.
The electric power input to the fan is described with Equation (22), where Δp is the pressure drop defined with the Darcy–Weisbach coefficient of airflow friction losses (Equation (23)). The coefficient of fluid friction losses related to the laminar flow in rectangular channels where the width/height ratio is high is described with Equation (24) [24].
W ˙ n e t = Δ p V ˙ η ,   kW
Δ p = f L 4 R h ρ a u 2 2 ,   Pa
f = 96 Re = 96 ν 4 R h u
The water recovery effectiveness of the DPC-WR system is described by the GOR (gained input ratio), defined as the heat released during condensation divided by the electric power input (Equation (25)). It describes the effectiveness of the use of electric energy supplied to the DPC-WR system in the process of water recovery via condensation.
GOR = Q ˙ 4 L W ˙ n e t
The overall effectiveness of the DPC-WR system is described by the EUF (energy utilization factor) (Equation (26)). This indicator includes both electric power input and renewable energy delivered with air. EUF describes the effectiveness of the utilization of energy supplied to the DPC-WR system for combined cooling and water recovery purposes.
EUF = Q 4 S + Q 4 L Q 1 T + W n e t
The rest of the indicators relate to water recovery. The specific energy consumption (SEC) is defined as the amount of energy needed to recover 1 m3 of water (Equation (27)). The recovered water is the water condensed in the primary channels in the 2nd stage. It should be noted that the proposed system is modular; therefore, any water capacity can be recovered by multiplying modules as needed. Due to this fact, the daily water recovery for one unit of the DPC-WR system is not considered a very informative indicator, so another indicator is introduced, which is the specific daily water production (SDWP). SDWP is defined as the daily amount of recovered water related to 1 kg/s of air delivered to the DPC-WR system (Equation (28)).
SEC = N n e t Δ x 4 V 4 1 3600 ,   kWh / m 3
SDWP = 24 · 1000 · 3600 · Δ x 4 V 4 G 1 ,   liter / day / ( kg / s )

3.2. Performance of the DPC-WR System under Different Climatic Conditions

The analytical model of the DPC-WR system is used to calculate different performance indicators. Calculations are made for a single DPC-WR module. Geometrical parameters of the module are listed in Table 2. The mass flow of air supplied to the module is G1 = 1.5 kg/s and the NTU1 of the module is 10. The ratio of air mass flow rate in the 1st stage is G2/G1 = 0.45 and in the 2nd stage G4/G3 = 1.22.
The idea of the DPC-WR system is to utilize the renewable energy delivered to the system with ambient air. This means that the DPC-WR system is highly dependent on the parameters of the air supplied to the system; therefore, system performance should be studied for different climatic conditions. Different performance indicators are calculated for various climatic zones according to the Köppen–Geiger climate classification system [25] (climatic zones that include low-population areas were excluded from this study). The temperature (t) and humidity ratio (x) of the ambient air for selected locations in each climatic zone are defined by design conditions given by ASHRAE [26] and listed in Table 3. The given ambient air parameters are used as the temperature and humidity ratio of air that enters the DPC-WR system (t = t1i, x = x1i).
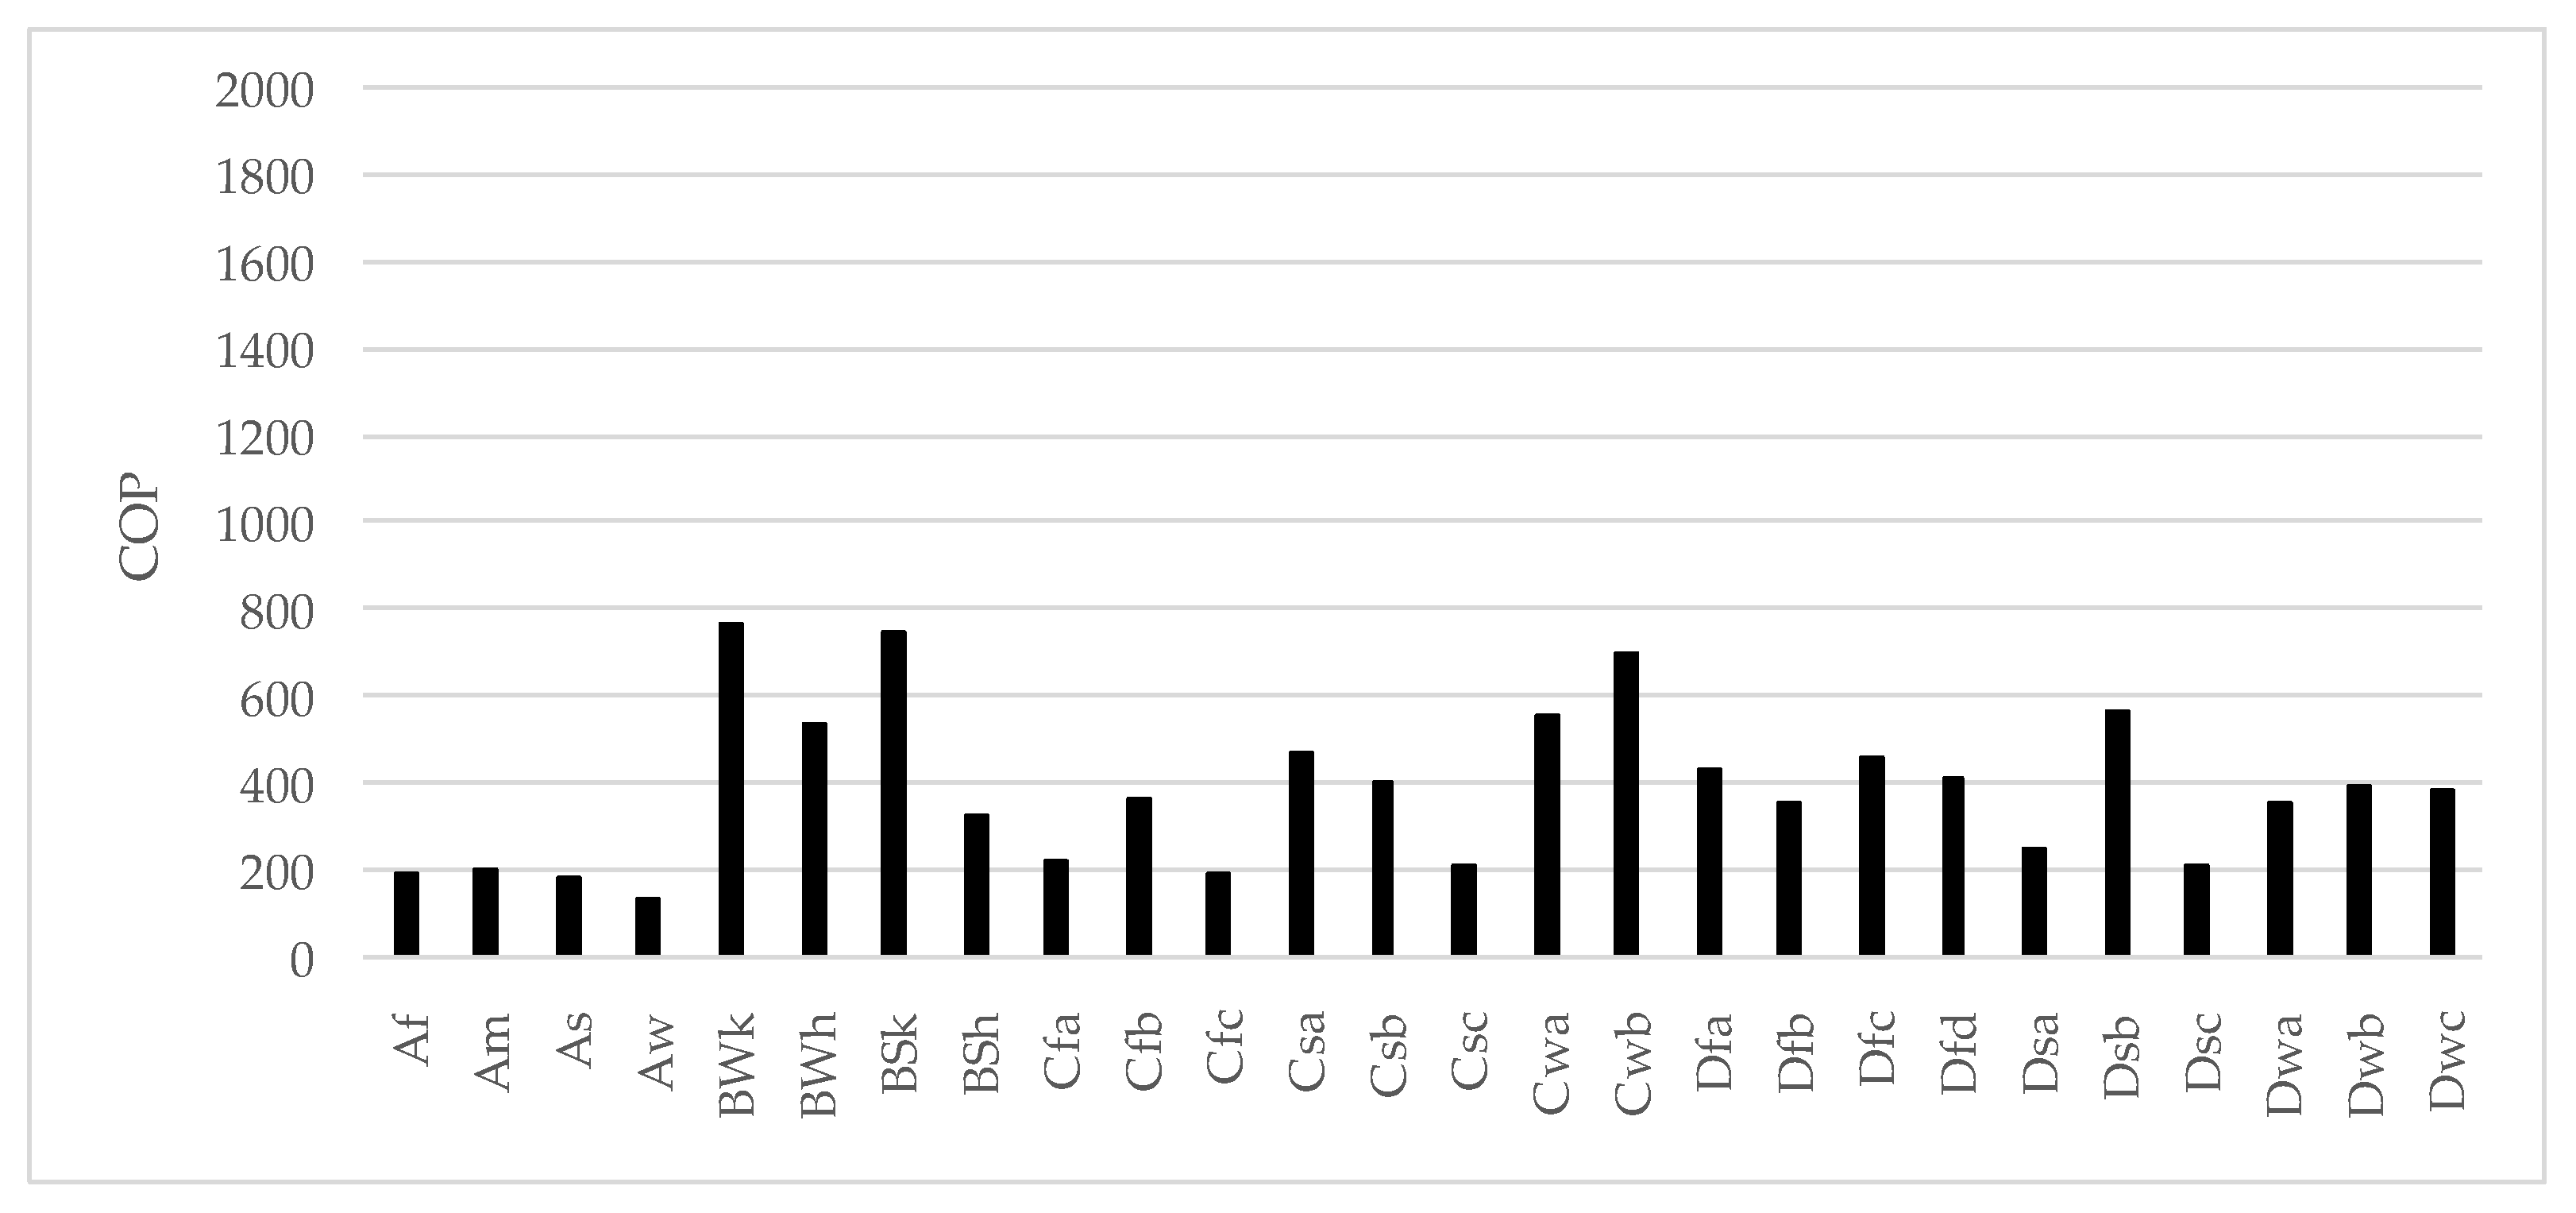
The performance indicator COP of the DPC-WR system is calculated for different climatic conditions and presented in Figure 4. It can be seen that the COP varies in the range from 138 to 768. High values of COP result from the fact that the cooling process in the DPC-WR system is run by the renewable psychrometric energy related to the latent heat of water evaporation. This renewable energy is delivered to the system with ambient air, which would be supplied to the system anyway. Therefore, the only external energy taken for COP calculation is the electric power input. It can be further seen that the highest COP is noted in semi-arid, hot desert, and subtropical climatic zones. These climatic zones are characterized either by high air temperature or by low humidity ratio, or by both. On the other hand, the lowest COP is noted in tropical climatic zones, which are characterized by high air humidity ratio. It can therefore be stated that a low air humidity ratio, especially in combination with high air temperature, enhances the cooling effectiveness of the DPC-WR system.
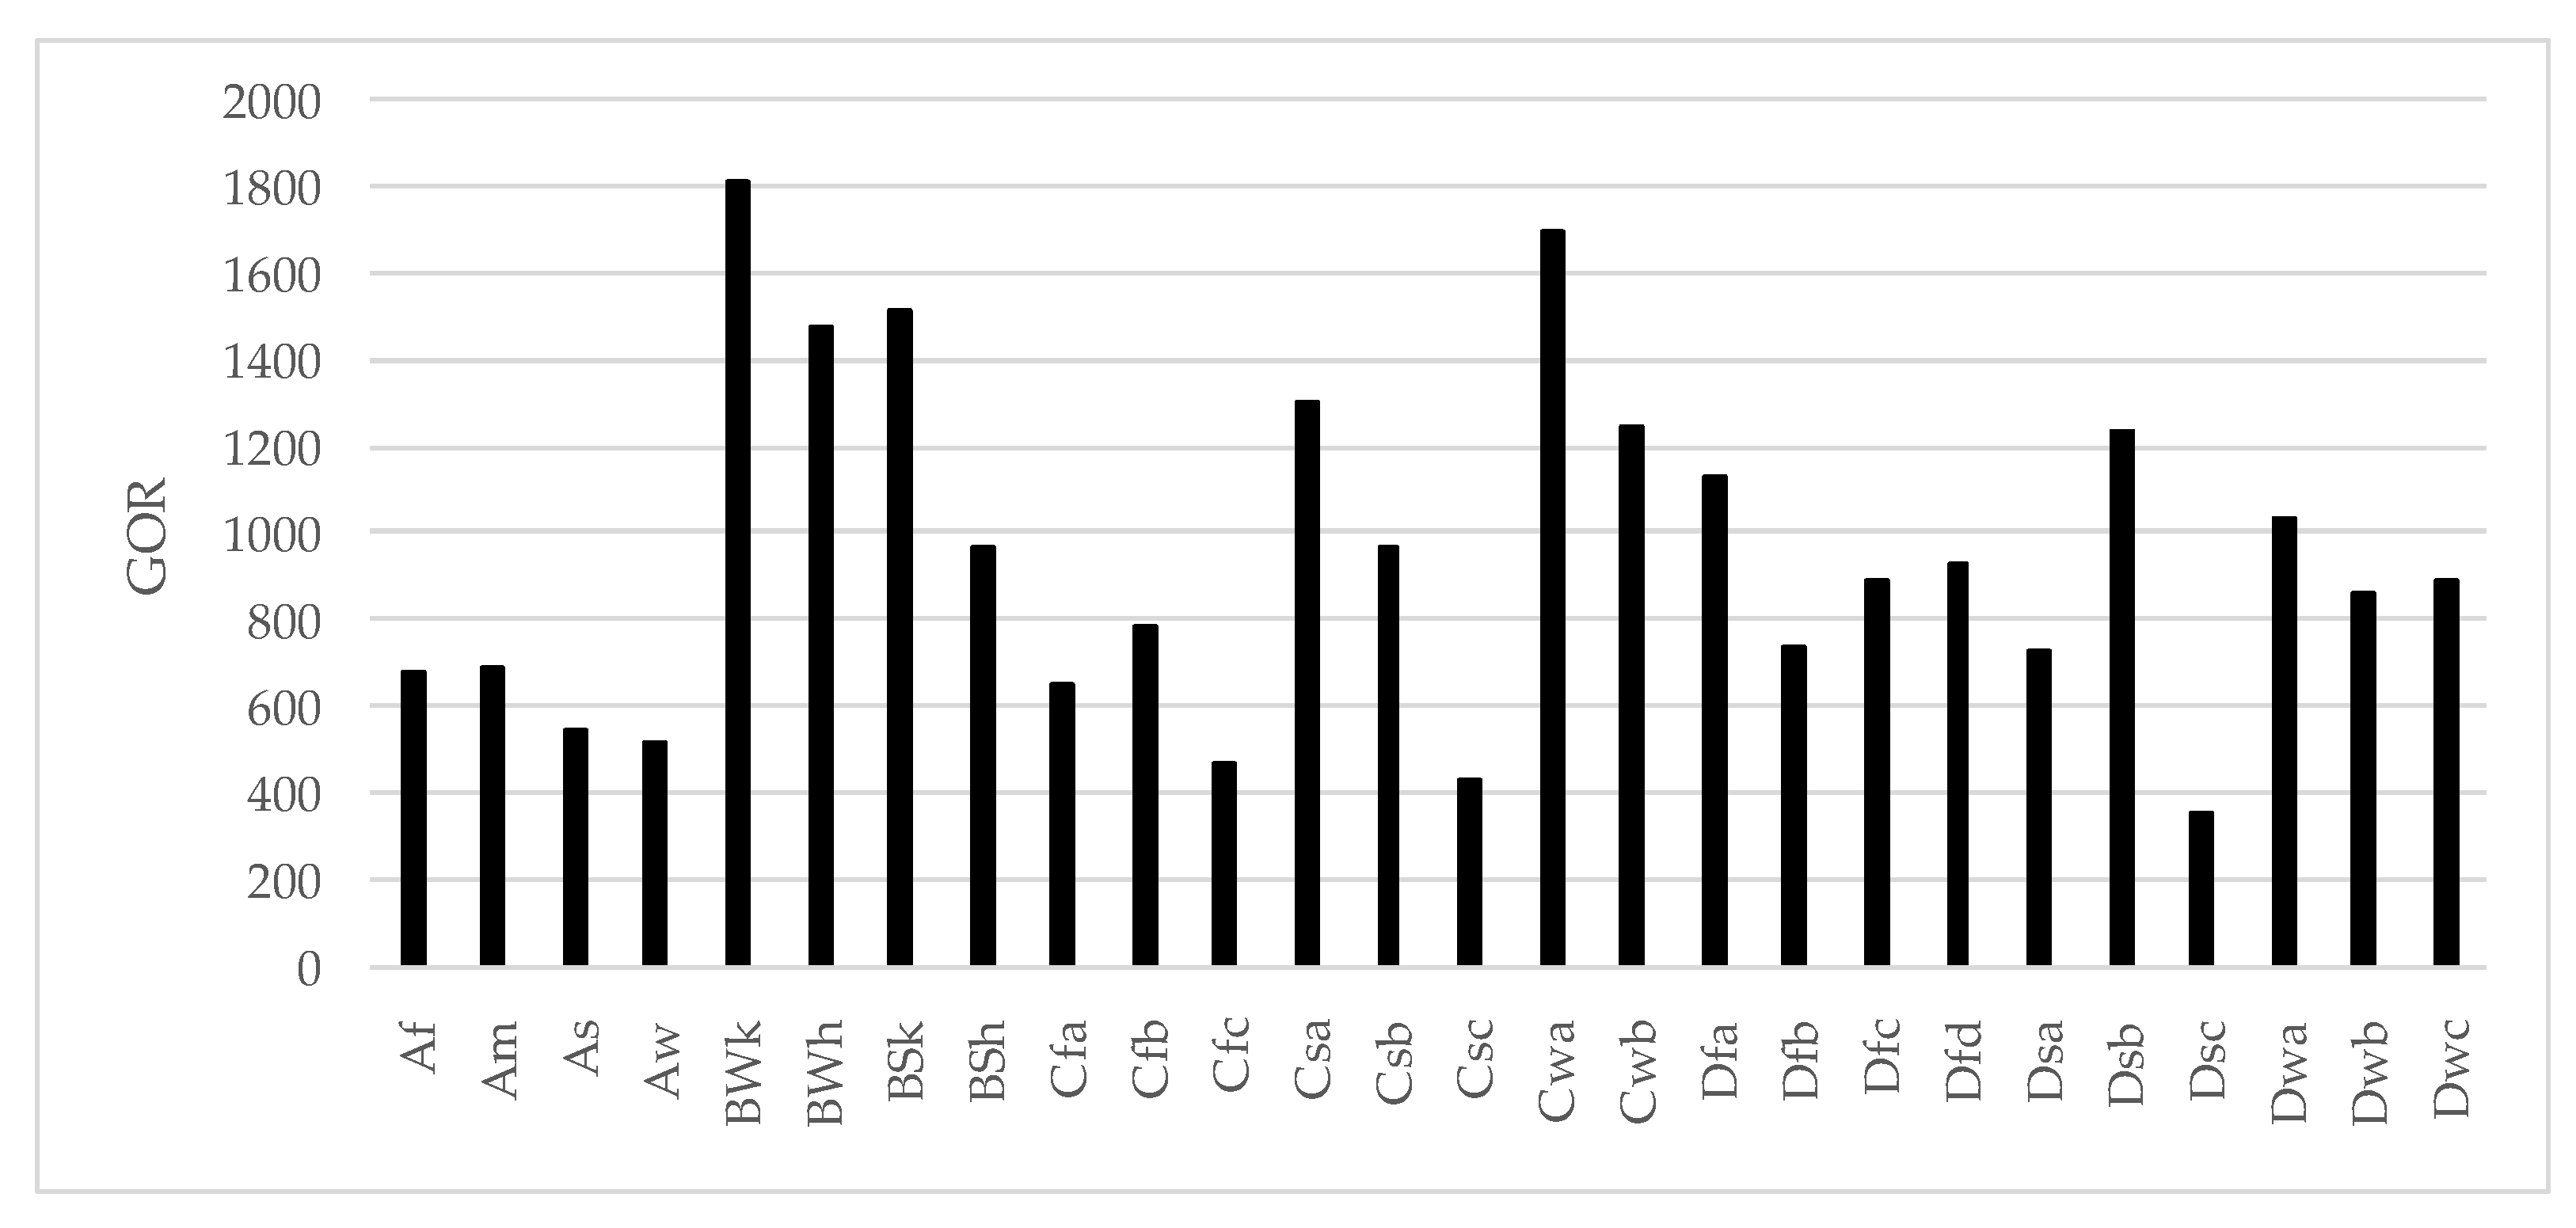
The performance indicator GOR of the DPC-WR system is calculated for different climatic conditions and presented in Figure 5. As in the case of COP, the high values of GOR, ranging from 354 to 1814, results from taking for GOR calculation only the electric power input to the fan to transport the air through the following stages of the DPC-WR system. Additionally, like COP, GOR is highest in semi-arid, hot desert, and subtropical climatic zones and lowest in tropical climatic zones. Therefore, it can be stated that low air humidity ratio and high air temperature enhance not only the cooling effectiveness but also the water recovery effectiveness of the DPC-WR. Moreover, it can be seen that GOR is greater than COP in all climatic zones. This means that more energy supplied to the system is used in the water recovery process (water evaporation and subsequent condensation) than in the cooling process. An increased share of energy used in the water recovery process is the basis of the DPC-WR system operation. Thanks to this, it is possible not only to cool the air as in a standard dew point cooling system, but also to produce such an amount of water that the DPC-WR system could be an alternative and competitive method for water recovery.
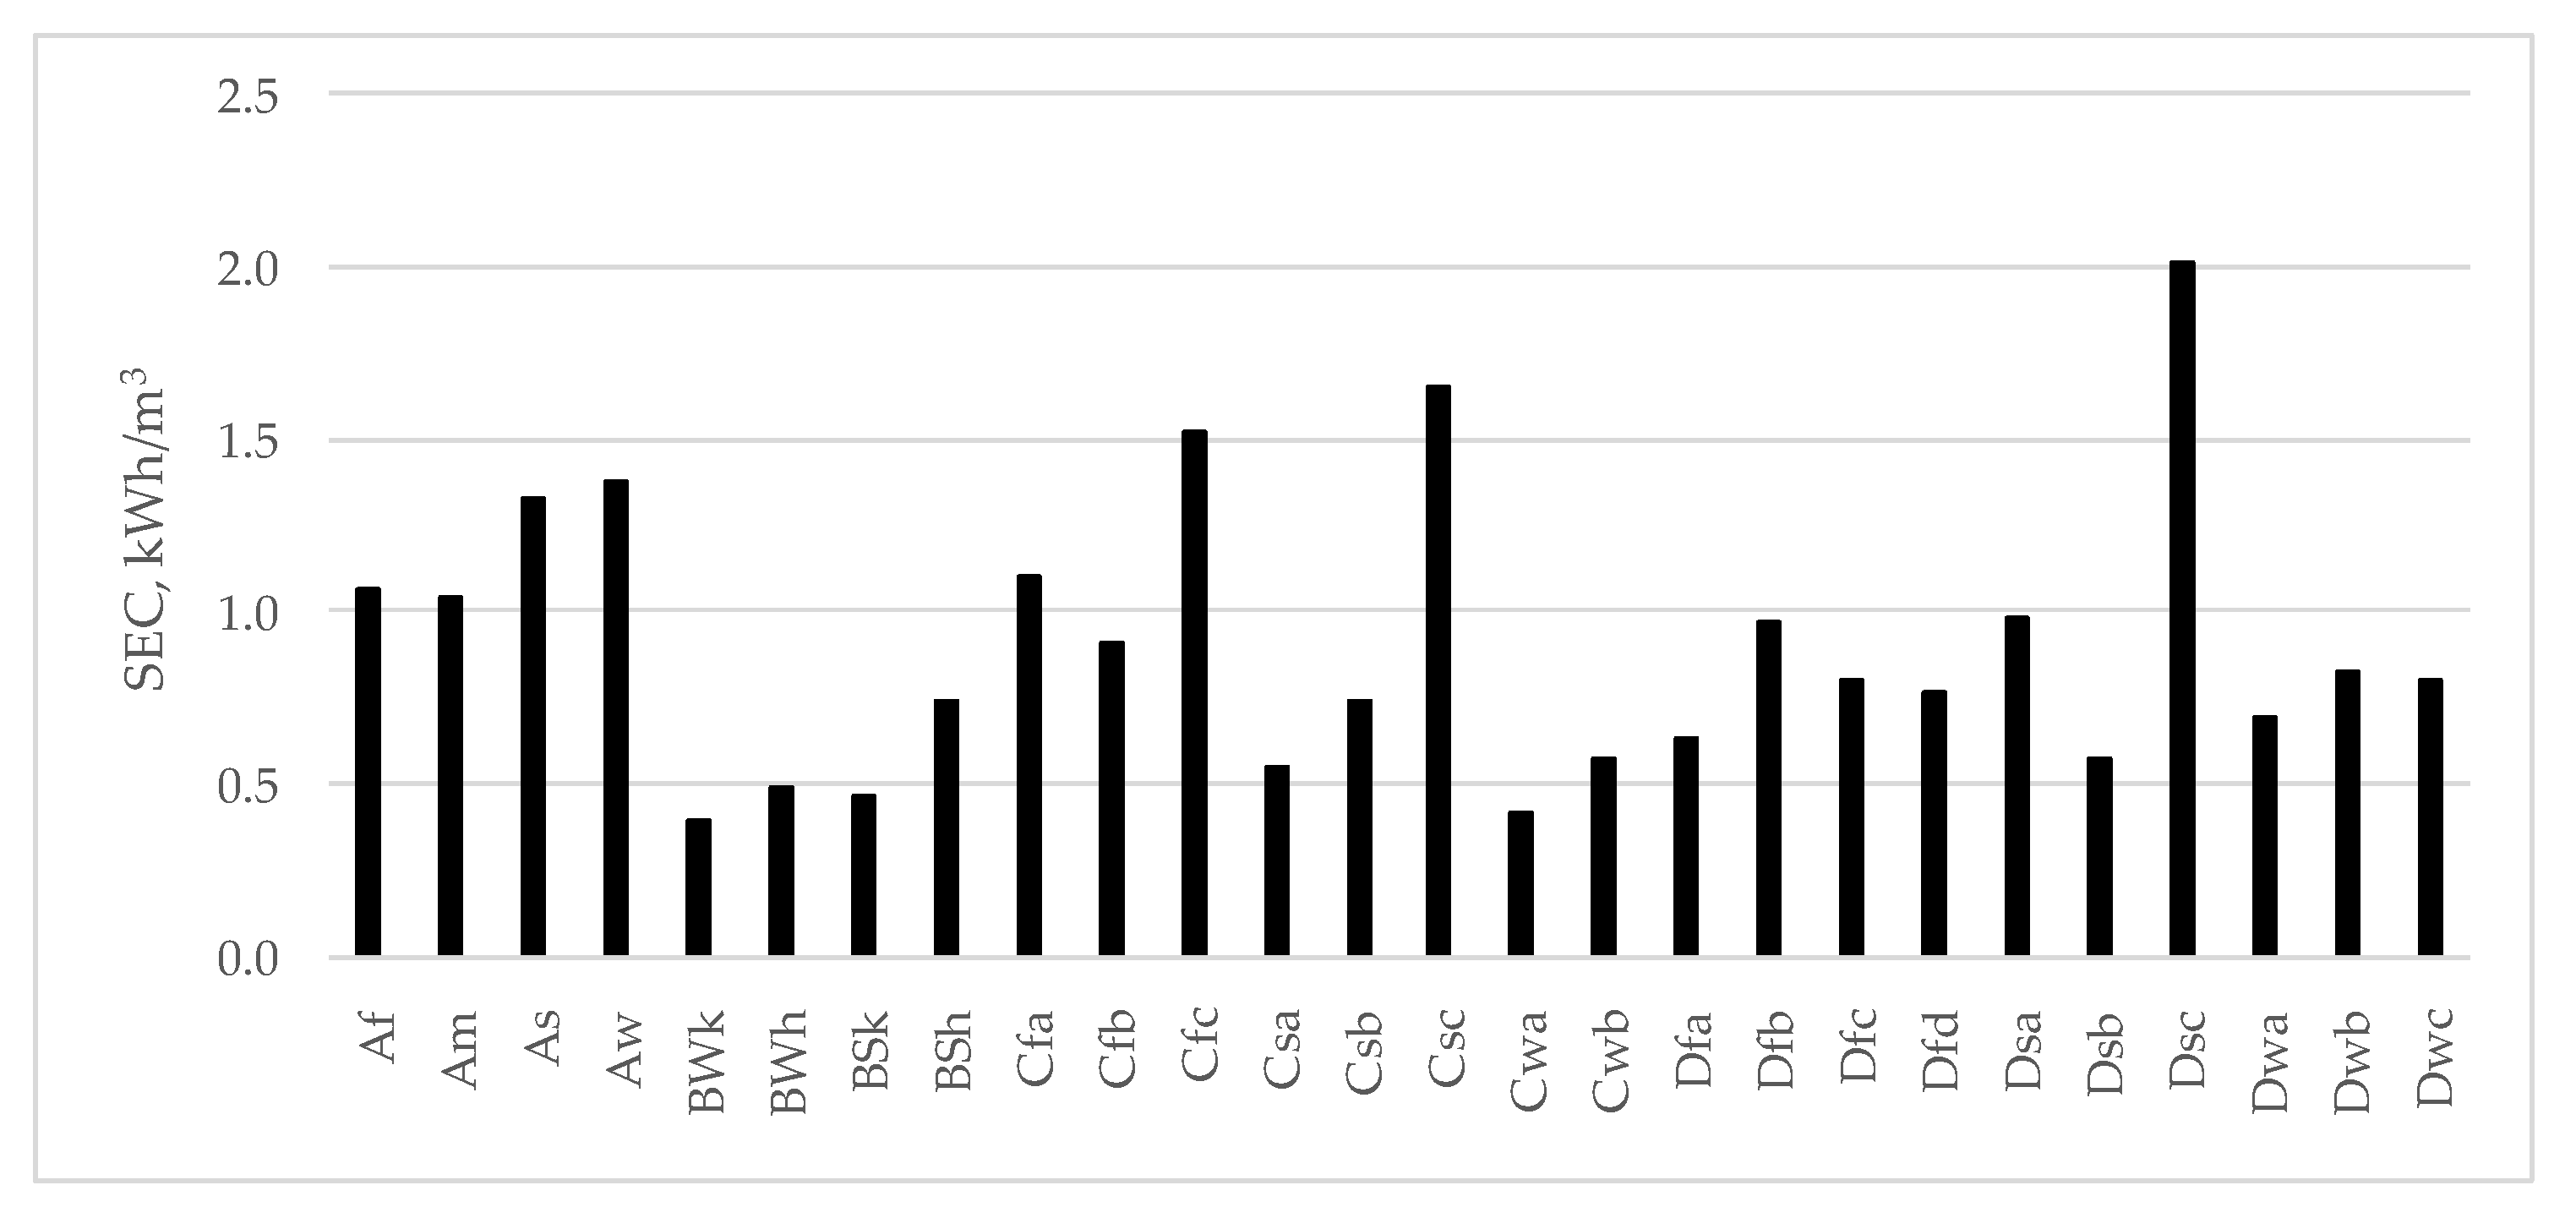
The performance indicators SEC and SDWP are calculated for different climatic conditions and presented in Figure 6 and Figure 7, respectively. It can be seen that SEC is lowest in climatic zones where COP and GOR are highest, and SEC is highest where COP and GOR are lowest. The lower the value of SEC, the less energy is required to produce 1 m3 of water, which means that in climatic zones such as semi-arid, hot desert, and subtropical, the highest DPC-WR system efficiency will be achieved. The same applies to SDWP. The highest SDWP, i.e., the highest water production per unit of air supplied to the system, is obtained in those zones where SEC is lowest, and the least where SEC was highest. One important thing to note is that SDWP is higher than 100 L/day/(kg/s) in all climatic zones. This means that even in subpolar or subarctic climatic zones, where the ambient air temperature is low, it is possible to produce no less than 100 L of water per day (from 1 kg/s of air), with an energy consumption below 2 kWh/m3. On the other hand, in the most favorable climatic zones, where both COP and GOR are highest, SDWP exceeds 600 L/day/(kg/s), with an energy consumption less than 0.5 kWh/m3.
As it can be noted, there are climatic zones where the effectiveness of the DPC-WR system will be exceptionally high. These are zones where air temperature is high and humidity ratio is low. Nevertheless, it is also important to notice that even in less favorable climatic zones where either the air temperature is low or humidity ratio is high, combined cooling and water recovery with DPC-WR is still possible with acceptable effectiveness. This is also confirmed by the EUF performance indicator calculated for different climatic zones (Table 3). The EUF value ranges from 0.76 to 0.96, with an average of 0.90. Such values of EUF prove the high efficiency of utilizing the energy supplied to the DPC-WR system and make it a promising technology that can be applied in the wide range of climatic conditions.

4. Discussion

Based on the presented analysis, it is stated that the DPC-WR system is a promising technology to be applied in the wide range of climatic conditions, and therefore, it is an interesting alternative to other water recovery or combined cooling and water recovery techniques. To understand the difference with other techniques, the DPC-WR system is compared with the commercially available water recovery methods (Table 4), the recently researched methods for combined cooling and water recovery (Table 5), and the conventional cooling methods for air-conditioning appliance (Table 6).
It can be seen that the DPC-WR system is characterized by the lowest electricity consumption among all water recovery methods (Table 4). Energy consumption of the DPC-WR system is low, even compared to thermal desalination methods such as MSF and MED, which are considered low energy-consuming. Compared to RO, the electricity consumption of the DPC-WR system is three times lower. Moreover, the operation of the DPC-WR system requires no external source of thermal energy, as most of the required energy is supplied with ambient air.
Comparison with other combined cooling and water recovery methods may be somewhat difficult due to the different methods of calculating and interpreting the performance indicators. Nevertheless, there are some clear differences between the DPC-WR system and other combined cooling and water recovery methods. It can be noticed that the EUF of the DPC-WR system is higher than that of the HDH-VAR method [12] but lower than that of the HDH-VC method [15] (Table 5). However, it is important to notice that in [15], only W ˙ n e t was taken into account for EUF calculation, so if the same is assumed for the DPC-WR system, the average value of EUF would be 1386. As for the other performance indicators, the values of COP and GOR of the DPC-WR system are significantly greater than for any other methods. As it was discussed earlier, such high values of COP and GOR result from the fact that the only external source of energy supplied to the DPC-WR system is electric energy input to the fan. This operating principle is the biggest advantage of the DPC-WR system over other combined cooling and water recovery methods.
Dew point cooling is proven a highly energy-efficient cooling method for air-conditioning appliance. Due to its low net energy consumption, dew point cooling is characterized by high COP value, which is significantly higher than for other conventional cooling methods [16,18,27]. Dew point cooling is recommended mainly for air conditioning in the building sector, due to the fact that the parameters of air subjected to the dew point cooling process are suitable for ensuring thermal comfort conditions. A standard Dew Point Cooling (DPC), and therefore, the DPC-WR system, is characterized by an almost 10 times higher COP than other conventional cooling methods like Vapor Mechanical Compression (VMC), Absorption (AB) cooling, Adsorption (AD) cooling, or Thermoelectric Cooling (TEC) (Table 6). DPC, and thus the DPC-WR system, has many advantages over other conventional cooling methods i.e., low energy consumption, utilization of renewable psychrometric energy, high durability, or low failure rate due to the limited number of moving parts. However, DPC is not without some limitations, i.e., it is highly dependent on ambient air parameters, it has low effectiveness in humid climates, and has larger dimensions than other cooling methods.

5. Conclusions

The idea of the DPC-WR system is to utilize the dew point cooling phenomenon implemented in two stages in order to obtain both air cooling and water recovery. The system performance is described by different indicators calculated for various climatic zones using a validated analytical model based on the convective heat transfer coefficient.
It is concluded that the DPC-WR system can achieve the COP and GOR values, being an order of magnitude higher than for other cooling and water recovery technologies. The highest COP and GOR values are noted in semi-arid, hot desert, and subtropical climatic zones, which are characterized either by high air temperature or by low humidity ratio, or by both. On the other hand, the lowest COP and GOR values are noted in tropical climatic zones, which are characterized by the high air humidity ratio.
The SEC value for the DPC-WR system ranges from 0.5 to 2.0 kWh/m3 and the SDWP value ranges from 100 to 600 L/day/(kg/s). It is stated that SEC and SDWP are most favorable in climatic zones where COP and GOR are highest, and respectively, SEC and SDWP are least favorable where COP and GOR are lowest.
Performed analyses proved that there are climatic zones where the effectiveness of the DPC-WR system will be exceptionally high. Nevertheless, it was also proved that even in less favorable climatic zones where either air temperature is low or humidity ratio is high, combined cooling and water recovery is still possible with acceptable effectiveness (COP > 100, GOR > 100, SEC < 2.0 kWh/m3, SDWP > 100 L/day/(kg/s), and average EUF = 0.90).
The proposed DPC-WR system requires future research and development, which include the full-scale prototype construction. One of the limitations that needs to be addressed is the use of proper materials that allow for effective distribution of water in the secondary channels, and for intensive removal of condensed water from the primary channels. Future research will also address the optimization of the DPC-WR system in order to obtain the most suitable operating parameters for the conditions in which the system will be used. So far, the research carried out shows that the DPC-WR system is a promising technology for combined cooling and water recovery that can be applied in various climatic zones. Moreover, the DPC-WR system is a modular technology, which means that it is suitable for micro, small, and large applications. By multiplying the system modules as needed, any cooling or water recovery capacity can be achieved without affecting the system effectiveness.

6. Patents

The patent application related to the work reported in this manuscript is P.435787 “Water treatment unit.”

Author Contributions

Conceptualization, A.C.; methodology, A.C.; software, A.C.; validation, W.W.; formal analysis, W.W.; investigation, A.C.; resources, A.C.; data curation, W.W.; writing—original draft preparation, A.C.; writing—review and editing, W.W.; visualization, A.C.; supervision, A.C.; project administration, A.C. All authors have read and agreed to the published version of the manuscript.

Funding

This research was funded by Polish National Centre for Research and Development, program Lider X, agreement number U/0180/666/2019.

Institutional Review Board Statement

Not applicable.

Informed Consent Statement

Not applicable.

Data Availability Statement

The data presented in this study are available on request from the corresponding author.

Conflicts of Interest

The authors declare no conflict of interest.

Nomenclature

cpkJ/(kg·K)moist air specific heat capacity
Rhmhydraulic radius
f-coefficient of fluid friction
Gkg/smass flow rate
Lmchannel length
Le-Lewis factor
Mkg/smass transfer rate of water vapor
NnetkWhelectric energy input
NTU-number of transfer units
ΔpPapressure drop
Q ˙ kWheat transfer rate
Re-Reynolds number
t°Ctemperature
um/smean velocity
V ˙ m3/svolume flow rate of air
W ˙ n e t kWelectric power input
xkg/kgmoist air humidity ratio
Xmcoordinate along the product airflow direction
X ¯ -relative X coordinate
Ymcoordinate perpendicular to the primary airflow direction
η-fan efficiency
νm2/skinematic viscosity
ρakg/m3density of air
Subscripts:
related to the air–plate or air/water interface
related to the plate surface
1 related to the primary channels in the 1st stage of the DPC-WR system
2 related to the secondary channels in the 1st stage of the DPC-WR system
3 related to the primary channels in the 2nd stage of the DPC-WR system
4 related to the secondary channels in the 2nd stage of the DPC-WR system
i inlet
L latent heat
o outlet
p plate
S sensible heat
T total heat
w water
Y related to coordinate perpendicular to the primary airflow direction

References

  1. International Energy Agency. Transition to Sustainable Buildings Strategies and Opportunities to 2050; OECD/IEA: Paris, France, 2013. [Google Scholar]
  2. Greve, P.; Kahil, T.; Mochizuki, J.; Schinko, T.; Satoh, Y.; Burek, P.; Fischer, G.; Tramberend, S.; Burtscher, R.; Langan, S.; et al. Global assessment of water challenges under uncertainty in water scarcity projections. Nat. Sustain. 2018, 1, 486–494. [Google Scholar] [CrossRef]
  3. International Energy Agency. The Future of Cooling; IEA: Paris, France, 2018. [Google Scholar]
  4. Wada, Y.; Flörke, M.; Hanasaki, N.; Eisner, S.; Fischer, G.; Tramberend, S.; Satoh, Y.; van Vliet, M.T.H.; Yillia, P.; Ringler, C.; et al. Modeling global water use for the 21st century: The Water Futures and Solutions (WFaS) initiative and its approaches. Geosci. Model Dev. 2016, 9, 175–222. [Google Scholar] [CrossRef] [Green Version]
  5. Al-Karaghouli, A.; Kazmerski, L.L. Energy consumption and water production cost of conventional and renewable-energy-powered desalination processes. Renew. Sustain. Energy Rev. 2013, 24, 343–356. [Google Scholar] [CrossRef]
  6. Shahzad, M.W.; Burhan, M.; Ang, L.; Ng, K.C. Energy-water-environment nexus underpinning future desalination sustainability. Desalination 2017, 413, 52–64. [Google Scholar] [CrossRef]
  7. Heidary, B.; Tavakoli Hashjin, T.; Ghobadian, B.; Roshandel, R. Optimal integration of small scale hybrid solar wind RO-MSF desalination system. Renew. Energy Focus 2018, 27, 120–134. [Google Scholar] [CrossRef]
  8. Azimibavil, S.; Dehkordi, A.J. Dynamic simulation of a multi-effect distillation (MED) process. Desalination 2016, 392, 91–101. [Google Scholar] [CrossRef]
  9. Campione, A.; Cipollina, A.; Calise, F.; Tamburini, A.; Galluzzo, M.; Micale, G. Coupling electrodialysis desalination with photo-voltaic and wind energy systems for energy storage: Dynamic simulations and control strategy. Energy Convers. Manag. 2020, 216, 112940. [Google Scholar] [CrossRef]
  10. Zheng, J.; Yang, M. Experimental investigation on novel desalination system via gas hydrate. Desalination 2020, 478, 114284. [Google Scholar] [CrossRef]
  11. Skuse, C.; Gallego-Schmid, A.; Azapagic, A.; Gorgojo, P. Can emerging membrane-based desalination technologies replace reverse osmosis? Desalination 2020, 500, 114844. [Google Scholar] [CrossRef]
  12. Chiranjeevi, C.; Srinivas, T. Combined two stage desalination and cooling plant. Desalination 2014, 345, 56–63. [Google Scholar] [CrossRef]
  13. Qasem, N.A.A.; Zubair, S.M. Performance evaluation of a novel hybrid humidification-dehumidification (air-heated) system with an adsorption desalination system. Desalination 2019, 461, 37–54. [Google Scholar] [CrossRef]
  14. Naeimi, A.; Nowee, S.M.; Amiri, H.A.A. Numerical simulation and theoretical investigation of a multi-cycle dual-evaporator adsorption desalination and cooling system. Chem. Eng. Res. Des. 2020, 156, 402–413. [Google Scholar] [CrossRef]
  15. Anand, B.; Murugavelh, S. Performance analysis of a novel augmented desalination and cooling system using modified vapor compression refrigeration integrated with humidification-dehumidification desalination. J. Clean. Prod. 2020, 255, 120224. [Google Scholar] [CrossRef]
  16. Xu, P.; Ma, X.; Zhao, X.; Fancey, K. Experimental investigation of a super performance dew point air cooler. Appl. Energy 2017, 203, 761–777. [Google Scholar] [CrossRef]
  17. Dizaji, H.S.; Hu, E.J.; Chen, L. A comprehensive review of the Maisotsenko-cycle based air conditioning systems. Energy 2018, 156, 725–749. [Google Scholar] [CrossRef] [Green Version]
  18. Mahmood, M.H.; Sultan, M.; Miyazaki, T.; Koyama, S.; Maisotsenko, V.S. Overview of the Maisotsenko cycle—A way towards dew point evaporative cooling. Renew. Sustain. Energy Rev. 2016, 66, 537–555. [Google Scholar] [CrossRef]
  19. Chen, Q.; Burhan, M.; Shahzad, M.W.; Ybyraiymkul, D.; Akhtar, F.H.; Ng, K.C. Simultaneous production of cooling and freshwater by an integrated indirect evaporative cooling and humidification-dehumidification desalination cycle. Energy Convers. Manag. 2020, 221, 113169. [Google Scholar] [CrossRef]
  20. Pandelidis, D.; Cichoń, A.; Pacak, A.; Drąg, P.; Drąg, M.; Worek, W.; Cetin, S. Water desalination through the dew point evaporative system. Energy Convers. Manag. 2021, 229, 113757. [Google Scholar] [CrossRef]
  21. Anisimov, S.; Pandelidis, D. Numerical study of the Maisotsenko cycle heat and mass exchanger. Int. J. Heat Mass Transf. 2014, 75, 75–96. [Google Scholar] [CrossRef]
  22. Anisimov, S.; Pandelidis, D. Theoretical study of the basic cycles for indirect evaporative air cooling. Int. J. Heat Mass Transf. 2015, 84, 974–989. [Google Scholar] [CrossRef]
  23. Chudnovsky, Y.; Kozlov, A. Integrated Industrial Wastewater Reuse via Heat Recovery; PIR-09-004; California Energy Commission: Sacremento, CA, USA, 2014.
  24. Thirumaleshwar, M. Fundamentals of Heat and Mass Transfer; Pearson India: Chennai, Tamil Nadu, India, 2009. [Google Scholar]
  25. Peel, M.C.; Finlayson, B.L.; Mcmahon, T.A. Updated world map of the Köppen-Geiger climate classification. Hydrol. Earth Syst. Sci. 2007, 4, 439–473. [Google Scholar]
  26. American Society of Heating. ASHRAE Handbook-Fundamentals; Refrigerating and Air-conditioning Engineers Inc.: Atlanta, GA, USA, 2013. [Google Scholar]
  27. Duan, Z.; Zhan, C.; Zhang, X.; Mustafa, M.; Zhao, X.; Alimohammadisagvand, B.; Hasan, A. Indirect evaporative cooling: Past, present and future potentials. Renew. Sustain. Energy Rev. 2012, 16, 6823–6850. [Google Scholar] [CrossRef]
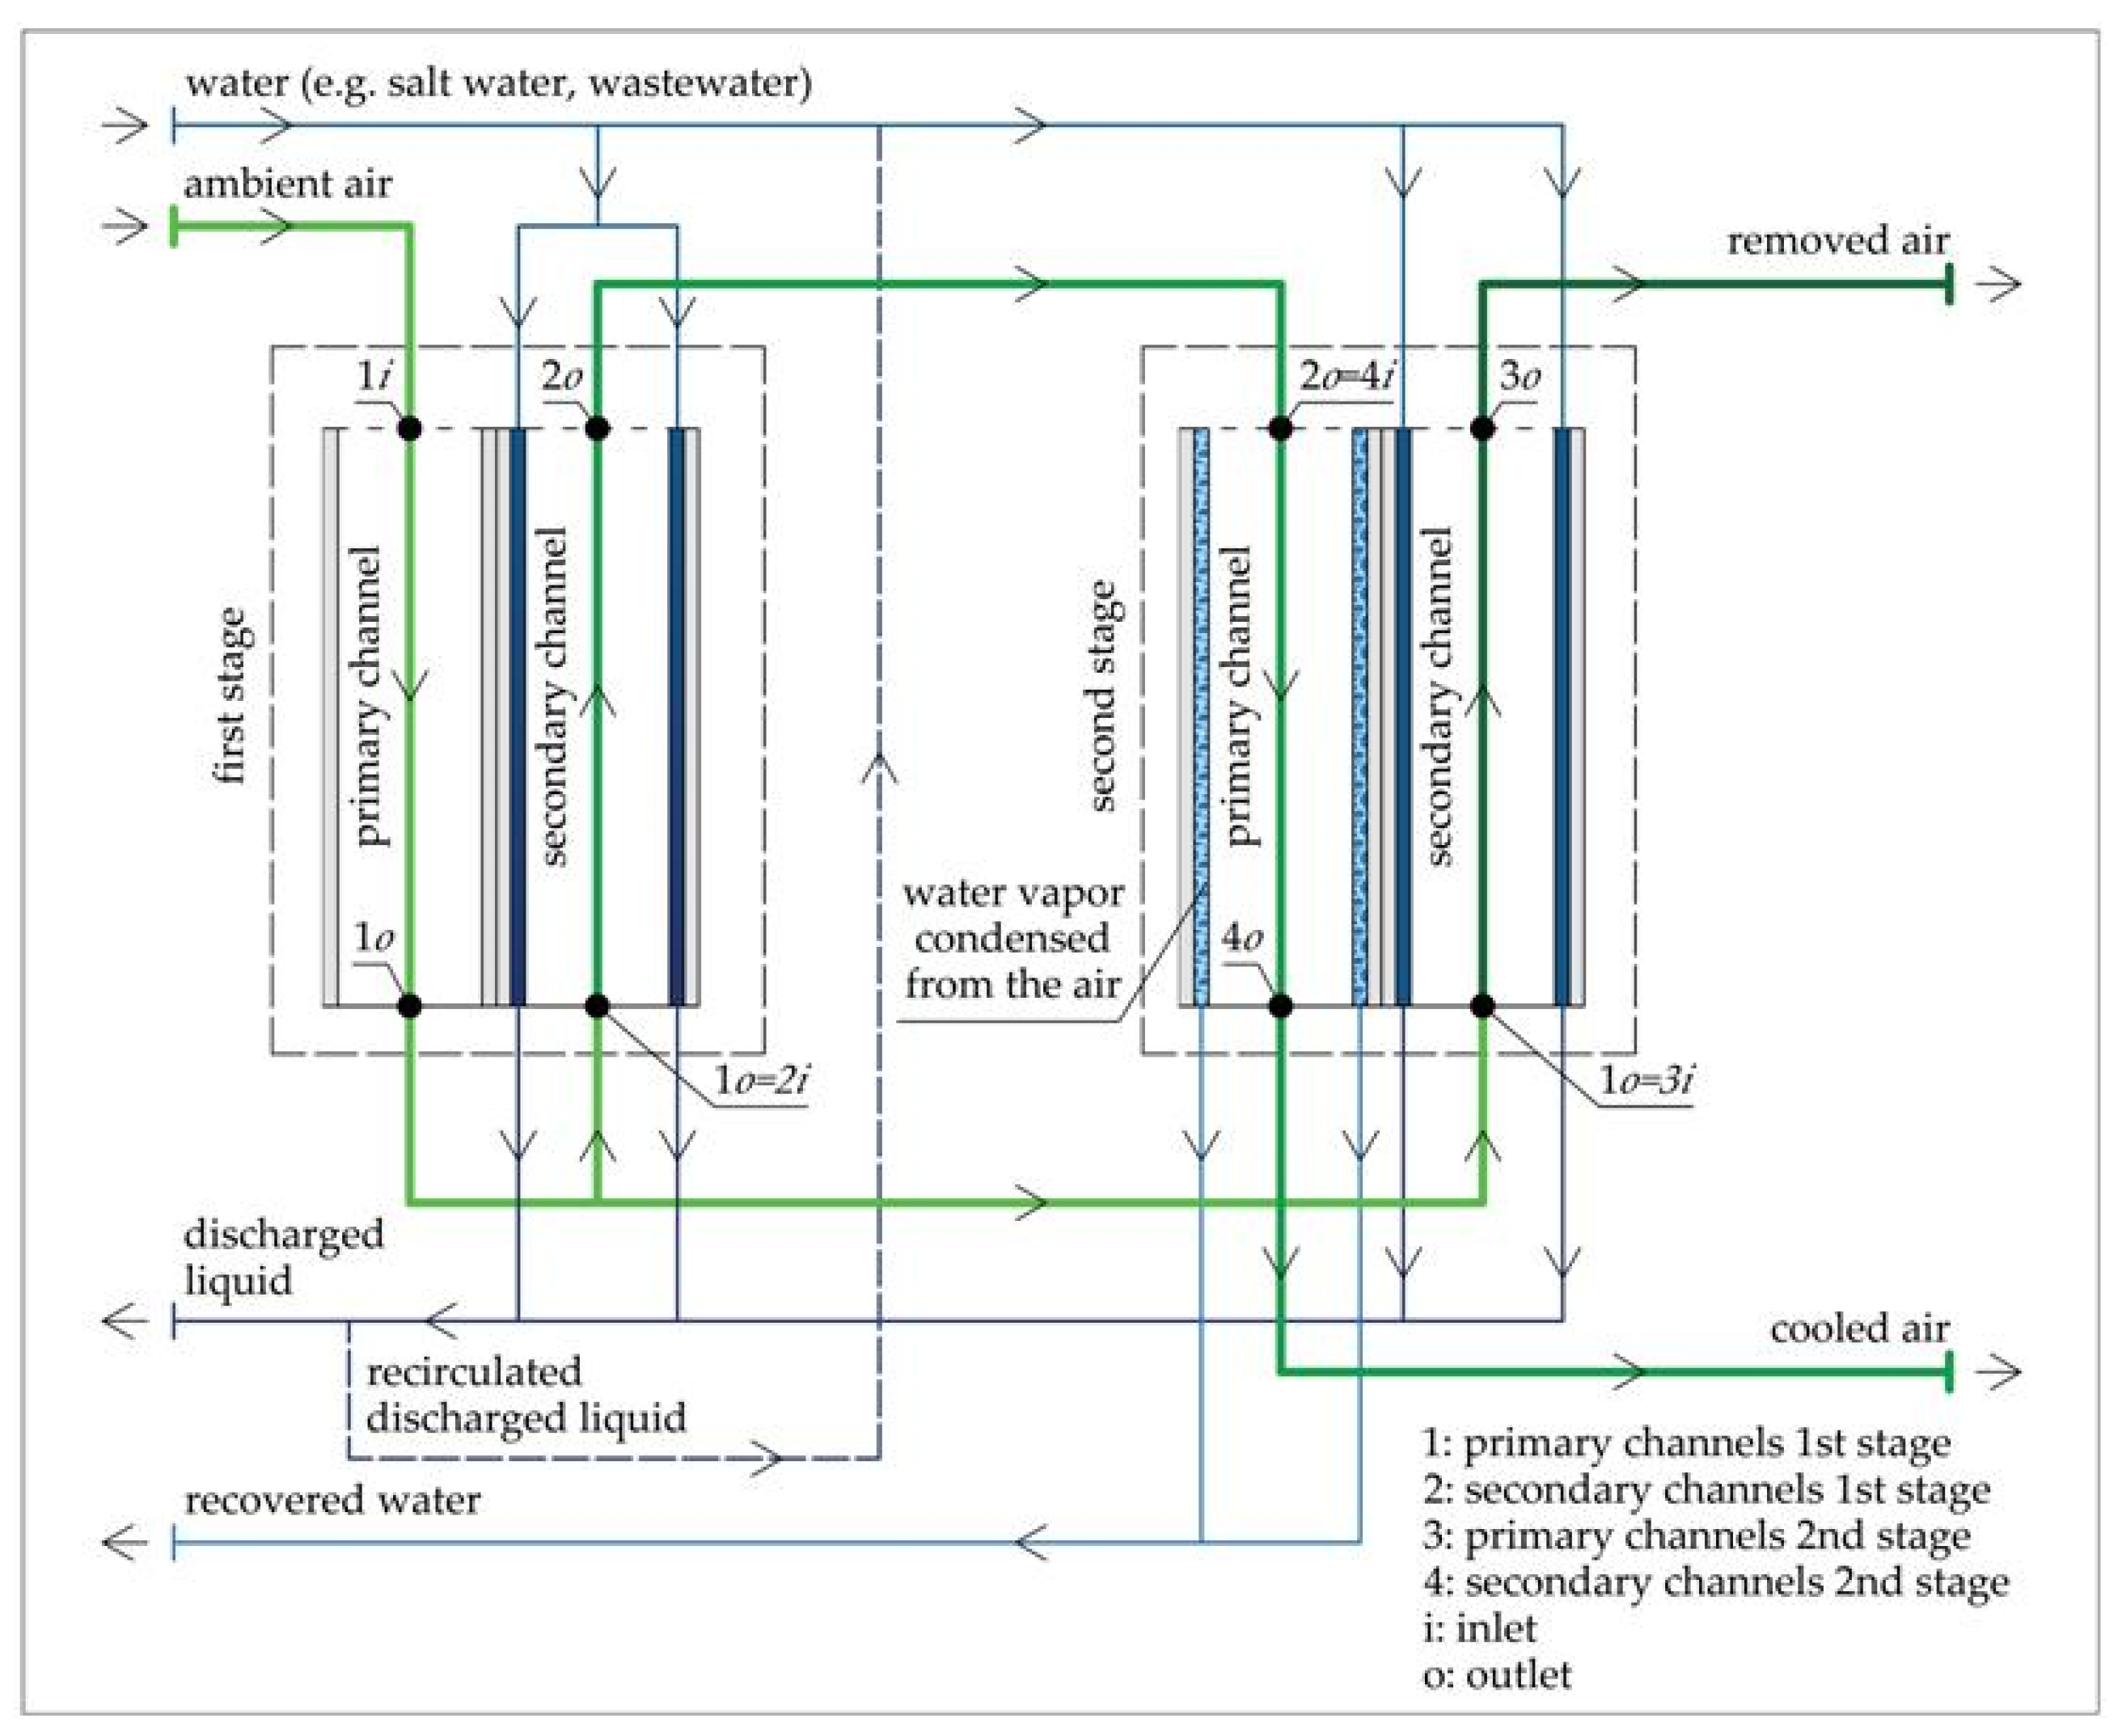
Figure 1. Scheme of the single module of the Dew Point Cooling and Water Recovery (DPC-WR) system.
Applsci 11 01481 g001
Figure 2. Scheme and operating principles of the test station at the Gas Technology Institute (GTI) laboratory [23].
Applsci 11 01481 g002
Figure 3. Validation of the mathematical model of the DPC-WR system: (a) Validation of the exhaust air temperature; (b) Validation of the exhaust air relative humidity.
Applsci 11 01481 g003
Figure 4. Performance indicator coefficient of performance (COP) calculated for different climatic zones [25].
Applsci 11 01481 g004
Figure 5. Performance indicator gained output ratio (GOR) calculated for different climatic zones [25].
Applsci 11 01481 g005
Figure 6. Performance indicator specific energy consumption (SEC) calculated for different climatic zones [25].
Applsci 11 01481 g006
Figure 7. Performance indicator specific daily water production (SDWP) calculated for different climatic zones [25].
Applsci 11 01481 g007
Table 1. Operating parameters at the test station GTI laboratory [23].
Parameters1st Case2nd Case3rd Case
Volume flow rate of ambient air, m3/h340340455
Inlet temperature of ambient air, °C20.618.326.1
Inlet relative humidity of ambient air, %233369
Table 2. Geometrical parameters of the DPC-WR module.
Parameter1st Stage 2nd Stage
Length, m0.500.50
Width, m2.301.00
Height, m2.301.25
Channel height, m0.0040.004
Wall thickness, m0.00030.0003
Heat exchange surface, m2581145
Number of primary channels253145
Table 3. Climatic parameters defined by design conditions by ASHRAE [26] and performance indicator energy utilization factor (EUF) calculated for different climate zones [25].
SymbolClimatic ZoneLatitudeLongitudet
°C
x
g/kg
EUF
AfTropical rainforest1.37 N103.92 E33.218.90.90
AmTropical monsoon25.82 N80.3 W32.717.30.94
AsTropical savanna, dry21.98 N159.34 W29.116.00.87
AwTropical savanna, wet10.60 N66.98 W33.121.30.89
BWkHot semi-arid33.42 N36.52 E38.04.90.95
BWhCold semi-arid30.10 N31.18 E36.99.80.89
BSkHot deserts39.75 N104.87 W32.93.90.95
BShCold desert34.57 N32.97 E33.313.50.89
CfaHumid subtropical34.57 S58.42 W29.814.70.93
CfbTemperate oceanic51.52 N0.1 W26.29.00.88
CfcSubpolar oceanic37.00 S174.80 E24.311.90.89
CsaHot-summer Mediterranean38.52 N27.02 E35.210.20.95
CsbWarm-summer Mediterranean33.97 S18.60 E29.29.40.94
CscCool-summer Mediterranean29.92 S71.2 W21.39.80.90
CwaM-i 1, humid subtropical28.58 N77.20 E40.710.10.91
CwbSubtropical highland19.43 N99.13 W27.93.90.90
DfaHot-summer humid continental19.43 N99.13 W32.510.40.89
DfbWarm-summer humid continental19.43 N99.13 W24.98.20.89
DfcSubarctic64.82 N147.86 W25.76.70.90
DfdExtremely cold subarctic62.02 N129.72 E28.29.00.90
DsaHot, dry-summer continental42.85 N74.53 E33.77.50.75
DsbWarm, dry-summer continental39.75 N37.02 E30.57.10.89
DscDry-summer subarctic59.65 N151.48 W17.37.60.88
DwaM-i 1, warm-summer humid continental39.93 N116.28 E33.212.70.95
DwbM-i 1, subarctic52.27 N104.32 E26.88.70.89
DwcM-i 1, extremely cold subarctic53.47 N122.40 E28.59.50.87
1 M-i—monsoon-influenced.
Table 4. DPC-WR system comparison with other water recovery methods [5].
Water Recovery MethodDPC-WRROMSFMED
Electric energy consumption, kWh/m30.5–2.04–62.5–52–2.5
Heat source requirednonoyesyes
Thermal energy consumption, kWh/m3nonenone15.8–23.512.2–19.1
Table 5. DPC-WR system comparison with other combined cooling and water recovery methods.
Combined Cooling
and Water Recovery Method
DPC-WRHDH-VAR
[12]
HDH-AD
[13]
HDH-VC
[15]
IEC-HDH
[19]
Energy Utilization Factor (EUF)0.76–0.960.58N/A8.27N/A
Coefficient of Performance (COP)138–768N/A>0.452.162.1–2.5
Gained Output Ratio (GOR)354–1814N/A>7.66.111.6–2.5
Table 6. DPC-WR system comparison with other cooling methods for air-conditioning appliance [16,18,27].
Cooling Method
for Air-Conditioning Appliance
DPC-WRDPCVMCAB/ADTEC
Coefficient of Performance (COP)138–768>502–40.6–1.20.2–1.2
Publisher’s Note: MDPI stays neutral with regard to jurisdictional claims in published maps and institutional affiliations.