
Emergency Repair Scheduling Model for Road Network Integrating Rescheduling Feature


Abstract
1. Introduction
2. Literature Review
- Total destruction, if the road embankment needs to be reconstructed.
- Partial damage, if the road section is closed for road surface repairs or minor stabilization of the road embankment.
- Only sedimentation on the road surface that does not require any repair work.
3. Methodology
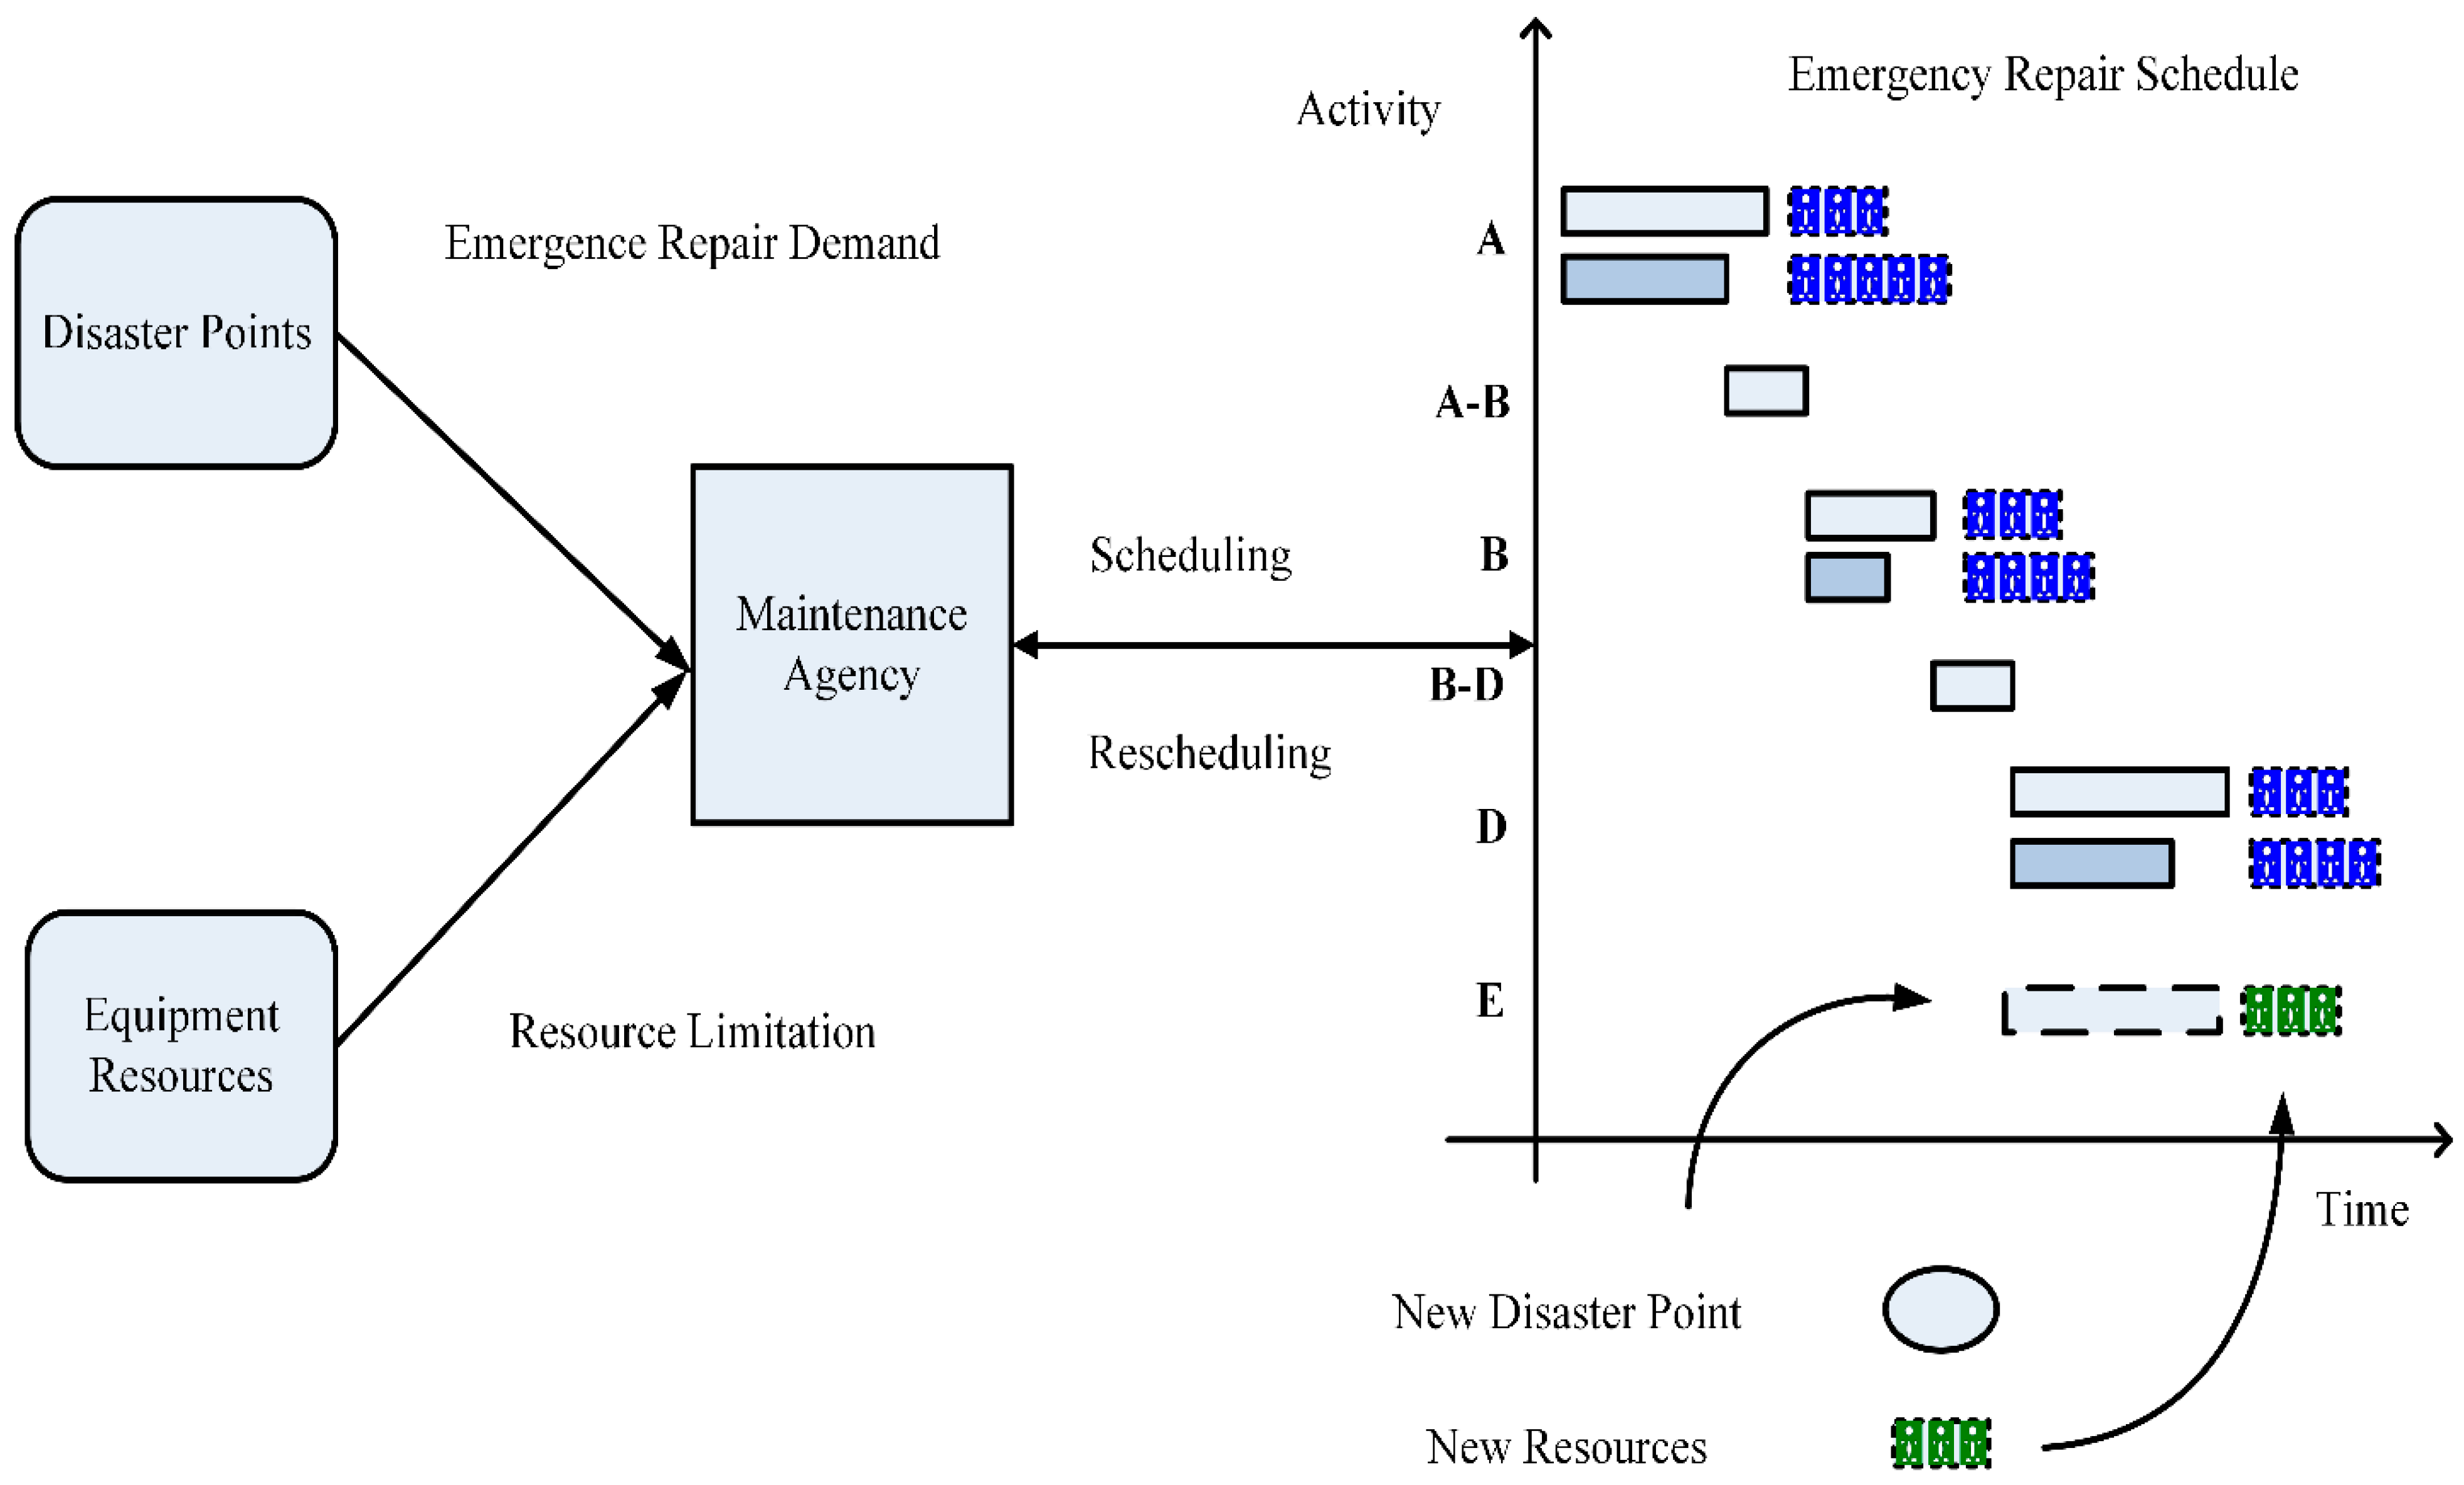
3.1. Model Concept
3.2. Model Description and Assumptions
- (1)
- The emergency repair scheduling problem in this study defines damaged road sections as repair activities, and the traveling routes of equipment resources between resource and disaster points as transit activities; thus, the equipment resources required for each repair activity are dispatched through transit activities.
- (2)
- Since the damage caused by a major natural disaster can be widely distributed, this study assumes that the decision maker of a maintenance unit, when planning emergency repair works for road sections, will appropriately delineate the scope of repair works within the unit’s area of responsibility based on the location of its equipment resources and the location of each damaged road section.
- (3)
- The disaster information usually includes the geographical location of the disaster point, the volume of disaster treatment, the type of equipment resources required for recovery, and the maximum resource capacity of the disaster point at the same time due to space limitations. The repair activity defined in this study is excavation work for rockfall and debris slides at the disaster point. It assumes that all the necessary parameters for emergency repair scheduling have been collected through proper sources.
- (4)
- After a disaster, the main routes of a road network are prioritized by disaster-related vehicles, so this study assumes that the travel time of equipment resources traveling to the damaged road sections is known and the shortest, and is not affected by traffic flow or other factors. It is assumed that equipment resources, such as excavators and bulldozers, are transported to the disaster points by trailers. The major equipment resources considered here are excavators and bulldozers, which are the controlling resources of construction productivity for the problem domain of road network repair; other resources, such as workers and dump trucks, are assumed to be able to be provided upon request.
- (5)
- In this study, it is assumed that the disaster points are completely blocked and impassable until the repair work is completed, but in order to meet the actual demand for disaster relief, the repair work of each disaster point is assumed to be performed in such a way that vehicles can pass. The movement of equipment resources occurs only in the following two situations: (1) from the location where the resources are located to the disaster location; and (2) after the completion of repair activity at one disaster location, to another disaster location to perform repairs.
- (6)
- Once a repair activity for a disaster point begins, the resources cannot leave the disaster point or go to another disaster point for support, and repair activities cannot accept other resources to join the in-process repair work. Due to the emergency nature of the repair activity, it is assumed that all repair activities and transit activities are not allowed to be interrupted.
3.3. Model Formulation
- Objective function
- Constraints
3.4. Project Duration Calculation
- (1)
- Total project duration of all emergency repair activities.The objective function is to minimize repair project total duration, shown as Equation (1). Equation (2) indicates that the total duration of the project is the end of the repair work at the last completed disaster point in the emergency repair project.
- (2)
- Finish time of repair activity.Equation (3) indicates that the finish time of repair activity at the disaster point is the sum of activity start time and selected activity duration.
- (3)
- Finish time of transit activity.Finish time of transit activity is the sum of activity start time and transit activity duration. Transit activities can be divided into two categories: the first group—the ones traveling from the resource point to the disaster point; the second group—the ones traveling from the preceding disaster point to the succeeding disaster point. Therefore, the restrictions for each category are made separately as Equations (4) and (5).
- (4)
- Transit activity execution.If a specific transit activity is selected for resource dispatching, the number of equipment resources is greater than zero (i.e., this transit activity is really in execution status), then the duration of this transit activity is equal to the corresponding duration ltnj/ltij; otherwise, it is not executed and its corresponding duration should be equal to zero, where such logical expression is shown as Equations (6) and (7) separately for two categories of transit activities.
3.5. Activity Precedence Relationship
- (1)
- Relationship among repair activities.This study investigates the emergency repair issue from a scheduling perspective. Since the emergency repair work is quite urgent, this model assumes that all emergency repair works are completed at the disaster point and equipment resources are then immediately transported to the next disaster point through the connecting transit activity, and emergency repair work at the succeeding disaster point starts immediately after the arrival of the resources, which is the FS (finish–start) relationship in the scheduling precedence relationships, shown as Equation (8).
- (2)
- Relationship between repair activity and transit activity.Since resource transit can be further divided into two situations, such as transit from the resource point to the disaster point and transit from one disaster point to another disaster point, the relationship between transit activity and repair activity is showed as Equations (9) and (10), respectively.
3.6. Resource Limitation
- (1)
- Resource total quantity.Due to the limited amount of equipment resources, the number of resources used in repair work for each disaster point must be within the upper limit of the available amount of all types of resources. Equation (11) describes such constraints.The total number of resources used for all repair activities in-progress must be within the resource limit of each resource type k at unit time t. Equation (12) describes such constraints.
- (2)
- Resource dispatching consistency.Complying with the rule of meeting the maximum number of resource dispatching from the resource point (or the preceding repair activity) to the succeeding repair activity equipment resources, the number of dispatching resources for all transit activities must be within the maximum number of resources of each resource type k, which is shown as Equations (13) and (14), respectively.In order to further confirm the quantity of equipment resources dispatched for repair activities, the sum of the resource amount dispatched and remaining after the dispatch should be equal to the amount as before the dispatch, which is shown as Equation (15).
- (3)
- Resource receiving consistency.Equipment resources are dispatched from preceding repair activities or resource points. Therefore, the quantity of resources received by any repair activity must be equal to the sum of resource quantity transited from the preceding disaster points or resource points, which is shown as Equation (16).
- (4)
- Resource limitation due to specific restrictions of different disaster points.Each damaged road section has the maximum number of resources that can be accommodated at the same time during the execution of its own repair activity, due to site or terrain restrictions, so the number of resources at each disaster point must be constrained by the defined upper limit, shown as Equation (17).
3.7. Constraints for Special Restrictions
- (1)
- Specify the latest start time of repair activity i.
- (2)
- Specify the latest finish time of repair activity i.
- (3)
- Responsibility area.
4. Case Analysis and Discussion
4.1. Responsibility Area
4.2. New Disaster Points and Resources
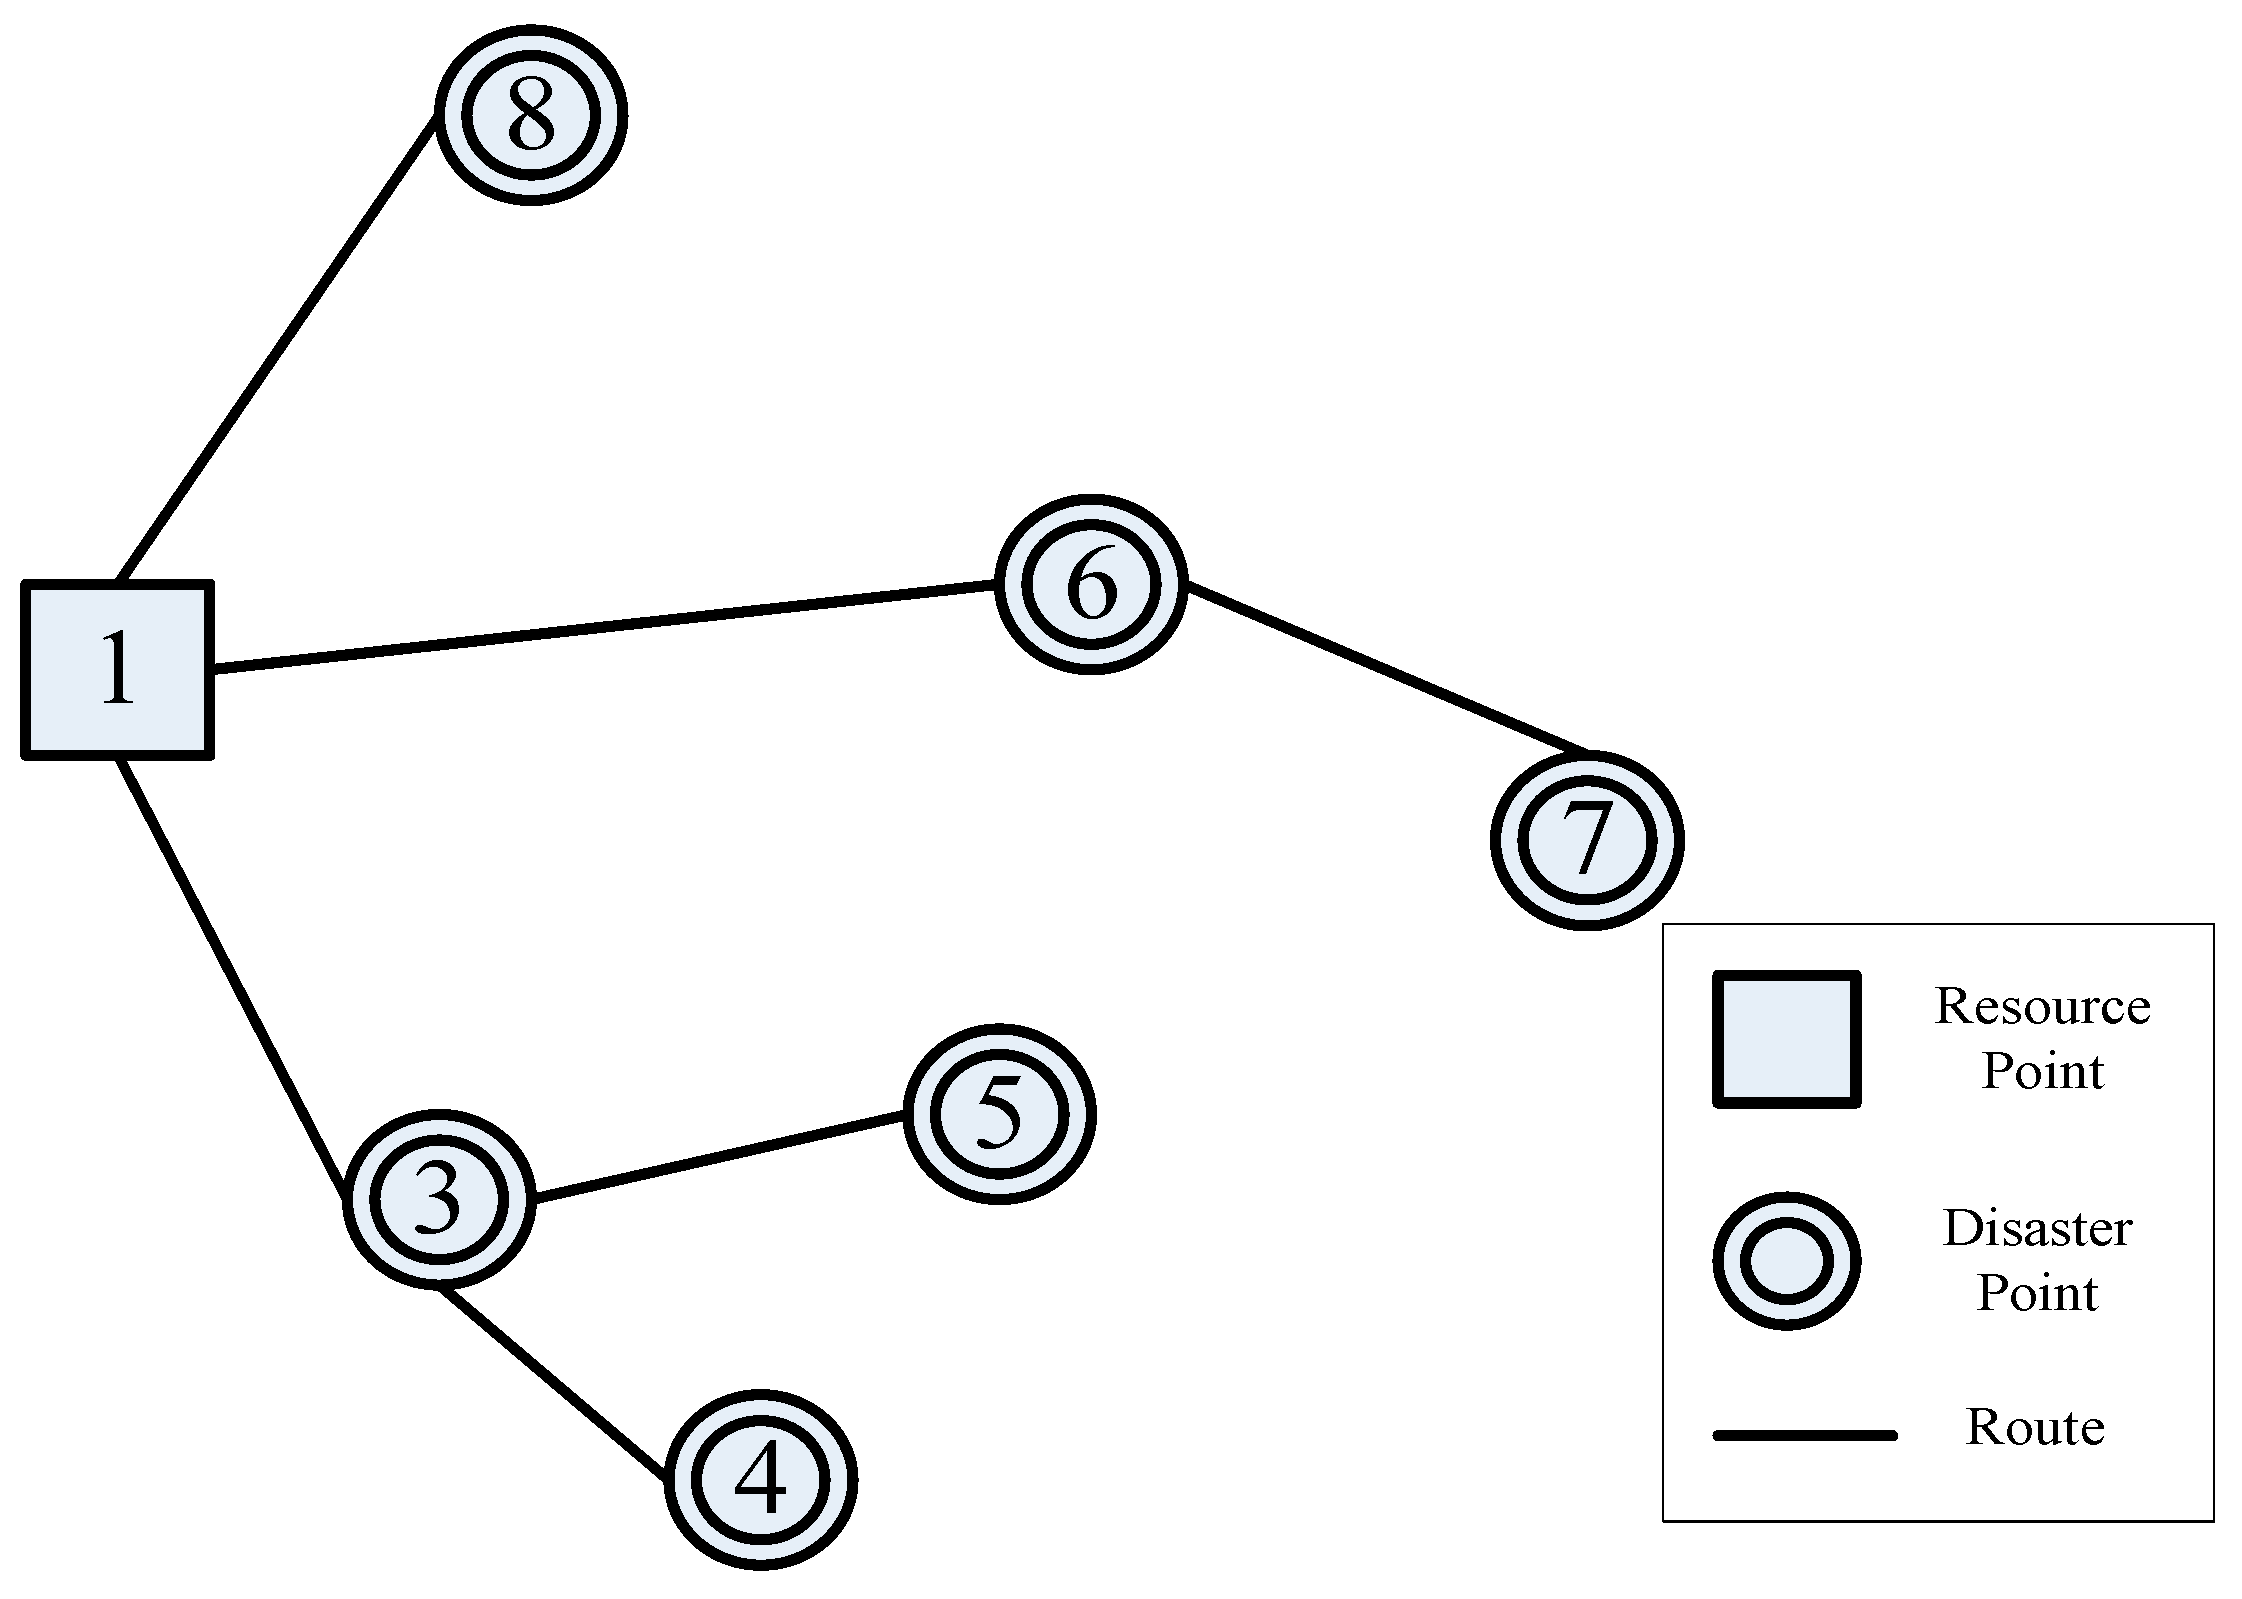
4.2.1. The Initial Phase of the Disaster
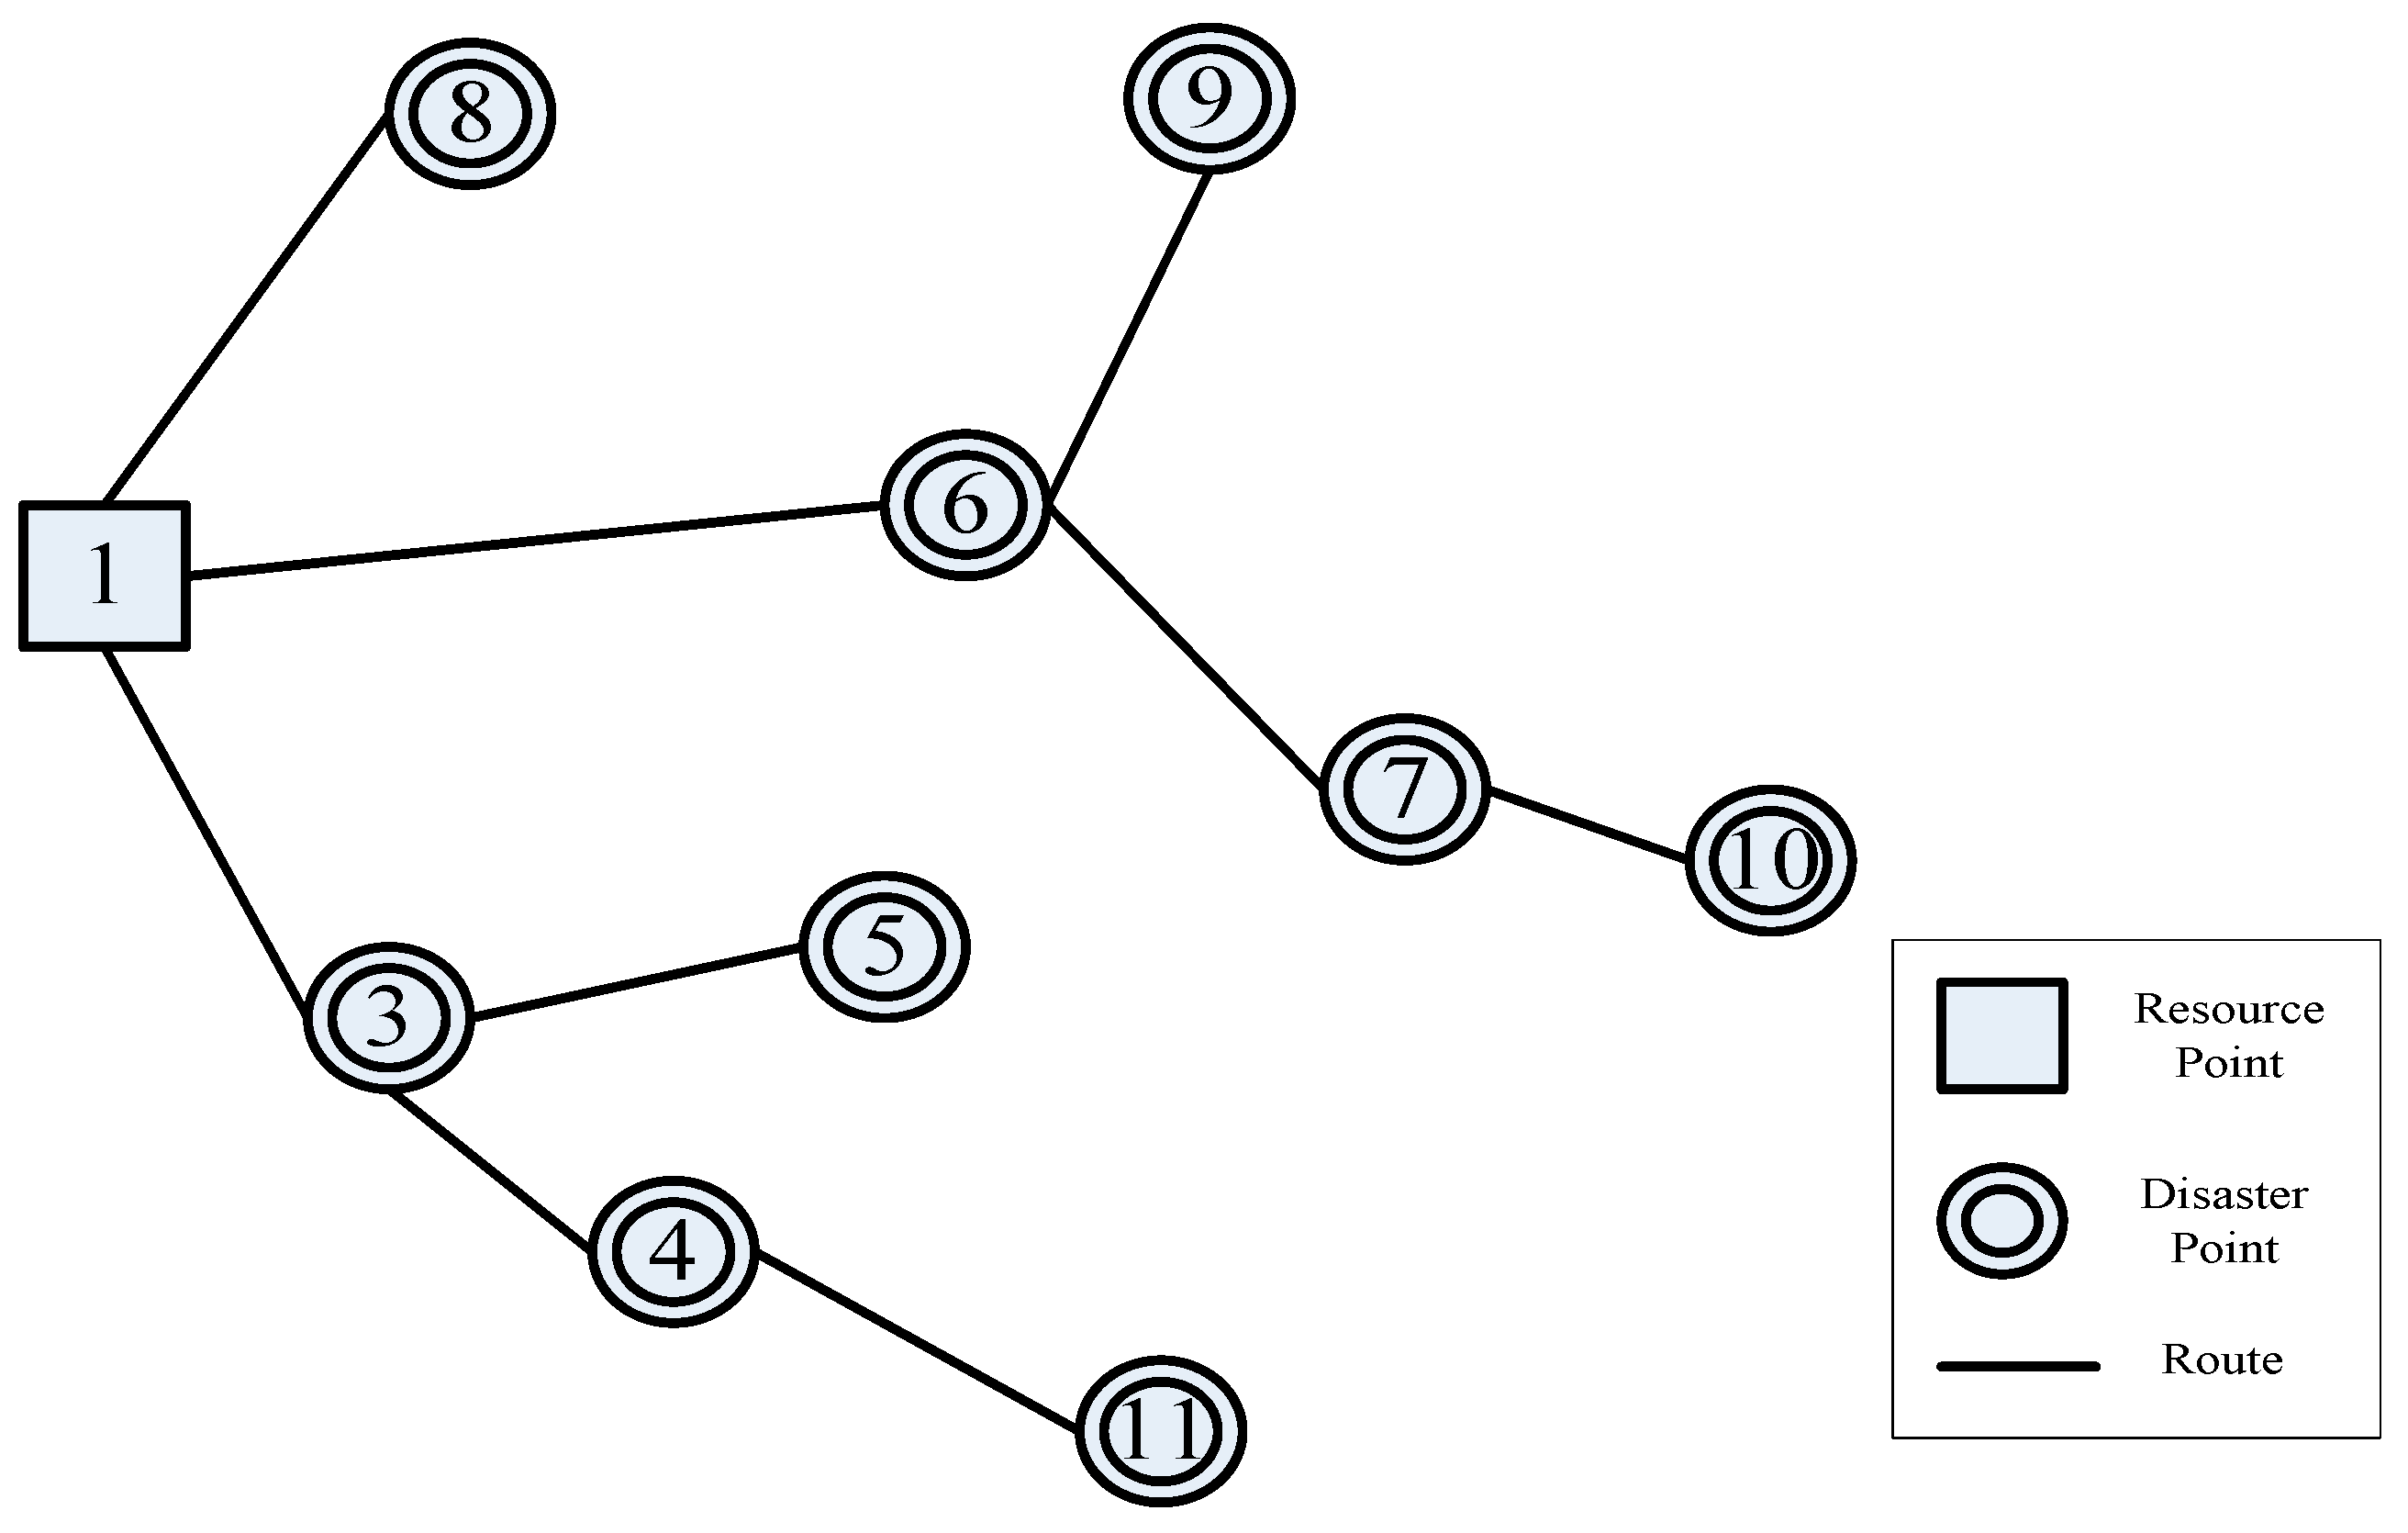
4.2.2. New Disaster Points
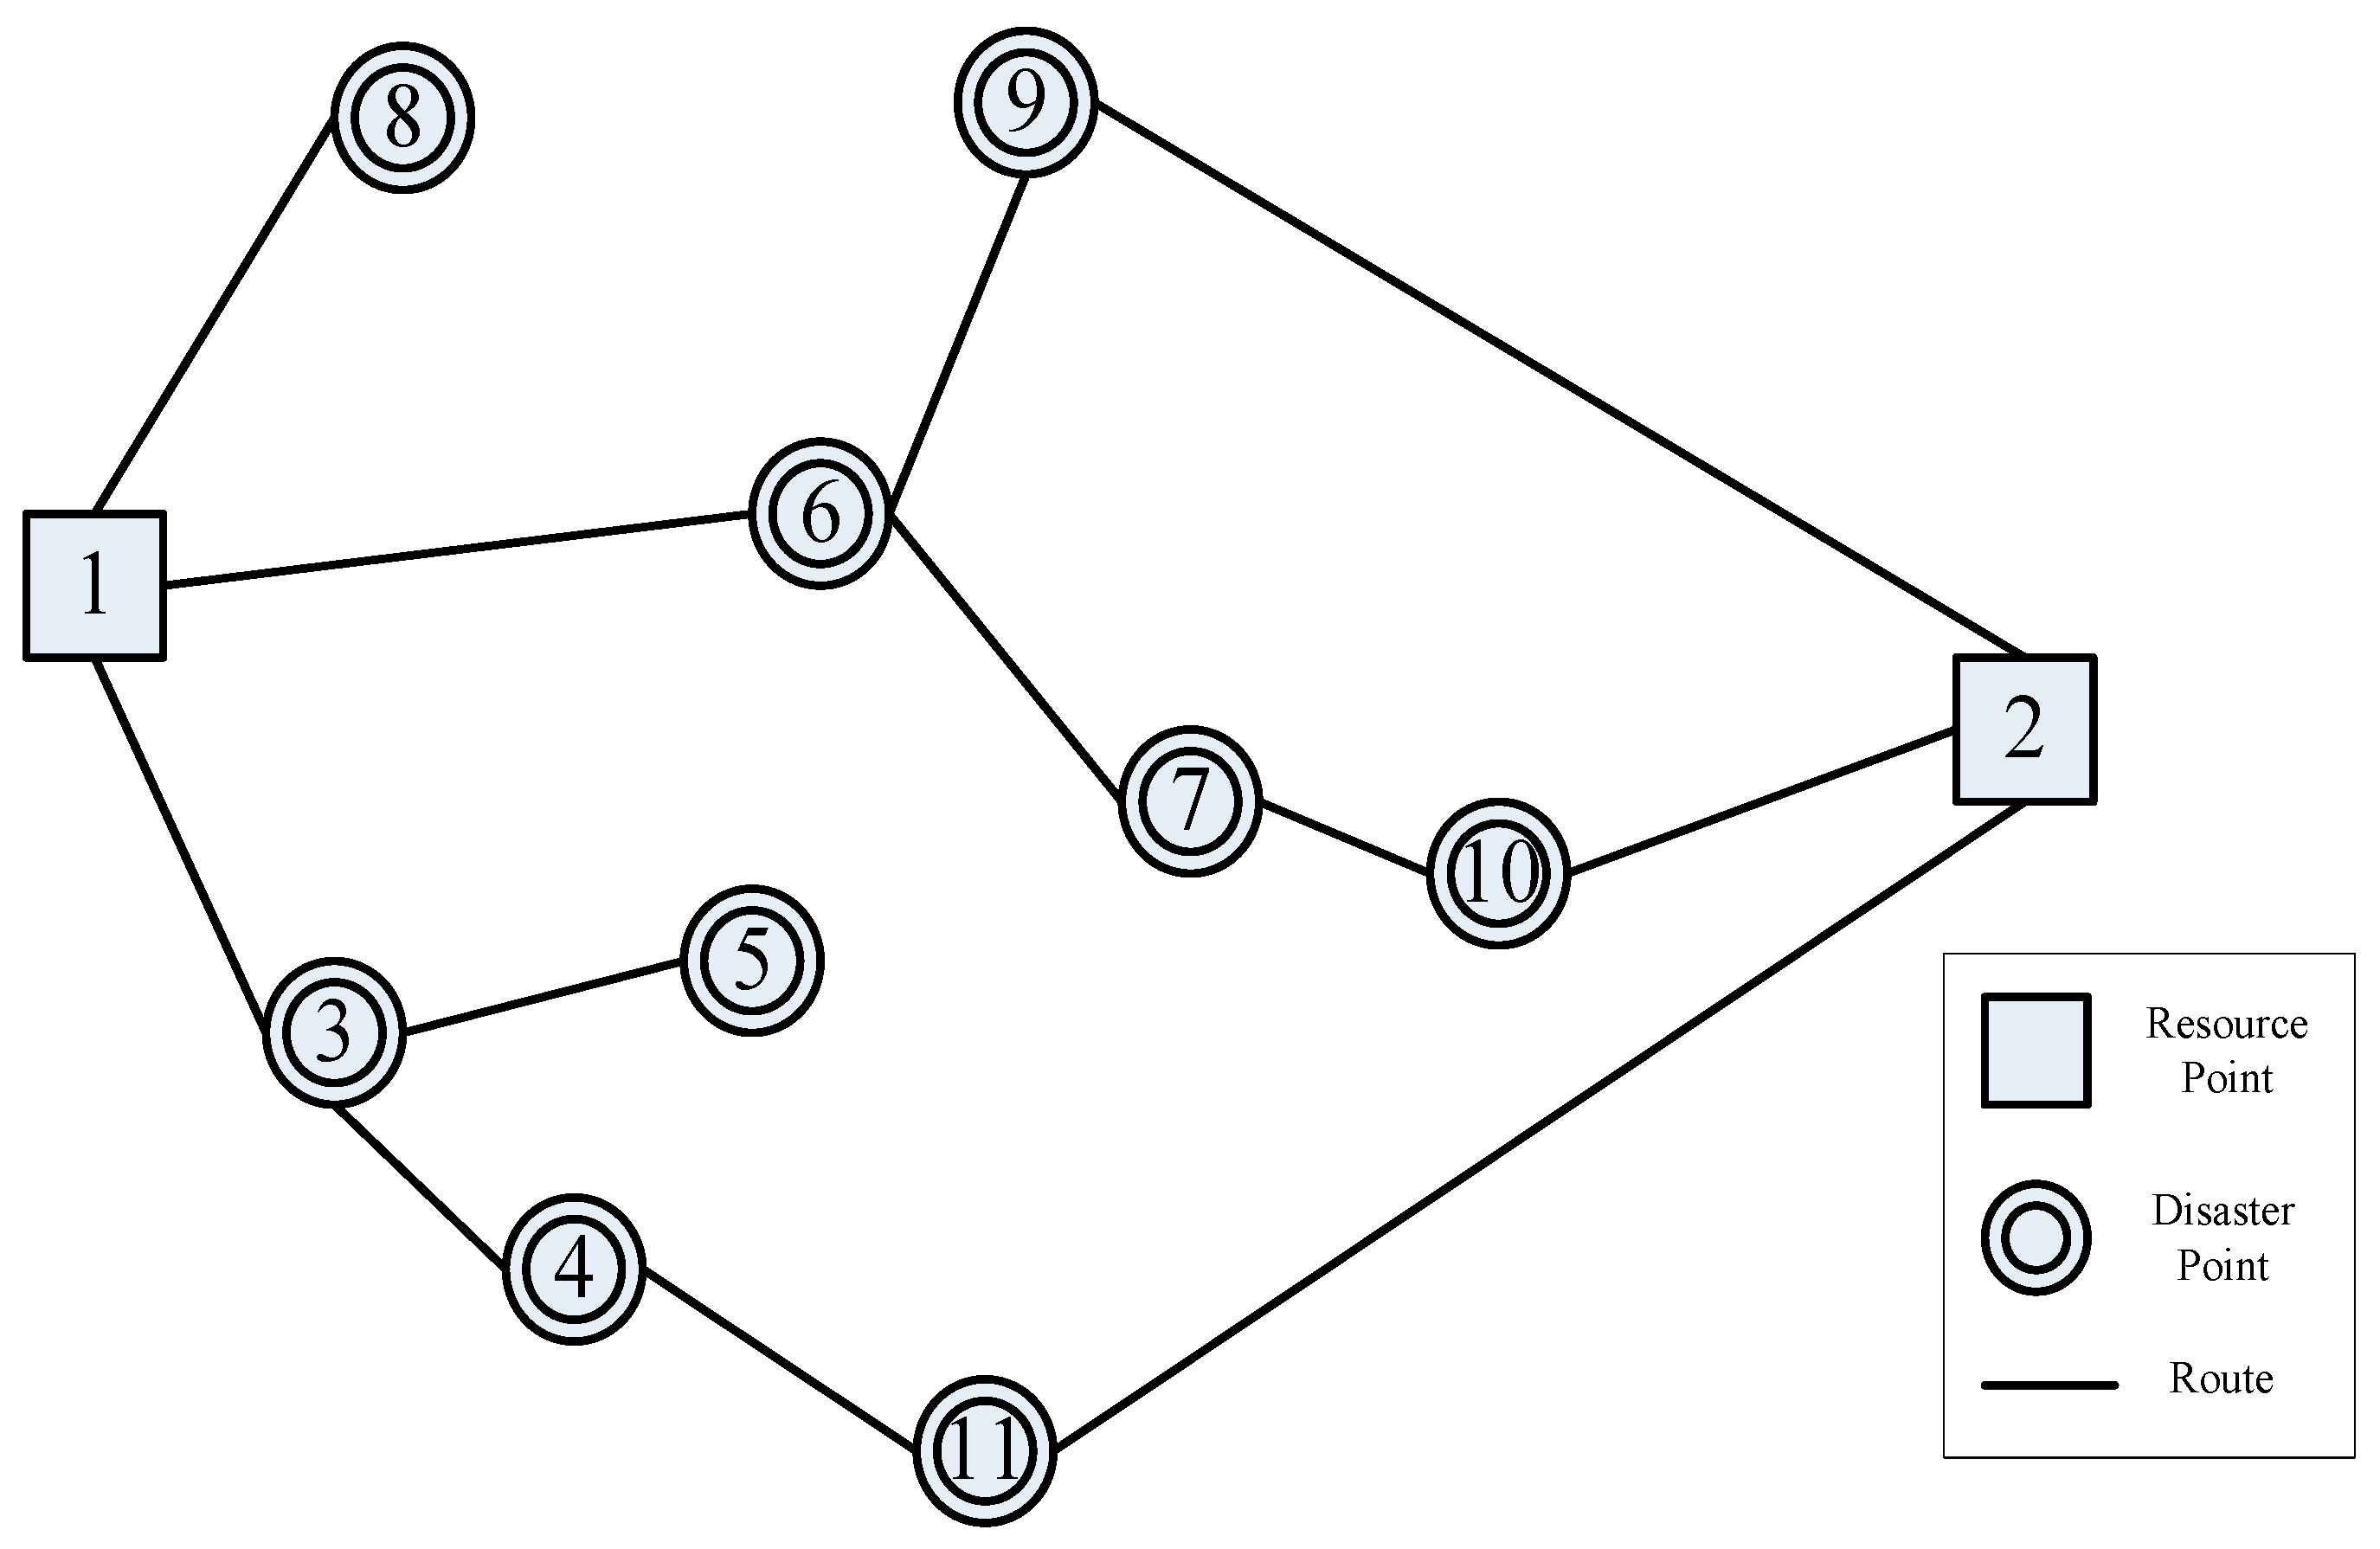
4.2.3. New Resource Point
- Disaster point 9: Due to the support of new resources, the rescheduling feature makes this repair activity schedule 40 time units earlier than the new resource site.
- Disaster point 10: For the same reason as above, the emergency repair activity at this disaster point was scheduled 96 time units ahead of schedule.
- Disaster point 11: Due to the full deployment of the resources at the new resource point, the resources allocated to disaster point 11 are increased from two to three, which allows the repair work to start earlier at unit time 37 and finish earlier at unit time 47 after rescheduling.
5. Conclusions and Recommendations
Author Contributions
Funding
Institutional Review Board Statement
Informed Consent Statement
Data Availability Statement
Conflicts of Interest
References
- Soltani-Sobh, A.; Heaslip, K.; Scarlatos, P.; Kaisar, E. Reliability based pre-positioning of recovery centers for resilent transportation infrastructure. Int. J. Disaster Risk 2016, 19, 324–333. [Google Scholar] [CrossRef]
- Ghannad, P.; Lee, Y.C.; Choi, J.O. Prioritizing postdisaster recovery of transportation infrastructure systems using multiagent reinforcement learning. J. Manag. Eng. 2021, 37, 04020100. [Google Scholar] [CrossRef]
- Edrissi, A.; Nourinejad, M.; Roorda, M.J. Transportation network reliability in emergency response. Transp. Res. Part E Logist. Transp. Rev. 2015, 80, 56–73. [Google Scholar] [CrossRef]
- Holguín-Veras, J.; Pérez, N.; Ukkusuri, S.; Wachtendorf, T.; Brown, B. Emergency logistics issues affecting the response to katrina: A synthesis and preliminary suggestions for improvement. Transp. Res. Rec. 2007, 2022, 76–82. [Google Scholar] [CrossRef]
- Altay, N.; Green, W.G. OR/MS research in disaster operations management. Eur. J. Oper. Res. 2006, 175, 475–493. [Google Scholar] [CrossRef]
- McEntire, D.A.; Fuller, C.; Johnston, C.W.; Weber, R. A comparison of disaster paradigms: The search for a holistic policy guide. Public Adm. Rev. 2002, 62, 267–281. [Google Scholar] [CrossRef]
- Rodríguez-Espíndola, O.; Albores, P.; Brewster, C. Dynamic formulation for humanitarian response operations incorporating multiple organisations. Int. J. Prod. Econ. 2018, 204, 83–98. [Google Scholar] [CrossRef]
- Faturechi, R.; Miller-Hooks, E. Measuring the performance of transportation infrastructure systems in disasters: A comprehensive review. J. Infrastruct. Syst. 2015, 21, 04014025. [Google Scholar] [CrossRef]
- Özcan, N.T.; Yücemen, M.S. Seismic reliability of highway transportation systems. Asce-Asme J. Risk Uncertain. Eng. Syst. Part A Civ. Eng. 2018, 4, 04018019. [Google Scholar] [CrossRef]
- Yan, S.; Shih, Y.L. An ant colony system-based hybrid algorithm for an emergency roadway repair time-space network flow problem. Transportmetrica 2012, 8, 361–386. [Google Scholar] [CrossRef]
- Li, S.; Teo, K.L. Post-disaster multi-period road network repair: Work scheduling and relief logistics optimization. Ann. Oper. Res. 2019, 283, 1345–1385. [Google Scholar] [CrossRef]
- Aksu, D.T.; Ozdamar, L. A mathematical model for post-disaster road restoration-Enabling accessibility and evacuation. Transp. Res. Part. E Logist. Transp. Rev. 2014, 61, 56–67. [Google Scholar] [CrossRef]
- Yan, S.; Lin, C.K.; Chen, S.Y. Optimal scheduling of logistical support for an emergency roadway repair work schedule. Eng. Optim. 2012, 44, 1035–1055. [Google Scholar] [CrossRef]
- Li, S.; Ma, Z.; Teo, K.L. A new model for road work repair after natural disasters-Integrating logistics support scheduling and routing activities. Comput. Ind. Eng. 2020, 145, 106506. [Google Scholar] [CrossRef]
- Zhou, Y.; Liu, J.; Zhang, Y.; Gan, X. A multi-objective evolutionary algorithm for dynamic emergency resource scheduling problems. Transp. Res. Part. E Logist. Transp. Rev. 2017, 99, 77–95. [Google Scholar] [CrossRef]
- Zhang, Z.; Wei, H.H. Modeling interaction of emergency inspection routing and restoration scheduling for postdisaster resilience of highway–bridge networks. J. Infrastruct. Syst. 2020, 27, 04020046. [Google Scholar] [CrossRef]
- Sheu, J.B. Dynamic relief-demand management for emergency logistics operations under large-scale disasters. Transp. Res. Part. E Logist. Transp. Rev. 2010, 46, 1–17. [Google Scholar] [CrossRef]
- Caunhye, A.M.; Nie, X.; Pokharel, S. Optimization models in emergency logistics: A literature review. Socioecon. Plann. Sci. 2012, 46, 4–13. [Google Scholar] [CrossRef]
- Wohlgemuth, S.; Oloruntoba, R.; Clausen, U. Dynamic vehicle routing with anticipation in disaster relief. Socioecon. Plann. Sci. 2012, 46, 261–271. [Google Scholar] [CrossRef]
- Zhang, J.H.; Li, J.; Liu, Z.P. Multiple-resource and multiple-depot emergency response problem considering secondary disasters. Expert Syst. Appl. 2012, 39, 11066–11071. [Google Scholar] [CrossRef]
- Yan, S.; Chu, J.C.; Shih, Y.L. Optimal scheduling for highway emergency repairs under large-scale supply-demand perturbations. IEEE Trans. Intell. Transp. Syst. 2014, 15, 2378–2393. [Google Scholar] [CrossRef]
- Orabi, W.; El-Rayes, K.; Senouci, A.B.; Al-Derham, H. Optimizing postdisaster reconstruction planning for damaged transportation networks. J. Constr. Eng. Manag. 2009, 135, 1039–1048. [Google Scholar] [CrossRef]
- Orabi, W.; Senouci, A.B.; El-Rayes, K.; Al-Derham, H. Optimizing resource utilization during the recovery of civil infrastructure systems. J. Manag. Eng. 2010, 26, 237–246. [Google Scholar] [CrossRef]
- Chen, A.Y.; Peña-Mora, F.; Ouyang, Y. A collaborative GIS framework to support equipment distribution for civil engineering disaster response operations. Autom. Constr. 2011, 20, 637–648. [Google Scholar] [CrossRef]
- Yan, S.; Shih, Y.L. Optimal scheduling of emergency roadway repair and subsequent relief distribution. Comput. Oper. Res. 2009, 36, 2049–2065. [Google Scholar] [CrossRef]
- Bíl, M.; Vodák, R.; Kubeček, J.; Bílová, M.; Sedoník, J. Evaluating road network damage caused by natural disasters in the Czech Republic between 1997 and 2010. Transp. Res. Part A Policy Pr. 2015, 80, 90–103. [Google Scholar] [CrossRef]
- Keaton, J.; Perry, D.; Kim, P. Repair of storm-damaged slopes, Lower Mount Wilson Road, Los Angeles County, California. Transp. Res. Rec. 2011, 2204, 242–250. [Google Scholar] [CrossRef]
- Kaviani, A.; Thompson, R.G.; Rajabifard, A.; Sarvi, M. A model for multi-class road network recovery scheduling of regional road networks. Transportation 2018, 47, 109–143. [Google Scholar] [CrossRef]
- Sheu, J.B.; Pan, C. Relief supply collaboration for emergency logistics responses to large-scale disasters. Transp. A Transp. Sci. 2015, 11, 210–242. [Google Scholar] [CrossRef]
- Campbell, A.M.; Vandenbussche, D.; Hermann, W. Routing for relief efforts. Transp. Sci. 2008, 42, 127–145. [Google Scholar] [CrossRef]
- Huang, M.; Smilowitz, K.R.; Balcik, B. A continous approximation approach for assessment routing in disaster relief. Transp. Res. Part B 2013, 50, 20–41. [Google Scholar] [CrossRef]
- Zhong, S.; Cheng, R.; Jiang, Y.; Wang, Z.; Larsen, A.; Nielsen, O.A. Risk-averse optimization of disaster relief facility location and vehicle routing under stochastic demand. Transp. Res. Part. E Logist. Transp. Rev. 2020, 141, 102015. [Google Scholar] [CrossRef]
- Duque, P.M.; Sörensen, K. A GRASP metaheuristic to improve accessibility after a disaster. Or Spectr. 2011, 33, 525–542. [Google Scholar] [CrossRef]
- Duque, P.A.M.; Dolinskaya, I.S.; Sörensen, K. Network repair crew scheduling and routing for emergency relief distribution problem. Eur. J. Oper. Res. 2016, 248, 272–285. [Google Scholar] [CrossRef]
- Kim, S.; Shin, Y.; Lee, G.M.; Moon, I. Network repair crew scheduling for short-term disasters. Appl. Math. Model. 2018, 64, 510–523. [Google Scholar] [CrossRef]
- Chen, T.; Wu, S.; Yang, J.; Cong, G.; Li, G. Modeling of emergency supply scheduling problem based on reliability and its solution algorithm under variable road network after sudden-onset disasters. Complexity 2020, 2020, 7501891. [Google Scholar] [CrossRef]
- Lu, C.C.; Ying, K.C.; Chen, H.J. Real-time relief distribution in the aftermath of disasters-rolling horizon approach. Transp. Res. Part. E Logist. Transp. Rev. 2016, 93, 1–20. [Google Scholar] [CrossRef]
- Sheu, J.B.; Pan, C. A method for designing centralized emergency supply network to respond to large-scale natural disasters. Transp. Res. Part. B 2014, 67, 284–305. [Google Scholar] [CrossRef]
- Zhang, W.; Wang, N.; Nicholson, C. Resilience-based post-disaster recovery strategies for road-bridge networks. Struct. Infrastruct. Eng. 2017, 13, 1404–1413. [Google Scholar] [CrossRef]
- Li, Z.; Jin, C.; Hu, P.; Wang, C. Relisience-based transportation network recovery strategy during emergency recovery phase under uncertainty. Reliab. Eng. Syst. Saf. 2019, 188, 503–514. [Google Scholar] [CrossRef]
- Xu, M.; Ouyang, M.; Mao, Z.; Xu, X. Improving repair sequence scheduling methods for postdisaster critical infrastructure systems. Comput. Civ. Infrastruct. Eng. 2019, 34, 506–522. [Google Scholar] [CrossRef]
- Chakrabortty, R.K.; Sarker, R.A.; Essam, D.L. Multi-mode resource constrained project scheduling under resource disruptions. Comput. Chem. Eng. 2016, 88, 13–29. [Google Scholar] [CrossRef]
- Brucker, P.; Drexl, A.; Möhring, R.; Neumann, K.; Pesch, E. Resource-constrained project scheduling: Notation, classification, models, and methods. Eur. J. Oper. Res. 1999, 112, 3–41. [Google Scholar] [CrossRef]
- Baptiste, P.; Le Pape, C. Constraint propagation and decomposition techniques for highly disjunctive and highly cumulative project scheduling problems. Constraints 2000, 5, 119–139. [Google Scholar] [CrossRef]
- Baptiste, P.; Demassey, S. Tight LP bounds for resource constrained project scheduling. Or Spectr. 2004, 26, 251–262. [Google Scholar] [CrossRef]
- Liess, O.; Michelon, P. A constraint programming approach for the resource-constrained project scheduling problem. Ann. Oper. Res. 2008, 157, 25–36. [Google Scholar] [CrossRef]
- Brucker, P.; Knust, S. Linear programming and constraint propagation-based lower bound for the RCPSP. Eur. J. Oper. Res. 2000, 127, 355–362. [Google Scholar] [CrossRef]
- Alcaraz, J.; Maroto, C. A robust genetic algorithm for resource allocation in project scheduling. Ann. Oper. Res. 2001, 102, 83–109. [Google Scholar] [CrossRef]
- Rahman, H.F.; Chakrabortty, R.K.; Ryan, M.J. Memetic algorithm for solving resource constrained project scheduling problems. Autom. Constr. 2020, 111, 103052. [Google Scholar] [CrossRef]
- Pinto, G.; Ben-Dov, Y.T.; Rabinowitz, G. Formulating and solving a multi-mode resource-collaboration and constrained scheduling problem (MRCCSP). Ann. Oper. Res. 2013, 206, 311–339. [Google Scholar] [CrossRef]
- Chakrabortty, R.K.; Sarker, R.A.; Essam, D.L. Resource constrained project scheduling with uncertain activity durations. Comput. Ind. Eng. 2017, 112, 537–550. [Google Scholar] [CrossRef]
- Hauder, V.A.; Beham, A.; Raggl, S.; Parragh, S.N.; Affenzeller, M. Resource-constrained multi-project scheduling with activity and time flexibility. Comput. Ind. Eng. 2020, 150, 106857. [Google Scholar] [CrossRef]
- IBM ILOG CPLEX Optimization Studio. Available online: https://www.ibm.com/products/ilog-cplex-optimization-studio/details (accessed on 20 December 2020).


| Parameter | Statement |
|---|---|
| Duration of repair activity u at disaster point u | |
| Duration of transit activity nj from resource point n to succeeding disaster point j | |
| Duration of transit activity ij from preceding disaster point i to succeeding disaster point j | |
| Latest finish time of repair activity i at disaster point | |
| Resource supply quantity of resource type k at resource point n | |
| Resource supply quantity of resource type k at resource point n for responsibility area s | |
| Maximum resource quantity that resource type k can be accommodated at disaster site i | |
| Variable | Statement |
| Total project duration | |
| Total duration of responsibility area s | |
| Start time of repair activity u | |
| Finish time of repair activity u | |
| Start time of preceding repair activity i | |
| Finish time of preceding repair activity i | |
| Finish time of preceding repair activity i at responsibility area s | |
| Start time of succeeding repair activity j | |
| Start time of transit activity nj from resource point n to succeeding disaster point j | |
| Finish time of transit activity nj from resource point n to succeeding disaster point j | |
| Start time of transit activity ij from preceding disaster point i to succeeding disaster point j | |
| Finish time of transit activity ij from preceding disaster point i to succeeding disaster point j | |
| Resource usage of resource type k of preceding repair activity i | |
| Resource usage of resource type k of preceding repair activity i at responsibility area s | |
| Resource usage of resource type k of succeeding repair activity i | |
| Remaining resource quantity after resource type k deployment for repair activity i | |
| Resource quantity of resource type k dispatched through transit activity nj from resource point n to succeeding disaster point j | |
| Resource quantity of resource type k dispatched through transit activity ij from preceding disaster point i to succeeding disaster point j | |
| Duration of transit activity nj from resource point n to succeeding disaster point j | |
| Duration of transit activity ij from preceding disaster point i to succeeding disaster point j | |
| Set | Statement |
| Set of emergency repair projects | |
| Set of responsibility areas, where f = 1, 2, 3, …, g | |
| Set of resource points | |
| Set of recovery activities | |
| Set of preceding repair activities | |
| Set of succeeding repair activities | |
| Set of resource types | |
| Set of in-progress repair activities at time interval t, where t = 1, 2, 3, …, T | |
| Set of the corresponding durations to different resource combinations for repair activity u | |
| Set of durations of transit activity nj from resource point n to succeeding disaster point j | |
| Set of durations of transit activity ij from preceding disaster point i to succeeding disaster point j |
| Resource Point No. | R1 Quantity | R2 Quantity |
|---|---|---|
| 1 | 6 | 6 |
| 2 | 3 | 3 |
| 3 | 5 | 4 |
| Disaster Point No. | R1 Required Quantity | R2 Required Quantity | Repair Duration (in 20 min) |
|---|---|---|---|
| 4 | 1 | 1 | 30 |
| 5 | 3 | 3 | 45 |
| 3 | 2 | 53 | |
| 6 | 4 | 3 | 18 |
| 3 | 3 | 23 | |
| 7 | 2 | 2 | 72 |
| 2 | 1 | 85 | |
| 8 | 2 | 1 | 19 |
| 1 | 1 | 24 | |
| 9 | 1 | 1 | 53 |
| 10 | 2 | 1 | 60 |
| 1 | 1 | 72 | |
| 11 | 1 | 1 | 15 |
| 12 | 2 | 2 | 31 |
| 1 | 1 | 52 | |
| 13 | 2 | 2 | 17 |
| 1 | 1 | 29 | |
| 14 | 2 | 1 | 12 |
| 1 | 1 | 17 | |
| 15 | 1 | 1 | 12 |
| 16 | 2 | 1 | 30 |
| 1 | 1 | 35 | |
| 17 | 3 | 2 | 90 |
| 2 | 2 | 103 | |
| 18 | 2 | 2 | 54 |
| 1 | 1 | 92 |
| Resource Transit Route | Departing Location | Arrival Location | Travel Time (20 min) |
|---|---|---|---|
| 1 | 1 | 4 | 2 |
| 2 | 1 | 5 | 1 |
| 3 | 1 | 7 | 3 |
| 4 | 2 | 10 | 2 |
| 5 | 2 | 12 | 2 |
| 6 | 3 | 15 | 5 |
| 7 | 3 | 16 | 2 |
| 8 | 3 | 17 | 2 |
| 9 | 4 | 1 | 2 |
| 10 | 5 | 1 | 1 |
| 11 | 5 | 6 | 4 |
| 12 | 6 | 5 | 4 |
| 13 | 7 | 1 | 3 |
| 14 | 7 | 8 | 2 |
| 15 | 7 | 9 | 1 |
| 16 | 8 | 7 | 2 |
| 17 | 9 | 7 | 1 |
| 18 | 10 | 2 | 2 |
| 19 | 10 | 11 | 3 |
| 20 | 11 | 10 | 3 |
| 21 | 12 | 2 | 2 |
| 22 | 12 | 13 | 2 |
| 23 | 12 | 14 | 4 |
| 24 | 13 | 12 | 2 |
| 25 | 14 | 12 | 4 |
| 26 | 15 | 3 | 5 |
| 27 | 16 | 3 | 2 |
| 28 | 17 | 3 | 2 |
| 29 | 17 | 18 | 1 |
| 30 | 18 | 17 | 1 |
| Disaster Point No. | R1 Usage | R2 Usage | Repair Start Time (20 min) | Repair Duration (20 min) | Repair finish Time (20 min) | Resource Transit Route |
|---|---|---|---|---|---|---|
| 4 | 1 | 1 | 2 | 30 | 32 | 1 |
| 5 | 3 | 3 | 1 | 45 | 46 | 2 |
| 6 | 3 | 3 | 50 | 23 | 73 | 11 |
| 7 | 2 | 2 | 3 | 72 | 75 | 3 |
| 8 | 1 | 1 | 77 | 24 | 101 | 14 |
| 9 | 1 | 1 | 76 | 53 | 129 | 15 |
| 10 | 1 | 1 | 2 | 72 | 74 | 4 |
| 11 | 1 | 1 | 77 | 15 | 92 | 19 |
| 12 | 2 | 2 | 2 | 31 | 33 | 5 |
| 13 | 1 | 1 | 35 | 29 | 64 | 22 |
| 14 | 1 | 1 | 37 | 17 | 54 | 23 |
| 15 | 1 | 1 | 5 | 12 | 17 | 6 |
| 16 | 1 | 1 | 2 | 35 | 37 | 7 |
| 17 | 3 | 2 | 2 | 90 | 92 | 8 |
| 18 | 2 | 2 | 93 | 54 | 147 | 29 |
| Repair project total duration: 147 (20 min) | ||||||
| Disaster Point No. | Resource Required Quantity | Repair Duration (in 20 min) |
|---|---|---|
| 3 | 3 | 40 |
| 2 | 50 | |
| 4 | 2 | 27 |
| 1 | 46 | |
| 5 | 2 | 45 |
| 1 | 76 | |
| 6 | 3 | 71 |
| 2 | 85 | |
| 7 | 2 | 53 |
| 1 | 90 | |
| 8 | 1 | 25 |
| Resource Transit Route | Departing Location | Arrival Location | Travel Time (20 min) |
|---|---|---|---|
| 1 | 1 | 3 | 2 |
| 2 | 1 | 6 | 4 |
| 3 | 1 | 8 | 2 |
| 4 | 3 | 1 | 2 |
| 5 | 3 | 4 | 1 |
| 6 | 3 | 5 | 2 |
| 7 | 4 | 3 | 1 |
| 8 | 5 | 3 | 2 |
| 9 | 6 | 1 | 4 |
| 10 | 6 | 7 | 3 |
| 11 | 7 | 6 | 3 |
| 12 | 8 | 1 | 2 |
| Disaster Point No. | Resource Usage | Repair Start Time (20 min) | Repair Duration (20 min) | Repair Finish Time (20 min) | Resource Transit Route |
|---|---|---|---|---|---|
| 3 | 3 | 2 | 40 | 42 | 1 |
| 4 | 2 | 43 | 27 | 70 | 5 |
| 5 | 1 | 44 | 76 | 120 | 6 |
| 6 | 3 | 4 | 71 | 75 | 2 |
| 7 | 2 | 78 | 53 | 131 | 10 |
| 8 | 1 | 2 | 25 | 27 | 3 |
| Repair project total duration: 131 (20 min) | |||||
| Disaster Point No. | Resource Required Quantity | Repair Duration (20 min) |
|---|---|---|
| 9 | 2 | 27 |
| 1 | 45 | |
| 10 | 3 | 8 |
| 2 | 10 | |
| 11 | 3 | 10 |
| 2 | 12 |
| Resource Transit Route | Departing Location | Arrival Location | Travel Time (20 min) |
|---|---|---|---|
| 13 | 4 | 11 | 2 |
| 14 | 6 | 9 | 2 |
| 15 | 7 | 10 | 1 |
| 16 | 9 | 6 | 2 |
| 17 | 10 | 7 | 1 |
| 18 | 11 | 4 | 2 |
| Disaster Point No. | Resource Usage | Repair Start Time (20 min) | Repair Duration (20 min) | Repair Finish Time (20 min) | Resource Transit Route |
|---|---|---|---|---|---|
| 3 | 3 | 2 | 40 | 42 | 1 |
| 4 | 2 | 43 | 27 | 70 | 5 |
| 5 | 1 | 44 | 76 | 120 | 6 |
| 6 | 3 | 4 | 71 | 75 | 2 |
| 7 | 2 | 78 | 53 | 131 | 10 |
| 8 | 1 | 2 | 25 | 27 | 3 |
| 9 | 1 | 77 | 45 | 122 | 14 |
| 10 | 2 | 132 | 10 | 142 | 15 |
| 11 | 2 | 72 | 12 | 84 | 13 |
| Repair project total duration: 142 (20 min) | |||||
| Resource Transit Route | Departing Location | Arrival Location | Travel Time (20 min) |
|---|---|---|---|
| 19 | 2 | 9 | 5 |
| 20 | 2 | 10 | 4 |
| 21 | 2 | 11 | 5 |
| 22 | 9 | 2 | 5 |
| 23 | 10 | 2 | 4 |
| 24 | 11 | 2 | 5 |
| Disaster Point No. | Resource Usage | Repair Start Time (20 min) | Repair Duration (20min) | Repair Finish Time (20min) | Resource Transit Route |
|---|---|---|---|---|---|
| 3 | 3 | 2 | 40 | 42 | 1 |
| 4 | 2 | 43 | 27 | 70 | 5 |
| 5 | 1 | 44 | 76 | 120 | 6 |
| 6 | 3 | 4 | 71 | 75 | 2 |
| 7 | 2 | 78 | 53 | 131 | 10 |
| 8 | 1 | 2 | 25 | 27 | 3 |
| 9 | 1 | 37 | 45 | 82 | 19 |
| 10 | 2 | 36 | 10 | 46 | 20 |
| 11 | 3 | 37 | 10 | 47 | 21 |
| Repair project total duration: 131 (20 min) | |||||
Publisher’s Note: MDPI stays neutral with regard to jurisdictional claims in published maps and institutional affiliations. |
© 2021 by the authors. Licensee MDPI, Basel, Switzerland. This article is an open access article distributed under the terms and conditions of the Creative Commons Attribution (CC BY) license (http://creativecommons.org/licenses/by/4.0/).
Share and Cite
Liu, S.-S.; Arifin, M.F.A.; Chen, W.T.; Huang, Y.-H. Emergency Repair Scheduling Model for Road Network Integrating Rescheduling Feature. Appl. Sci. 2021, 11, 1447. https://doi.org/10.3390/app11041447
Liu S-S, Arifin MFA, Chen WT, Huang Y-H. Emergency Repair Scheduling Model for Road Network Integrating Rescheduling Feature. Applied Sciences. 2021; 11(4):1447. https://doi.org/10.3390/app11041447
Chicago/Turabian StyleLiu, Shu-Shun, Muhammad Faizal Ardhiansyah Arifin, Wei Tong Chen, and Ying-Hua Huang. 2021. "Emergency Repair Scheduling Model for Road Network Integrating Rescheduling Feature" Applied Sciences 11, no. 4: 1447. https://doi.org/10.3390/app11041447
APA StyleLiu, S.-S., Arifin, M. F. A., Chen, W. T., & Huang, Y.-H. (2021). Emergency Repair Scheduling Model for Road Network Integrating Rescheduling Feature. Applied Sciences, 11(4), 1447. https://doi.org/10.3390/app11041447