Article

Impact of Disabled Driver’s Mass Center Location on Biomechanical Parameters during Crash

Faculty of Mechanical Engineering, Military University of Technology, Gen. Sylwestra Kaliskiego Street 2, 00-908 Warsaw, Poland
*
Author to whom correspondence should be addressed.
Appl. Sci. 2021, 11(4), 1427; https://doi.org/10.3390/app11041427
Submission received: 31 December 2020 / Revised: 23 January 2021 / Accepted: 26 January 2021 / Published: 4 February 2021

Abstract

:
Adapting a car for a disable person involves adding additional equipment to compensate for the driver’s disability. During this process, the change in the driver’s position and kinematics and their impact on safety levels during crash is not considered. There is also a lack of studies in the literature on this problem. This paper describes a methodology for conducting a study of the behavior of a disabled driver during a crash using the finite element method, based on an explicit time integration method. A validated car model and a commercial dummy model were used. The results show that the use of a handle on the steering wheel and a hand control unit causes dangerous lateral displacements relative to the seat. Amputation of the left leg or right arm causes significant shoulder rotations, amputation of the left leg causes increased thoracic loads. Amputation or additional equipment have no significant impact on head injuries.

1. Introduction

Over a billion people live with some form of disability, which represents 15% of the world’s population [1]. Between 110–190 million adults have very significant difficulties in functioning. Rate of disability is increasing. According to [2], approximately 2% of road accidents in Spain result in moderate, serious or total disability. The authors of [2] point out that the acquisition of a disability is associated with a reduced ability to work, greater functional dependence, greater need for assistance, and the need for family support.
Technological and medical developments make it possible to extend and improve quality of life. A great deal of attention has been paid in recent years to activating older people and people with disabilities (DP—disabled persons). Researchers from all over the world carry out research related to different aspects of DPs’ lives, looking, for example, at how they spend their leisure time [3], how well the infrastructure fits their needs [4,5,6], or their preferences when making choices [7]. These people in many cases possess valuable skills. Understanding the specific requirements of this social group allows the development of technical solutions that remove barriers that prevent them from active functioning, socially and professionally. This will enable the public to benefit from these skills.
Among the many factors influencing the professional and social activation of people with disabilities, aspects related to the mobility of DPs and the adaptation of existing systems of transportation to the needs of older and disabled people are often mentioned [5,8]. While in large cities, DPs can count on public transport adapted to their needs, in smaller towns and villages DPs are practically dependent on having individual means of transport or on third parties to provide them. One possible solution of this problem is the individual adaptation of a car to the needs of the particular person with disabilities [9]. However, it should be considered to ensure that any structural changes made do not result in reduced road safety, other people, and disabled driver.
Among many causes of road accidents, the human factor is indicated as one of the main ones [10]. It is difficult to eliminate all the imperfections and limitations of the physical driver, but thanks to technological developments, the driver has more and more systems to support his actions. Among these are constantly developed active safety systems. Their use, combined with appropriate training of drivers to operate them, can significantly reduce the number of road accidents [11,12].
New solutions for use in the automotive industry must be tested in accordance with product standards. The most extensive testing applies to new vehicles, as each must pass very stringent tests before it can be put into road traffic. Of course, cars on the market have varying levels of safety (depending, among other things, on the number of active driver assistance systems), but any new car that does not meet the minimum requirements cannot be put on the road. Another point worth noting is that new cars are designed with the average consumer in mind, and tests are carried out for the chosen body configuration and weight of the occupants. Therefore, modification of the vehicle by changing the steering equipment or adjusting the car for a person with a physique significantly different from the one assumed during design, requires additional tests [13].
There are now very many methods in use for analysing dangerous situations that may occur on the road. Experimental research is undoubtedly the most important of these. Their disadvantage is the very high unit cost of each test and restrictions on carrying out certain measurements. Therefore, a very popular method of verifying the operation of technical objects is the numerical analysis [14,15,16,17,18]. Testing in virtual space allows for evaluating the structure in a short period of time in order to check the compliance with many standards [19,20], and for predicting the structure’s behaviour in different load scenarios. The lack of the need to physically build new prototypes and prepare experimental research also allows for significant financial savings. An additional advantage of computer simulations is the possibility to record more data than in the case of experimental studies [21].
Many different numerical tools are currently available for analyzing dangerous traffic situations [22]. One of the fastest are calculations using analytical formulae that take into account, among other things, the velocity, weight and stiffness of vehicles [23,24,25]. They allow many scenarios to be analyzed in a very short time and, when supplemented with a reliable vehicle database, make it possible to assess a real accident. An additional advantage of analytical methods is the possibility of transferring the loads acting on the driver to 3D models and further local analysis of his behavior.
Another fast and accurate method based on Reduced Order Dynamic Model [26], in which discretization of vehicle’s perimeter takes place only in a 2D environment. It reduces the number of equation and thus reduce time calculation.
Analytical and 2D models do not allow an accurate analysis of driver behavior. Therefore, if the aim of the study is to determine e.g., injuries to the driver, methods based on multibody analyzes [19] or FEM are used [
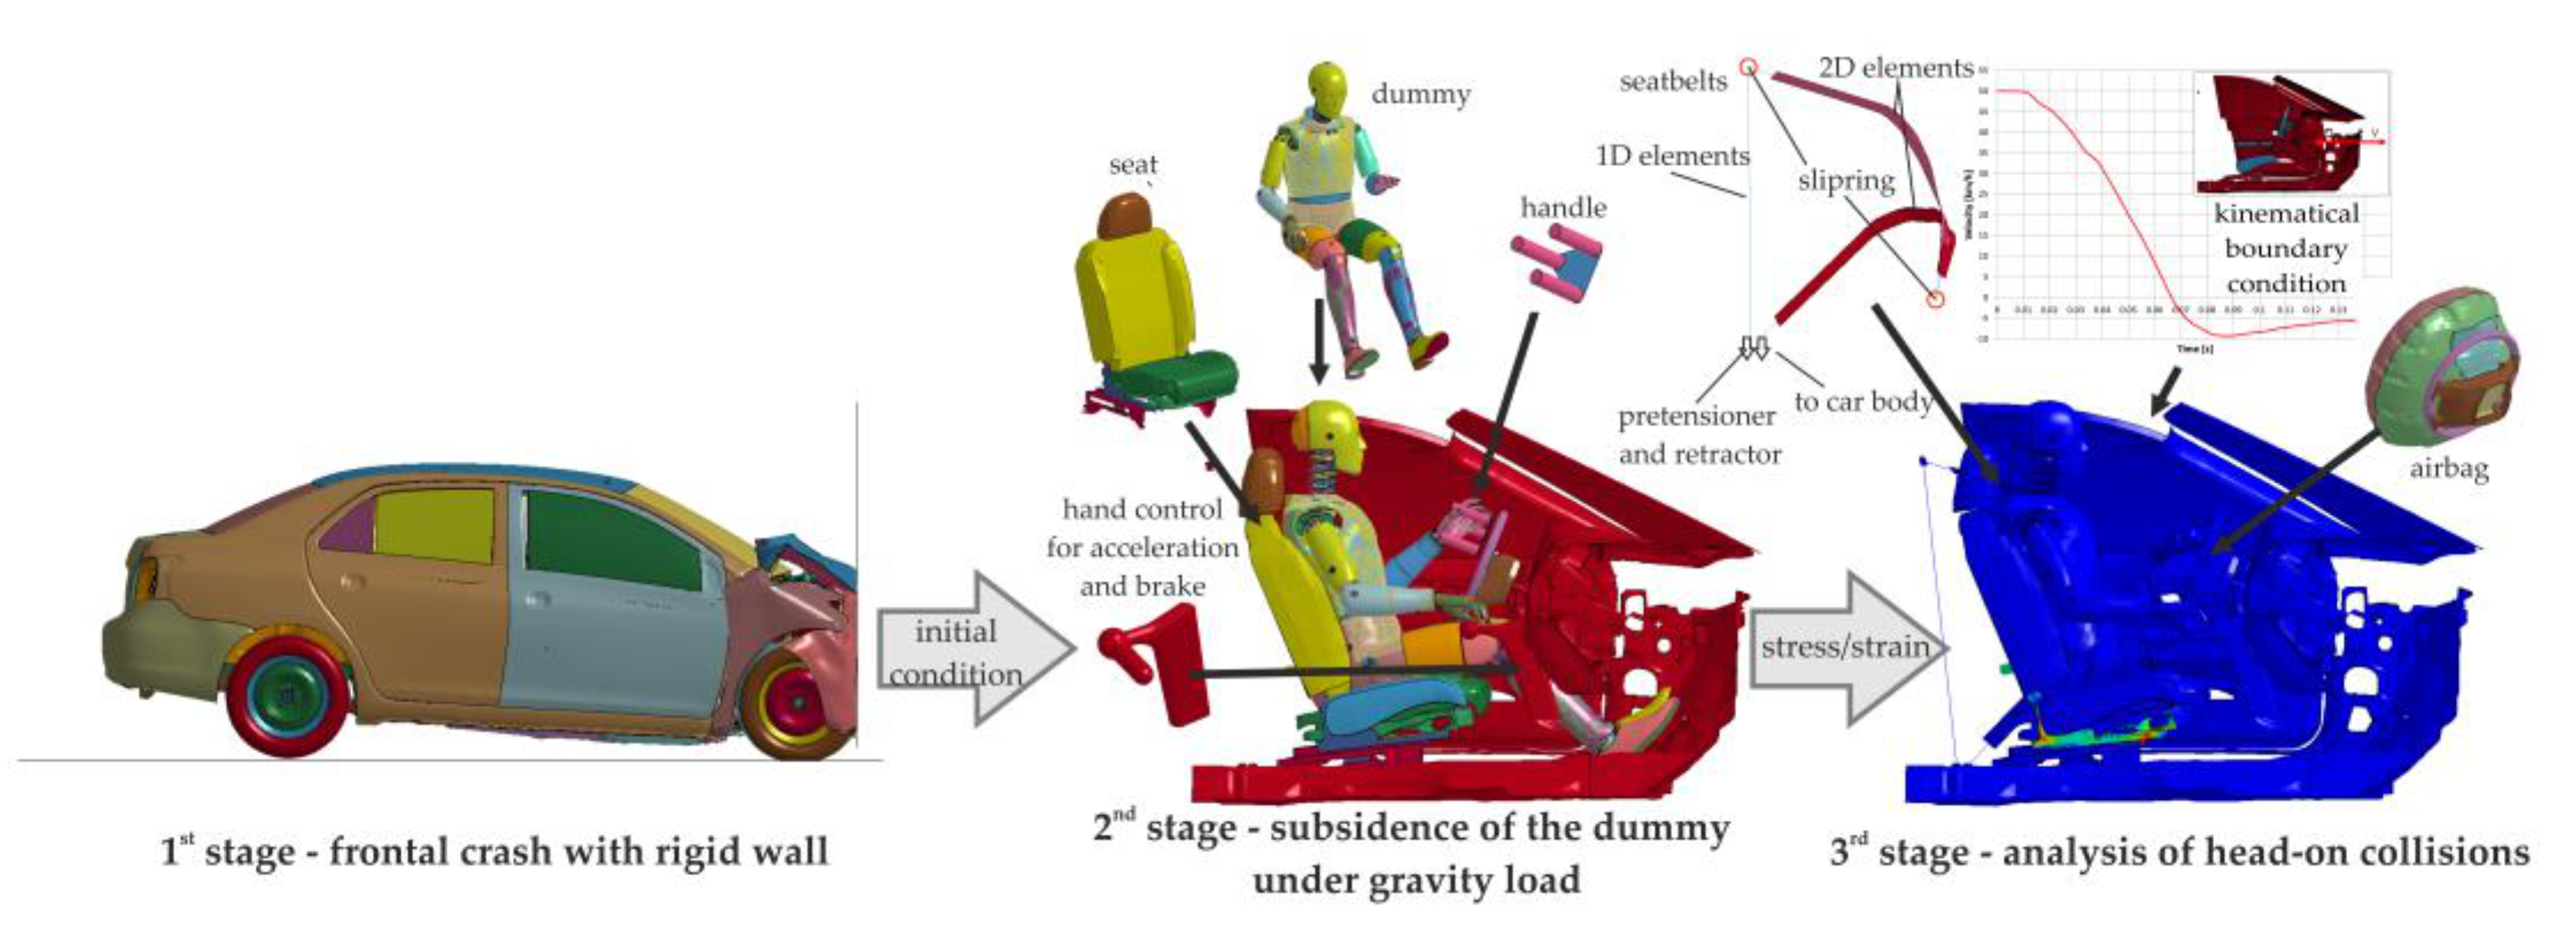
27]. The big disadvantage of these methods is the long calculation time. To reduce it, it is possible to use different strategies. One of them is an approach in which a global collision is analyzed using analytical or 2D models and the results are transferred to 3D models and further analysis of only a selected area. A second solution is to use multi-stage analyses, in which selected aspects of a hazardous road event are investigated independently.

2. Materials and Methods

2.1. Numerical Research Strategy

The main objective of this article is to examine the impact of the change in the position of the driver’s mass, caused by various types of disabilities or the use of specialist equipment, on the driver’s biomechanical parameters. Additional objectives are to show how to model selected elements of car safety systems and to draw attention to possible changes in the driver’s biomechanics related to the adaptation of the car to the needs of the disabled.
This article is a continuation and development of models described in the work [28]. The paper uses a three-stage scheme of numerical tests (Figure 1), in which the first stage is to carry out an analysis of the frontal impact of the validated full car model [28]. Based on these analyses, the change of velocity of the vehicle interior, which is used in the third stage, is determined. The second stage involves subsidence a dummy on the seat while resting its limbs on the floor, the steering wheel or a special handle mounted on the steering wheel and the manual gas and brake control unit. The subsidence is a very important process. It involves the dummy falling under the gravity load on the interior elements of the vehicle. This deforms the structure of e.g., the seat and causes forces between them, which are transferred to the third stage. The magnitude of these forces directly affects the magnitude of the friction forces and thus the behaviour of the dummy during the impact.
For numerical simulations carried out using the LS-Dyna system, two approaches to the realisation of this stage are popular. The former involves positioning the dummy in a roughly approximate position, positioning the belts and performing dynamic relaxation [18,29]. The advantage of this approach is its low numerical cost and rather low level of complexity. During the analysis, additional damping is added, which facilitates and shortens the subsidence process (oscillations of the manikin’s position are dampened much faster). The dynamic relaxation is performed immediately before the actual numerical analysis, and the analysis time after the relaxation is 0.0 s, so there is no need to define appropriate shifts in numerical procedures defined later. Strains and deformations from dynamic relaxation are transferred automatically to the target analysis.
The second approach involves carrying out a full analysis of the subsidence process of the dummy (using an explicit or implicit time integration) [30,31]. In such analysis the dummy, under the influence of gravity, falls on the interior elements of the vehicle. The result is a file containing, for the time corresponding (termination time), the state of deformation, stresses and forces acting between the individual elements. Starting the collision analysis requires a full restart, which includes the procedure of loading the state from the end of the subsidence analysis (as an external file with the option stress initialisation), changing the initial (boundary change, etc.), boundary and inducement conditions by defining appropriate cards (preparing a new model file).
A simpler and less demanding method in terms of computer power is one that uses dynamic relaxation. However, it is limited by the problems with the safety belt retractor. During dynamic relaxation it is performed to a limited extent, which may result in a lack of adequate belt tension at the beginning of the final crash analysis. Therefore, the authors decided on an approach involving the performance of a full subsidence analysis using explicit time integration (stage 2 in Figure 1).

2.2. Numerical Model Description

In the numerical models developed by the authors, great emphasis has been placed on considering key elements of safety systems that can influence the behaviour of the driver’s body during a frontal collision, while at the same time applying simplifications that do not significantly affect his behaviour. Therefore, on the basis of previously conducted research, it was decided to model only a section of the vehicle and give it the properties of a rigid body [28]. Deformable seat, steering wheel handle, airbag and seat belts were modelled inside the vehicle [28] (Figure 2).
The seat belts were modelled on the basis of previously conducted experimental research [18,28,29]. Their arrangement was carried out using the seatbelt fitting procedure, available in the LS-Prepost pre-processor. Belts were modelled as 2D elements (for parts where their contact with the dummy is important) and as 1D elements for parts near attachment points (Figure 3). The lower belt is rigidly attached to the vehicle body on the right-hand side of the driver and to the ear connected to the seat base on the right. The function of the ear is performed by a special seatbelt slipring numerical element [30,31], thanks to which the shortening of one 1D element can be transformed into an extension of the other 1D element. The relation between the displacements of the ends of the two connected belts (Figure 3) is described using the following equation:
x1 = x2 + Δl1 + Δl2
Δl1 = (F1∙l1)/(A1∙E1)
Δl2 = (F2∙l2)/(A2∙E2)
x1 = x2 + (F1∙l1)/(A1∙ E1) + (F2∙l2)/(A2∙E2)
F1 = F2 + Ft = F2 + F1∙μ = F2/(1 − μ)
where: x1, x2—displacement of the ends of 1D seat belts elements, Δl1, Δl1—elongation and shortening of connected elements, F1, F2—tensioning force, A1, A2—cross section of elements, E1, E2—Young modulus of elements, Ft—friction force in slipring, μ—coefficient of friction.
If both belts (bottom and top) are made of the same material, the final formula is as follows.
x1 = x2 + ((F2/(1 − μ))∙l1 + F2∙l2)/ (A∙E) = x2 + (F2∙(l1/(1 − μ) + l2))/(A∙E)
Thanks to the use of this type of numerical element, the “shortening” of the lower belt can be turned into the “lengthening” of the upper belt, i.e., it is possible to implement the rewinding of the belt through the assembly eye. In the developed numerical models, the upper belt starts and ends with the slipring elements. In the upper attachment, the belt changes direction and is connected to the attachment point in the lower part of the vehicle body, in which the elements representing the pretensioner and retractor are modelled. When modelling seat belts, the position of the attachment points should not be changed in relation to the points in the actual car, as this changes the length of the belt, which in turn affects its global deformation under the influence of force.
In numerical models, the pretensioner has been modelled using the SEATBELT_RETRACTOR [30,31] type element that generates constant belt tension up to the pull-out force limit above which the retractor locks. The retractor is also locked when the pretensioner (SEATBELT_PRETENSIONER [30,31]) is activated, which retracts the belt until it reaches the user-defined belt tension limit. In these cases, the belt was activated by an acceleration sensor (SEATBELT_SENSOR) which registers the front acceleration of the vehicle. When the acceleration of 25.0 m/s2 was exceeded, the sensor activated the pretensioner. The retractor and the pretensioner operate numerically similarly to the rewinder, with the difference that the shortening of the belt is not converted into the lengthening of another belt but is recorded as the retracted length of the belt.

2.3. Analysed Cases

During the research, three main groups of drivers were analysed: without disabilities (RD-reference driver), with disabilities requiring the use of a special steering wheel handle (H—group, HB—handle basic) and with a steering wheel handle and a manual gas and brake control unit (C—group, CB—control unit basic) (Figure 4). The use of specialist equipment may be required by various disabilities, such as paralysis or lack of a limb. Therefore, the HB and CB dummies have been modified so that it is possible to perform analyses for limbless dummies (Figure 5). The limb amputation, when compared to the paralysis, from the frontal impact analysis point of view primarily changes the position of the body’s centre of gravity and reduces the areas of contact between the body and the vehicle interior. Figure 4 and Figure 5 show the changes in the driver’s mass (dm) and centre of gravity position for each of the analysed cases in the global coordinate system (dx, dy, dz).
An individual subsidence analysis was conducted for each of the cases studied, preceded by positioning the dummy in an estimated target position. In each group, the initial setting was identical, so that only the impact of amputation of a given limb was examined.

3. Results

The results for the first and second stage, which covers the frontal impact of the whole car and subsidence, are presented in [28]. This study will only present the results for stage three.
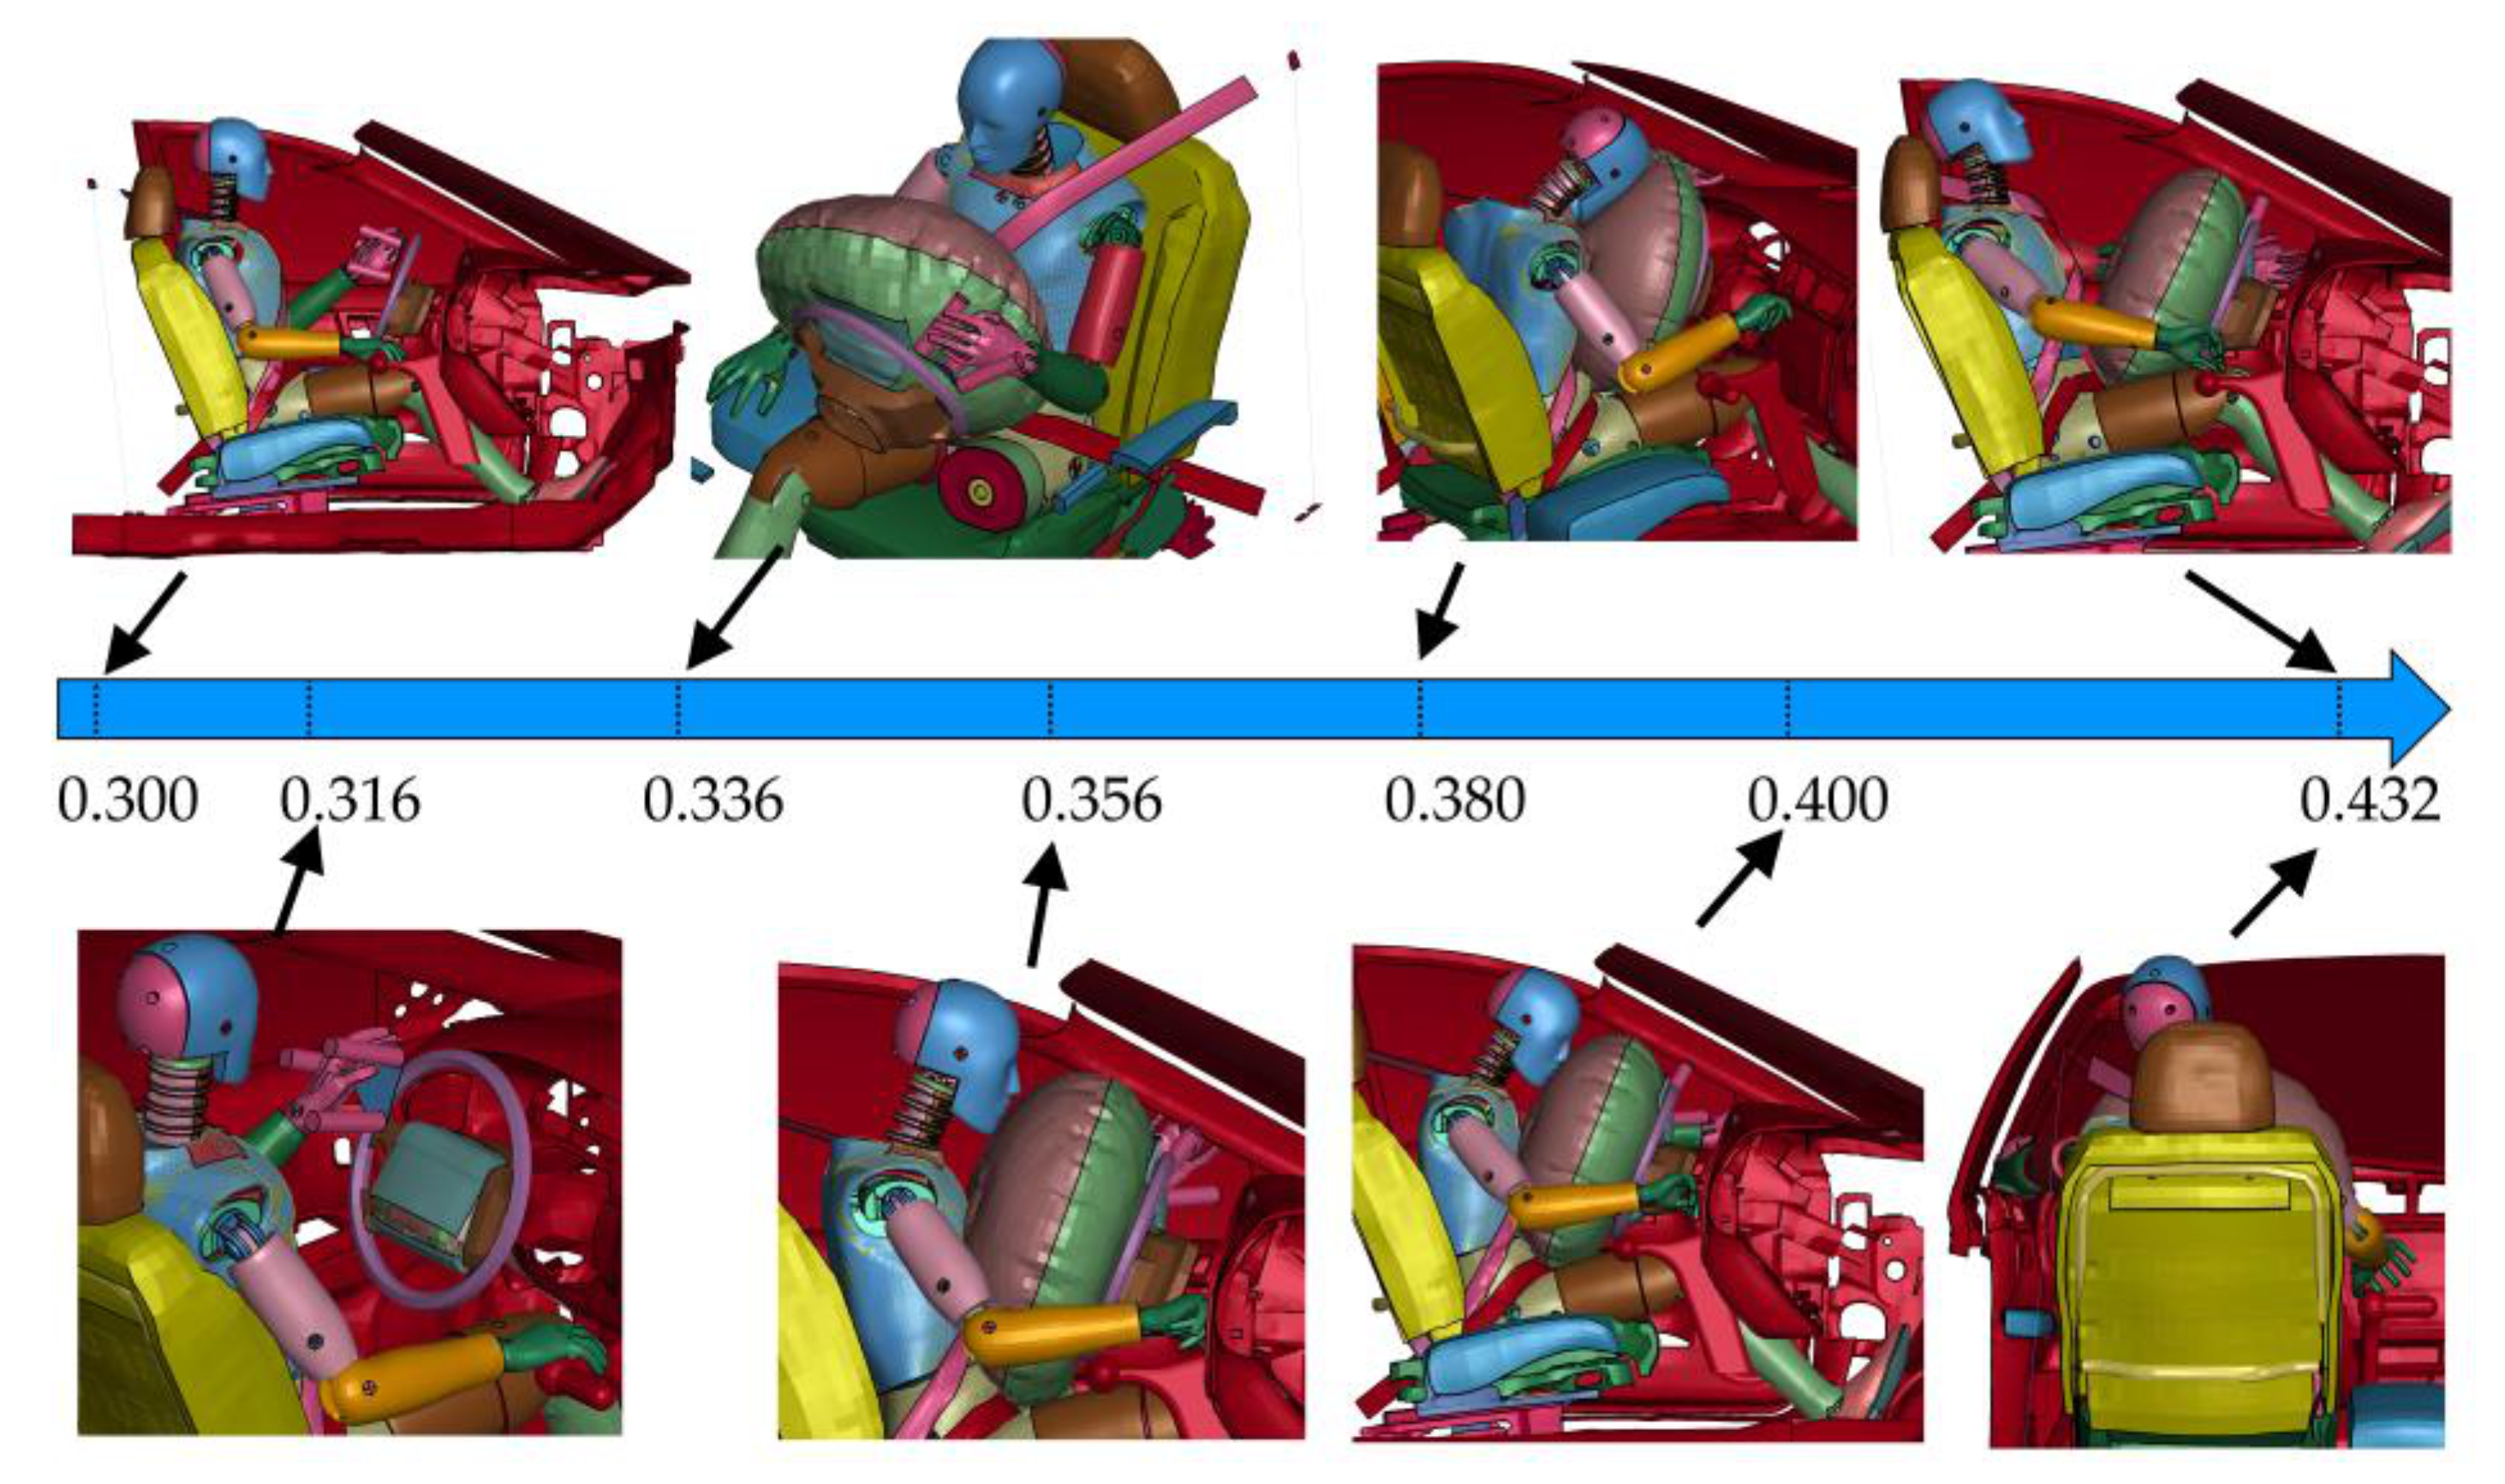
During all analysed cases, characteristic time moments presented in Figure 6 can be distinguished. The subsidence stage ended at time t = 0.3 s and this is also the beginning of the analysis of the third stage. After approx. 10 ms, the airbag and belt pretensioner were activated. At t = 0.316 s the initial airbag opening is visible. After 36.0 ms, the airbag is close to full inflation, which pushes the upper limbs out of the steering wheel or handles. After 56.0 ms, the dummy’s head encounters the airbag. At t = 0.380 s, the head reaches the maximum forward tilt, followed by the driver’s rebound and a rearward movement to the seat. The contact between the driver’s head and the airbag lasts until the time t = 0.400 s. At a time of approx. t = 0.432 s, the dummy hits the seat’s backrest. This impact is asymmetrical to the seat.
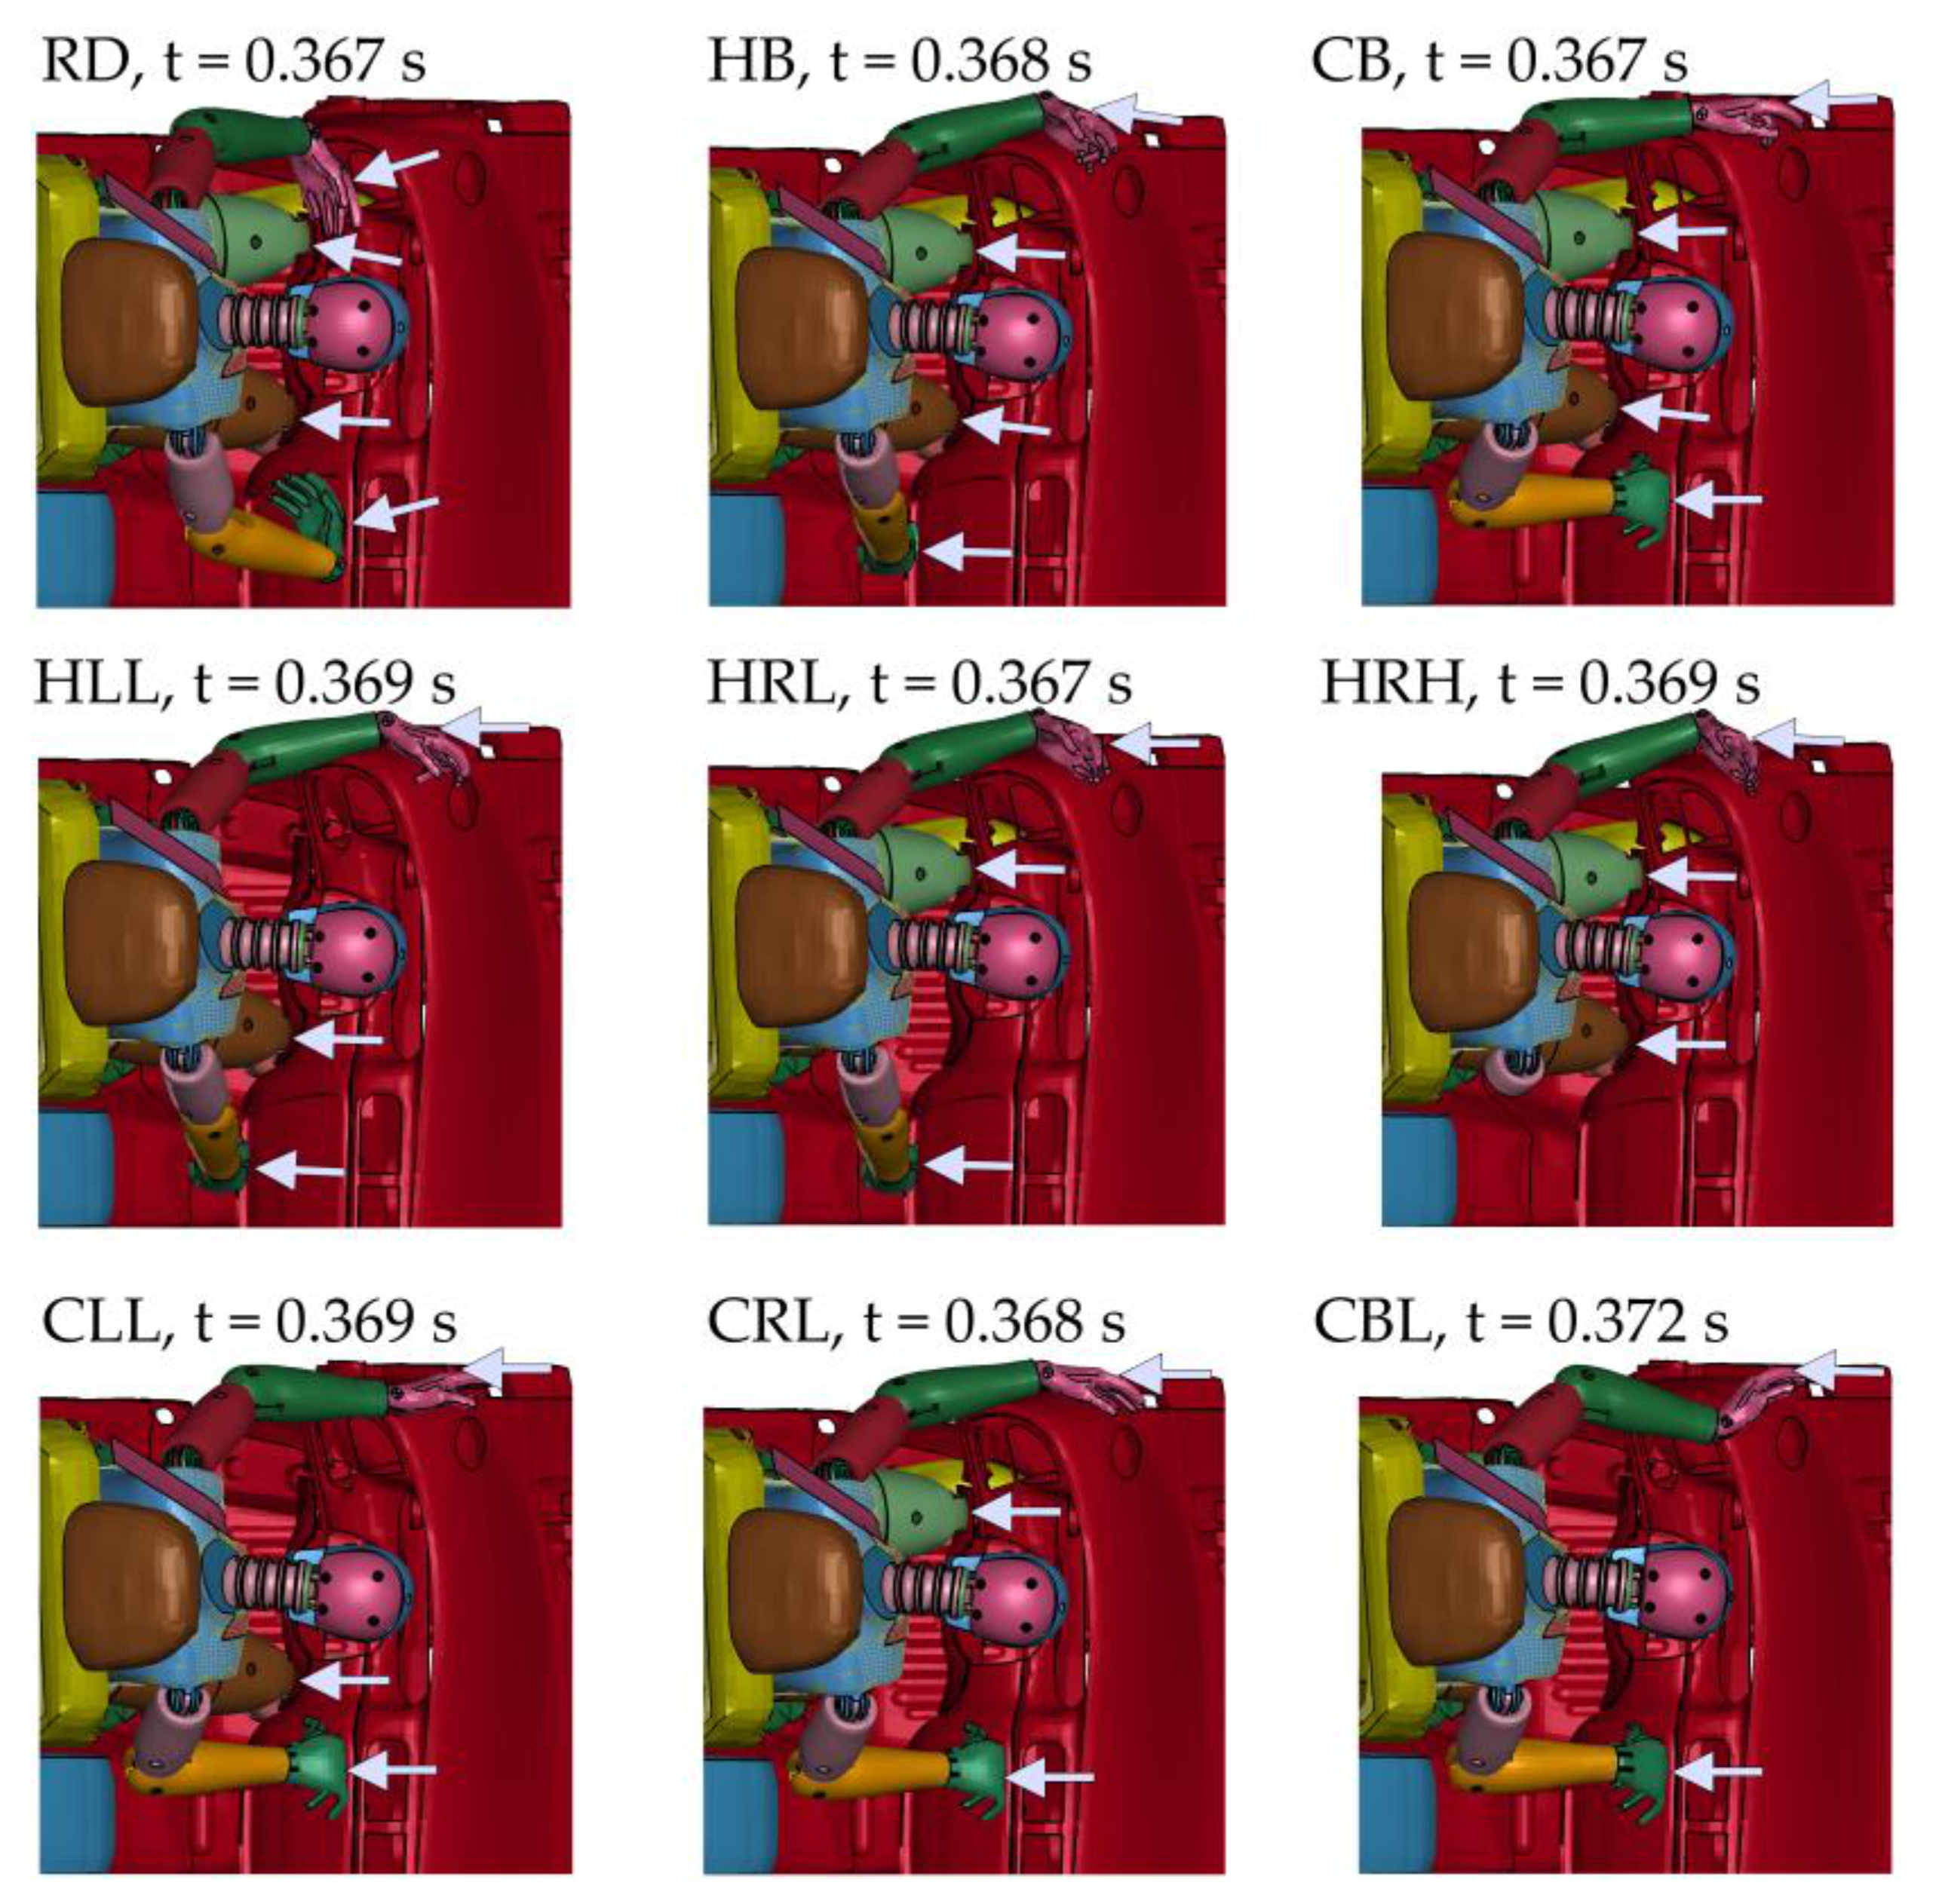
The maximum longitudinal displacement of the conventional centre of gravity of the dummy (i.e., corresponding to the centre of mass without amputation) is achieved at different times in each case (Figure 7). It is worth noting that at this moment, depending on the equipment used, the position of the dummy differs. In the RD case, the forearms and arms are pushed outwards while keeping the hands within the steering wheel. Knees hit the elements of the space under the steering wheel. In cases H, the left hand is pushed completely out of the steering wheel and the right hand hits the lower part of the central console. In cases C, the right hand strikes higher and in a different position. In cases H and C, the number of zones of contact between the dummy and the vehicle interior depends on the disability under consideration.
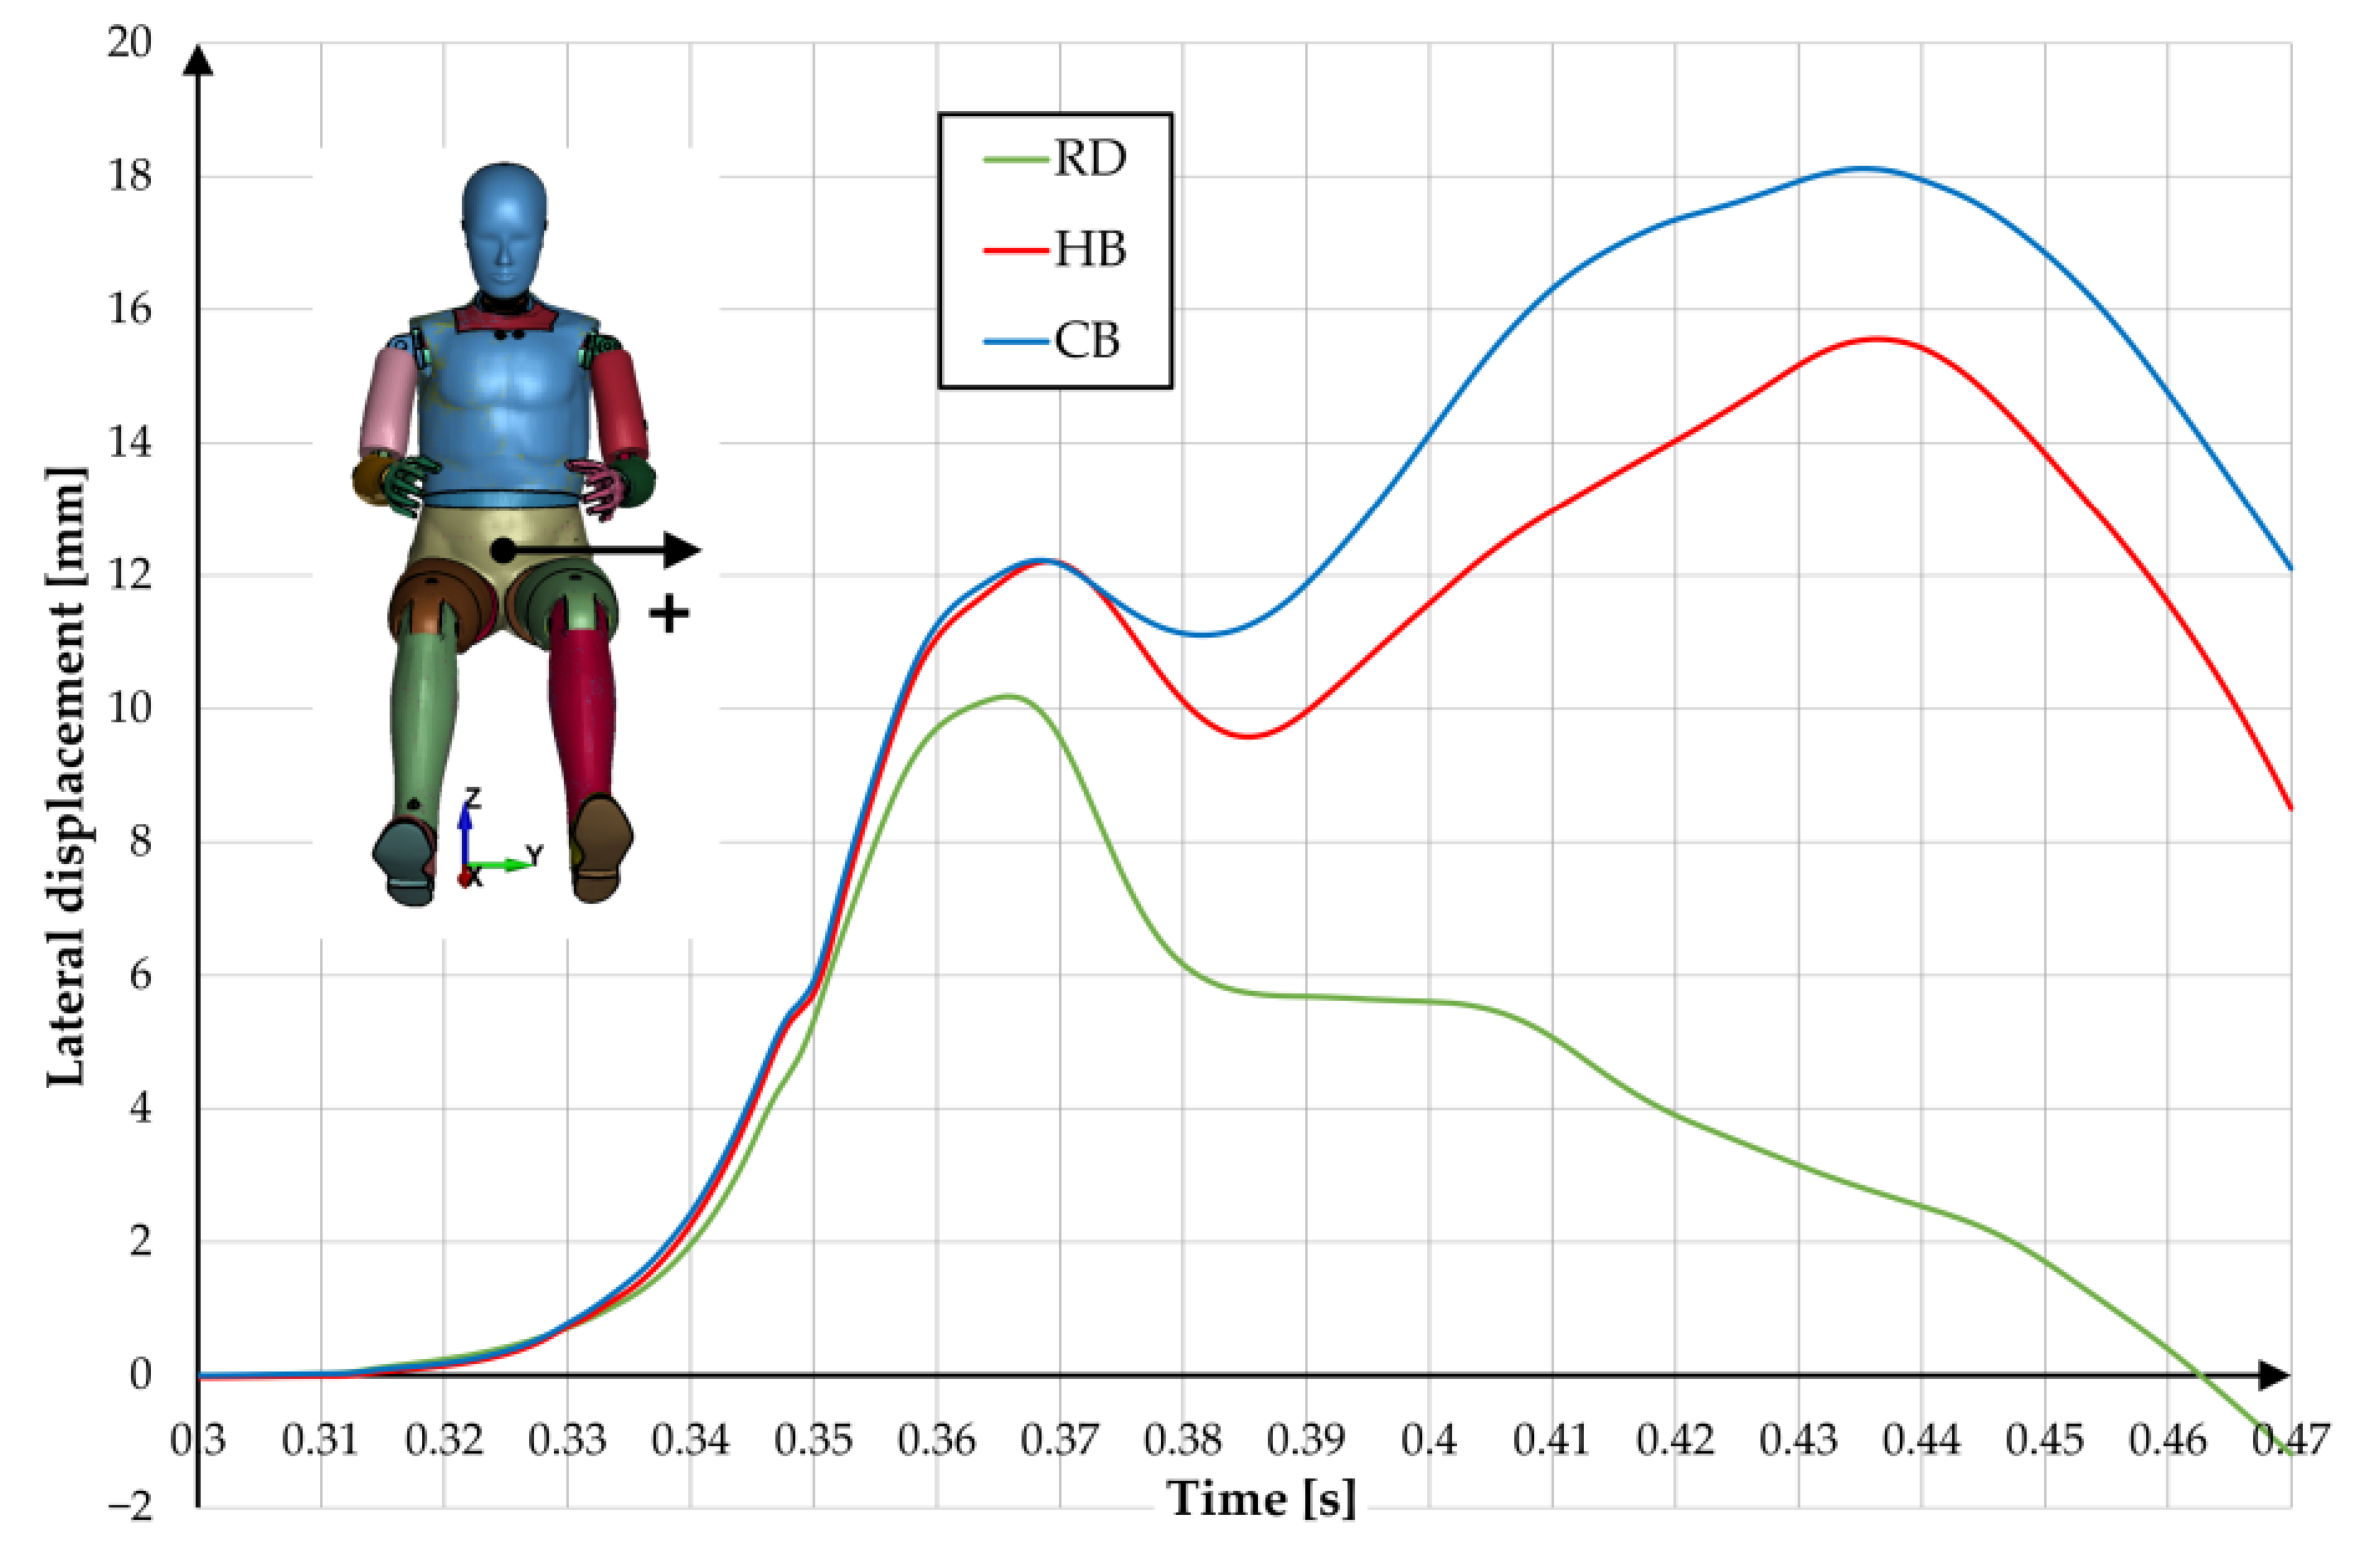
The type of equipment used significantly affects the lateral displacements of the driver’s conventional centre of gravity. In the RD case, the maximum displacement was about 10 mm and, importantly, in the final stage of impact the pelvis almost returned to its initial position (Figure 8). In the HB and CB cases, there is no return to the initial position and much greater maximum lateral displacement when the dummy hits the seat (approx. 15.5 mm and 18.0 mm respectively).
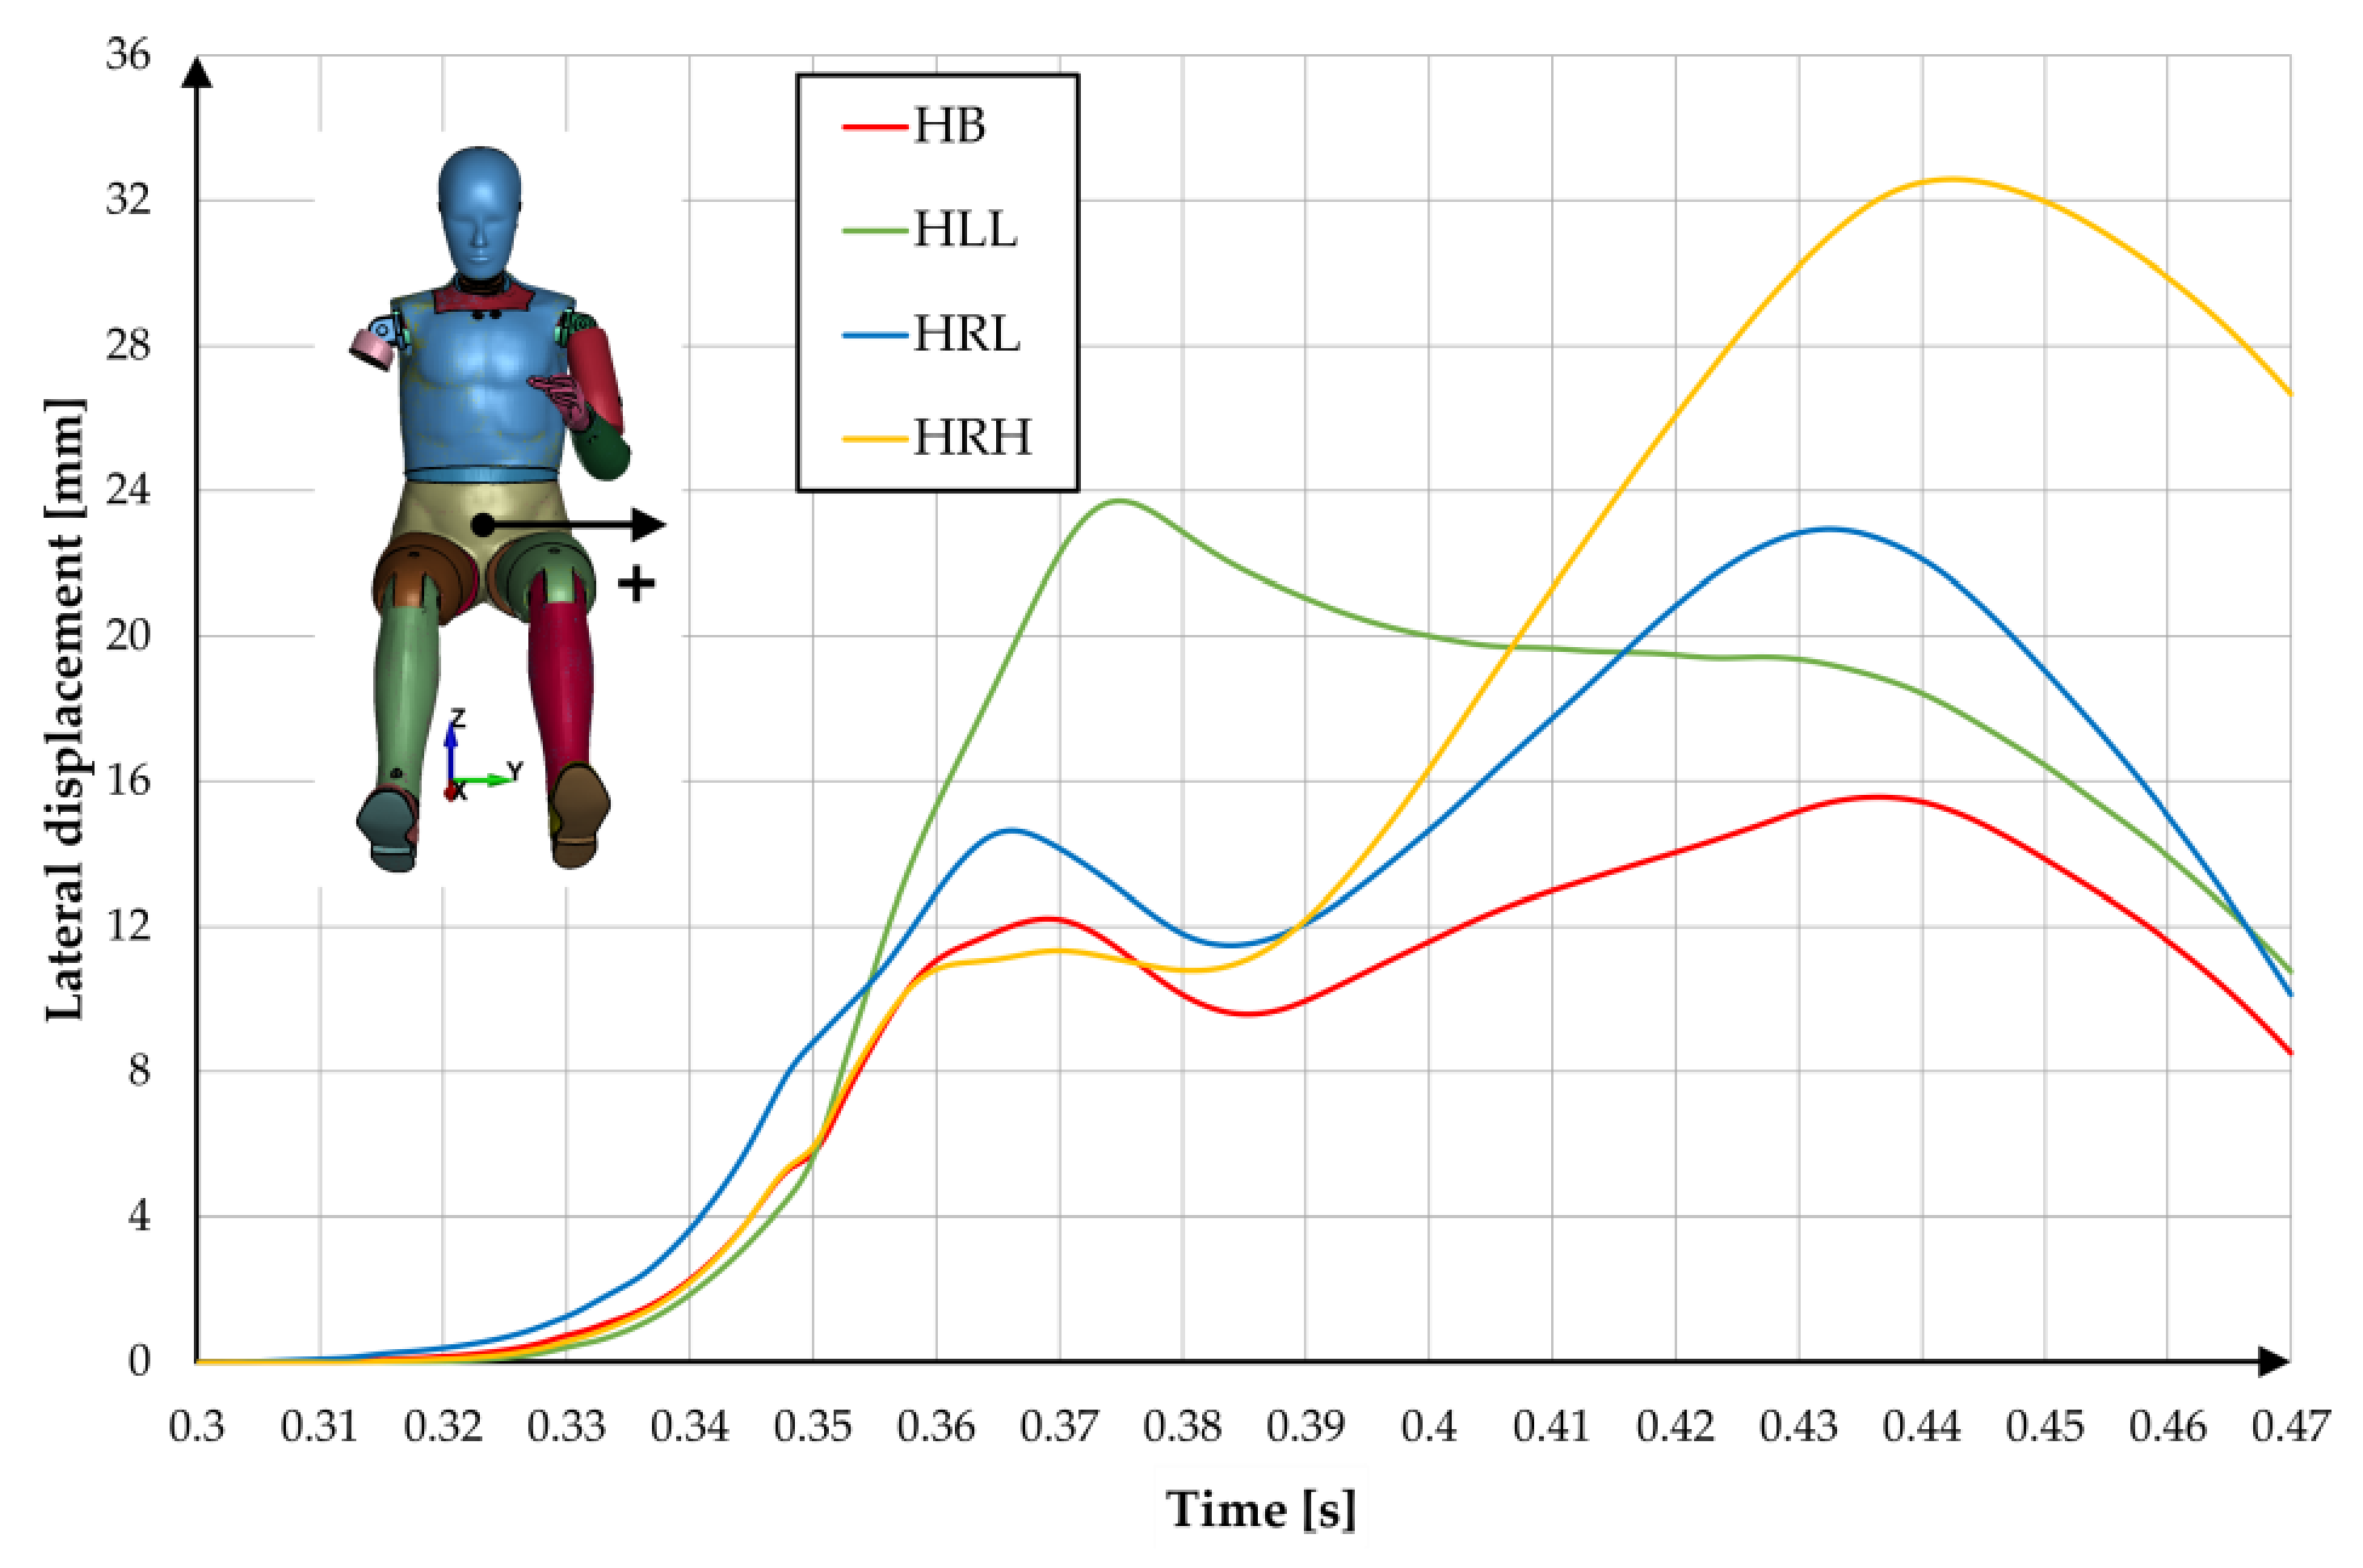
Analysing the H group, it can be seen that at the moment of the maximum longitudinal displacement of the dummy’s centre of gravity in relation to the seat, the maximum lateral displacement occurs for HLL (Figure 9). In turn, when the dummy hits the seat’s backrest, the maximum lateral displacement is for HRH (about 29 mm).
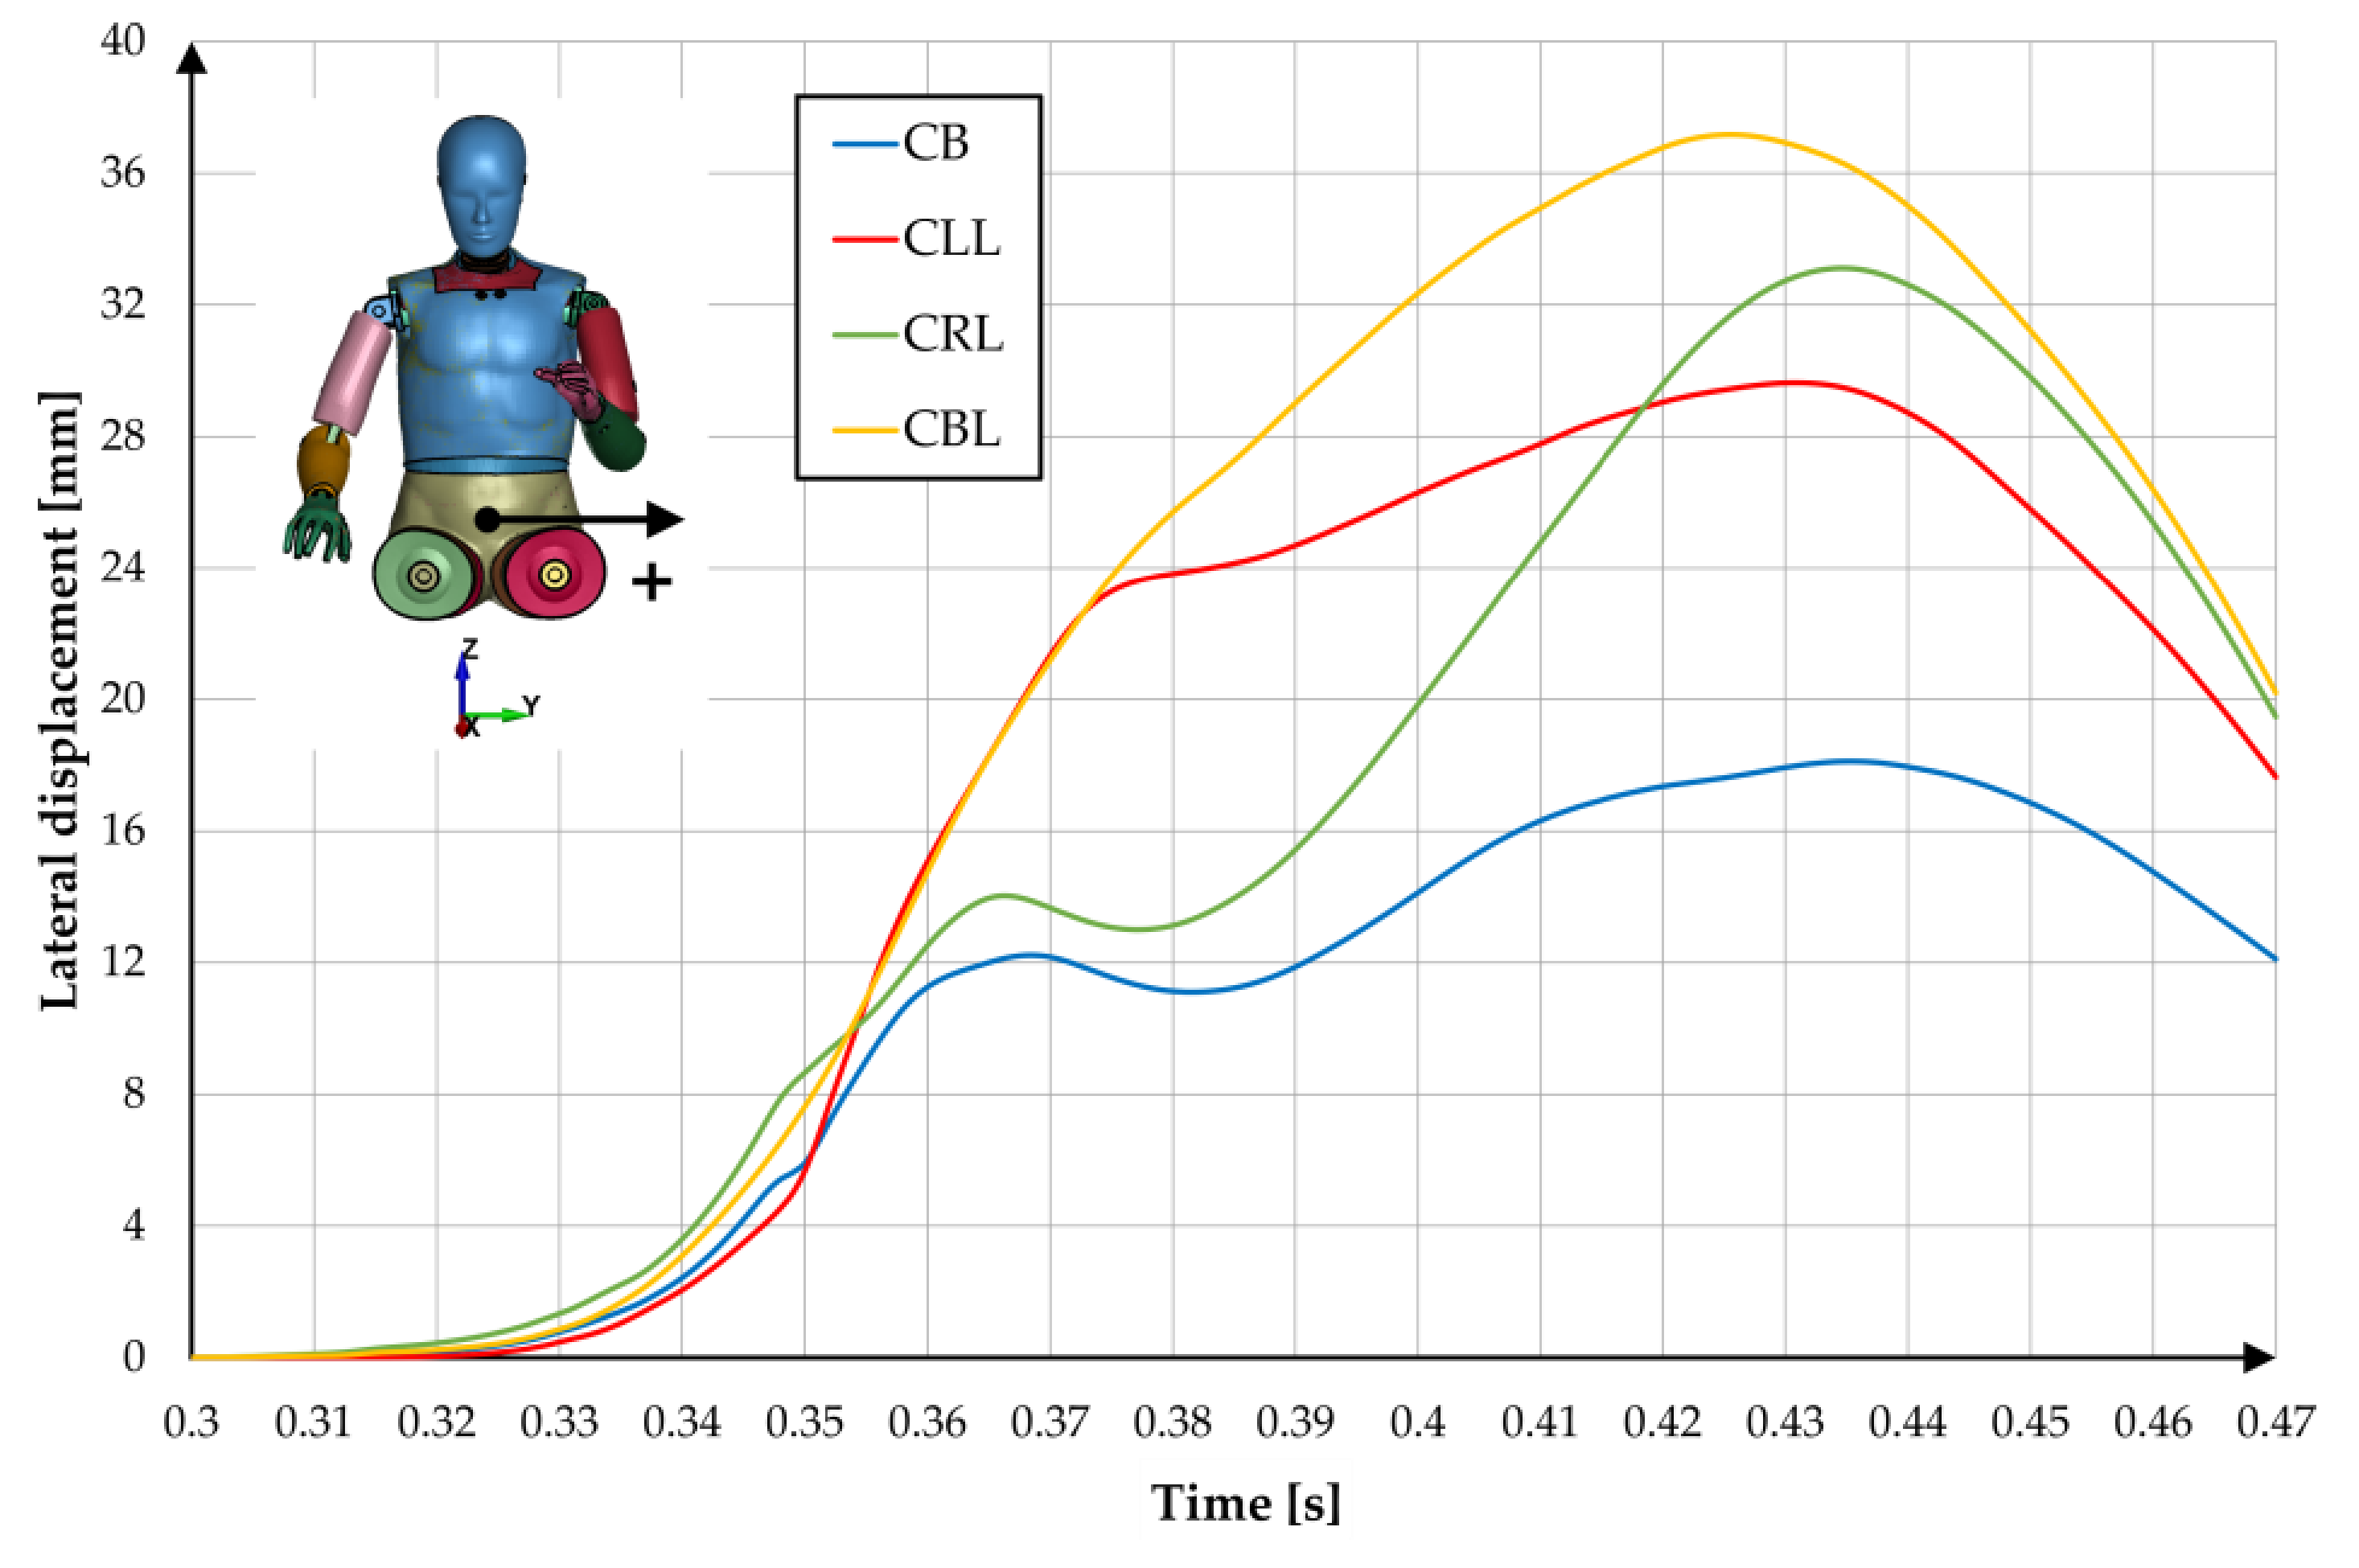
In group C the greatest lateral displacement can be observed for CLL, CRL and CBL cases (Figure 10).
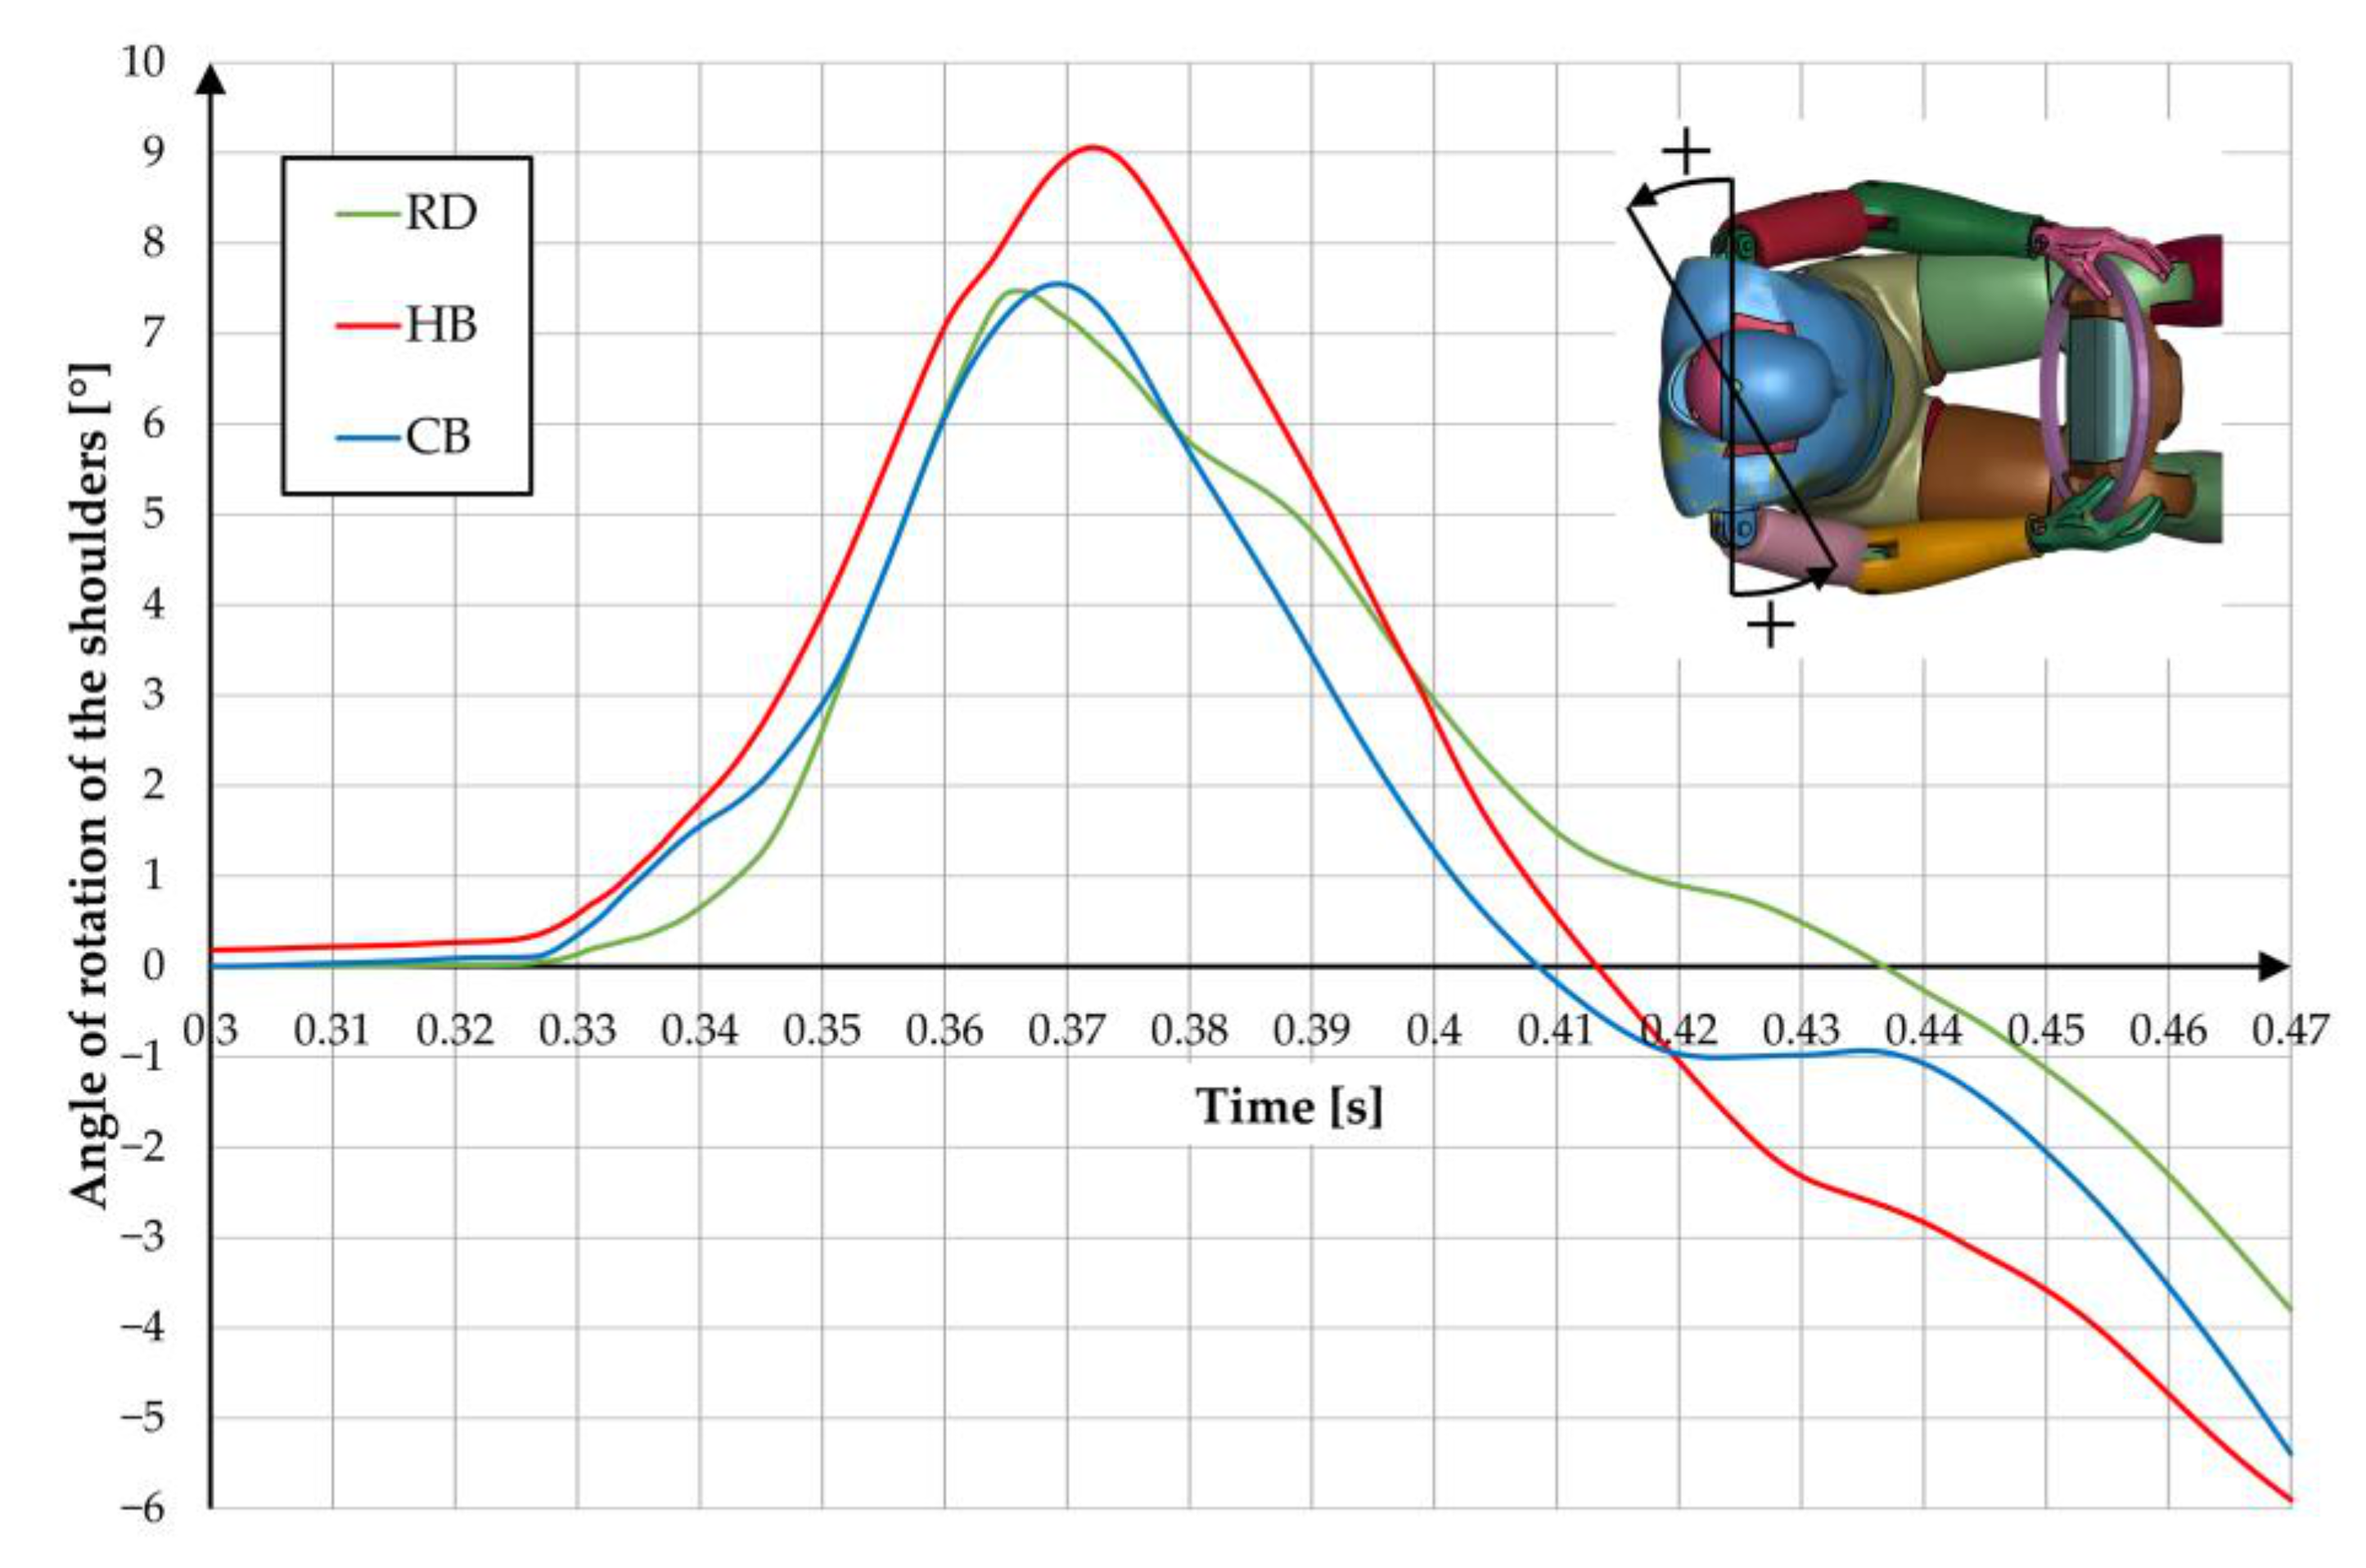
Lateral movements go with shoulder rotation. When analysing the influence of the equipment used for DP (Figure 11), there is no significant change. At the initial impact phase, in all cases, the right shoulder extends forwards more and, after rebounding from the airbag, the arms start to rotate in the opposite direction.
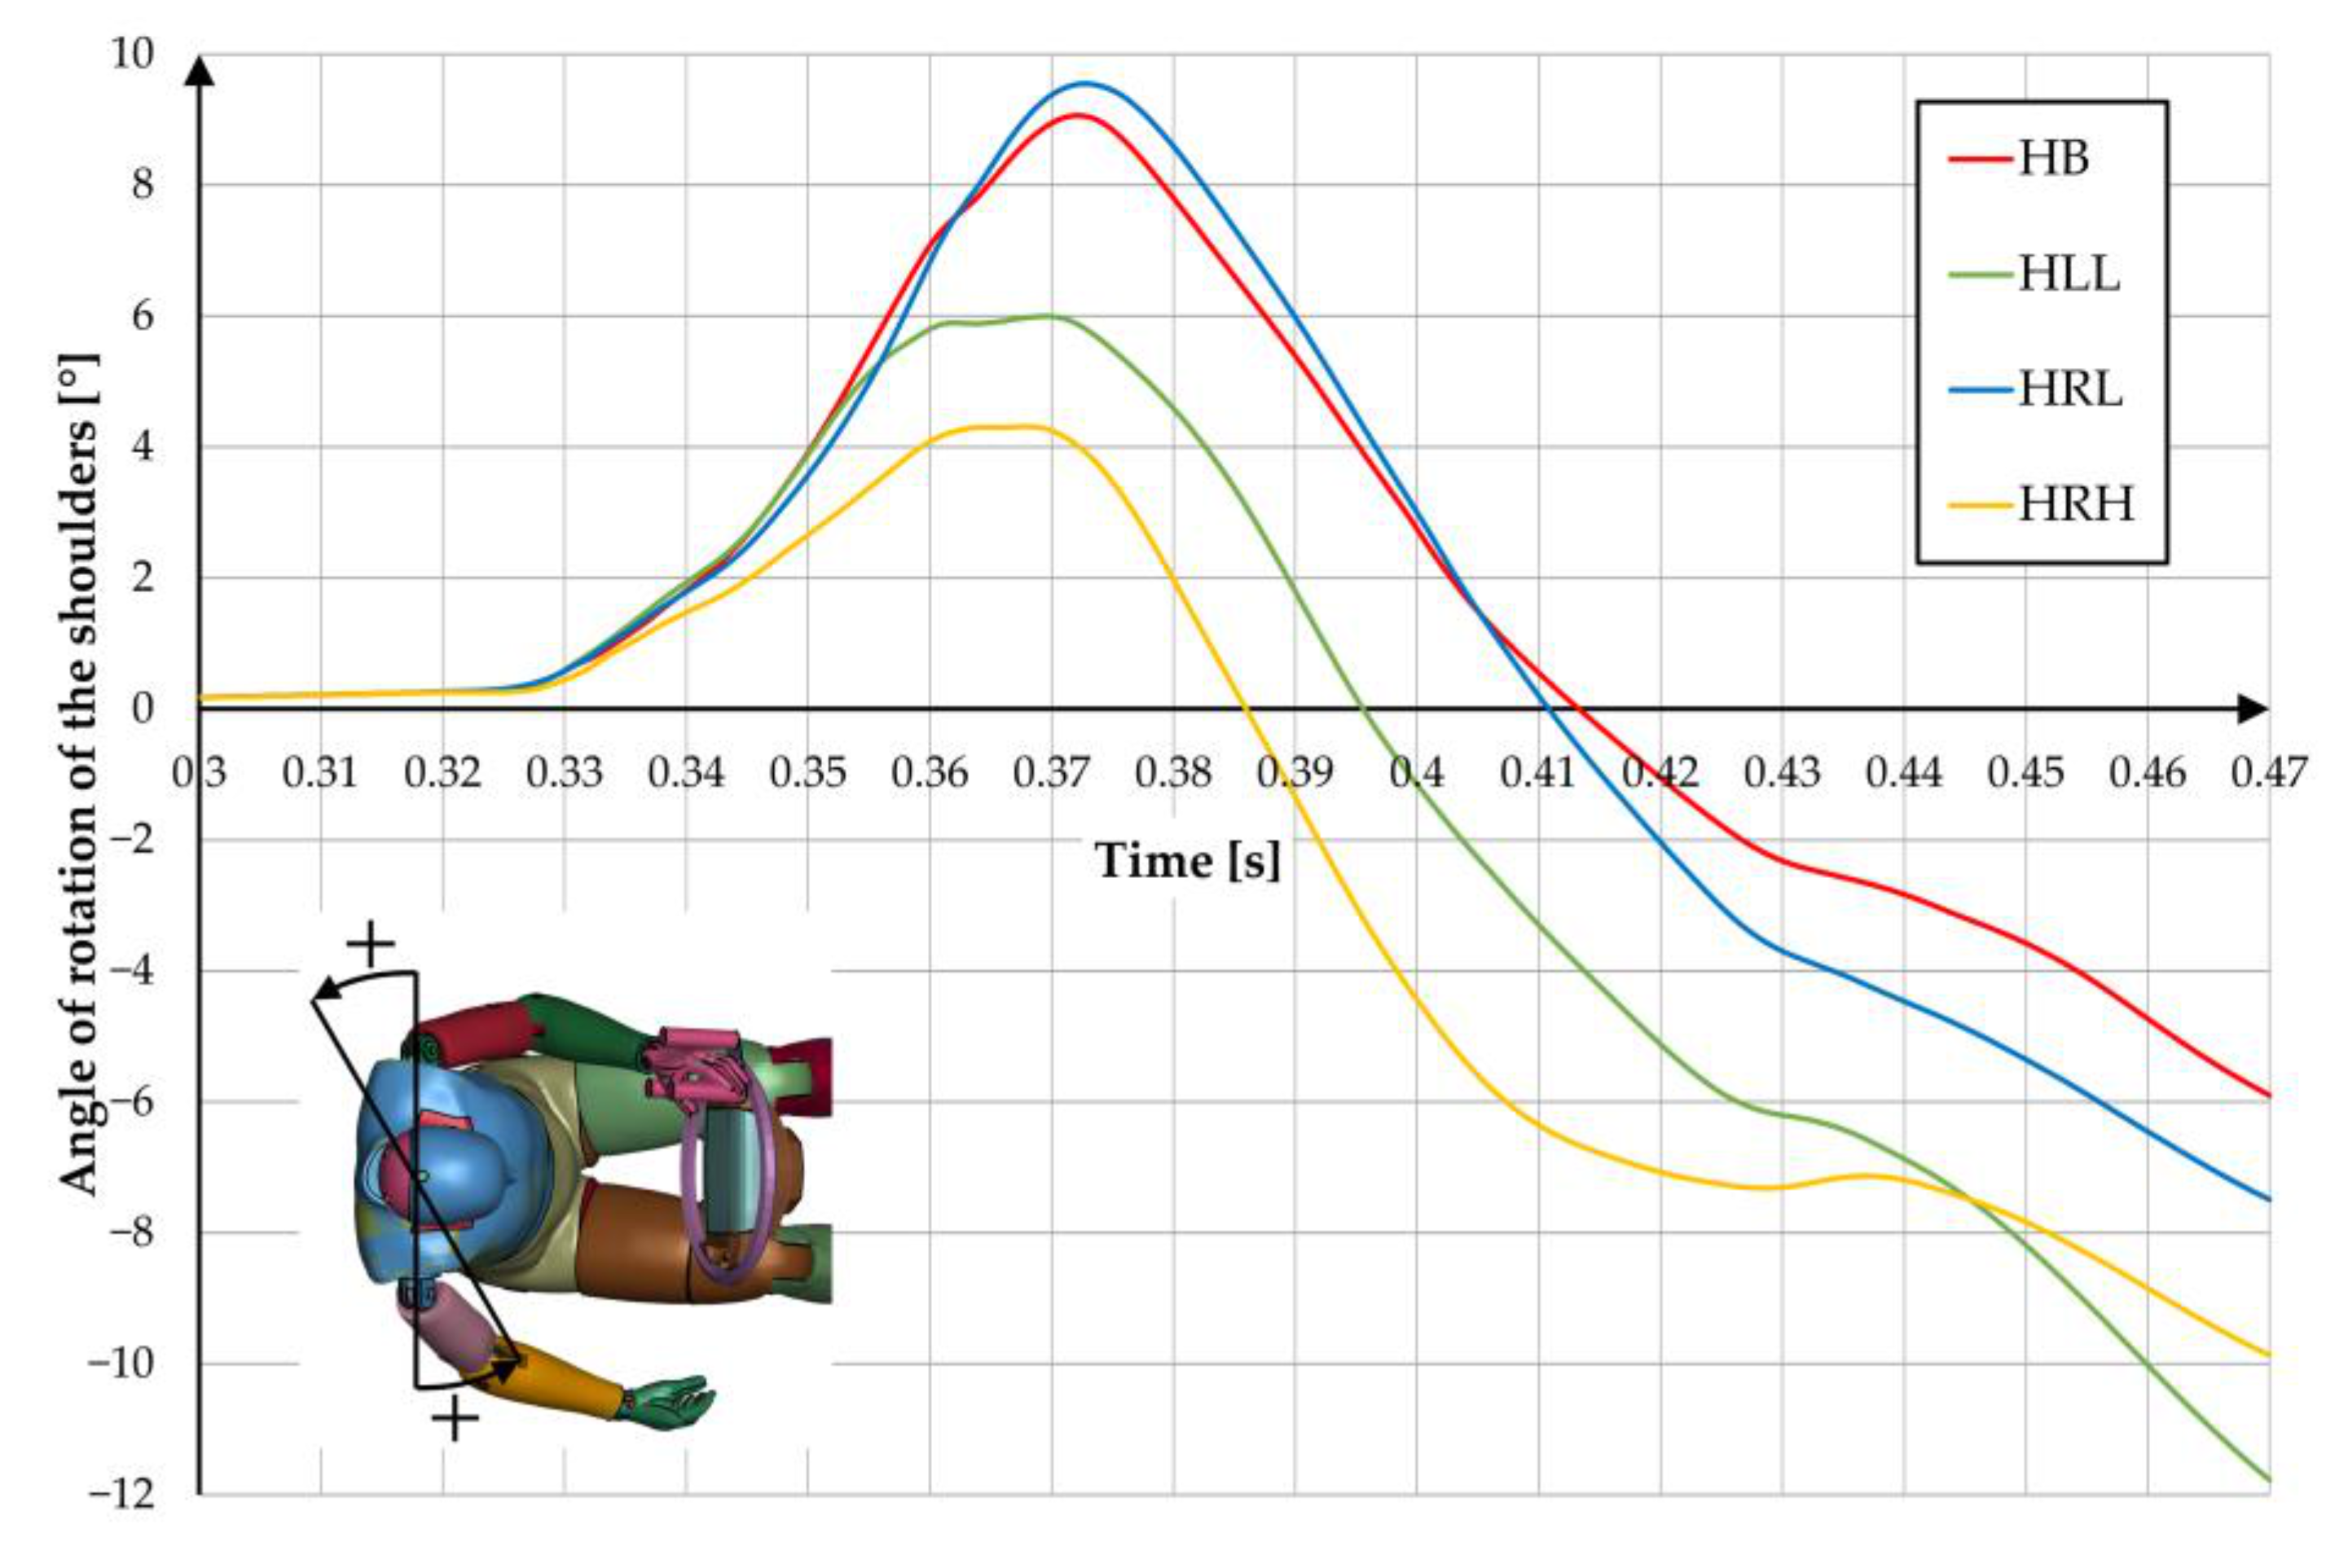
Analysing group H, one can see the same type of changes, but with different levels of them (Figure 12). The highest rotation in the first impact phase is for HB and HRL cases (about 9°). In the second phase, for HLL and HRH (above 10°).
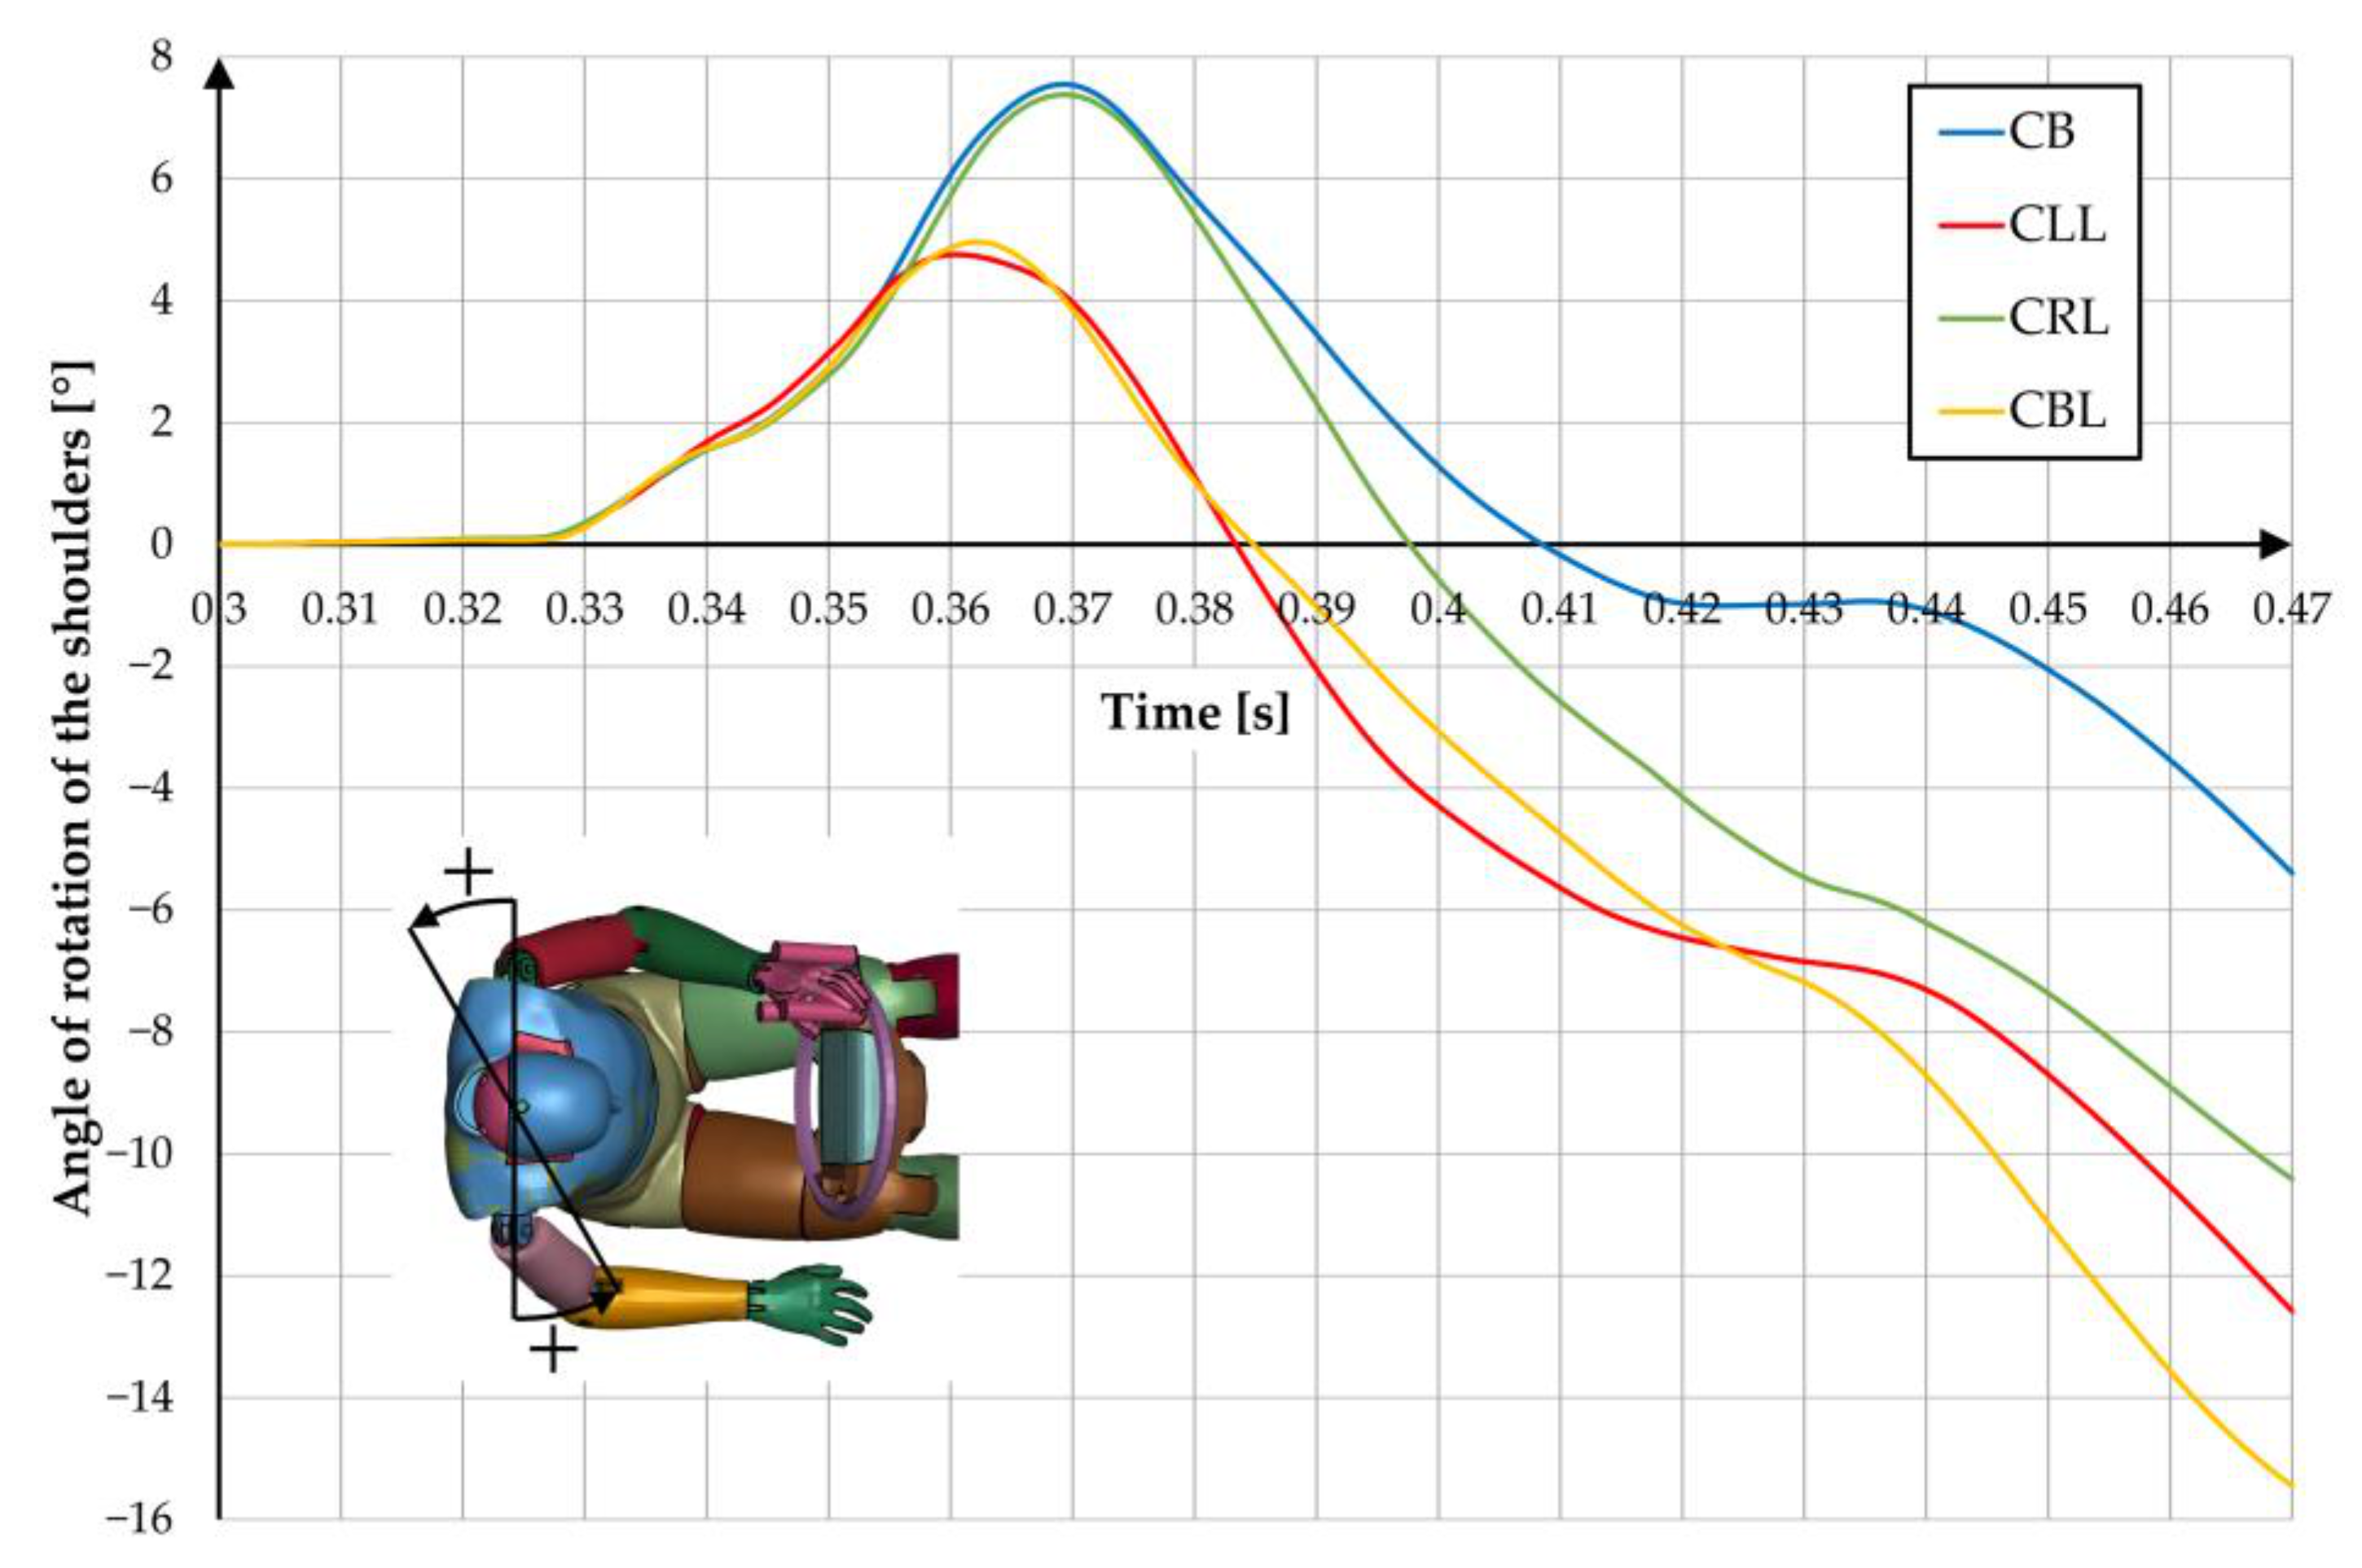
Similarly, for group C (Figure 13). In the first phase, the highest rotation is for CB and CRL (about 7.5°) and in the second phase for CLL (over 12°) and CBL (over 15°).
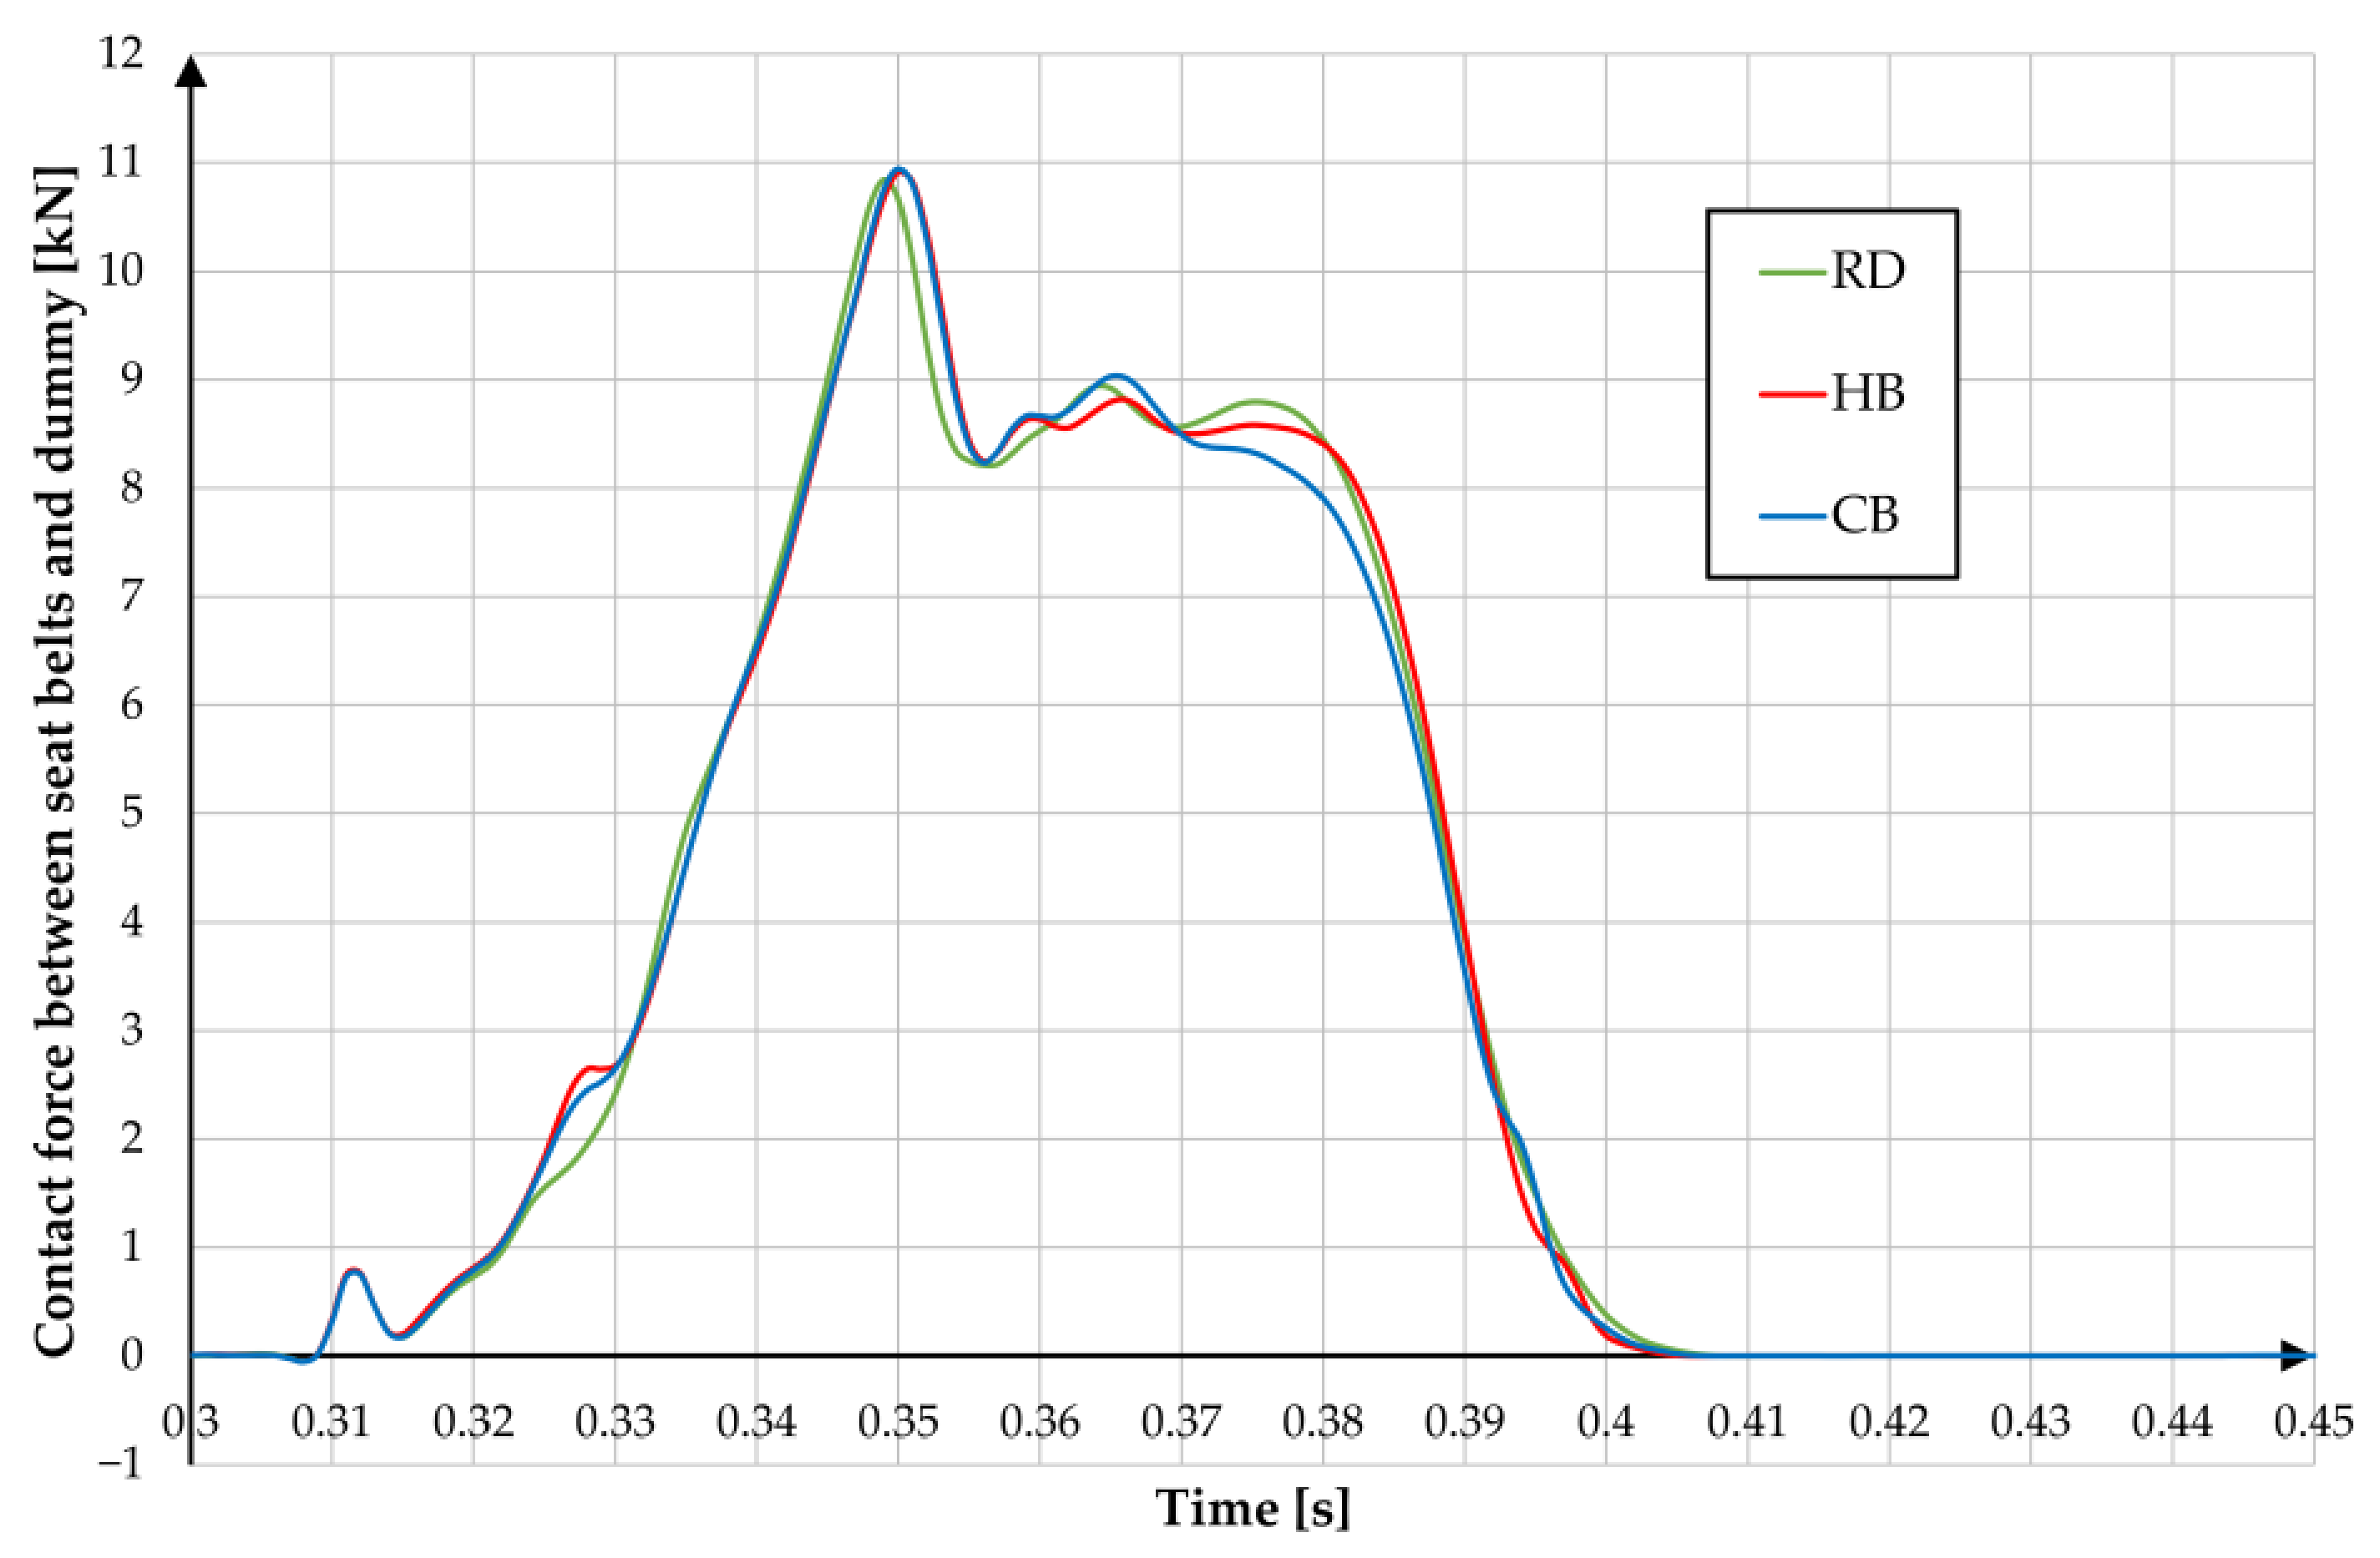
The work also analysed the course of change of forces between the dummy and seat belts. In cases where the dummy had all the limbs, no significant changes between the individual runs are visible (Figure 14). The highest peak of strength occurs immediately before the head of the dummy (and thus part of the chest) contacts the airbag. After that time, the value drops by about 2 kN and is maintained until the maximum longitudinal displacement of the dummy in relation to the chair is reached.
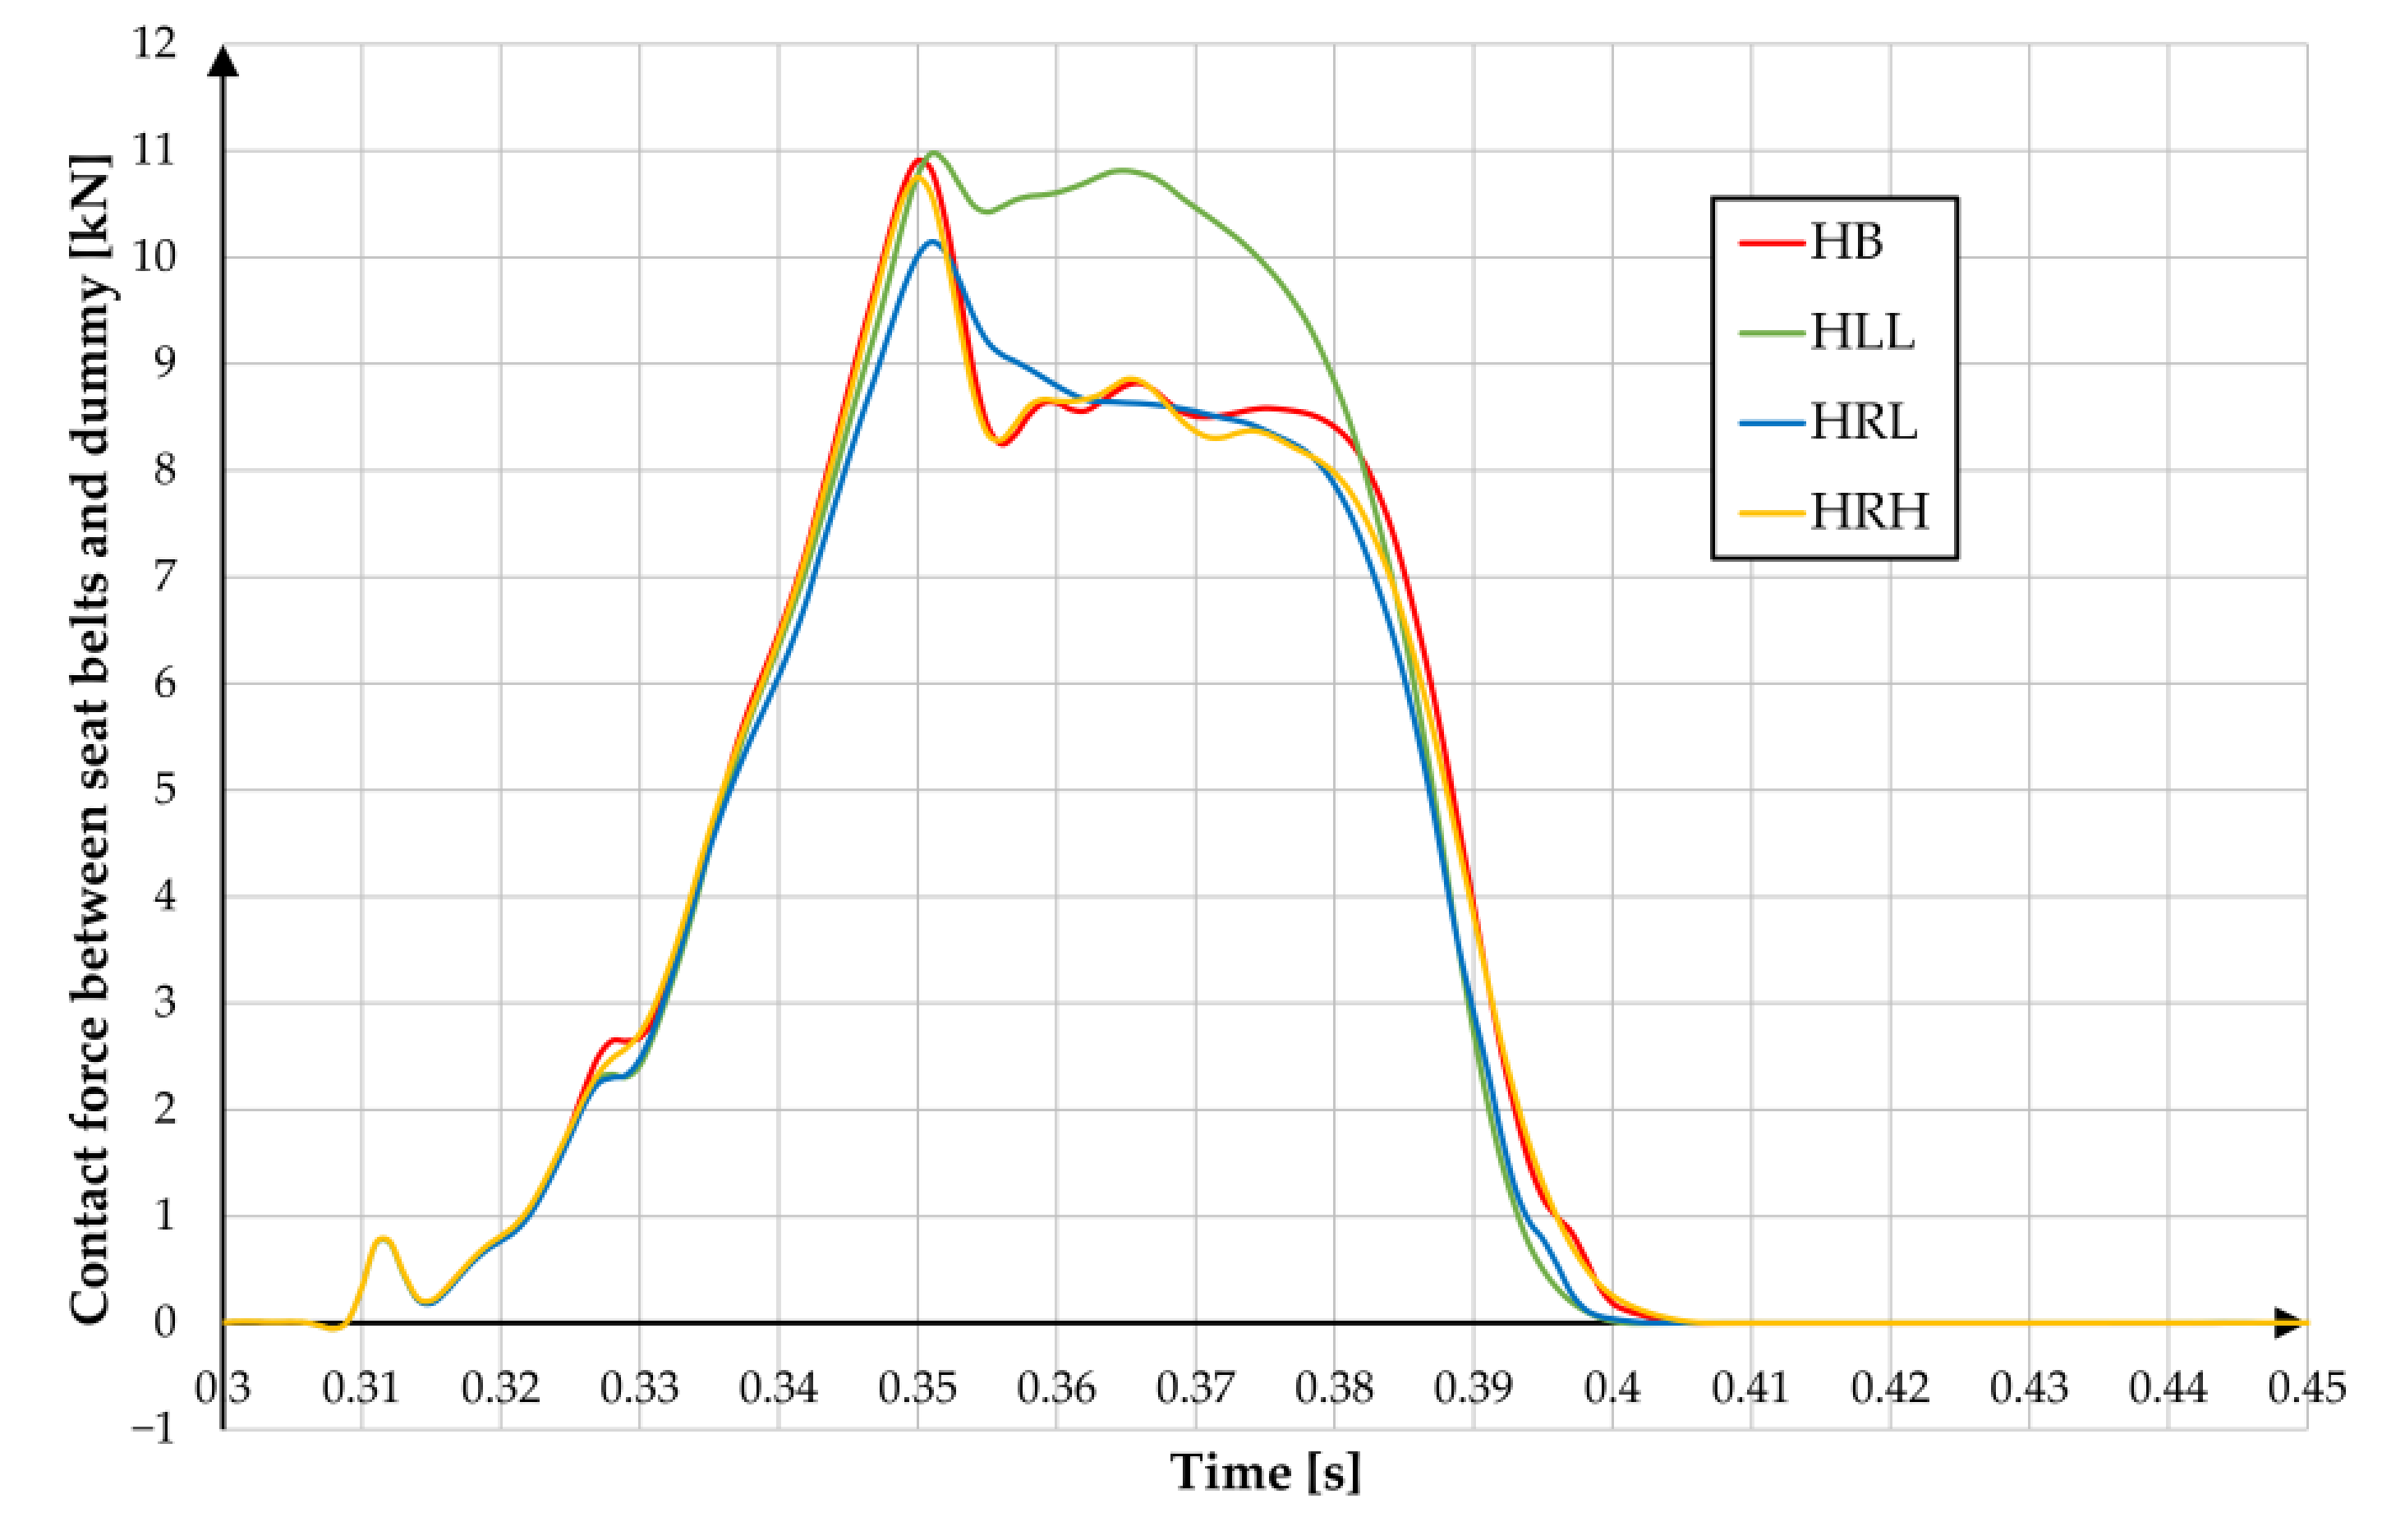
A similar character of the course of force between the belts and the dummy can be observed for analyses from group H (Figure 15). Only in the HLL there is no decrease in force, it remains at a constant level until the time when the maximum movement of the longitudinal dummy in relation to the seat is reached.
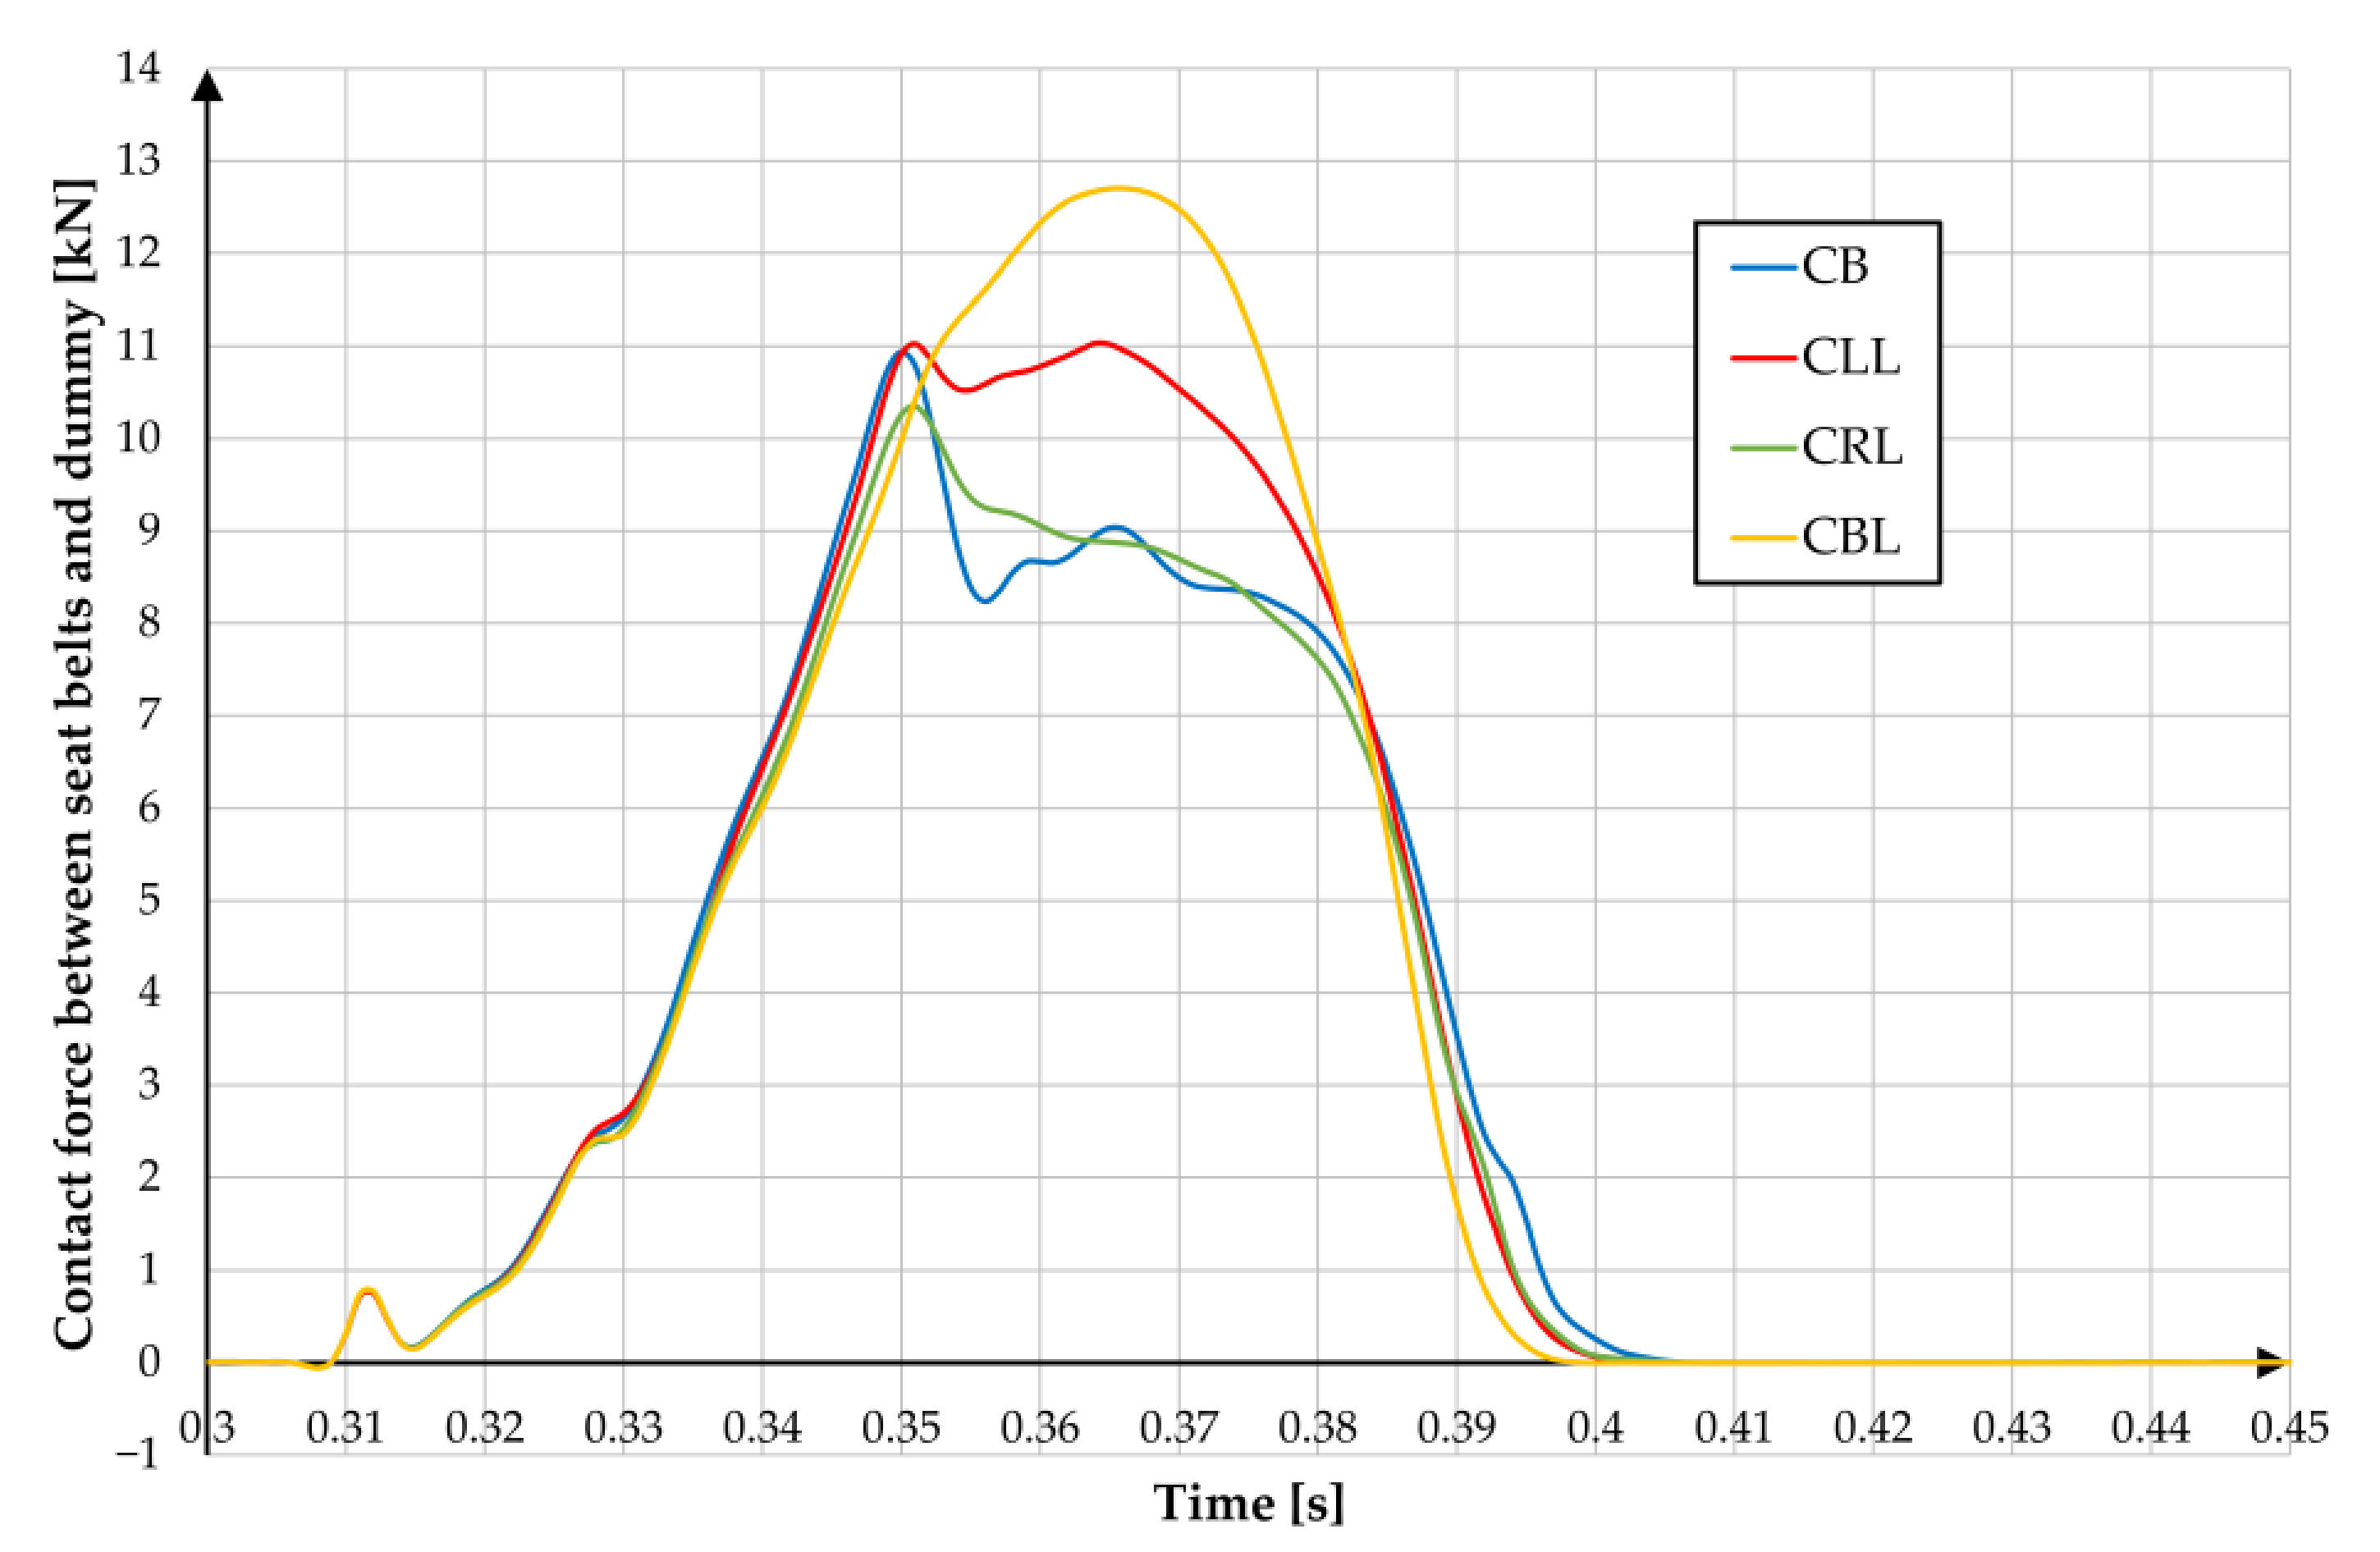
In group C (Figure 16), no loss of strength after the dummy starts to contact the airbag is visible in two cases—CBL and CLL.
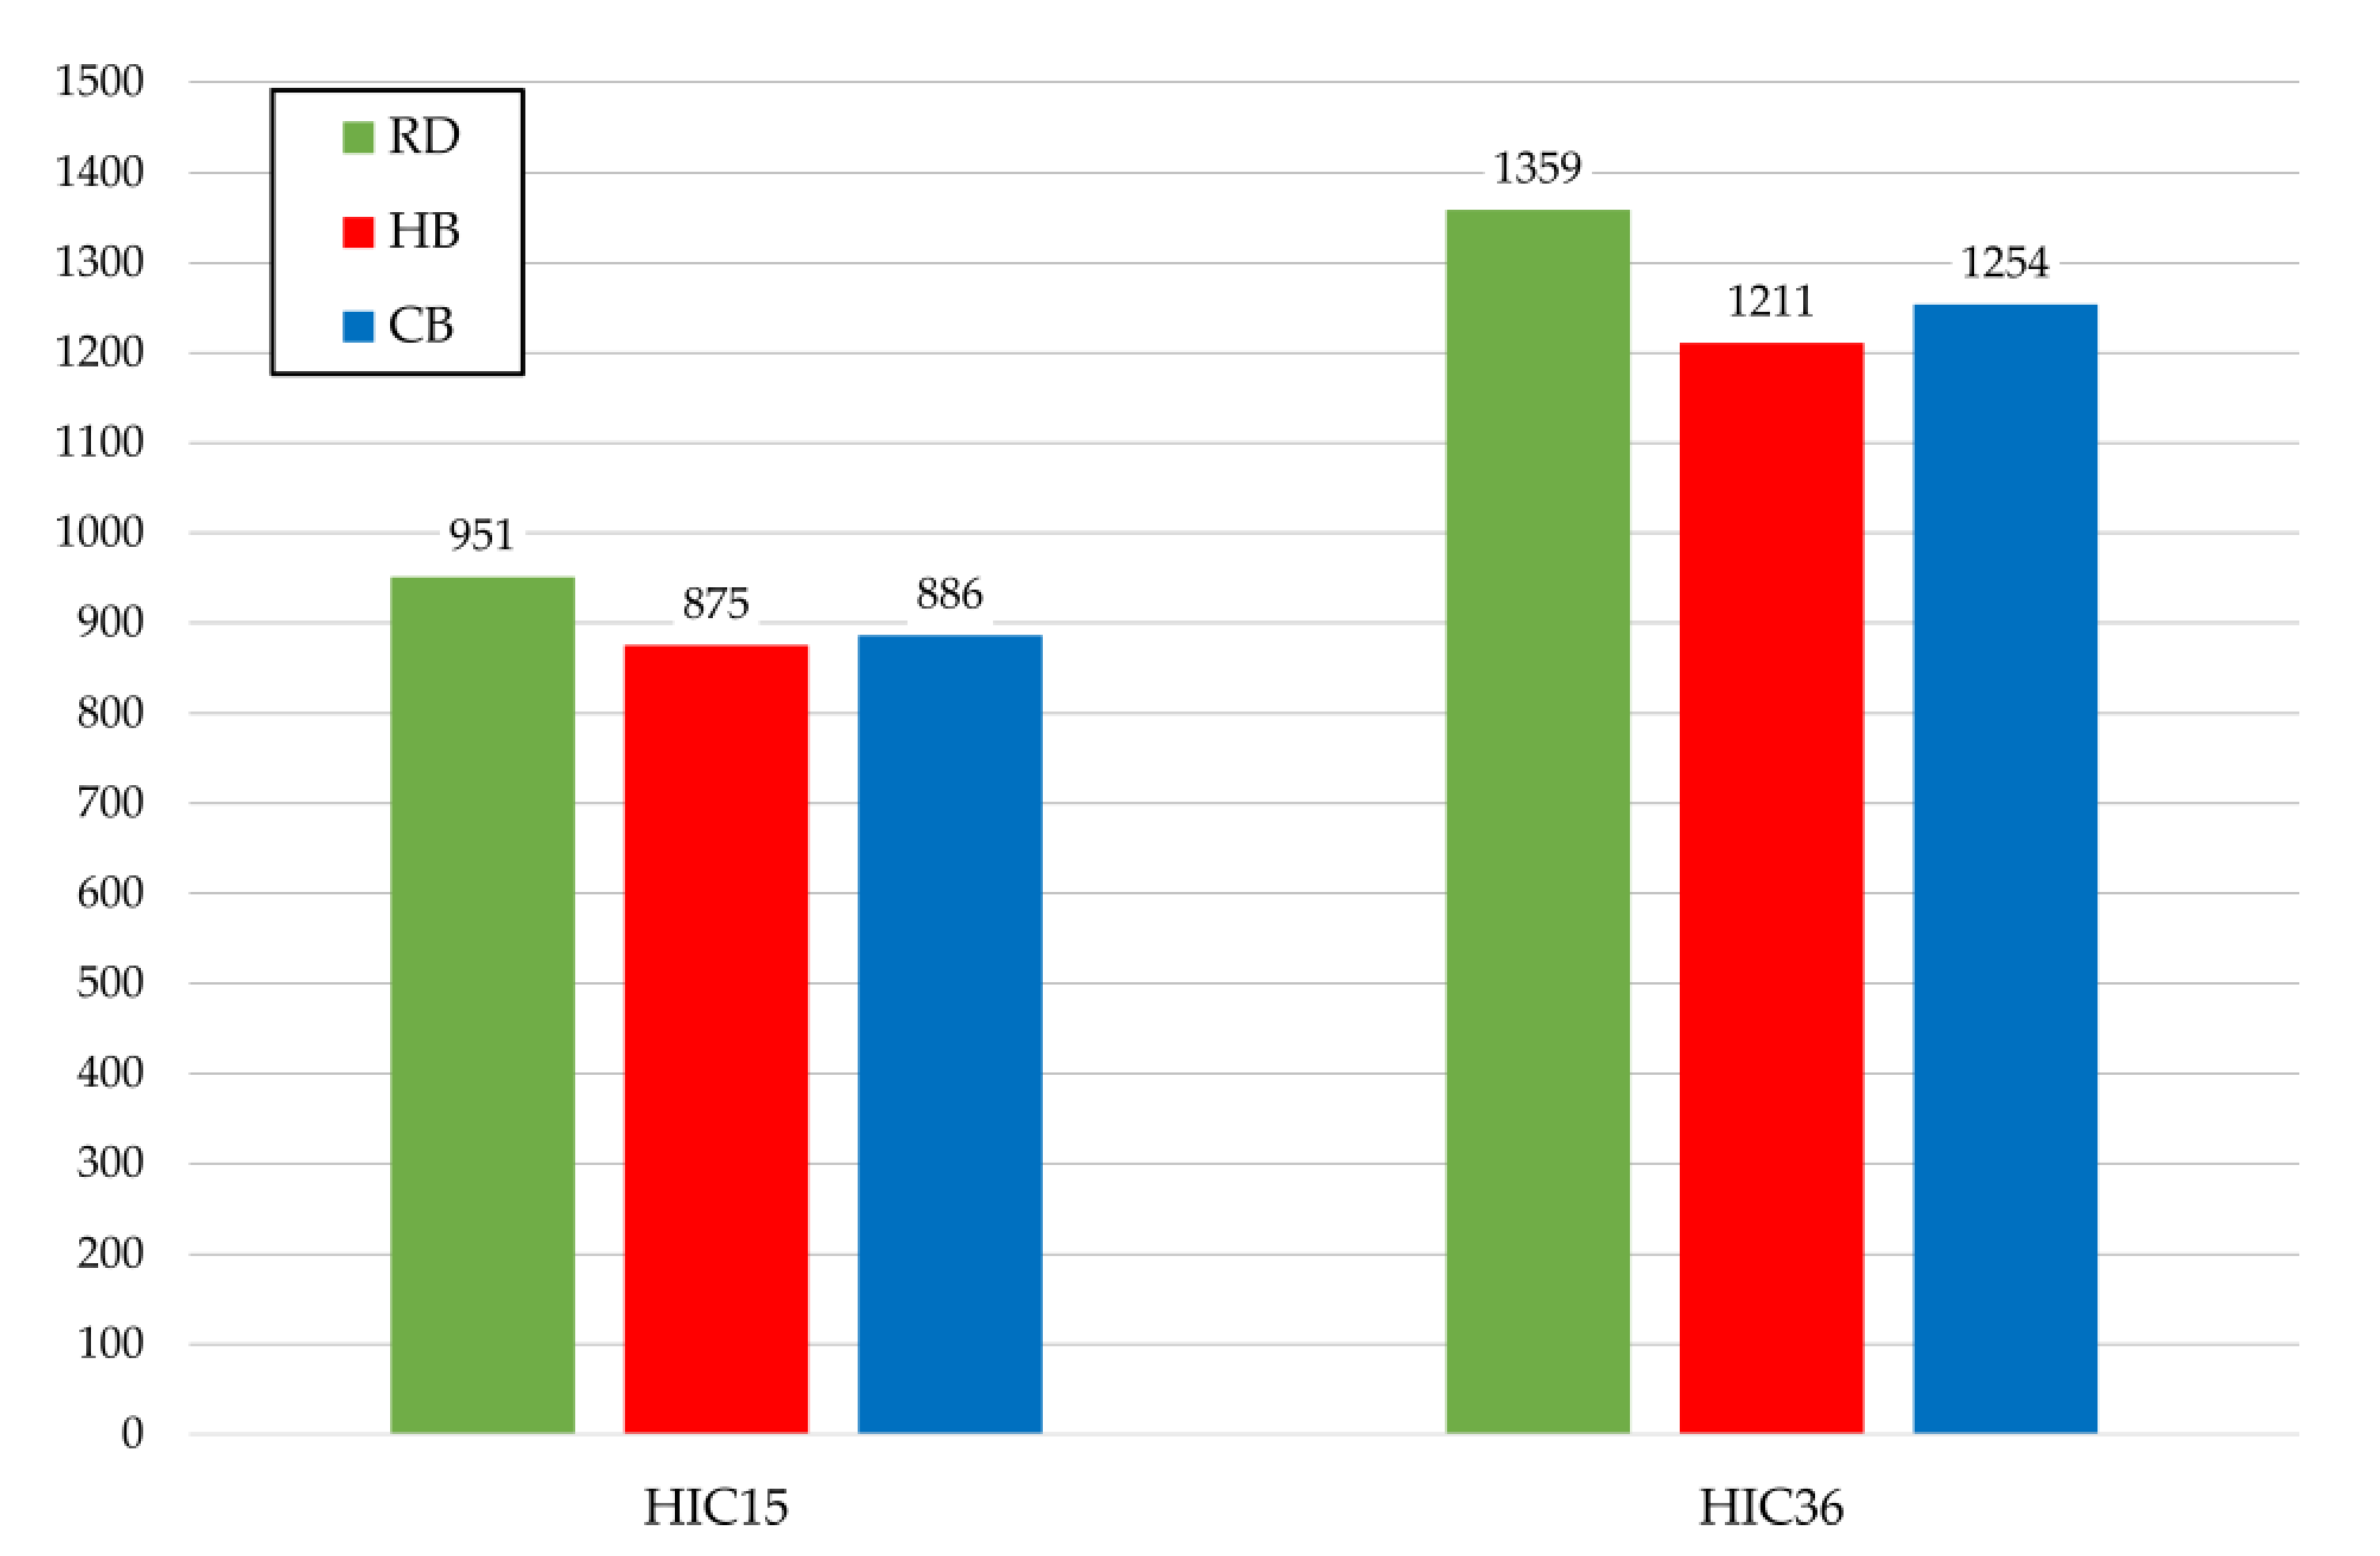
The use of additional equipment for the DP, in addition to influencing lateral displacement, shoulder rotation and the course of force between the belts and the dummy, also affects skull injuries expressed as HIC (Head Injury Criterion) (Figure 17). Compared to RD, HB and CB have at least 6% lower HIC15 and 7% lower HIC36 values.
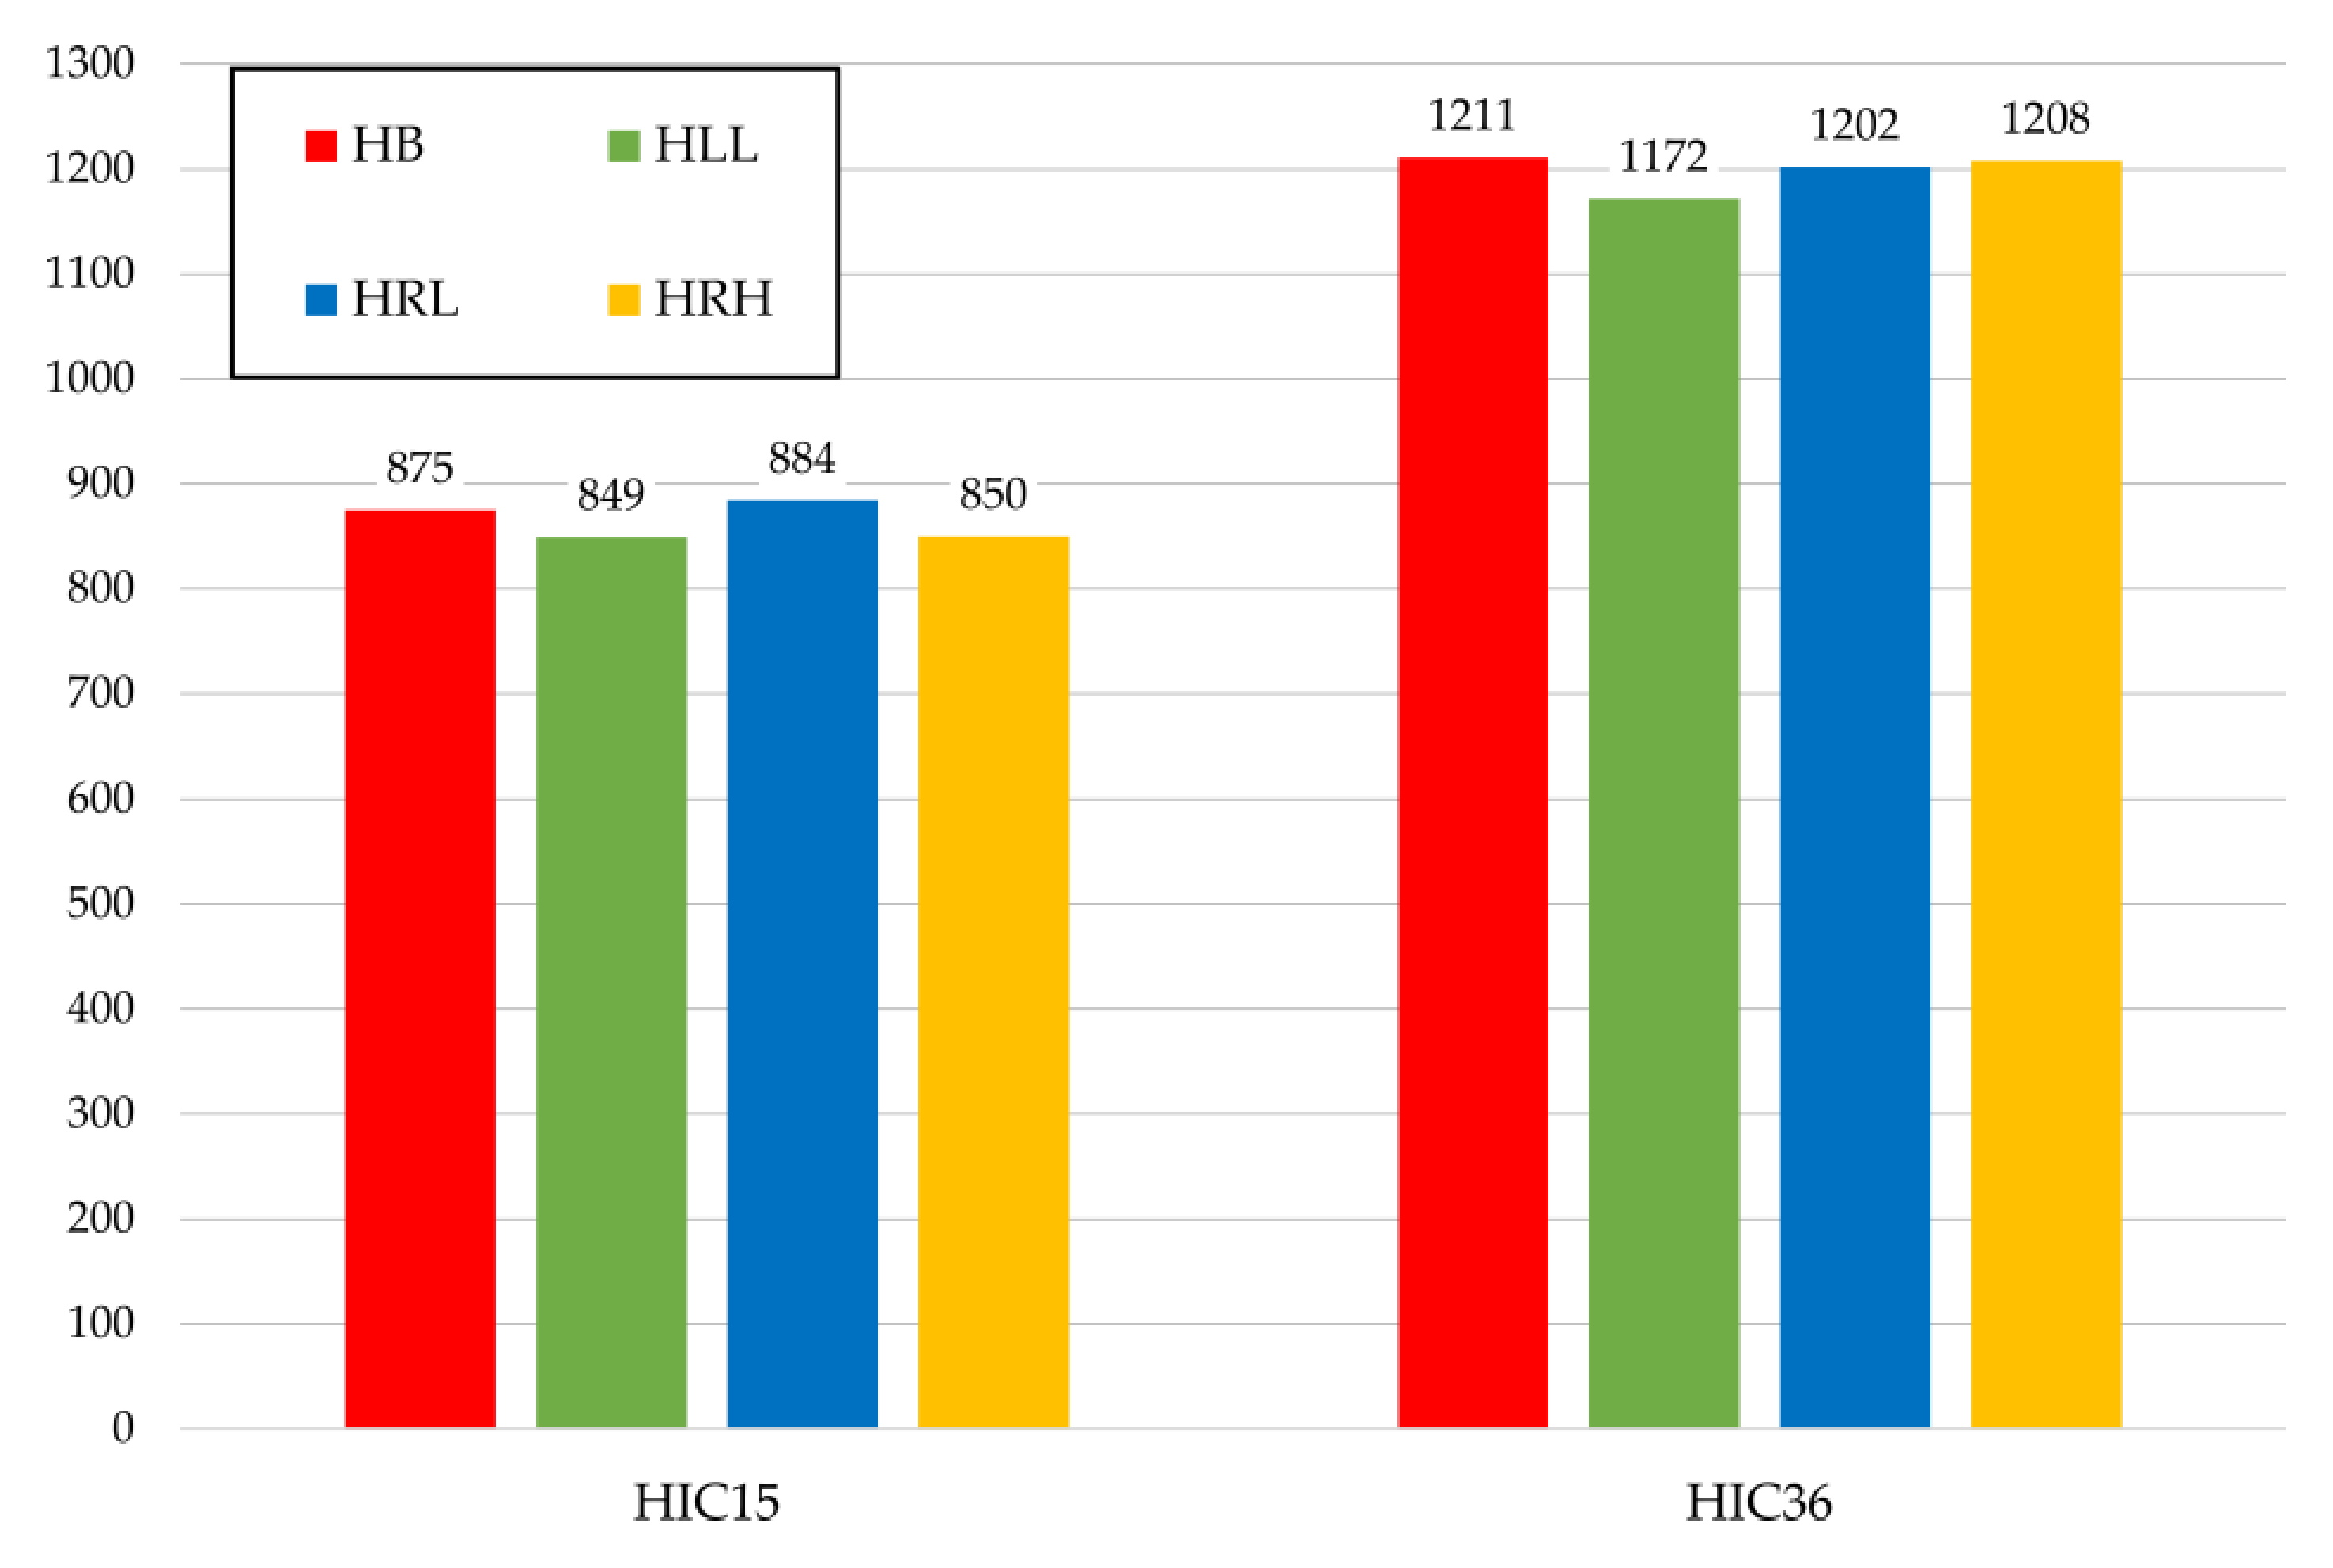
In the H group (Figure 18), different HIC15 and HIC36 values were obtained for individual cases, but no significant differences were observed. The maximum reaches respectively 4% and 3%.
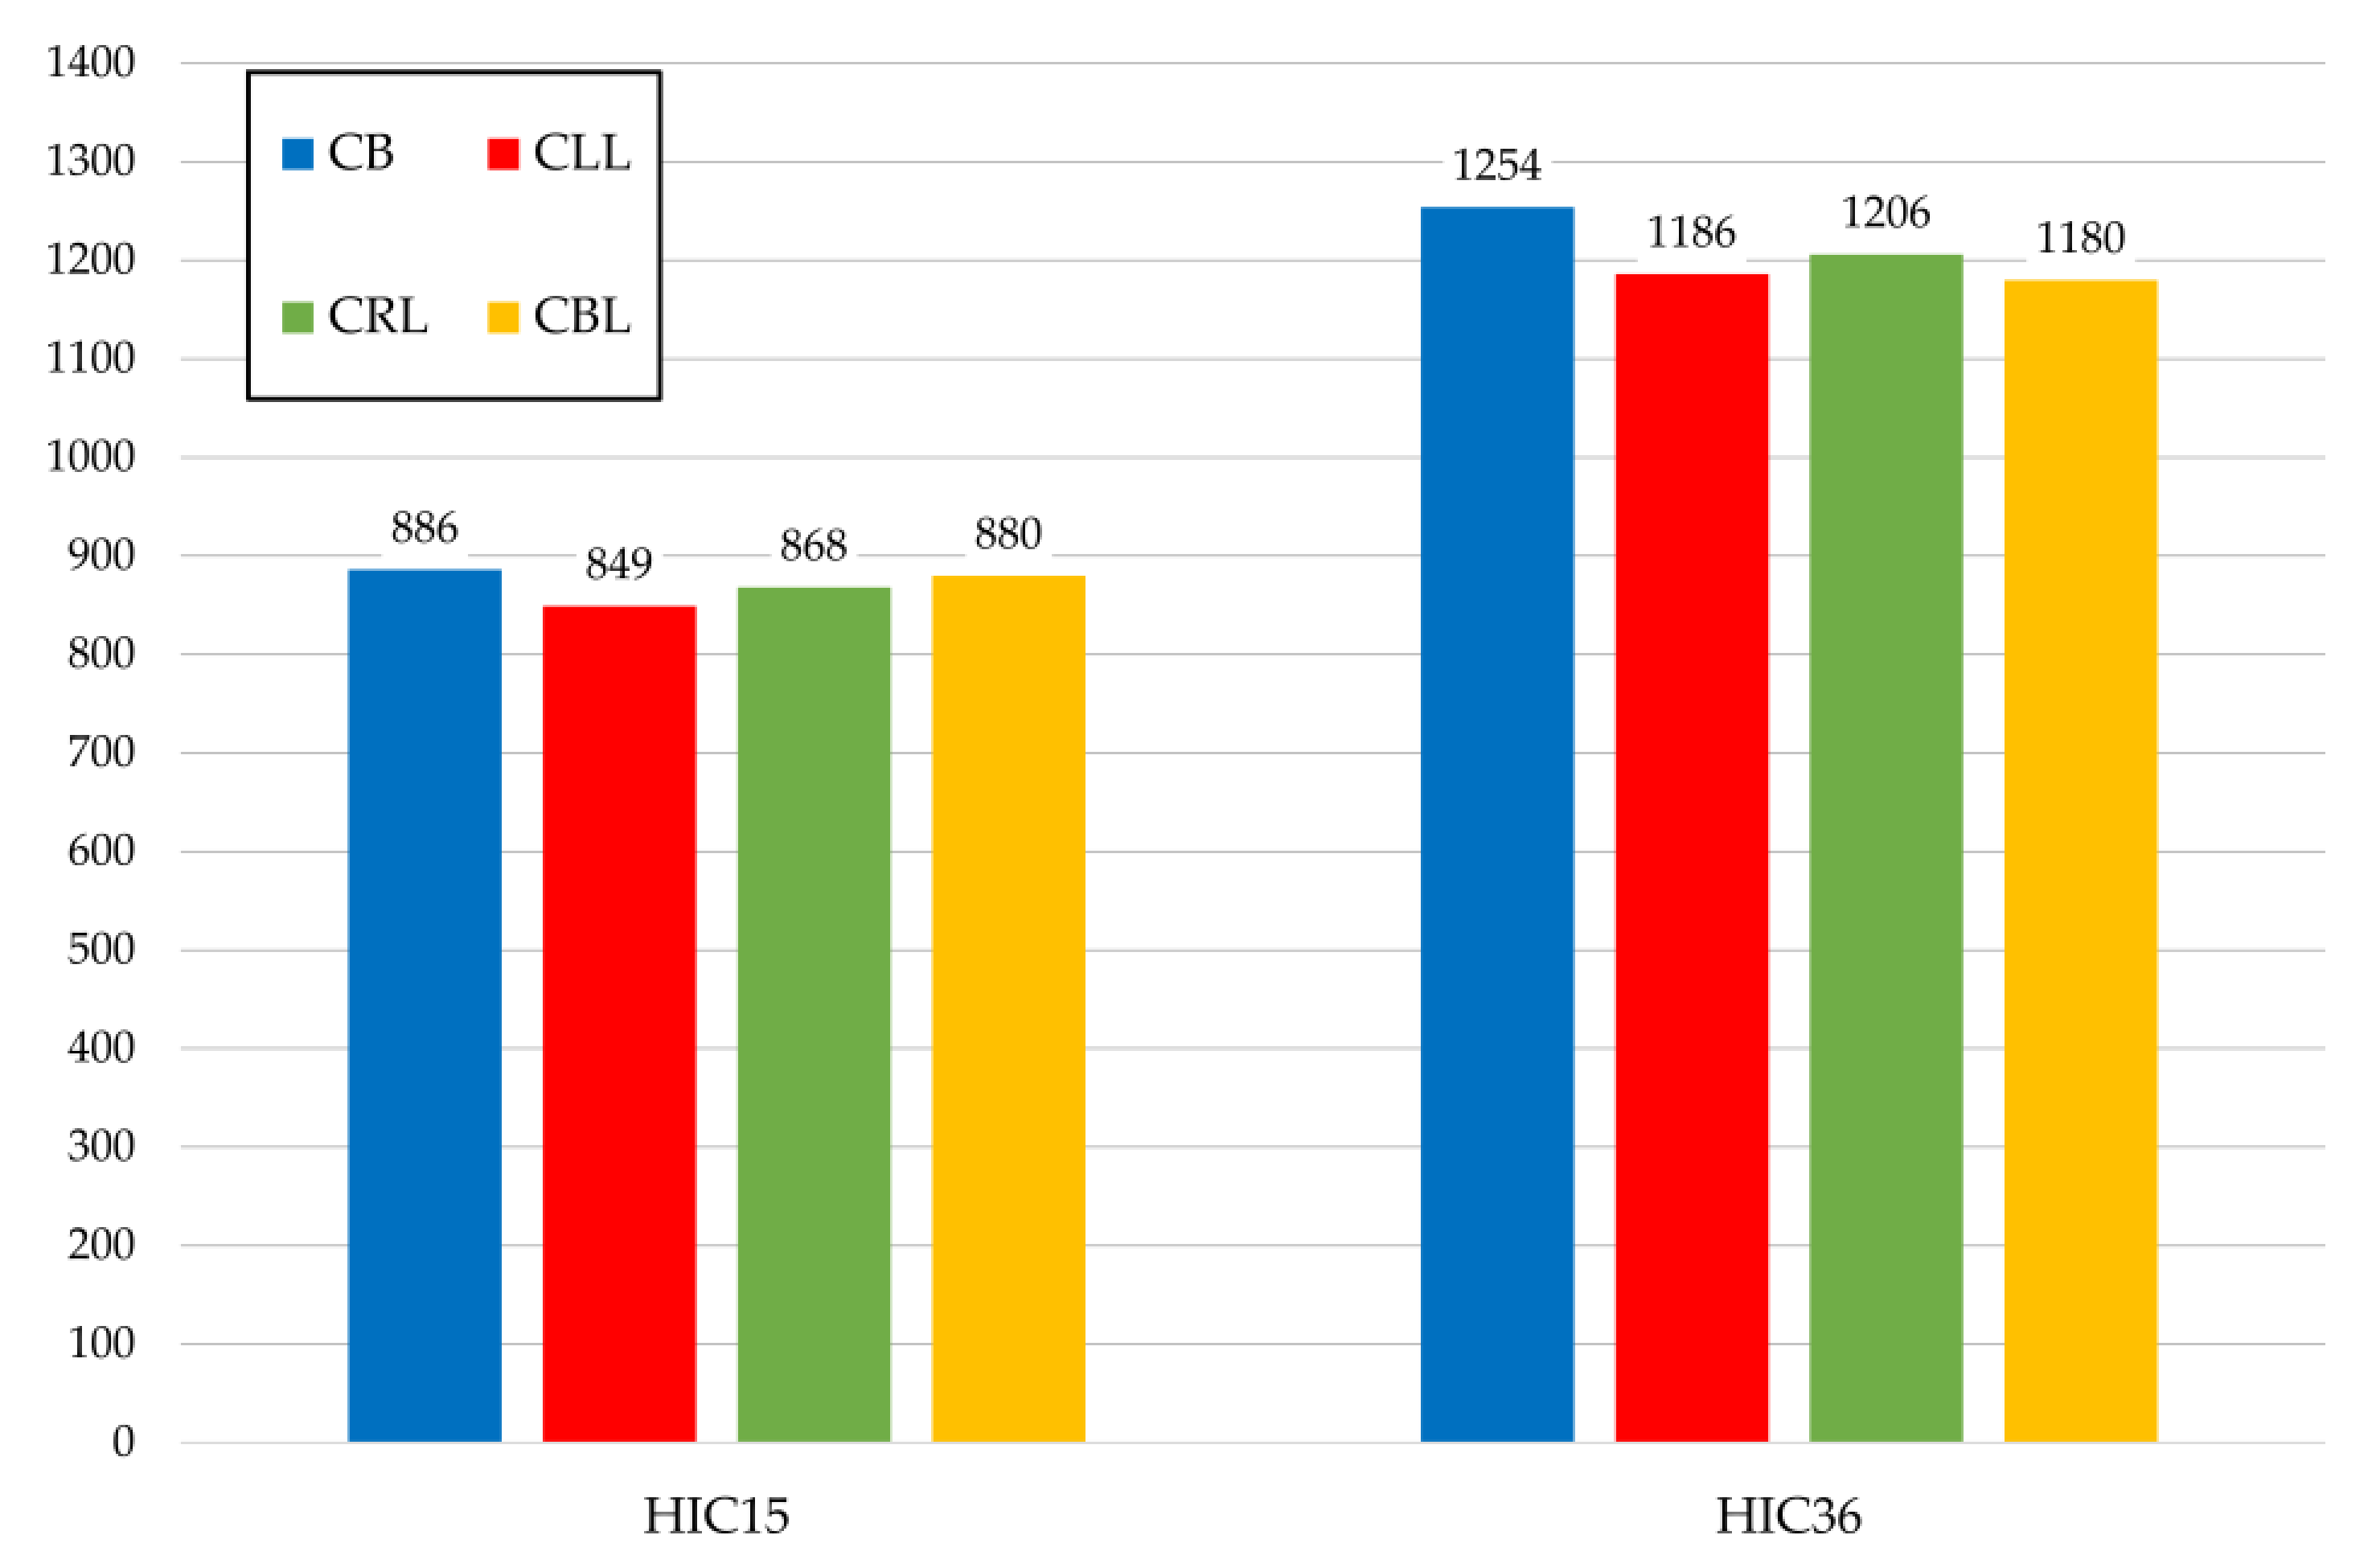
In group C (Figure 19) for HIC15 the difference between the maximum and minimum result is about 4%. For HIC36 the difference increases less than 6%. The smallest value was obtained for CLL and the largest for CB.

4. Discussion

The main objective of the study is to examine the effect of the change in driver’s centre of gravity due to various disabilities and the change in the points of support of the body due to the use of additional equipment on the driver’s behaviour during a frontal collision. Due to the inability to carry out such studies through experimental tests, it was decided to employ a research methodology based on numerical analyses using the finite element method, with an explicit integration step. Thanks to FE studies, it was possible, among other things, to consider (in a virtual environment) the vulnerabilities of the car’s interior structures, crucial from the point of view of the driver’s behaviour, and of the dummy itself. A common approach to analyses of this type is to isolate a single phenomenon (with all the key elements) from the global system and to conduct studies on the influence of single parameters on the course of this phenomenon [19,21,32,33,34]. For frontal crash analyses aimed at assessing the driver’s safety, this is most often a restriction of the numerical model to the area around the driver and modelling selected safety components such as seat belts [19,
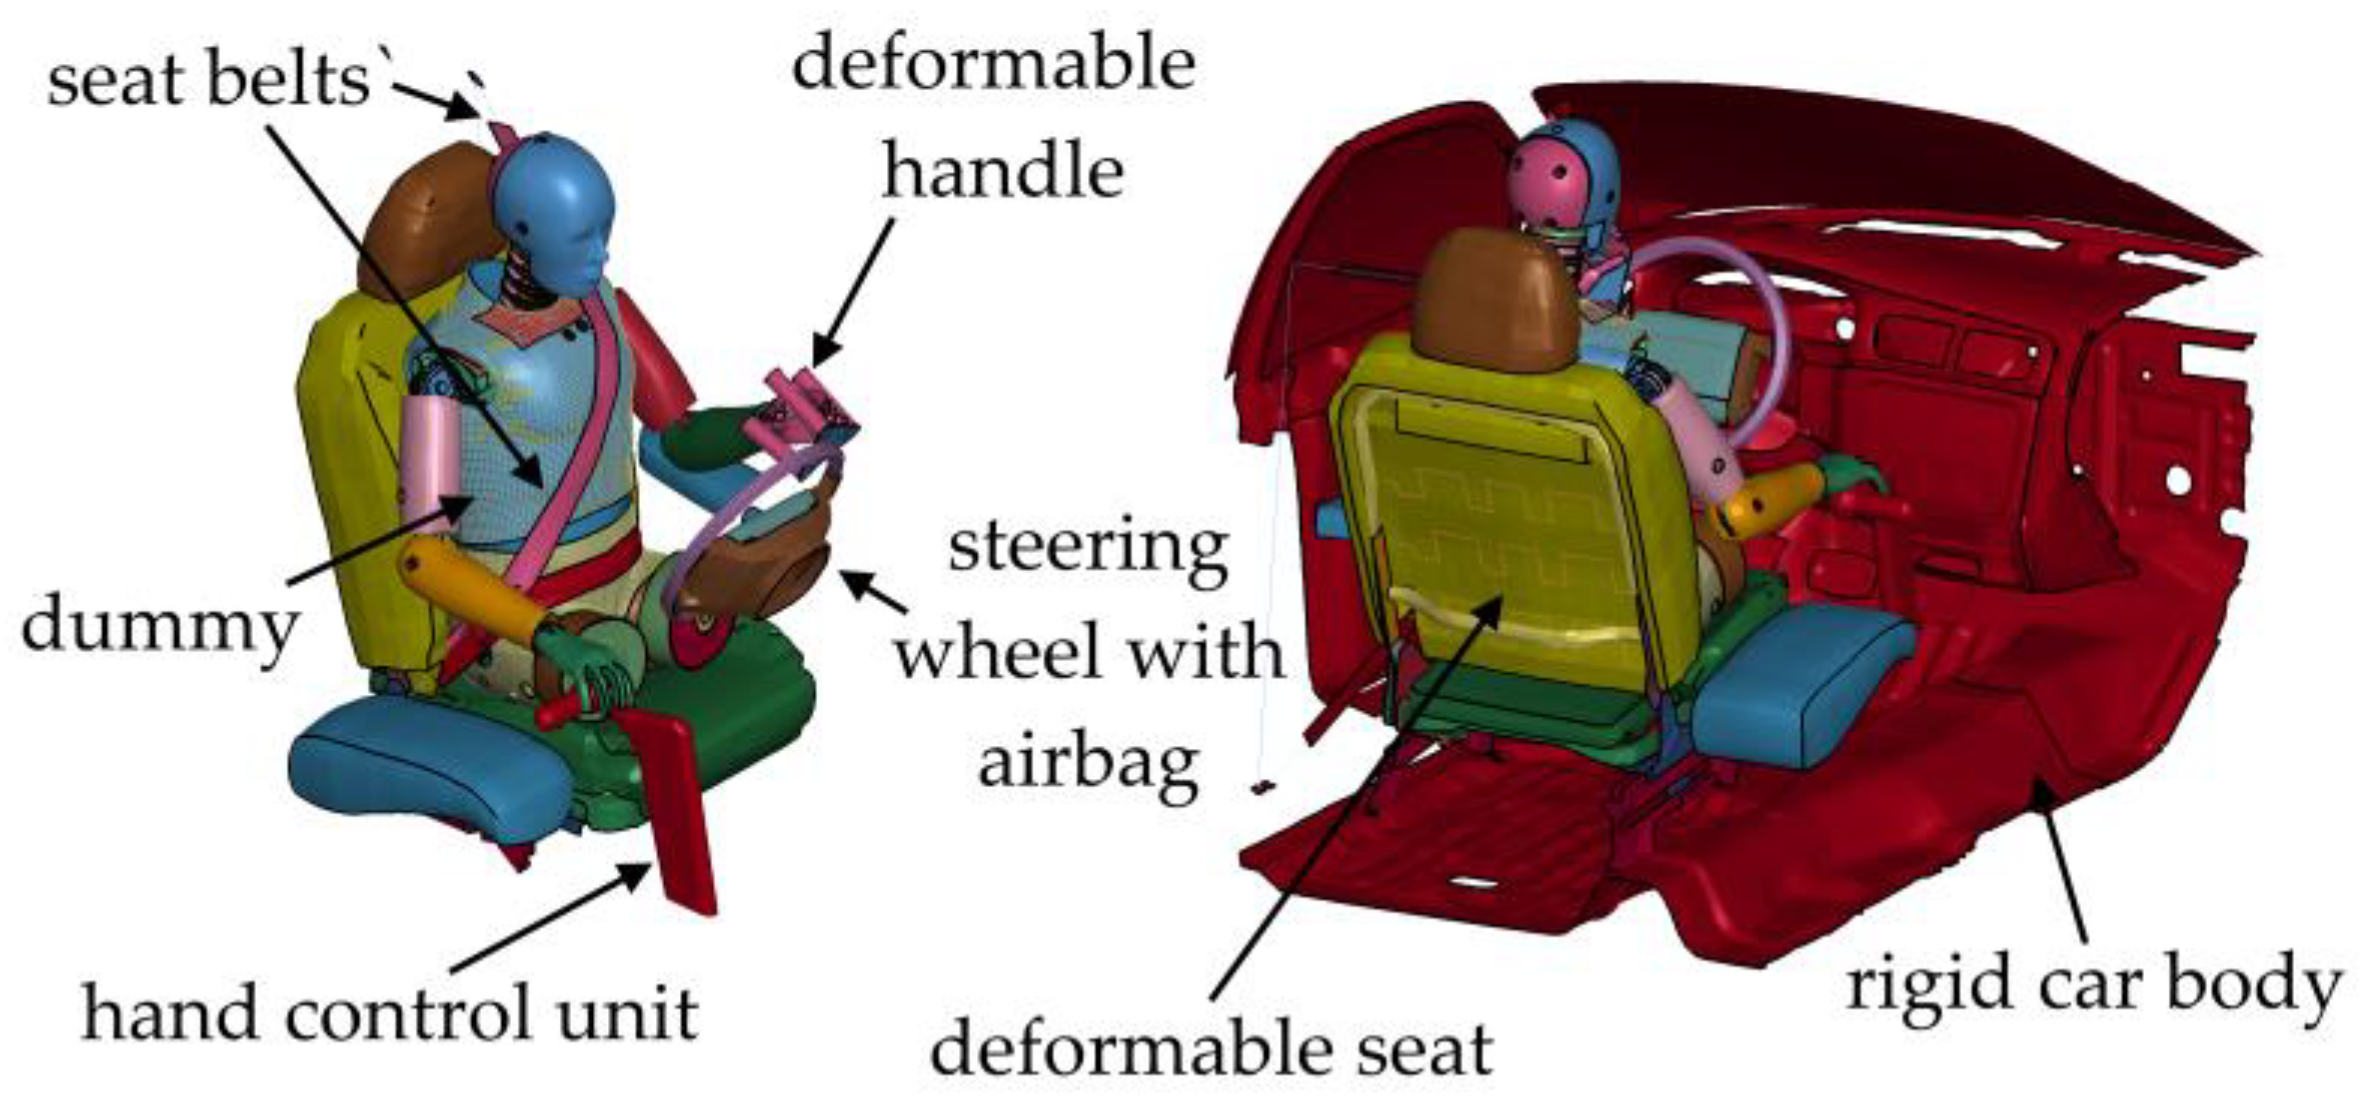
34] or an airbag. In this study the best possible reproduction of real objects and phenomena was sought, therefore a great deal of emphasis was placed on the use of the full characteristics of the car body delay during the collision, considering the deformation of the seat under the influence of the weight of the dummy, the friction between them, and the representation of the full operation of the seat belt system and the airbag. This was made possible by dividing the whole frontal impact into three phases—frontal impact of the car with a rigid barrier, subsidence of the dummy under the influence of gravity and the numerical analysis of the behaviour of the dummy inside an isolated part of the vehicle.
The authors were not able to carry out a validation test for the developed numerical models. Instead, the global model is built from smaller numerical models validated in independent tests [18,29]. In this study, a commercially approved numerical model of the dummy [35], an approved car model [36] and constitutive models of seat belts were used.
Frontal collisions, both full cars and selected vehicle parts, are very well documented in the literature. Nevertheless, the authors did not find any studies on the safety of disabled persons in the literature, so it is difficult to relate the results to other works.
In personal cars, the forces exerted on the body of a non-disabled driver during a frontal collision are asymmetrical. Excluding the asymmetrical positioning of the steering wheel in relation to the torso in many cars, asymmetry is mainly caused by the position of the legs and the operation of the seat belts. In the case of cars with automatic transmission, the right leg is usually set straight ahead or more inwards on the brake pedal during a collision. The left leg rests on a footrest that in many cars is positioned to the left and is closer to the seat than the fully depressed brake pedal. Seat belts, on the other hand, restrict the movement of the left arm, which naturally causes the rotation of the driver’s shoulders visible in Figure 11. This rotation increases until the torso rests on the airbag and the driver rebounds from it. From now on, the arms start to rotate in the opposite direction. The lower limbs mentioned previously also play a major role in the first stage of the collision, as the driver moves longitudinally to the seat and hits the space under the steering wheel with his knees. This is considered by vehicle designers at the development stage.
The introduction of additional equipment on the steering wheel or the amputation of the driver’s limb affects the process described above. When analysing the position of the dummy at the moment of maximum longitudinal displacement relative to the seat (Figure 7) it can be seen that the use of additional equipment on the steering wheel or between the seats affects the position of the driver’s body immediately before the collision. The stiffness of these elements is so low that it does not generate significant movement resistance for the driver. The limb amputation, however, changes the number of support points of the driver, both immediately before the collision and during the loss of his kinetic energy. In addition, if one of the lower limbs is amputated, the latter is automatically more likely to suffer an injury as it will hit the components under the steering wheel with more force.
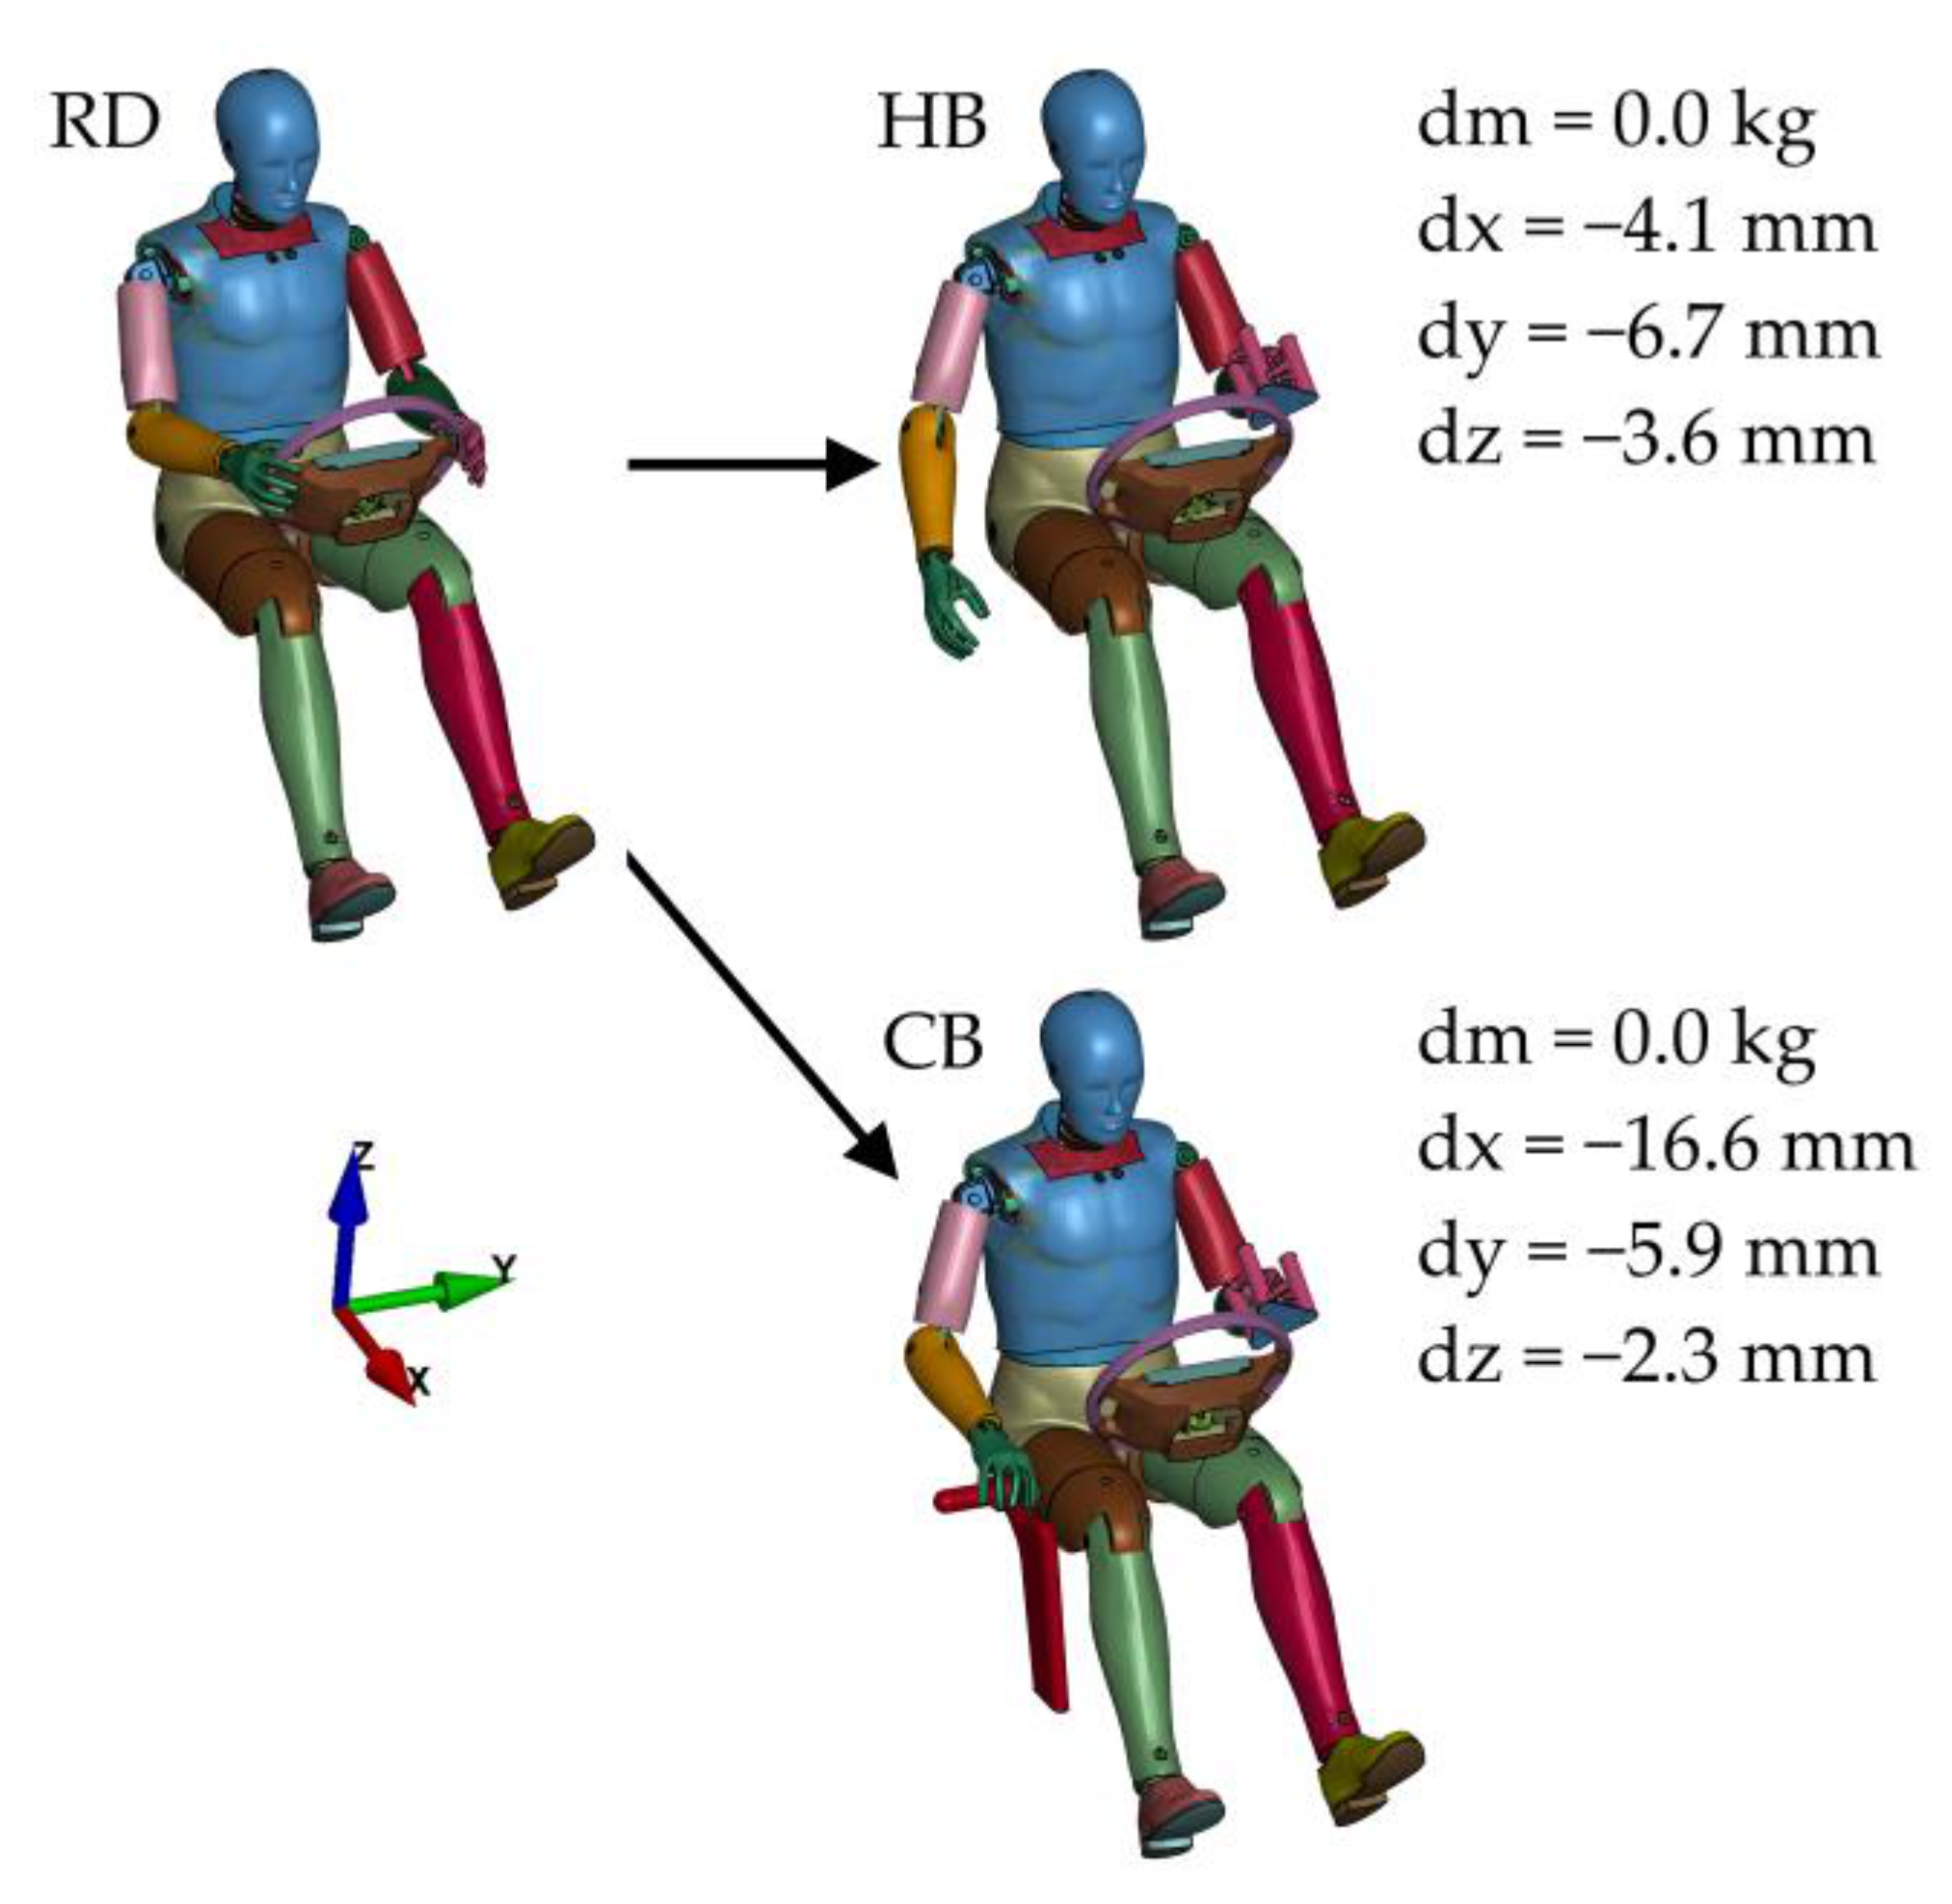
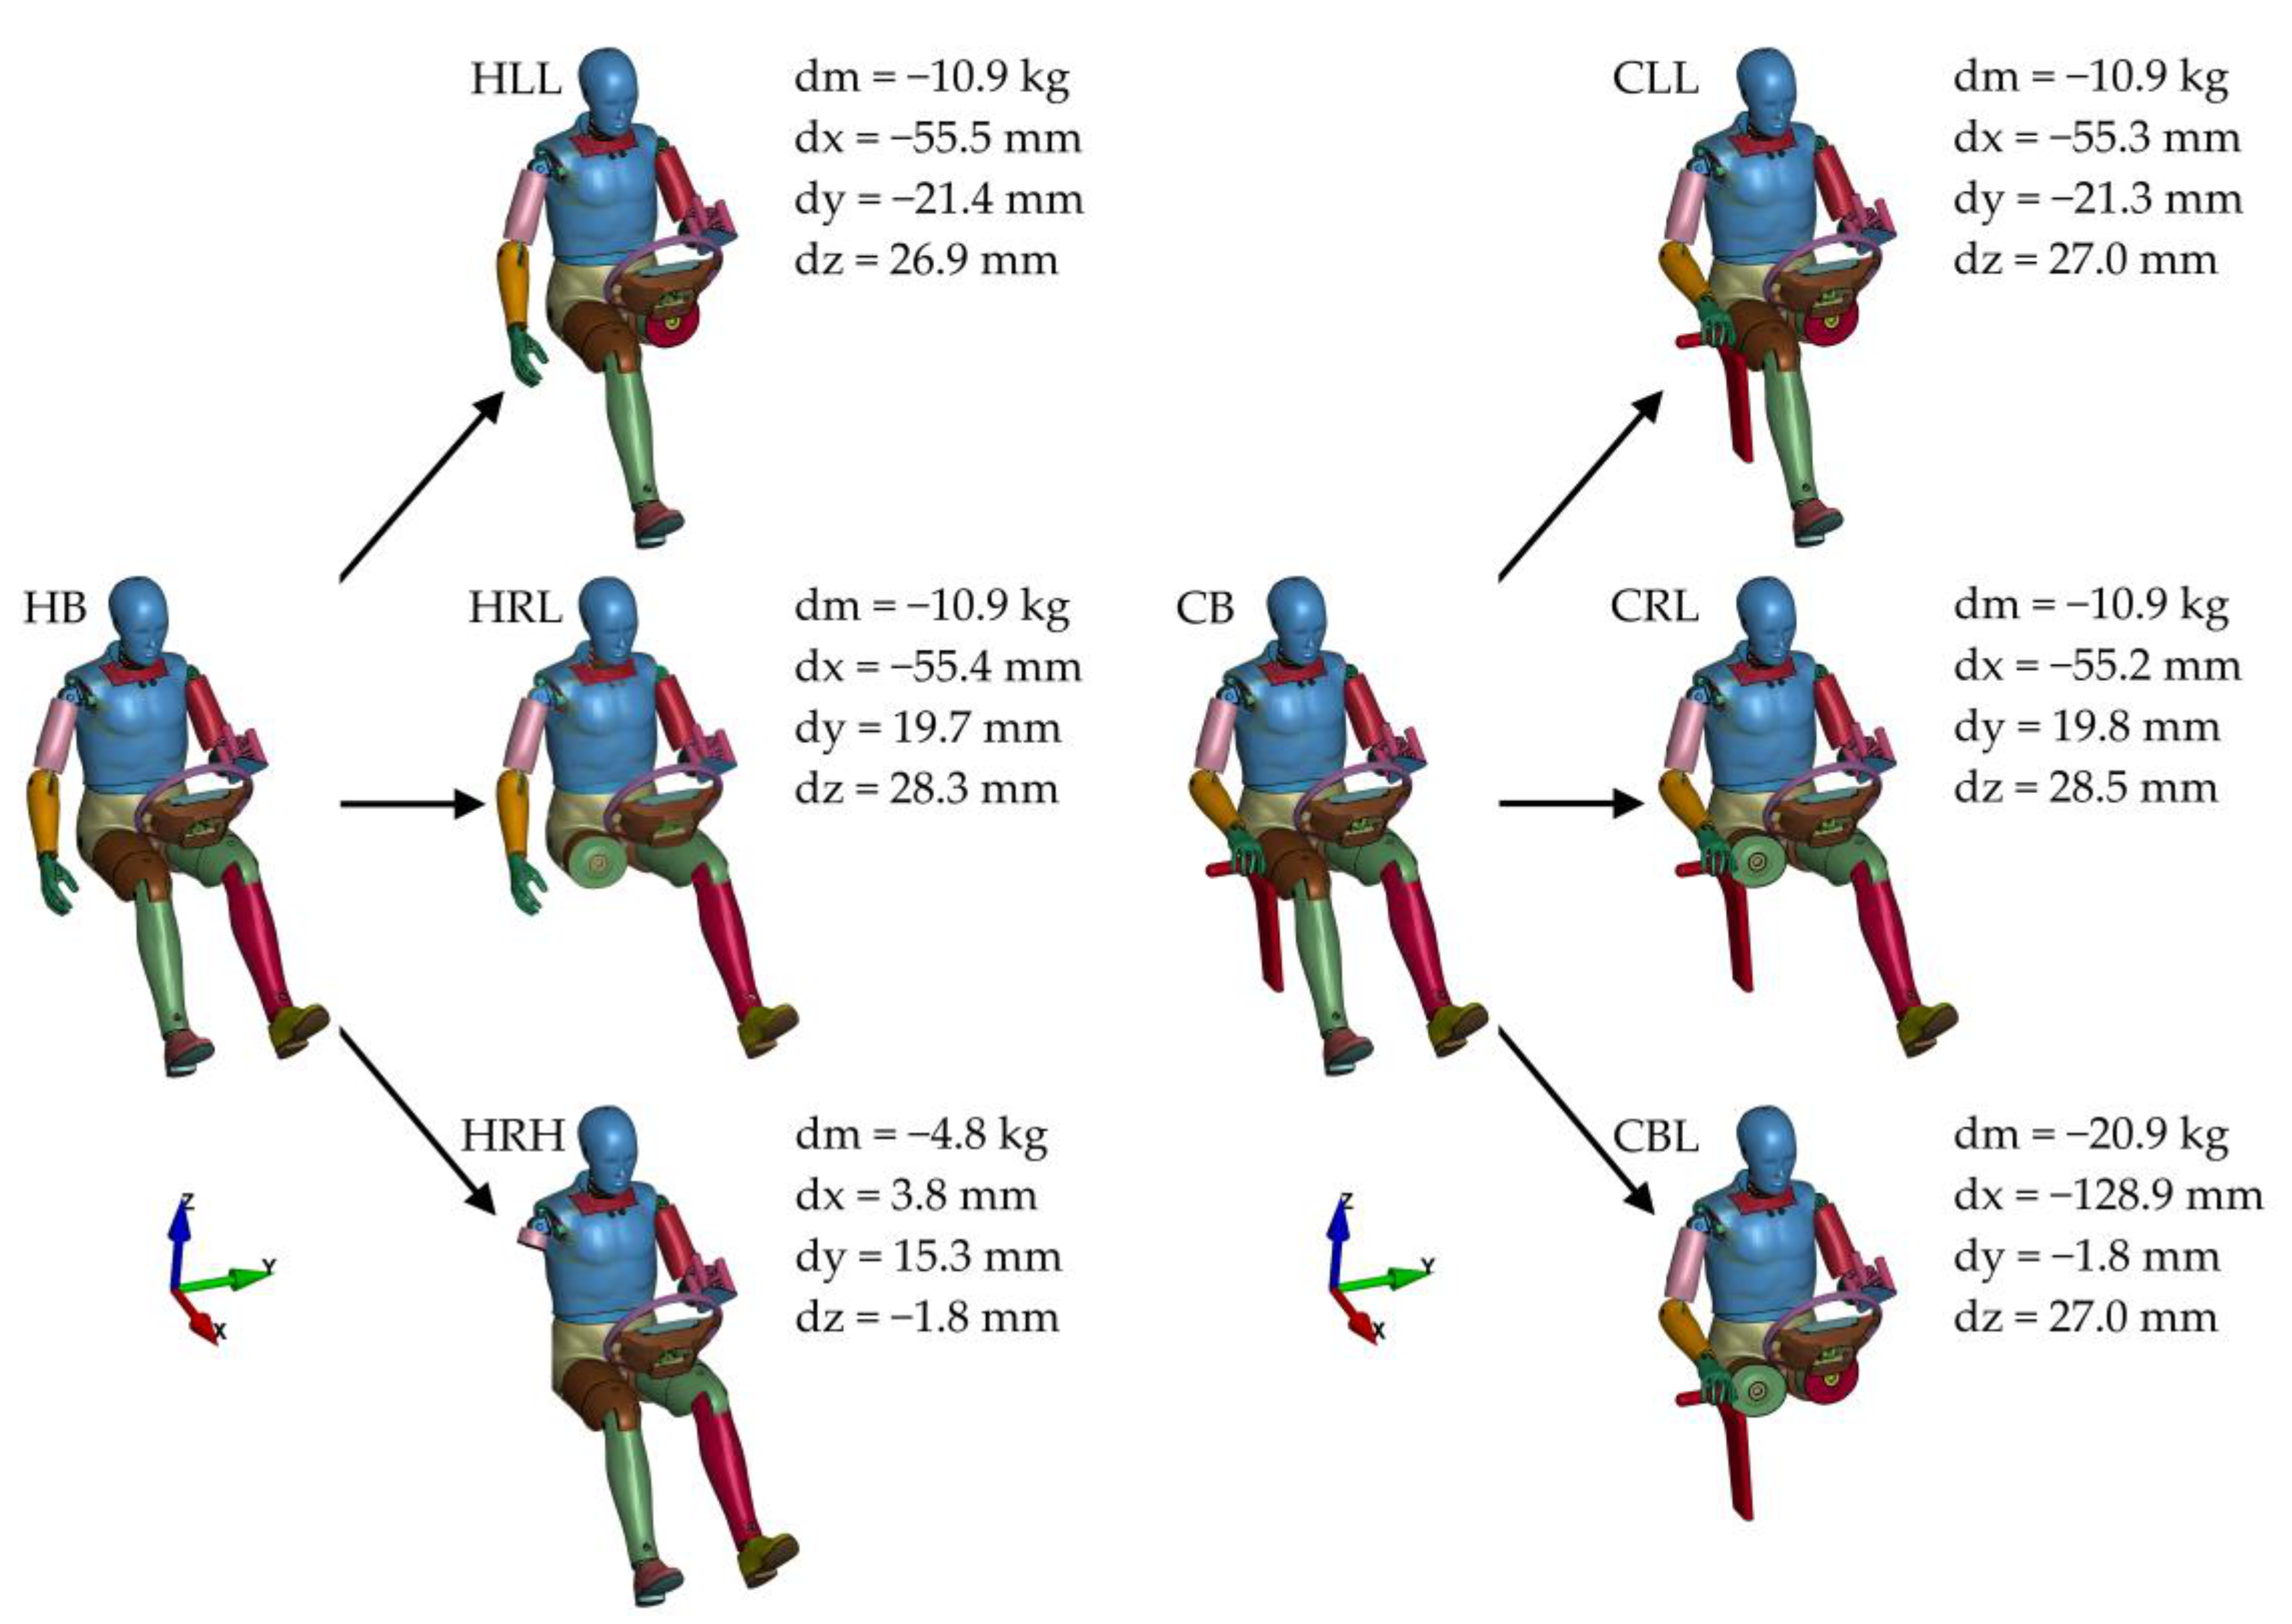
The changes in the position of the centre of gravity, as shown in Figure 4 and Figure 5, clearly indicate that the sole use of a disabled person’s equipment has a slight effect on the change in the driver’s centre of gravity. Amputation, in turn, results in a significant reduction in the weight of the entire driver and thus in a significant shift in the driver’s centre of gravity. On the one hand, the reduction in the driver’s weight means less kinetic energy to reduce, on the other hand, a change in body position affects the operation of safety systems.
Figure 8 shows the lateral displacement of the driver’s H-point, which shows that the use of a steering wheel handle or additional Hand Control Unit results in no return to the initial position of the driver’s pelvis after a rebound from the airbag. This is particularly evident at time t = 0.43 s when the driver hits the seat’s backrest. This is a very negative phenomenon, as it can result in missing the headrest and suffering a serious neck injury. This effect is even stronger in the case of amputation of any of the limbs (Figure 9 and Figure 10).
However, the use of additional equipment does not have a significant influence on the rotation of the arms (Figure 11). The amputation, especially of the left leg, both legs or right hand, does influence the rotation (Figure 12 and Figure 13). In the case of the amputation of the right hand, the mass that causes the rotation by its inertia decreases significantly and thus the rotation diminishes. A similar diminished rotation in the initial phase of movement can be observed in the case of the amputation of the left leg or both legs. This is because the left leg rests on a footrest that is closer to the seat than the brake pedal pressed to the end. In the event of a collision, the leg pushes against its entire surface, while the right leg slides on the brake pedal. Thus, in the case of drivers without disabilities, the left leg increases the rotation, and in the case of a disabled driver, the lack of the limb reduces the rotation.
Lack of support for the left leg means that the belts and the airbag must carry more load (Figure 15 and Figure 16), which may result in increased chest injuries. The analyses carried out showed that the other factors examined did not have a significant impact on the course of force between the dummy and the belts. The modifications made also had no significant impact on HICs.
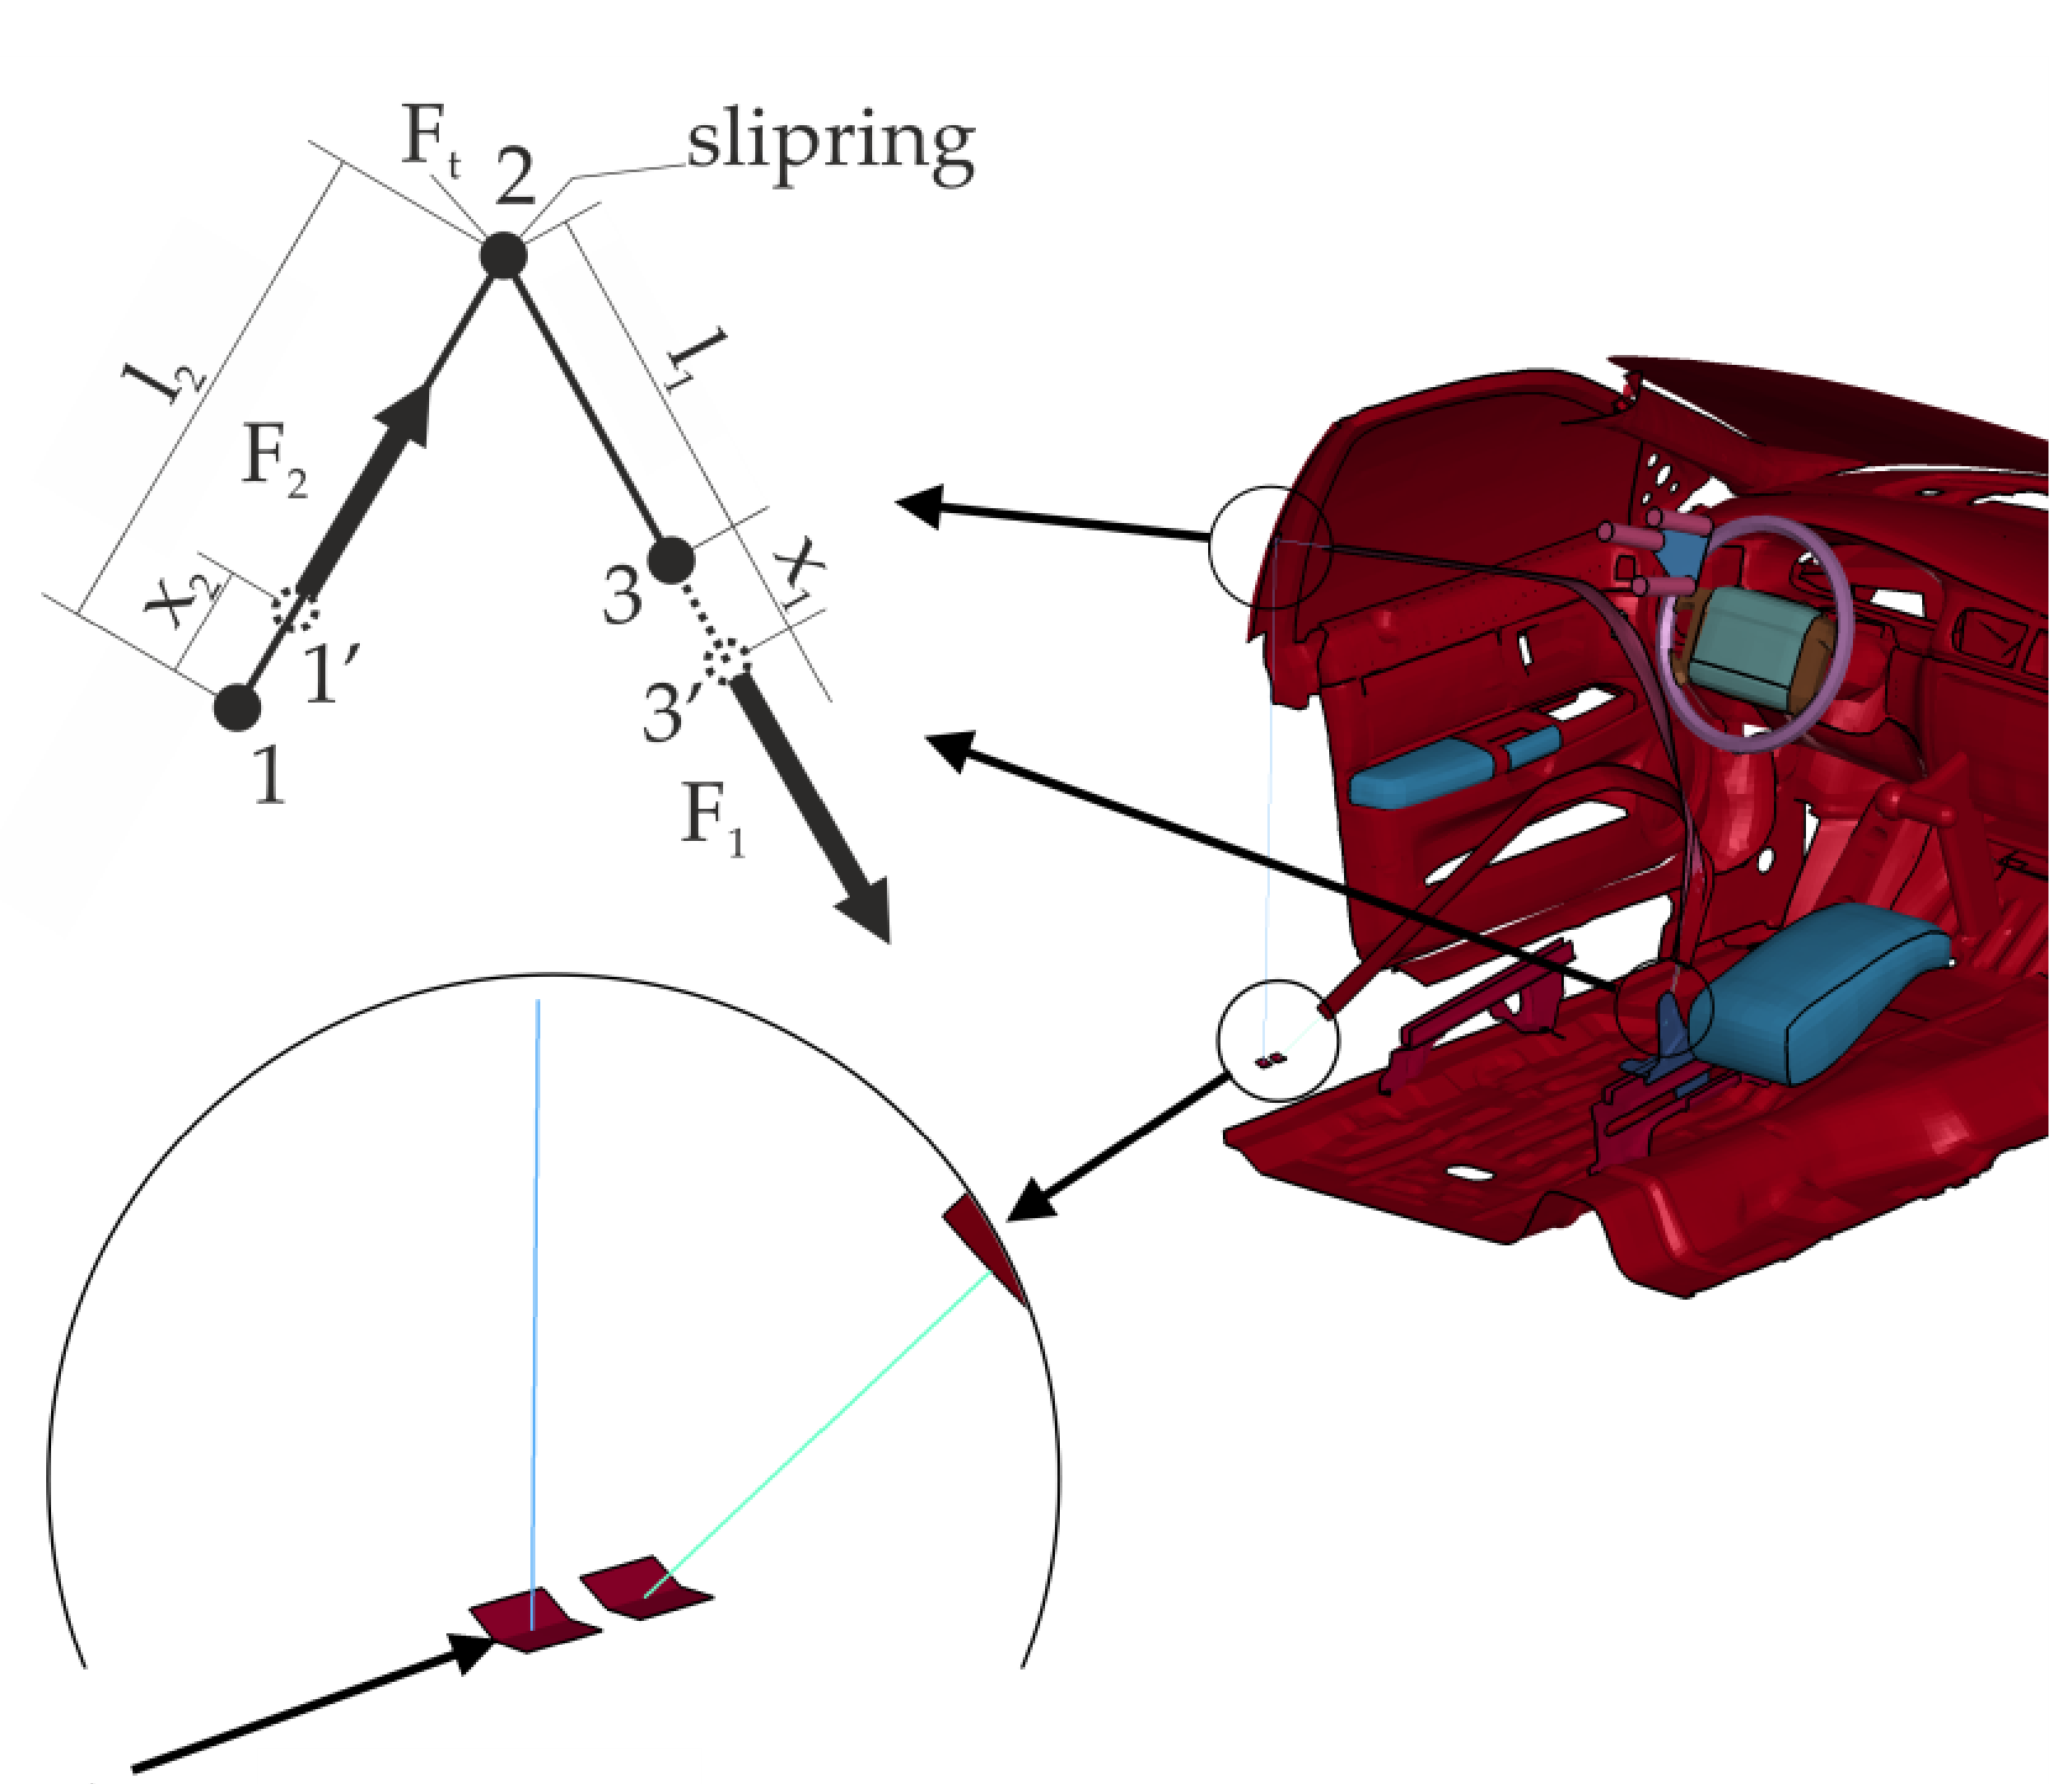
To sum up, the contribution of this paper is to present a three-stage scheme for conducting numerical analyses of the behaviour of people inside a car during a crash. The article justifies the importance of each of the stages and the use of the results of each of them in the analysis of the entire phenomenon. The paper also presents a method of seat belts modelling aimed at a faithful representation of their actual operation. Describes an approach using a combination of 2D elements (in area of contact with the driver) and 1D elements (which enable the operation of the retractor, pretensioner and slipring). A detailed diagram of the operation of the slipring elements is also presented. Based on the modelling performed, the paper presents the original results of analyses of the effect of changes in the position of the driver’s centre of gravity caused by additional equipment for disabled people and amputations of the limbs on his behaviour during a frontal collision. Based on the results, it can be concluded that it is appropriate to carry out research aimed at assessing the safety of drivers using vehicles adapted to the needs of disabled people. The position of the driver immediately before the collision and the number of support points of the body affects his interaction with the safety systems and may affect his injuries.
Further work will be aimed at studying the impact of prostheses on the safety of a disabled driver.

Author Contributions

Conceptualization, K.S. and J.M.; methodology, K.S. and J.M.; software, K.S.; validation, K.S. and J.M.; formal analysis, K.S.; investigation, K.S.; resources, K.S.; data curation, K.S.; writing—original draft preparation, K.S.; writing—review and editing, K.S. and J.M.; visualization, K.S.; supervision, J.M.; project administration, K.S.; funding acquisition, J.M. All authors have read and agreed to the published version of the manuscript.

Funding

The article was written as part of the implementation of the university research grant supported by Military University of Technology (No. UGB 22-748/2020).

Institutional Review Board Statement

Not applicable.

Informed Consent Statement

Not applicable.

Data Availability Statement

Not applicable.

Conflicts of Interest

The authors declare no conflict of interest.

References

  1. WHO. Available online: https://www.who.int/features/factfiles/disability/en/ (accessed on 26 June 2020).
  2. Palmera-suárez, R.; López-cuadrado, T.; Brockhaus, S. Severity of disability related to road traffic crashes in the Spanish adult population. Accid. Anal. Prev. 2016, 91, 36–42. [Google Scholar] [CrossRef] [PubMed]
  3. Taylor, Z.; Józefowicz, I. Intra-urban daily mobility of disabled people for recreational and leisure purposes. J. Transp. Geogr. 2012, 24, 155–172. [Google Scholar] [CrossRef]
  4. Solvoll, G.; Hanssen, T.S. User satisfaction with specialised transport for disabled in Norway. J. Transp. Geogr. 2017, 62, 1–7. [Google Scholar] [CrossRef]
  5. Hassan, S.; Soltani, K.; Sham, M.; Awang, M. Accessibility for Disabled in Public Transportation Terminal. Procedia Soc. Behav. Sci. 2012, 35, 89–96. [Google Scholar] [CrossRef] [Green Version]
  6. Chou, C.; Tsai, C.; Wong, C. A study on boarding facilities on wharves and ships for disabled and elderly passengers using public shipping transport. J. Transp. Health 2020, 18. [Google Scholar] [CrossRef]
  7. Semeijn, J.; Gelderman, C.J.; Schijns, J.M.C.; Tiel, R. Van Disability and pro environmental behavior—An investigation of the determinants of purchasing environmentally friendly cars by disabled consumers. Transp. Res. Part D 2019, 67, 197–207. [Google Scholar] [CrossRef]
  8. Suen, S.L. Adanced accessibility systems for elderly and disabled travellers in Canada. IFAC Proc. Vol. 1994, 27, 495–500. [Google Scholar] [CrossRef]
  9. Monacelli, E.; Dupin, F.; Dumas, C.; Wagstaff, P. A review of the current situation and some future developments to aid disabled and senior drivers in France. Irbm 2009, 30, 234–239. [Google Scholar] [CrossRef]
  10. Orsi, C.; Bertuccio, P.; Morandi, A.; Levi, F.; Bosetti, C.; La, C. Trends in motor vehicle crash mortality in Europe, 1980–2007. Saf. Sci. 2012, 50, 1009–1018. [Google Scholar] [CrossRef]
  11. Koisaari, T.; Utriainen, R.; Kari, T.; Tervo, T. The most difficult at-fault fatal crashes to avoid with current active safety technology. Accid. Anal. Prev. 2020, 135. [Google Scholar] [CrossRef]
  12. Zahabi, M.; Mohammed, A.; Razak, A.; Shortz, A.E.; Mehta, R.K.; Manser, M. Evaluating advanced driver-assistance system trainings using driver performance, attention allocation, and neural efficiency measures. Appl. Ergon. 2020, 84. [Google Scholar] [CrossRef] [PubMed]
  13. Schneider, L.W.; Klinich, K.D.; Moore, J.L.; MacWilliams, J.B. Using in-depth investigations to identify transportation safety issues for wheelchair-seated occupants of motor vehicles. Med. Eng. Phys. 2010, 32, 237–247. [Google Scholar] [CrossRef]
  14. Baranowski, P.; Damaziak, K.; Mazurkiewicz, L.; Muszynski, A.; Vangi, D. Analysis of mechanics of side impact test defined in UN / ECE Regulation 129. Traffic Inj. Prev. 2018, 19, 256–263. [Google Scholar] [CrossRef] [PubMed]
  15. Klasztorny, M.; Nycz, D.B.; Szurgott, P. Modelling and simulation of crash tests of N2- W4-A category safety road barrier in horizontal concave arc. Int. J. Crashworthiness 2016, 21, 644–659. [Google Scholar] [CrossRef]
  16. Ratajczak, M.; Frątczak, R.; Sławiński, G.; Niezgoda, T.; Będziński, R. Biomechanical analysis of head injury caused by a charge explosion under an armored vehicle. Comput. Assist. Methods Eng. Sci. 2017, 24, 3–15. [Google Scholar]
  17. Arkusz, K.; Klekiel, T.; Sławiński, G.; Będziński, R. Influence of energy absorbers on Malgaigne fracture mechanism in lumbar-pelvic system under vertical impact load. Comput. Methods Biomech. Biomed. Engin. 2019, 22, 313–323. [Google Scholar] [CrossRef] [PubMed]
  18. Mazurkiewicz, L.; Baranowski, P.; Karimi, H.R.; Damaziak, K.; Malachowski, J.; Muszynski, A.; Muszynski, A.; Robbersmyr, K.G.; Vangi, D. Improved child-resistant system for better side impact protection. Int. J. Adv. Manuf. Technol. 2018. [Google Scholar] [CrossRef] [Green Version]
  19. Joszko, K.; Wolański, W.; Burkacki, M.; Suchoń, S.; Zielonka, K.; Muszyński, A.; Gzik, M. Biomechanical analysis of injuries of rally driver with head supporting device. Acta Bioeng. Biomech. 2016, 18, 159–169. [Google Scholar] [CrossRef]
  20. Kwasniewski, L.; Bojanowski, C.; Siervogel, J.; Wekezer, J.W.; Cichocki, K. International Journal of Impact Engineering Crash and safety assessment program for paratransit buses. Int. J. Impact Eng. 2009, 36, 235–242. [Google Scholar] [CrossRef]
  21. Wilhelm, J.; Ptak, M.; Fernandes, F.A.O.; Kubicki, K.; Kwiatkowski, A.; Ratajczak, M.; Sawicki, M.; Szarek, D. Injury biomechanics of a child’s head: Problems, challenges and possibilities with a new aHEAD finite element model. Appl. Sci. 2020, 10, 4467. [Google Scholar] [CrossRef]
  22. Young, W.; Sobhani, A.; Lenné, M.G.; Sarvi, M. Simulation of safety: A review of the state of the art in road safety simulation modelling. Accid. Anal. Prev. 2014, 66, 89–103. [Google Scholar] [CrossRef] [PubMed]
  23. Vangi, D. Impact severity assessment in vehicle accidents. Int. J. Crashworthiness 2014, 19, 576–587. [Google Scholar] [CrossRef]
  24. Munyazikwiye, B.B.; Vysochinskiy, D.; Khadyko, M.; Robbersmyr, K. Prediction of Vehicle Crashworthiness Parameters Using Piecewise Lumped Parameters and Finite Element Models. Designs 2018, 2, 43. [Google Scholar] [CrossRef] [Green Version]
  25. Munyazikwiye, B.B.; Karimi, H.R.; Robbersmyr, K.G. Application of Genetic Algorithm on Parameter Optimization of Three Vehicle Crash Scenarios. IFAC-PapersOnLine 2017, 50, 3697–3701. [Google Scholar] [CrossRef]
  26. Vangi, D.; Begani, F.; Gulino, M.S.; Spitzhüttl, F. A vehicle model for crash stage simulation. IFAC-PapersOnLine 2018, 51, 837–842. [Google Scholar] [CrossRef]
  27. Tang, L.; Zheng, J.; Hu, J. A numerical investigation of factors affecting lumbar spine injuries in frontal crashes. Accid. Anal. Prev. 2020, 136, 105400. [Google Scholar] [CrossRef] [PubMed]
  28. Sybilski, K.; Małachowski, J. Sensitivity study on seat belt system key factors in terms of disabled driver behavior during frontal crash. Acta Bioeng. Biomech. 2019, 21, 169–180. [Google Scholar] [CrossRef]
  29. Baranowski, P.; Bogusz, P.; Damaziak, K.; Malachowski, J.; Mazurkiewicz, L.; Muszynski, A. Analiza wpływu zastosowanego elementu energochłonnego mającego bezpośredni kontakt z głową dziecka w aspekcie minimalizacji obciążeń dynamicznych. Logistyka 2015, 4, 2355–2363. [Google Scholar]
  30. LSTC. LS-Dyna Keyword User’s Manual, R11 ed.; Livemore Software Technology Corporation (LSTC): Livermore, CA, USA, 2018. [Google Scholar]
  31. Hallquist, J. LS-Dyna: Theory Manual; Livemore Software Technology Corporation (LSTC): Livermore, CA, USA, 2019. [Google Scholar]
  32. Ptak, M. Method to assess and enhance vulnerable road user safety during impact loading. Appl. Sci. 2019, 9, 1000. [Google Scholar] [CrossRef] [Green Version]
  33. Bose, D.; Crandall, J.R.; Untaroiu, C.D.; Maslen, E.H. Influence of pre-collision occupant parameters on injury outcome in a frontal collision. Accid. Anal. Prev. 2010, 42, 1398–1407. [Google Scholar] [CrossRef]
  34. Xiao, S.; Yang, J.; Crandall, J.R. Investigation of chest injury mechanism caused by different seatbelt loads in frontal impact. Acta Bioeng. Biomech. 2017, 19, 53–62. [Google Scholar] [CrossRef] [PubMed]
  35. Humanetic Innovative Solutions Inc. Hybrid III 50th Dummy Dyna Model—Technical Report. Release Version 8.0.1; Humanetics Innovative Solutions, Inc.: Farmington Hills, MI, USA, 2013. [Google Scholar]
  36. Marzougui, D.; Samaha, R.R.; Cui, C.-D.; Opiela, K. Extended Validation of the Finite Element Model for the 2010 Toyota Yaris Passenger Sedan; The National Crash Analysis Center: Ashburn, VA, USA, 2012. [Google Scholar]
Figure 1. Numerical research strategy [28].
Applsci 11 01427 g001
Figure 2. Numerical model used in simulations.
Applsci 11 01427 g002
Figure 3. Numerical model of seatbelts.
Applsci 11 01427 g003
Figure 4. First stage of dummy model modifications.
Applsci 11 01427 g004
Figure 5. Second stage of dummy model modifications.
Applsci 11 01427 g005
Figure 6. Characteristic time points of the simulations.
Applsci 11 01427 g006
Figure 7. Positions of the dummy at the moments corresponding to the maximum longitudinal displacement.
Applsci 11 01427 g007
Figure 8. Lateral displacement of dummy H-point.
Applsci 11 01427 g008
Figure 9. Lateral displacement of dummy H-point.
Applsci 11 01427 g009
Figure 10. Lateral displacement of dummy H-point.
Applsci 11 01427 g010
Figure 11. Angle of rotation of the shoulders.
Applsci 11 01427 g011
Figure 12. Angle of rotation of the shoulders.
Applsci 11 01427 g012
Figure 13. Angle of rotation of the shoulders.
Applsci 11 01427 g013
Figure 14. Comparison of contact force between the seat belts and the dummy.
Applsci 11 01427 g014
Figure 15. Comparison of contact force between the seat belts and the dummy.
Applsci 11 01427 g015
Figure 16. Comparison of contact force between the seat belts and the dummy.
Applsci 11 01427 g016
Figure 17. Head Injury Criterion (HIC) comparison.
Applsci 11 01427 g017
Figure 18. Head Injury Criterion (HIC) comparison.
Applsci 11 01427 g018
Figure 19. Head Injury Criterion (HIC) comparison.
Applsci 11 01427 g019
Publisher’s Note: MDPI stays neutral with regard to jurisdictional claims in published maps and institutional affiliations.

