Article

Applying Knowledge Inference on Event-Conjunction for Automatic Control in Smart Building

1
Interfaculty Initiative in Information Studies, The University of Tokyo, Tokyo 1130033, Japan
2
Chinese Academy of Sciences, Institute of Computing Technology, Beijing 100190, China
*
Author to whom correspondence should be addressed.
Appl. Sci. 2021, 11(3), 935; https://doi.org/10.3390/app11030935
Submission received: 23 December 2020 / Revised: 13 January 2021 / Accepted: 14 January 2021 / Published: 20 January 2021
(This article belongs to the Special Issue Machine Learning Methods with Noisy, Incomplete or Small Datasets)

Abstract

:
Smart building, one of IoT-based emerging applications is where energy-efficiency, human comfort, automation, security could be managed even better. However, at the current stage, a unified and practical framework for knowledge inference inside the smart building is still lacking. In this paper, we present a practical proposal of knowledge extraction on event-conjunction for automatic control in smart buildings. The proposal consists of a unified API design, ontology model, inference engine for knowledge extraction. Two types of models: finite state machine(FSMs) and bayesian network (BN) have been used for capturing the state transition and sensor data fusion. In particular, to solve the problem that the size of time interval observations between two correlated events was too small to be approximated for estimation, we utilized the Markov Chain Monte Carlo (MCMC) sampling method to optimize the sampling on time intervals. The proposal has been put into use in a real smart building environment. 78-days data collection of the light states and elevator states has been conducted for evaluation. Several events have been inferred in the evaluation, such as room occupancy, elevator moving, as well as the event conjunction of both. The inference on the users’ waiting time of elevator-using revealed the potentials and effectiveness of the automatic control on the elevator.

1. Introduction

Internet of Things (IoT) technologies [1] have enabled a variety of sensors and devices inside building, such as light, HVAC (heating, ventilating, and air conditioning), alarm system, surveillance camera, power meters, occupancy sensor, etc. being real-time monitored or controlled. Furthermore, artificial intelligence (AI) provides opportunities for innovative application development, for instance, supervisory automation, occupancy comfort optimization, energy efficiency improvement, indoor health management, security management, thus empower the building to be smart.
The most appealing benefit of smart building technologies is this revolution in building management systems (BMSs) [2], where the data collected from various sensors is processed and analyzed for enabling energy optimization, automation, and so on. In terms of revenues, researchers estimated that connected devices into the global BIoT market generated revenues of more than $1.2 billion in 2018. While building automation market will grow at a compound annual growth rate (CAGR) of 44 percent to reach 19.4 million in 2022. This trend will grow at a CAGR of 21 percent to almost $2.7 billion in 2022.
However, studies show that dynamic automation solutions are still insufficient [2]. Deploying automation in smart buildings requires a large amount of manual effort and building specific domain expertise. Yet, this vision is far from realization. It is still a challenge for modeling the context including users, sensors, actuators (so-called smart device), spaces, etc, in an effective way for knowledge computation. Various sensory data collected from sensors need to be analyzed by algorithms, transformed into information, and minted to extract knowledge so that machines can have a better understanding of humans [3]. So far, most existing studies mainly focus on human activity recognition in a small-size space with limited numbers of devices or sensors. These machine learning-based approaches usually treat the building as a black-box. They ignore the building’s physical structure, do not capture the global relations among the deployed sensors, spaces, as well as the observation of both the sensor value and the timestamp in a holistic view.
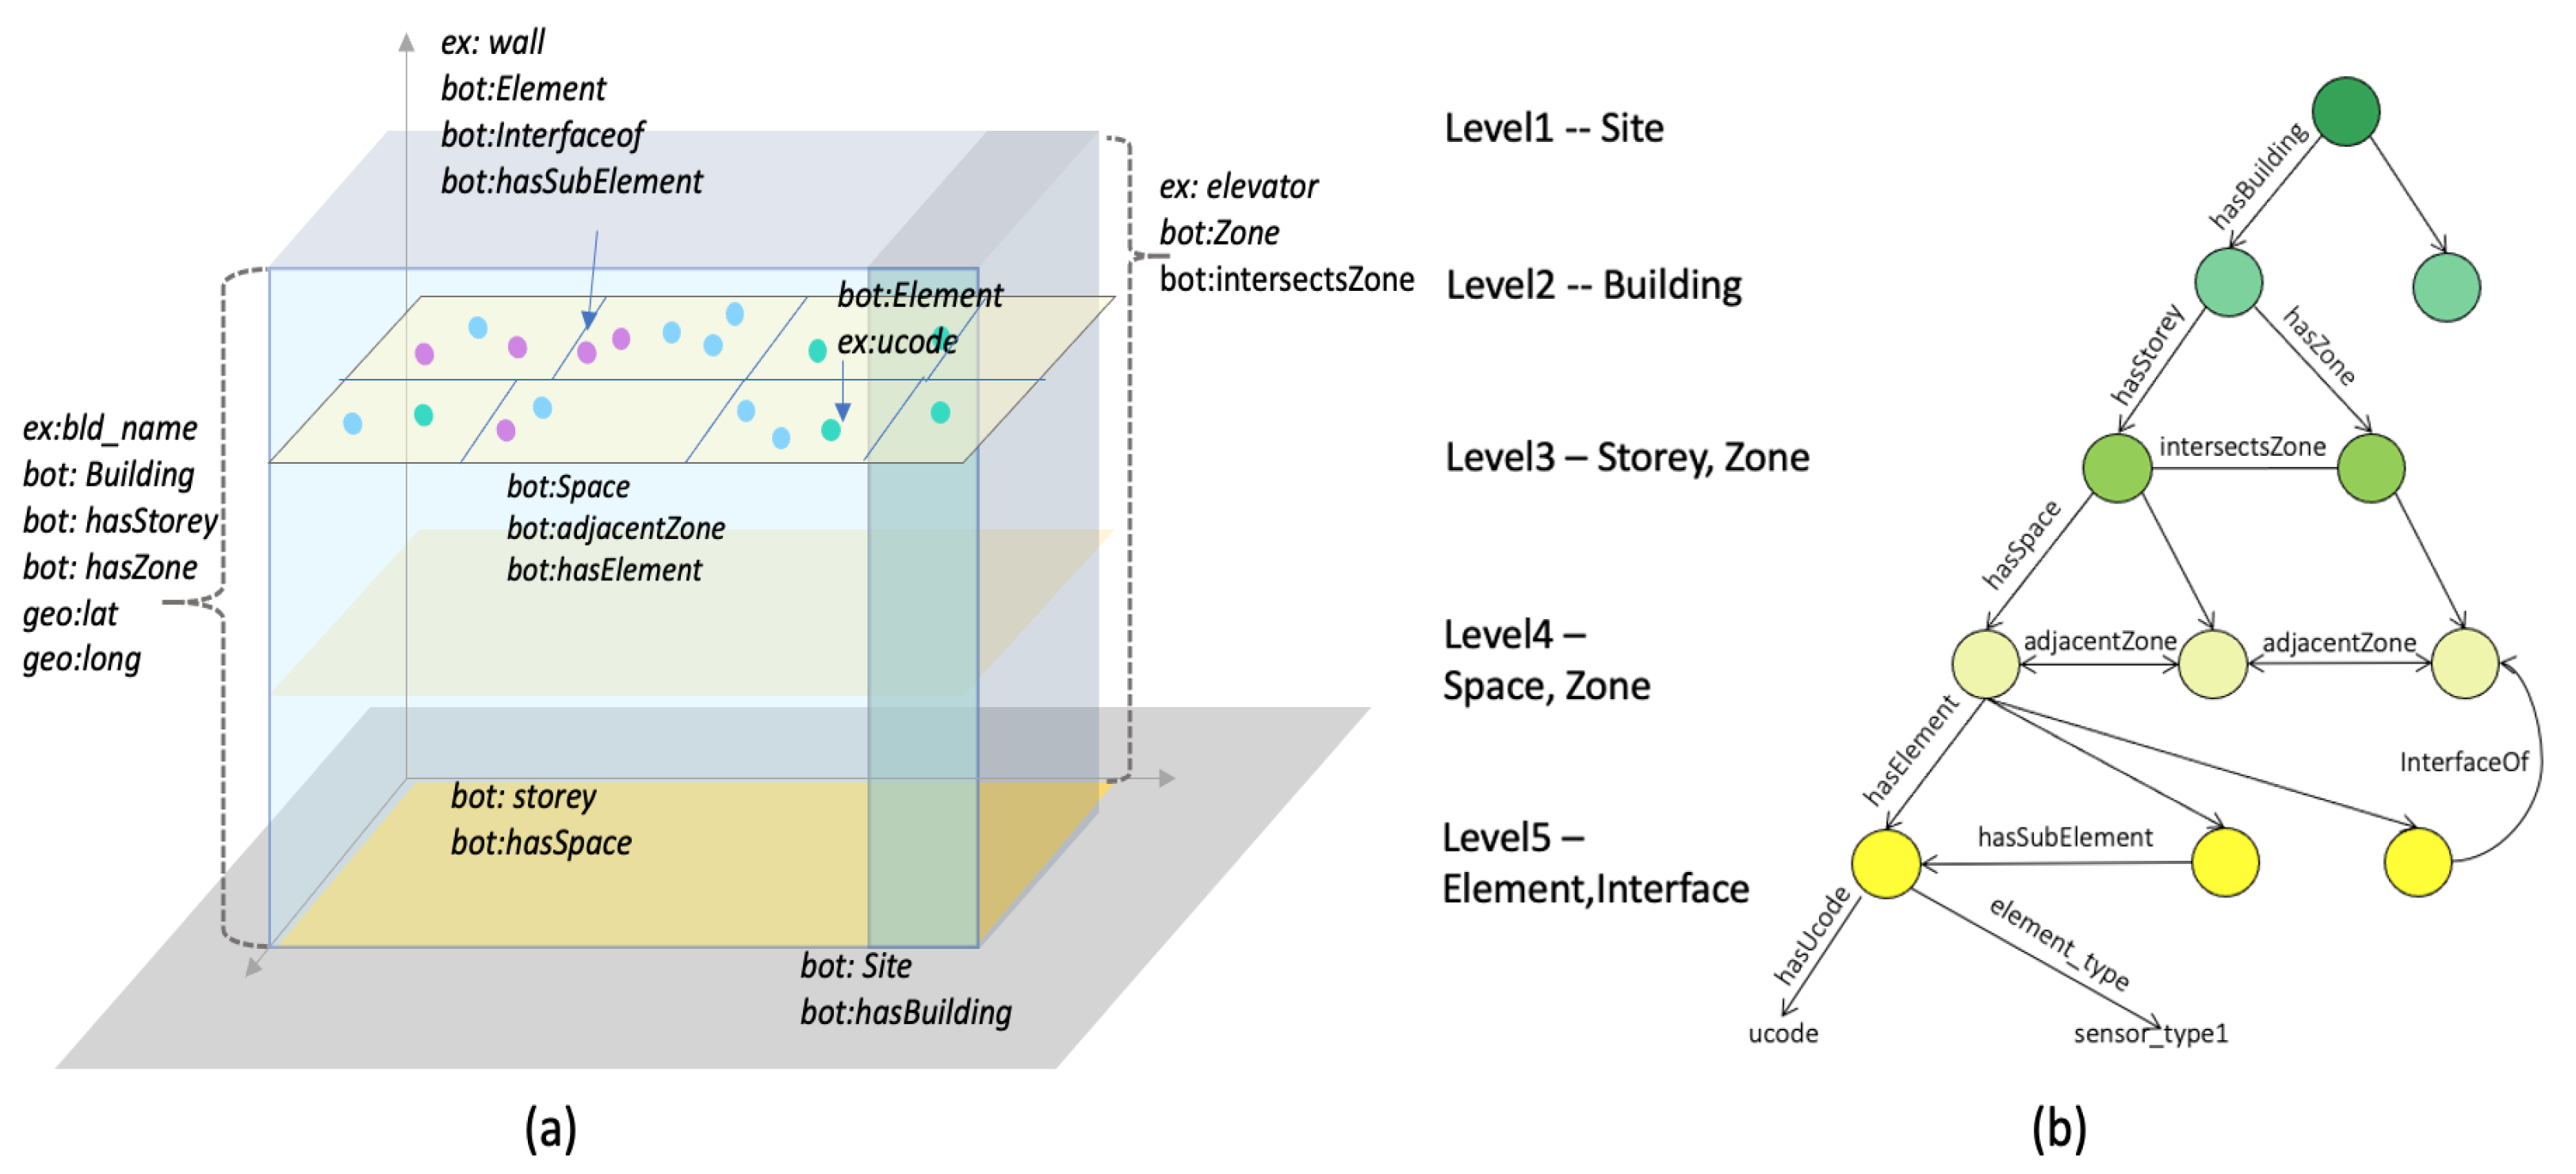
We consider in most applications of smart building, there must be tight relationships among the users, sensors, and the physical structure of the space. Especially, regarding human motion trace, there are strong spatial dependencies among the sensor observations. Therefore, a holistic and conditional probabilistic approach that considers human activity contexts and human-machine interactions (e.g., elevator motion, door-open, light-on, etc.) could be suggested. As shown in Figure 1, while a user entered a building and was heading to his/her sit, he/she activates multiple sensors/devices along the path.
Though, camera-based image processing approaches could achieve relatively high accuracy for human trajectory tracking. Contrary to the outdoor environment or other open/public spaces (roads, streets, etc.), privacy preservation is generally required while indoors (e.g., offices, meeting rooms, residential spaces, etc.). Therefore, non-invasive sensing technologies (sensor data of devices/appliances, etc.) are more appropriate than the use of cameras. In this study, we focus on such non-invasive sensor nodes.
However, while deploying machine learning (ML) approaches for detection, a large scale of label data was required if pursuing high level of accuracy. Especially, regarding human motion trace related event, the label data could be collected is small or sometimes incomplete. For an example, the room occupancy event happens several times per day, or rarely happens if the functionalities of the room are restricted or the space is not publicly open. That means it is quite difficult and time-costly to collect such room occupancy label data at a large scale. Moreover, it is still an ad-hoc process of defining which sensor node should be used and how to combine them for ML computation. Finally, it hinders the development of machine learning methods to extract knowledge of event in an automatic manner, for realizing such as room occupancy detection, human motion tracking, and so on.
In this paper, we present our proposal: a practical proposal of knowledge inference on event in IoT-enabled smart building environment. The proposal leverages the Building Topology Ontology (BOT) for constructing spatial graphs among sensors and spaces for further enabling conditional reasoning. In particular, considering the collected data is small, we utilized the Markov Chain Monte Carlo (MCMC) sampling method to approximate the time interval values of two correlated events. The proposal has been put into use in a real smart building environment. Several inference scenarios have been conducted. Moreover, the inference on users’ waiting time revealed the effectiveness of automatic control on elevator for pursuing zero-waiting time. Hence, the primary contributions and novelties of this work can be summarized as follows:
  • Unified API development of IoT sensor network for event inference based on sensor-data collaboration in the smart building;
  • Ontology-based graph model for constructing the spatial relations among sensors and space for further enabling automatic event extraction based on conditional reasoning;
  • Inference engine, in which two types of models: FSMs (finite state machine) and BN (Bayesian Networks) have been proposed for event-mapping. Further, Markov Chain Monte Carlo (MCMC) model has been utilized for enhancing the accuracy of sampling the small-size dataset of time-interval values.
  • Usage scenario of automatic control on elevator control has been conducted for evaluation. The numerical results demonstrate the potential and effectiveness of automatic control application based on knowledge inference in the smart building.

2. Related Work

2.1. Machine Learning Approaches

Most existing solutions that use machine learning (ML) for smart building applications focused on the occupant, including occupancy detection [2,4], activity recognition [5], and estimating users’ preferences and identification [2]. Khan et al. [4] dealt with occupancy of premise range from binary occupancy (occupied or out of occupied), categorical and exact numbers by integrating several types of sensors, including PIR, acoustic noise, humidity, and light, and so on. Hossain et al. [6] proposed using an active learning approach for activity recognition in residential buildings. The proposal was motivated by the variety of human activities thus based on K-means algorithm. It requires the provision of vast amounts of labeled data for ensuring the supervised learning approaches be effective, which is not always possible. Most of these existing ML-based works focused on solving the detection problem which has been taken in a limited space. The physical sensor deployment has been ignored.
To reduce the complexity of knowledge transfer across different domains, Chiang et al. [7] focused on exploring the differences caused by the ambient sensors and the target domain, proposed a framework that knowledge transfer that uses standard SVM (support vector machine) and RBF (radial basis function). However, in their proposal, only single-resident scenario was considered. Similarly, Hong et al. [8] proposed automatic inference on the type of sensors in a building. They focused on the classification of sensor types without manual labeling. However, these related works focused on the inference of sensor types, parameters and so on. They did not capture sensor observations for event detection.

2.2. Modeling Tool of Spatial Graph

In regard to the modeling tools of sensor deployment, standard practical solutions are still lacking. Building Information Modeling (BIM) is a framework to support the planning and construction of buildings. Industry Foundation Classes (IFC) standard [9], which is a well-known representation of BIM, considers the elements inside a building as objects that are defined by a 3D geometry and normalized semantics. The Green BuildingbXML (gbXML) [10] emerged to allow sharing information between BIM and energetic analysis software. However, the main intentions of these tools are the modeling of the physical structure and used materials, which is static. Their main focus is on the physical environment setup. That means they are often used for structural analysis or 2D/3D modeling by using CAD tools. The functional aspects of knowledge extraction of building systems are not covered by these approaches.
Many research projects are actually elaborating semantic models for facilitating building management, such as rule-based methods for supervision [11], definition or classification of metadata schema for facilitating building management [8,12,13]. An ontology is a vocabulary based method for defining the concepts and relationships used to describe an area of concern based on RDF (Resource Description Framework) [14]. A few of specific ontologies have been proposed for the domain of smart homes and buildings [11,15,16,17,18,19]. Most of these ontologies focus on realizing specific applications like energy management [18,19,20], or automated design and operation [11,16,17,18,19].
The SOSA (sensor, observation, sample, and actuator) ontology [21] and semantic sensor network (SSN) ontology are W3C recommendations, providing an approach to describe hardware, observation of physical entities and actuation, etc. The BOnSAI [15] ontology was proposed for describing the functionality of sensors, actuators, and appliances. However, it does not provide sufficient information on spatial relationships among the sensors and other building assets. The Building Topology Ontology (BOT) [17] defines the relationships between the sub-components of a building. It also follows general W3C principles and was suggested as an extensible baseline for reuse.
To summarize these ontology-based studies, whether merely for modeling the resource description or knowledge extraction, ontology that constructs the physical relations in the smart building is considered as suitable to present graph concepts. Moreover, aiming for removing ambiguity, and pursuing application portability, unifying the sensor data format is one of the most important considerations. In addition, the W3C endorsed ontologies demonstrate high potentials of upper-layer application development. Thus, rather than proposing a new ontology, our approach preferred to reuse the existing ontologies, and extend them by adding other necessary specific information.

3. Problem Definition

Before knowledge inference in the smart building being ubiquitous, there are still several technical challenges to confront:
  • Integration and interoperability of heterogeneous data set
    The most fundamental problem is the compatibility of heterogeneous sensors/devices, providing different networking features, protocols, and interfaces from different vendors. The transition and integration between the heterogeneous sensors are costly and make smart building implementation slow down. High level of manual effort is currently required to integrate the sensor or device nodes, which are often decentralized in both the cyber and physical dimensions, varying with their parameters. Such processes are both time-consuming and error-prone [12]. That leads to, while deploying inference framework for smart building, the developers need to map various data from heterogeneous sensors without a common format or unit.
  • Lack of semantic approach
    Relevant description logics (DL) is required to deal with environmental data within smart buildings, such as the type, instance as well as the relevance, relation among the entities for knowledge extraction. However, the complicated indoor environment with various features including general, spatial, temporal, spatio-temporal leads to a standard description logics (DL) for the IoT sensor network in the smart building being lacked. Ontology could be used for constructing the relational graph among sensors and spaces, etc. However, the ontology needs to capture the dependencies accurately, while not being excessively complex to make inference hard.
  • The small and incomplete data features
    Although environmental data could be collected over time, the human-motion related sensor data is somehow sparsely triggered in both the spatio and temporal dimensions. Most of the sensor data would be got rid of being labels for machine learning. Thus, it is difficult to collect the label data at a large scale in the real phenomenon. That means while developing knowledge inference on event conjunction by taking into account continuous changes inside the whole environment, the problem of handling small and incomplete data should not be ignored.

4. Proposal and Experiment

We introduce our proposal as below: a practical knowledge extraction platform in IoT-enabled smart building environment. The proposal fuses various IoT-enbled devices or sensors inside the building for knowledge extraction on events. It consists of three major components: (1) unified IoT API for sensor data collaboration; (2) knowledge base in which ontology for constructing the physical relational graph was utilized; (3) inference engine. Figure 2 describes the overview of our proposal.

4.1. Unified API Design

In order to solve the above-mentioned problems, the development of a unified API for interoperability among IoT devices becomes a fundamental aspect. Unifying the device API would ease and accelerate the new service development in the smart building, which brings innovation and productivity. However, unifying of device API is considered challenging, because the heterogeneous devices with different functionalities have different specifications and configurations. A unified API has to cover all IoT devices and simplify the properties of such devices.
Based on the exploration of device properties, we designed a unified API for receiving the monitored state information in real-time. The details of API is interpreted by the following Figure 3. The following set of properties has been contained: (1) ‘ucode’ [22] that used as the identifier of the sensor node; (2) ‘name’ that assigned with the description of the node; (3) ‘data’, that composed by the sub-properties of ‘instance’ and ‘time’, with ‘instance’ showing the sensed value and ‘time’ indicating the timestamp.
The ‘ucode’ [22] is a 128-bit fixed-length identifier. It could be used as a unique identification for associating the objects in different databases. While accessing the API for retrieving data, the ‘ucode’ is required to be given whereas the time duration is not necessary. The system would capture the monitored sensing data during the time window for a response if the parameters of ‘from’ and ‘to’ were assigned. Meanwhile, if the timestamp was omitted, only the latest data value would be responded.
Table 1 lists several examples of sensor data that could be retrieved from the unified API. The timestamp value is automatically detected by the system, such as the example of ‘2020-10-07 09:46:54’. In addition, as sensor features consists of both numerical values and logic state (on/off) causing computation complexity, the state data are converted to numerical data with logical meanings, where 1 represents on/active/open, etc; 0 represents off/inactive/close, etc.

4.2. Knowledge Database

Spatial and functional relationships inside buildings could be considered as being graphical. In this research, our goal is not to develop a new ontology for modeling the building structure, but to show how IoT collaboration platforms in smart buildings leveraging semantic technologies could implement some global knowledge inference functions for automatic control.
Therefore, to comply with and take full advantage of existing standard works in this field, the Building Topology Ontology (BOT) was imported. The BOT is an OWL-DL ontology [23] for defining both the physical and semantic relationships of the sub-components inside a building. It was used to describe the semantic schema such as the physical relationships, functionality parameters inside the building, of whom the data set was static.
As shown in Figure 4a, high-level concepts of node hierarchies have been defined by BOT. It was composed of: classes (e.g., Building, Space, etc.) for representing a spatial entity; properties (e.g., has_storey, has_space, interface_of, etc.) for representing the relations between entities; rules (e.g., wall could be modeled as an interface of two rooms; door within a wall could be modeled as a tuple of <wall, has_element, door>). According to the BOT ontology, the corresponding triplets (representing the entities and relationships) of our building have been created. We referred the classes of BOT, i.g, site, building, zone, space, element, etc. The details have been described as follows.
  • Site: An area contains one or more buildings, that further could be used in the field of city area computing.
  • Building: Building node assembles all the sub-nodes within the building. Thus the whole context inside the building could be referenced through the building node.
  • Storey: A level/floor part of the building.
  • Zone: Elevator and stairwells are modeled as a Zone, used as links of multiple storeys through the BOT:intersectsZone relation.
  • Space: A part of a storey, whose 3D spatial extent is bounded actually or theoretically. In general, it represents a common space, e.g., a room, an elevator hall, toilet, corridor, and so on. The space node assembles all the elements (i.g., sensor, actuator, device) located within it.
  • Element: Sensor, actuator, device were defined as element nodes deployed in space. For each element, an identifier of ‘ucode’ has been assigned for associating the dynamic sensor observations through the unified API.
As shown in Figure 4b, aiming to interconnecting heterogeneous devices for further efficient reasoning and heuristics, the model was hierarchically structured along with the building architecture. We consider the graph-based hierarchical structure of the model fits the building structure for the reasoning strategy because the indoor users’ motion trace follows the features and layouts of the building. The model that is on representing hierarchy in the building and it fits bottom-up data collection and decomposition. Also, the model follows ordinary building designs that make it practicable for almost all the common buildings.

RDF Data Store and Sparql Query Language

We separated the static ontology and dynamic sensing data into RDF store and relational database store. Spatial relationships were constructed by a BOT graph. Meanwhile, sensor nodes (which were described as Element in the BOT) are continuously submitting data in real-time that causes the data store to be large and get updated frequently. We chose a relational database to store the sensor data. Those two data stores were associated with the unique identification of ‘ucode’. Combining the ontology and relational database enables to process of spatial-temporal data efficiently.
The choice of ontology informed the RDF data model [24], and SPARQL query language [25] being selected for representing and querying graphs, respectively. The RDF triple is a 3-tuple of <subject, predicate, object> that states a subject has a relationship predicate (directed edge) to an entity object. SPARQL [25] defines a set of patterns that constrains the set of RDF terms returned from the graph. Figure 5a shows a part of the triple examples of our ontology data store. We chose Apache Jena for storing the ontology data by RDF data structure. Apache Jena [26] is an open-source framework for managing and querying RDF data. It contains a web frontend (Fuseki) and a SPARQL backend (TDB) that supports all SPARQL 1.1 features. It also provides an API to extract data from and write to RDF graphs by sparql protocol and RDF query language (SPARQL).
All entities and relationships exist in a namespace, identified by a URI. For example, the namespace of our proposal is ‘https://URIoftheresearchbuilding/daiwa_BOT#’. As the query example shown in Figure 5b, a graph of ‘all the sensor nodes within the spaces (e.g., room, hall, corridor, etc.) that belong to the floors connected by the elevator’ could be extracted.

4.3. Inference Engine

The inference engine combines the ontology and sensor observations to keep detection of events inside the building. Sensor or device nodes change their states according to user activities as well as their motion trajectories. The events that could be inferred by sensor observations have been classified into two types: deterministic and probabilistic. Therefore, a hybrid graphical model was chosen to implement the inference engine. Two different methods including probabilistic and deterministic were used. Those are Bayesian Network (BN) and Finite State Machine (FSM), shown in Figure 6 and Figure 7, respectively.
Finite state machine (FSM). Finite state machines are suitable to describe the state logic of observations on deterministic sensor values. As described above, the elevator has been modeled as Zone entity in our ontology model. It works for transporting users in the vertical dimension of the building. In general, elevator moves with a constant moving speed ( T m o v i n g ) and several deterministic states. Therefore, finite state machines are suitable to describe the state logic of observations on elevator’s moving. As shown in Figure 6, a graph model of FSMs was used to implement the state transition of the elevator. The details of parameters description were listed in Table 2.
In essence, the elevator changes its states according to passengers’ activities and requests. Thus, the simultaneous state-mapping on users and elevator has been clarified as shown in Figure 8. According to the predefined state transition of both the elevator and users, the following event patterns could be elaborated: (1) while the elevator was moving for picking-up, the user remains to wait at the departure floor; (2) while the elevator was transporting, the user was riding on the cabin for heading to the destination floor; (3) while the elevator was boarding for picking-off, that means the user had arrived at the destination floor.
Byesian network (BN). On the other hand, a few of events with high-level semantics were inferred based on the conjunction of multiple correlated events. Graphical dependencies among these event and sensor data observations in both the spatial and temporal dimensions could be observed. A probabilistic graphical model has been proposed based on the conditional inference on two correlated events. For example, there are bidirectional effects on both the use of elevator and room-occupancy event (namely that when the user leaves the room, he/she would call the elevator to move to another floor; when the elevator comes to the floor for picking-off users, an event that user enters the room might happen).
In this proposal, Bayesian network (BN) was utilized for modeling the probabilistic graph on these conditional events inside the building. As the probabilistic state transitions shown in Figure 7, let P e | ( s i , S ) denotes the probability of estimated event based on the sensor observation of s i on the overall observations of S. The sensor observation s i was denoted as the tuple values < v i , t i > and could be directly extracted from the unified API. For every sensor node in the BOT graph we defined the true state on the probability distribution. The sensor observations S = { s 1 , s 2 . . s n } was used for computing the probability distributions with the measurement of mean, median, minimum and maximum, etc.
Algorithm 1 shows the overall algorithm that was applied for inferring the continuous events based on the sensor observations. For every sensor node in the original dependency graph, we add an event based on the observed state and timestamp in the event graph. For every Δ t value on edge i, j of two estimated events, if the conditional probability of Δ t is greater than the threshold value, the event conjunction was estimated and event E i m was set to be true and be added on the event graph.
Algorithm 1: Generic Knowledge Extraction Algorithm
Applsci 11 00935 i001

Markov Chain Monte Carlo (MCMC) Sampling Process

One of the main challenges in this inference engine is the probabilistic modeling on Δ t . The graph needs to capture the probability based on the statistical analysis of time intervals. As shown in Equation (1), the Bayesian paradigm (so-called Bayes theorem) was deployed to express the relation between three terms: a prior knowledge, a likelihood (the knowledge coming from the observation), and a “posterior” (the updated knowledge). Meanwhile, it can be noticed that one of the main difficulties faced when dealing with a Bayesian inference problem comes from while the size of posterior samples is not enough to converge.
In this proposal, we utilized the MCMC sampling method to overcome the mentioned above issue. MCMC algorithms are aimed at generating samples from a given probability distribution. It is useful for obtaining a sequence of random samples from a probability distribution in which direct sampling is difficult, or the sample data is small or incomplete. Thus, instead of trying to deal with intractable computations involving the posterior, we can get samples from using the existing samples and some definite prior value to compute various punctual statistics to approximate the distribution by kernel density estimation.
p ( μ | D a t a ) posterior = p ( D a t a | μ ) likelihood · p ( μ ) prior p ( D a t a ) marginal likelihood
The Metropolis–Hastings algorithm, one of the most common methods of MCMC based sampling process, was utilized for drawing samples from probability distribution P ( Δ t ) , provided that we know a function f ( Δ t ) is proportional to the density of P ( Δ t ) and the values of f ( Δ t ) can be calculated. The requirement that f ( Δ t ) must only be proportional to the density, rather than exactly equal to it, makes the Metropolis-Hastings algorithm particularly useful while the size of event-related sensor observations is relatively small.
Local distance-based adjustment In this sampling process, as shown in Equation (2), the prior distribution of Δ t was adjusted according to the shortest distance D i s t ( e i , e j ) between two space entities ( e i , e j ) extracted from the BOT graph, where the prior probability P( μ ) is the probability of the hypothesis μ before the Data D, was modeled as a Gaussian distribution.
μ N ( f D i s t ( e i , e j ) , σ )
where the value of f D i s t ( e i , e j ) showing the shortest distance is linearly-correlated with the count of hops between two triggered sensor nodes in the graph, as denoted in Equation (3).
f D i s t ( e i , e j ) = a x + b
Based on the shortest distance values extracted from the BOT graph and the Δ t values collected in the evaluation, the values of a, b in the linear regression could be calculated by the Equations (4) and (5). Figure 9 shows the result of linear regression optimization of D i s t ( e i , e j ) with several distance examples have been illustrated as well.
C = 1 n y y ^ 2 , w h e r e C a = 0 , C b = 0
a = 1 n x y 1 n 1 n x 1 n y 1 n x 2 1 n 1 n x 2 , b = 1 n 1 n y a x
Collected data of Δ t 1 , …, Δ t n , was used for computing the prior probability. With given the measured quantities Δ t 1 , …, Δ t n , the probability function has been modeled as normally distributed, shown in Equation (6).
Δ t i N ( μ , σ ) , w h e r e f ( Δ t i | μ , σ ) = 1 2 π σ 2 e ( Δ t i μ ) 2 2 σ 2
In order to derive the approximated value μ of Δ t 1 , …, Δ t n , PyMC3 [27] was utilized for performing Bayesian statistical sample processing focused on MCMC. PyMC3 is an open-source probabilistic programming framework written in Python. It is based on Theano.

5. Experiment and Evaluation

The experiments have been conducted in a real smart building named “Daiwa ubiquitous computing research building” in the University of Tokyo. Figure 10 shows the IoT-enabled environment of our smart building. The building has 5 floors including B2F, B1F, 1F, 2F, 3F, and 43 space entities (i.e., room, hall, or corridor, etc.) and 1 elevator. At the meantime, 846 spatial relation triples have been restored in the BOT graph.
In this experiment, we used the data collection of 114 lights and 1 elevator for knowledge inference on the events of room occupancy and elevator motion. Figure 11 shows the visualization of the light status in several rooms of the building, spanning 78-days (from 13 September 2020 to 30 November 2020). The sizes of the sensor observations have been listed in Table 3. It is worth to note that during the covid-19 pandemic, the collected occupancy-related or event-conjunction-related sensor observations were much less than normal periods.

5.1. Trace on Event Conjunction

Based on the MCMC sampling process, the value of Δ t between two corresponding events has been approximated. Figure 12 shows the results of approximated time intervals between the event of elevator-arriving and light-up of several representative spaces. Table 4 listed the detail results as well. Further, based on the approximated Δ t , such as the event conjunction of ‘light_turn_off -> elevator_arriving’ could be inferred. As a result, the count of inferred room occupancy ( E r ), event conjunction ( E r -> E e l ) and their conditional probabilities have been summarized (see the details listed in Table 5). Here, the room of which a total number of events over 80 have been picked on the list.

5.2. Assumption for Automatic Control on Elevator for Zero-Waiting Time

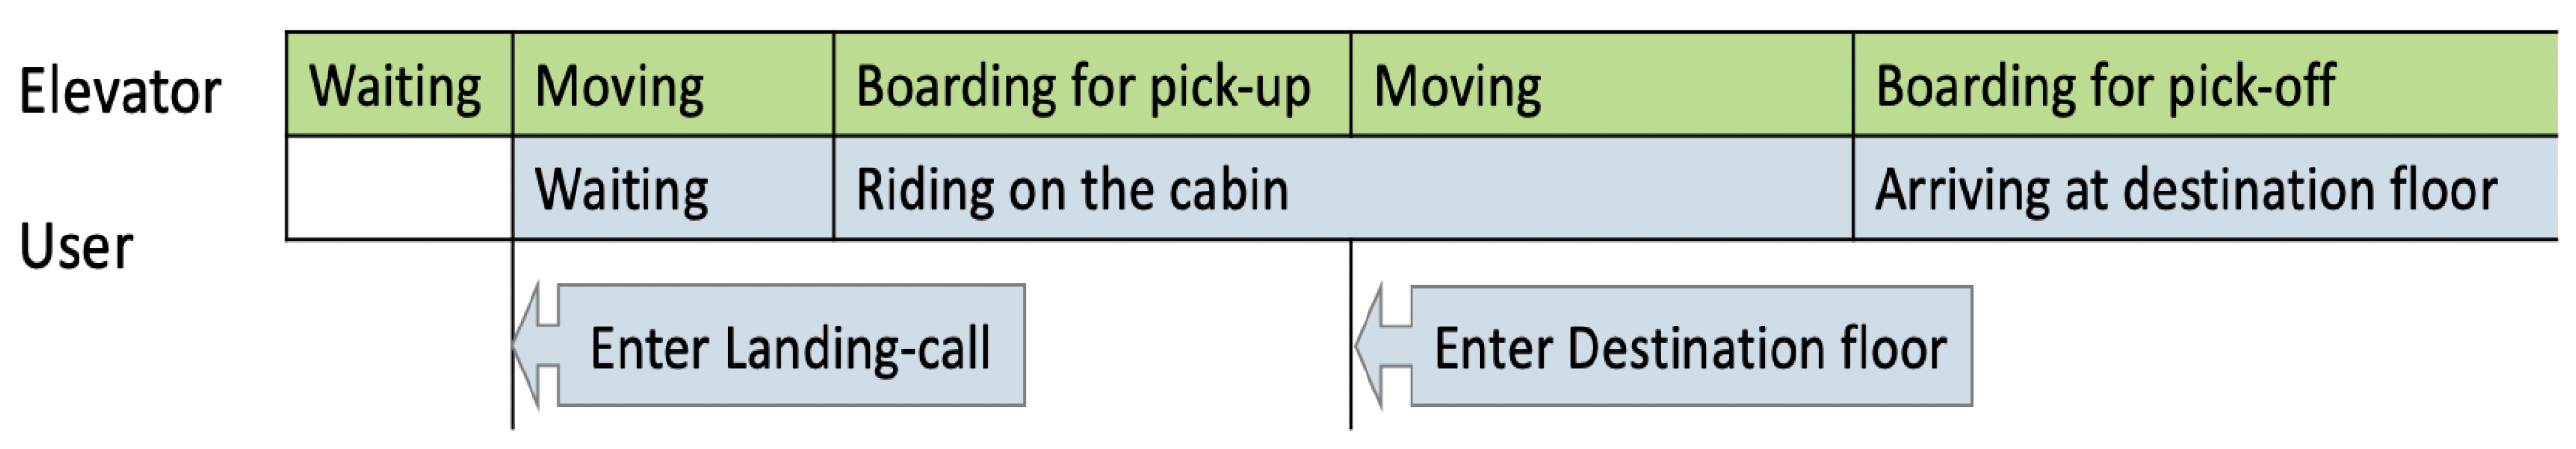
In order to evaluate the usability of the proposed framework, an automatic control scenario on elevator has been assumed. In general, when the user wanted to use the elevator, he/she has to first reach the elevator hall and press the upward or downward button to make a call on the elevator (given the timestamp of t 2 shown in Figure 13). Then the elevator received the command and arrived at the floor (given the timestamp of t 3 shown in Figure 13) to pick-up the user. The automatic control scenario was an assumption based on knowledge inference on event conjunction. Suppose:
  • Room occupancy has been monitored in real-time based on the sensor observations;
  • If the agent detected a user leaving the room and further predicted the user has an intention of using the elevator;
  • Then, the agent triggers the elevator in-advance to move to the user’s departure floor.
The above assumption means when the user arrives at the elevator hall at t 2 time, the elevator has been ready for picking up the user. Thus, he/she can take a ride on the elevator immediately and no waiting time ( t 3 t 2 ) was needed.
Therefore, the effectiveness of automatic control on elevator was evaluated by extracting the historical users’ waiting time. The numbers of inferred event conjunction of room occupancy -> elevator arriving ( E r -> E e l ) has been listed in Table 6. Regarding the elevator usage, the count of non-waiting, waiting have been calculated as well. Furthermore, the percentages of the different waiting time also have been inferred, respectively.
Figure 14 shows the statistical result of users’ waiting time calculated from collected sensor data. The result demonstrated there were 267 waiting events happened among the total of 471 elevator-using events, with the probability of waiting was 56.7%. In addition, the total amount of waiting time was 3085 s and the average waiting time per user was 11.55 s (SD = 5.30 s).
These numerical results of users’ waiting time demonstrated the great potentials of automatic control on elevator for pursuing the goal of zero-waiting of using the elevator. The quantitative results also showed the effectiveness of the knowledge inference on event conjunction in smart building, for further improving the transport efficiency and productivity of indoor users.

6. Discussion

In the experiments, room occupancy was determined as binary-mapping from light state changing. The rule was set as: while the light is turning-on, the room is in occupancy; otherwise, the room is out of occupancy. However, in real usage, more complicated situations could be taken into consideration. Since people left the room without turning off the light sometimes happens, multi-modal sensor fusion should be considered if pursuing the inference accuracy. For example, the state of light and smart lock could be combined for improving the accuracy of room occupancy detection. Nevertheless, the BOT-based graph has provided opportunities for modeling other sensor observations in a structured hierarchical graph. There could be few challenges for modeling other different types of sensors to the existing ontology graph. Thus we consider that our approach could be adapted to other sensor resources in the smart building if available, and the methodology is practical for other smart buildings.
On the other hand, various sensors are currently installed in the smart building. In addition to the diversity of sensors, more benefits of our proposal could be quantified after a diverse range of automatic control application being implemented. For example, tracing on human motion in the smart building, to automatic control the appliance pursuing reducing the energy consumption, improving human comfort, health in the smart building. These mentioned-above application scenarios rely on knowledge inference in smart building. Each part of this proposal:unified API of sensor network, knowledge graph of the physical environment and the inference engine, was considered to be indispensable. In this experiment, we formed a graph with the physical relations. Semantic schema (e.g., users’ identification, preferences, relations, as well as space affiliations, etc.) has not been modeled in the graph. However, adding to these attributes, the inference engine would be capable of analyzing user-related semantics.

7. Conclusions

In this paper, we presented a practical approach of event inference for automatic control in IoT-enabled smart building environment. The proposal consists of unified API development, knowledge base and inference engine. The event inference models based on sensor observations was separated into deterministic and probabilistic. Therefore, two types of models: finite state machine (FSMs) and bayesian network (BN) have been used for capturing the state transition and sensor data fusion. As opposed to earlier straightforward machine learning-based methods, our proposal focused on the conditional conjunction and transition of two correlated events, for which a graph model of the physical environment was considered necessary.
To tackle the problem of the sizes of time interval ( Δ t ) observations were too small to derive accurate results, MCMC sampling process has been utilized for approximating the time intervals ( Δ t ). Specifically, linear regression of local distances between two space entities on the ontology graph has been leveraged for the optimization of the sampling process. The proposal has been implemented in a real smart building environment and 78-days data collection of the state on light and elevator has been conducted for evaluation. Event conjunctions on the light and elevator have been utilized for further inferring room occupancy and indoor users’ trajectories.
To show the usability of the proposal, we extracted the knowledge of users’ waiting time on the elevator. The FSM mapping result of elevator-using demonstrated the probability of users’ waiting event was 56.7%, with the total waiting time during the evaluation was 3085 s and average waiting time was 11.55 s. The numerical results demonstrated the potential of automatic control for zero-waiting on elevator based on knowledge inference on event conjunction in smart building.

Author Contributions

Writing—original draft preparation, H.G.; conceptualization, X.P.; supervision, N.K. All authors have read and agreed to the published version of the manuscript.

Funding

This research received no external funding.

Institutional Review Board Statement

Not applicable.

Informed Consent Statement

Not applicable.

Data Availability Statement

Not applicable.

Conflicts of Interest

The authors declare no conflict of interest.

References

  1. Atzori, L.; Iera, A.; Morabito, G. The internet of things: A survey. Comput. Netw. 2010, 54, 2787–2805. [Google Scholar] [CrossRef]
  2. Djenouri, D.; Laidi, R.; Djenouri, Y.; Balasingham, I. Machine learning for smart building applications: Review and taxonomy. ACM Comput. Surv. (CSUR) 2019, 52, 1–36. [Google Scholar] [CrossRef]
  3. Qolomany, B.; Al-Fuqaha, A.; Gupta, A.; Benhaddou, D.; Alwajidi, S.; Qadir, J.; Fong, A.C. Leveraging machine learning and big data for smart buildings: A comprehensive survey. IEEE Access 2019, 7, 90316–90356. [Google Scholar] [CrossRef]
  4. Khan, A.; Nicholson, J.; Mellor, S.; Jackson, D.; Ladha, K.; Ladha, C.; Hand, J.; Clarke, J.; Olivier, P.; Plötz, T. Occupancy monitoring using environmental & context sensors and a hierarchical analysis framework. In Proceedings of the Buildsys ’14—1st ACM Conference on Embedded Systems for Energy-Efficient Buildings, Memphis, TN, USA, 3 November 2014; pp. 90–99. [Google Scholar]
  5. Ahmadi-Karvigh, S.; Ghahramani, A.; Becerik-Gerber, B.; Soibelman, L. One size does not fit all: Understanding user preferences for building automation systems. Energy Build. 2017, 145, 163–173. [Google Scholar] [CrossRef] [Green Version]
  6. Hossain, H.S.; Khan, M.A.A.H.; Roy, N. Active learning enabled activity recognition. Pervasive Mob. Comput. 2017, 38, 312–330. [Google Scholar] [CrossRef]
  7. Chiang, Y.T.; Lu, C.H.; Hsu, J.Y.J. A feature-based knowledge transfer framework for cross-environment activity recognition toward smart home applications. IEEE Trans. Hum. Mach. Syst. 2017, 47, 310–322. [Google Scholar] [CrossRef]
  8. Hong, D.; Wang, H.; Ortiz, J.; Whitehouse, K. The building adapter: Towards quickly applying building analytics at scale. In Proceedings of the 2nd ACM International Conference on Embedded Systems for Energy-Efficient Built Environments, Seoul, Korea, 4–5 November 2015; pp. 123–132. [Google Scholar]
  9. Liebich, T. IFC4—The new buildingSMART standard. In IC Meeting; bSI Publications: Helsinki, Finland, 2013. [Google Scholar]
  10. Autodesk. gbXML. Available online: https://www.gbxml.org/ (accessed on 23 August 2020).
  11. Tamani, N.; Ahvar, S.; Santos, G.; Istasse, B.; Praca, I.; Brun, P.E.; Ghamri, Y.; Crespi, N.; Becue, A. Rule-based model for smart building supervision and management. In Proceedings of the 2018 IEEE International Conference on Services Computing (SCC), San Francisco, CA, USA, 2 July 2018; pp. 9–16. [Google Scholar]
  12. Gao, J.; Ploennigs, J.; Berges, M. A data-driven meta-data inference framework for building automation systems. In Proceedings of the 2nd ACM International Conference on Embedded Systems for Energy-Efficient Built Environments, Seoul, Korea, 4–5 November 2015; pp. 23–32. [Google Scholar]
  13. Balaji, B.; Bhattacharya, A.; Fierro, G.; Gao, J.; Gluck, J.; Hong, D.; Johansen, A.; Koh, J.; Ploennigs, J.; Agarwal, Y.; et al. Brick: Metadata schema for portable smart building applications. Appl. Energy 2018, 226, 1273–1292. [Google Scholar] [CrossRef]
  14. Miller, E. Resource Description Framework (RDF) Model and Syntax Specification. Bull. Am. Soc. Inf. Sci. Technol. 1998, 25, 15–19. [Google Scholar] [CrossRef] [Green Version]
  15. Stavropoulos, T.G.; Vrakas, D.; Vlachava, D.; Bassiliades, N. BOnSAI: A smart building ontology for ambient intelligence. In Proceedings of the 2nd International Conference on Web Intelligence, Mining and Semantics, Craiova, Romania, 6–8 June 2012; pp. 1–12. [Google Scholar]
  16. Ploennigs, J.; Hensel, B.; Dibowski, H.; Kabitzsch, K. BASont-A modular, adaptive building automation system ontology. In Proceedings of the IECON 2012-38th Annual Conference on IEEE Industrial Electronics Society, Montreal, QC, Canada, 25 October 2012; pp. 4827–4833. [Google Scholar]
  17. Rasmussen, M.H.; Lefrançois, M.; Schneider, G.F.; Pauwels, P. BOT: The Building Topology Ontology of the W3C Linked Building Data Group. Semant. Web 2021, 12. in press. [Google Scholar]
  18. Degha, H.E.; Laallam, F.Z.; Said, B. Intelligent context-awareness system for energy efficiency in smart building based on ontology. Sustain. Comput. Inform. Syst. 2019, 21, 212–233. [Google Scholar] [CrossRef]
  19. Petrushevski, F.; Gaida, S.; Beigelboeck, B.; Sipetic, M.; Zucker, G.; Schiefer, C.; Schachinger, D.; Kastner, W. Semantic building systems modeling for advanced data analytics for energy efficiency. In Proceedings of the 15th IBPSA Conference, San Francisco, CA, USA, 7–9 August 2017. [Google Scholar]
  20. Kofler, M.J.; Reinisch, C.; Kastner, W. A semantic representation of energy-related information in future smart homes. Energy Build. 2012, 47, 169–179. [Google Scholar] [CrossRef]
  21. Janowicz, K.; Haller, A.; Cox, S.J.; Le Phuoc, D.; Lefrançois, M. SOSA: A lightweight ontology for sensors, observations, samples, and actuators. J. Web Semant. 2019, 56, 1–10. [Google Scholar] [CrossRef] [Green Version]
  22. Koshizuka, N.; Sakamura, K. Ubiquitous ID: Standards for ubiquitous computing and the internet of things. IEEE Pervasive Comput. 2010, 9, 98–101. [Google Scholar] [CrossRef]
  23. World Wide Web Consortium. OWL 2 Web Ontology Language Document Overview; World Wide Web Consortium: Boston, MA, USA, 2012. [Google Scholar]
  24. RDF. Available online: https://www.w3.org/TR/1999/REC-rdf-syntax-19990222 (accessed on 23 August 2020).
  25. Seaborne, A.; Manjunath, G.; Bizer, C.; Breslin, J.; Das, S.; Davis, I.; Harris, S.; Idehen, K.; Corby, O.; Kjernsmo, K.; et al. SPARQL/Update: A Language for Updating RDF Graphs. W3C Member Submission. Available online: https://www.w3.org/Submission/SPARQL-Update/ (accessed on 15 July 2020).
  26. Apach. Available online: https://jena.apache.org/ (accessed on 25 August 2020).
  27. Salvatier, J.; Wiecki, T.V.; Fonnesbeck, C. Probabilistic programming in Python using PyMC3. PeerJ Comput. Sci. 2016, 2, e55. [Google Scholar] [CrossRef] [Green Version]
Figure 1. Scenario of user walking outside to inside the smart building with the sensors being triggered.
Applsci 11 00935 g001
Figure 2. Overview of our proposal for knowledge extraction.
Applsci 11 00935 g002
Figure 3. The unified API design.
Applsci 11 00935 g003
Figure 4. (a) Classes and relationships involved in the Building Topology Ontology; (b) The hierarchy of entities and relationships in BOT.
Applsci 11 00935 g004
Figure 5. (a) The triple value examples of our data store, using the turtle format of RDF metadata; (b) SPARQL query example of our proposal.
Applsci 11 00935 g005
Figure 6. The FSM model for presenting the state transition of elevator.
Applsci 11 00935 g006
Figure 7. An intuitive example shows the Bayesian network.
Applsci 11 00935 g007
Figure 8. The state transitions of both the elevator and user.
Applsci 11 00935 g008
Figure 9. (a) Result of linear regression of the shortest-distance in the graph and the μ value of Δ t , where the value of a, b are estimated to be 14.46, 26.7, respectively; (b) Several shortest distance examples between rooms and elevator in our building.
Applsci 11 00935 g009
Figure 10. The IoT-enabled smart building environment.
Applsci 11 00935 g010
Figure 11. The real examples of the monitored light states in several rooms.
Applsci 11 00935 g011
Figure 12. Examples of approximated μ values of Δ t , where (a-1,b-1,c-1) show the mean value result on the observed raw data, while (a-2,b-2,c-2) show the approximated Δ t after MCMC posterior sampling process.
Applsci 11 00935 g012
Figure 13. Example shows the real event trace of room-usage and elevator.
Applsci 11 00935 g013
Figure 14. The statistics of users’ waiting time on elevator mapped by FSMs.
Applsci 11 00935 g014
Table 1. Data value examples of the unified API.
Sensor/deviceThe meaning of binary state value (1/0)
Human detectorhuman-detected; otherwise
Lighton; off
Fanon; off
Air conditioneron; off
Elevator_potion3F, 2F, 1F, B1F, B2F
Table 2. Parameters of the FSM model.
No.SymbolDescription
1 Δ t the time duration after the last sensed time
2 T m o v i n g the constant time of moving between two floors
3 T t h r e s h o l d the time threshold value to distinguish the states of “Boarding” and “Waiting”
Table 3. Sizes of the collected data.
ItemRawValidate
DataData
Light state1,260,1392669
Elevator state14,37714,377
Table 4. MCMC sampling results Δ t of several representative spaces.
Short_Dist μ Based on μ ¯ of ObservedMCMC Sampling Process
(Hops)by LR OptimizationSensor Data μ ˘ hdi_3%hdi_97%
Room_A305255.6260.7660.6854.85266.673
Room_A304370.08118.38116.933110.495123.556
Room_A202599.00136.09134.465126.945142.471
Room_B202584.54109.72109.144103.462115.141
Room_B204370.0858.7855.6254.36663.421
Table 5. Inferred results on event-conjunction of several representative spaces.
E r E r -> E el P e r - > e el
(Count)(Count)Conditional Probability
Sum13314710.35
Room_A305110380.345
Room_A304129320.248
Room_A202122220.180
Room_B20290390.433
Room_B20489720.809
Table 6. Statistics of the users’ waiting event on elevator based on the mapping result of FSMs.
E r -> E el Without WaitingWith Waiting
Sum471210267
Probability 5 s10 s15 s20 s
0.2320.4460.1010.221
Publisher’s Note: MDPI stays neutral with regard to jurisdictional claims in published maps and institutional affiliations.

