Article

Comparison of Trabecular Bone Mineral Density Measurement Using Hounsfield Unit and Trabecular Microstructure in Orthodontic Patients Using Cone-Beam Computed Tomography

1
Department of Orthodontics, Graduate School of Clinical Dentistry, Korea University, Seoul 02841, Korea
2
Department of Orthodontics, Korea University Guro Hospital, Seoul 08308, Korea
3
Department of Orthodontics, Korea University Ansan Hospital, Gyung-gi do 15355, Korea
*
Author to whom correspondence should be addressed.
Appl. Sci. 2021, 11(3), 1028; https://doi.org/10.3390/app11031028
Submission received: 31 December 2020 / Revised: 13 January 2021 / Accepted: 20 January 2021 / Published: 23 January 2021

Abstract

:
The aim of this study was to measure the bone mineral density of specific regions of maxilla, mandible, and first cervical vertebra using the Hounsfield unit and trabecular microstructure pattern analysis and to compare the two methods. In this study, cone-beam computed tomography (CBCT) images were obtained from 58 patients. Trabecular thickness, trabecular number, trabecular separation, and bone volume fraction were measured in 484 regions for trabecular microstructure parameters and Hounsfield unit was measured for the grayscale value. There was no difference in bone mineral density between the right and left side in every site and between males and females. Trabecular thickness and trabecular number were high in the order of anterior base of the maxilla, mandibular body, first cervical vertebra, and mandibular condyle. Bone volume fraction and Hounsfield unit were high in the order of anterior base of the maxilla, mandibular body, mandibular condyle, and first cervical vertebra (p < 0.05). Trabecular thickness, trabecular number, and bone volume fraction was positively correlated to the Hounsfield unit, and trabecular separation was negatively correlated to the Hounsfield unit (p < 0.005). This study suggests that it is possible to compare the bone mineral density of trabecular bone in various sites using the Hounsfield unit and trabecular microstructure pattern analysis.

1. Introduction

Changes in the density of trabecular bones are often associated with local or systemic diseases. Changes in the trabecular bone density also affect the corrective movement of teeth associated with the orthodontic treatment [1,2]. Therefore, when evaluating the trabecular bone density, it is important to make a qualitative evaluation as well as a quantitative evaluation of the bone.
Bone mineral density (BMD) can be measured based on radiodensity in computed tomography (CT) or assessed by analyzing the microstructure of the trabecular bone. Hounsfield unit (HU) is mainly used to measure the radiographic density value [3]. Misch’s bone density classification was classified from D1 to D5 based on HU values [4]. The mandible showed the BMD from D1 to D3 from the anterior to the posterior, and the maxilla showed the BMD from D2 to D4 from the anterior to the posterior region. Recently, the introduction of high-resolution micro-CT shows the microstructure of the trabecular bone as an objective indicator and can be used for trabecular bone density analysis [5].
Cone-beam computed tomography (CBCT) became popular in the dental field for the three-dimensional evaluation of structures [6]. CBCT has the advantage of obtaining high resolution images with less radiation dose and cost than other conventional CT. Ibrahim et al. reported that the micro structural evaluation of trabecular bone using CBCT correlated with that of micro-CT [5].
A representative case of measuring trabecular bone density is for the diagnosis of osteoporosis, which measures the density of the lumbar spine or femur [7]. Guerra et al. reported that the trabecular bone density measurement using the mandible or cervical vertebra in dental CT showed a high correlation with the conventional trabecular bone density measurement through a systemic review [8]. The analysis of trabecular bone density using CBCT will be a useful reference for the diagnosis and treatment of various diseases.
In this study, the anterior base of the maxilla, mandibular body, mandibular condyle, and the first cervical vertebra were selected to measure the trabecular bone density. The aim of this study was to evaluate the bone mineral density measurement methods in various regions of the CBCT image using the Hounsfield unit and trabecular microstructure parameters in patients undergoing an orthodontic treatment, and to compare and find out the correlation between the two methods.

2. Materials and Methods

This study was conducted on 484 regions measured in 58 patients who visited the department of orthodontics, Korea University Guro Hospital between 2014 and 2019, and obtained diagnostic records including CBCT images. Inclusion criteria were as follows.
(1)
Patients without defects in the trabecular bone density measurement area.
(2)
Patients with no symptoms of temporomandibular disorder (TMD).
(3)
Patients without a history of bone diseases such as osteoporosis.
(4)
CBCT images having a quality suitable for research.
Table 1 showed the number of samples, mean age, and standard deviation. This study was approved by the Institutional Review Board (IRB) of Korea University Guro Hospital (no. 2019GR0189).
The CBCT equipment used in this study was PaX-Reve3D (Vatech Korea, Seoul, Korea), the tube voltage was 80 kV, the tube current was 3.3 mA, and the voxel size was 250 µm. Before the trabecular bone density measurement, the head position was reoriented with the Frankfort Horizontal plane (right and left orbitale, right portion).
The trabecular bone density was measured using the Hounsfield unit and trabecular microstructure parameters in the anterior basal bone beside the incisive foramen of the maxilla, the mandibular body; medial side of mental foramen, the mandibular condyle; center of medial and lateral pole; and the lateral mass of first cervical vertebra, at the right and left region, respectively (Figure 1).
The Invivo5 (Anatomage, San Jose, CA, USA) software was used for the Hounsfield unit measurement, and the CTan (Bruker micro-CT, Kontich, Belgium) software was used for the trabecular microstructure analysis (Figure 2).
Each region was evaluated in three-dimensions (3D) with a size of 4 × 4 × 4 mm3 cube. The trabecular microstructure parameters used in this study were described in Table 2.
The Wilcoxon signed-rank test was performed to determine whether there was a difference in the measured values of left and right of each region and a difference in the measured trabecular bone density for each region. The Mann-Whitney U test was used to identify differences in the measured trabecular bone density between genders. Spearman correlation was used to check the correlation coefficient between two measurement methods of the measured trabecular bone density. The SPSS software (ver 25.0; IBM Corp., Armonk, NY, USA) was used for all the analysis.

3. Results

3.1. Bone Mineral Density Measurement in the Right and Left Side and in Males and Females

The bone mineral density measurement of the left and right measurements for each region and the difference between the left and right side were obtained. The Wilcoxon signed-rank test showed no significant difference in left and right measurements of all the areas (Table 3).
In addition, the bone mineral density measurement and differences between males and females were measured. The Mann-Whitney U test showed that there was no significant difference between genders in the measured values of all the areas (Table 4).

3.2. Comparison between the Bone Mineral Density Parameters among Regions

3.2.1. Trabecular Thickness (Tb.th)

Results for the comparison among regions of the Tb.th values were shown in Table 5. The value at the anterior base of the maxilla was the highest among all regions and was statistically significant. The Tb.th value in the mandibular body was larger than in the first cervical vertebra, and was significantly higher than in the mandibular condyle. There was no statistically significant difference between the first cervical vertebra and the mandibular condyle.

3.2.2. Trabecular Number (Tb.n)

Results for the comparison among regions of the Tb.n values were shown in Table 5. The value at the anterior base of the maxilla was the highest among all regions. The value of the maxilla did not show a statistically significant difference from the mandible and the first cervical vertebra, but showed a significant difference from the mandibular condyle. There was no statistically significant difference between the mandibular body, the first cervical vertebra, and the mandibular condyle.

3.2.3. Trabecular Seperation (Tb.sp)

Results for the comparison among regions of the Tb.sp values were shown in Table 5. The value in the mandibular condyle was the highest among all regions. The value of the mandibular condyle did not show a statistically significant difference from the values of the first cervical vertebra, but showed significant differences from those of the mandibular body and the anterior base of the maxilla. Tb.sp in the first cervical vertebra was significantly greater than that in the anterior base of the maxilla. There was no statistically significant difference in Tb.sp between the mandible and the anterior base of the maxilla.

3.2.4. Bone Volume Fraction (BV/TV)

Results for the comparison among regions of the BV/TV values were shown in Table 5. The value at the anterior base of the maxilla was significantly higher than all the other regions. BV/TV in the mandibular body was significantly higher than in the first cervical vertebra and did not show a significant difference from the mandibular condyle. The measured values in the first cervical vertebra and the mandibular condyle showed no significant difference.

3.2.5. Hounsfield Unit (HU)

Results for the comparison among regions of the HU values were shown in Table 5. The value was highest in the order of the anterior base of the maxilla, the mandibular body, the mandibular condyle, and the first cervical vertebra.

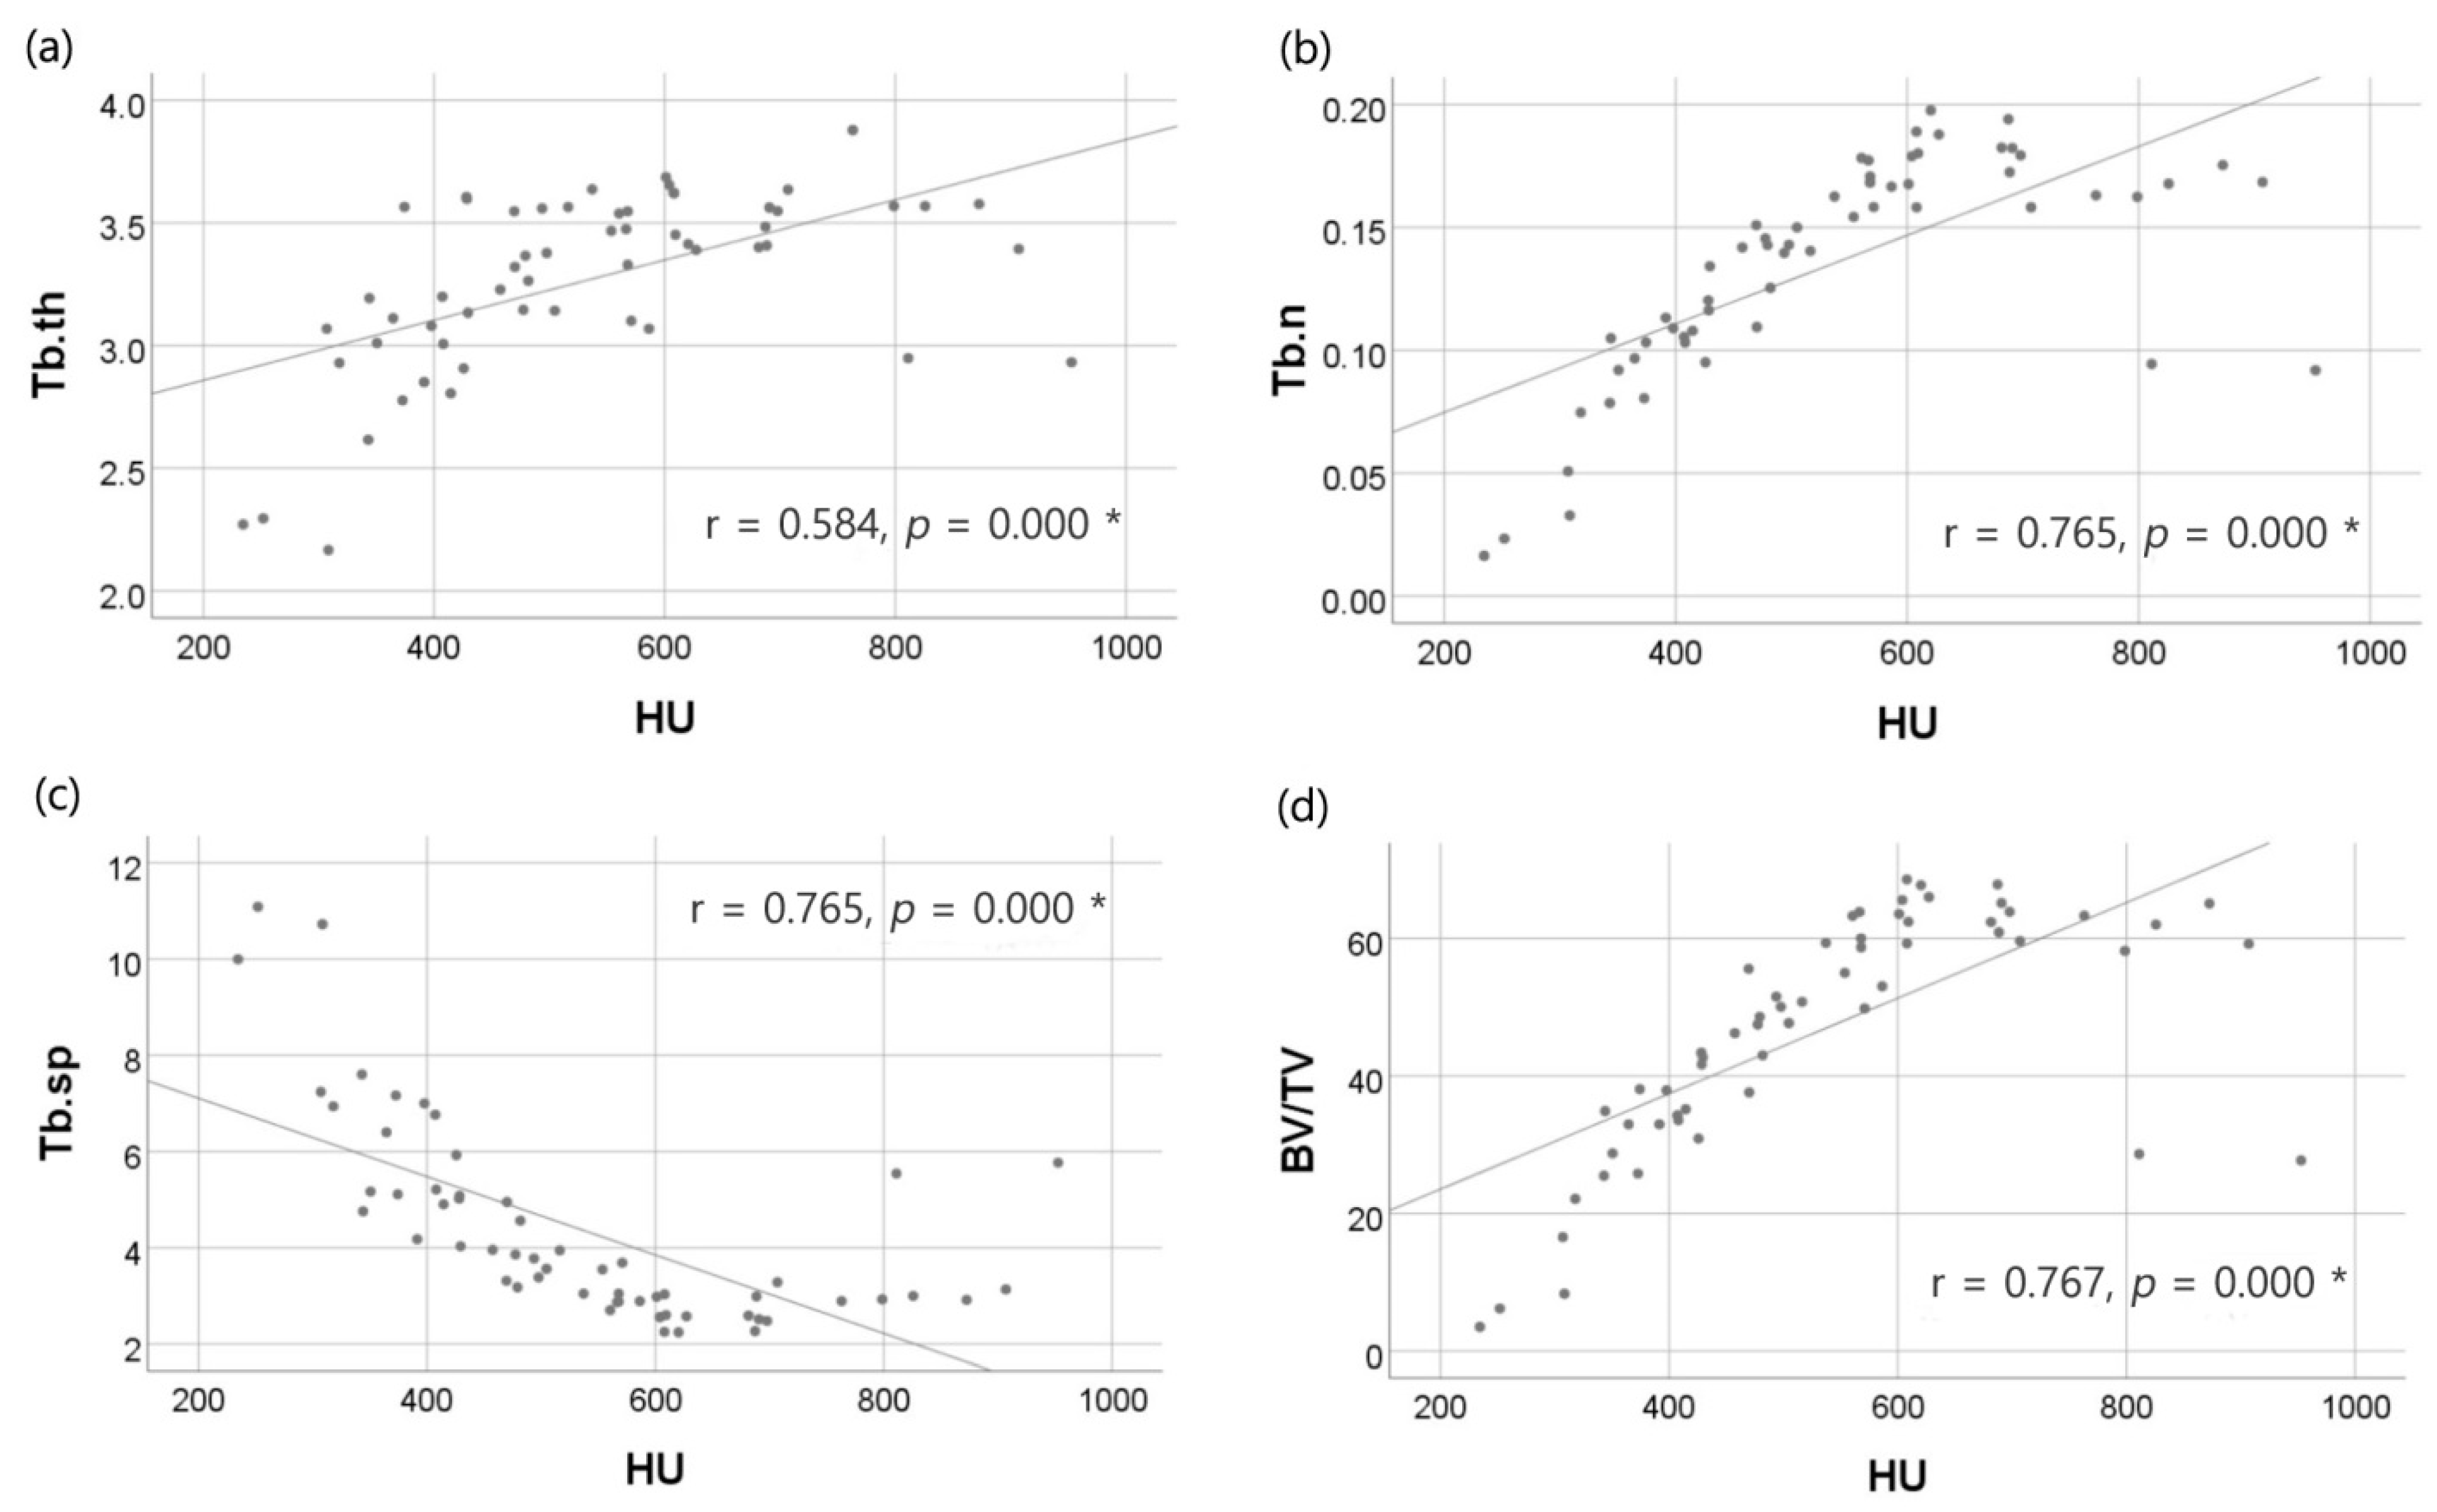
3.3. Comparison Between the Trabecular Bone Density Measurement Method Using the Hounsfield Unit and Trabecular Microstructure Parameters

Spearman correlation was used to find the correlation between two measurement methods (Figure 3). Correlation coefficients were obtained from trabecular microstructure parameters and Hounsfield unit values in the first cervical vertebra, which are known to have a similar accuracy to the general bone density. The Tb.th, Tb.n, and BV/TV of the trabecular pattern showed a significant positive correlation with the HU value, and the Tb.sp showed a significant negative correlation with the HU value.

4. Discussion

Since bone-related diseases such as osteoporosis increase the probability of the bone fracture, several methods have been proposed to accurately measure the trabecular bone density [9]. With regard to an orthodontic treatment, the trabecular bone density also affects the speed of the tooth movement. As the trabecular bone density increases, the rate of the tooth movement tends to decrease, which is associated with a greater resistance to the tooth movement in the mandibular molar [10]. As a result, the mandibular molar serves as a better anchor.
The cortical bone and the trabecular bone are divided based on the degree of porosity. The cortical bone has a porosity of 0–30%, whereas the trabecular bone has a porosity of 30–90% [11]. For this reason, in the cortical bone, the bone density can be represented to some extent by only the opacity of radiographs, but since the trabecular bone is a mixture of plate-like and columnar structures, it is difficult to accurately measure the density of the trabecular bone without considering three-dimensional structural characteristics [12,13].
In the past, two-dimensional methods such as histological analysis and serial sectioning methods have been used to measure the three-dimensional structure of bones. This not only shows the limitations of the two-dimensional structure, but also has the disadvantage of being more invasive since tissue specimens should be produced. However, the analysis using CT is not only non-destructive compared to the histological analysis, but also has the advantage of realizing a more accurate three-dimensional image at high resolution [14,15].
The Hounsfield unit defines the radiation density of distilled water as 0 HU and the radiation density of air as 1000 HU at a standard pressure and temperature, and determines the radiation density of the measurement object based on these two radiation densities. In this study, the effect of trabecular bone density according to age and gender was not significant in both the trabecular morphometry analysis and Hounsfield unit analysis. In the maxilla and mandible, males showed slightly higher Hounsfield unit than females, but were not statistically significant. Dutra et al. reported that bones that constantly undergo reconstruction were affected by the gender and dental condition [16]. Some previous studies reported that the bone density reduction in the mandible is apparent in women [17,18]. Pavlova and Peliakov reported that the difference between males and females was the delayed calcification in females, resulting in the less calcified bone [19]. However, Yong et al. reported that the difference between trabecular bones by age and gender was still controversial [20]. Klemetti et al. reported that the bone mineral density of the mandibular alveolar bone was influenced by the activity of the masticatory muscle than on the difference in gender [21]. In this study, it was judged that there was no difference according to the age or gender since the study subjects were relatively young patients undergoing an orthodontic treatment.
Misch reported that the mandible had a higher trabecular bone density than the maxilla, as a result of measuring the trabecular bone density based on Hounsfield unit measurements [4]. He also reported that bone densities tended to decrease from the anterior to posterior in both the maxillary and mandibular trabecular bones when analyzed by the Hounsfield unit. In this study, the Tb.th, BV/TV, and HU showed higher values in the anterior base of the maxilla than in the mandibular body. The reason why the value in the maxilla was higher than that in the mandible seems to be that the measurement region in the maxilla was located in the anterior position relative to the mandible, and the measurement of the maxilla was made in the basal bone. In previous studies, there have been studies that use CT to analyze the structure of the second cervical vertebra [22,23]. Montemurro et al. identified a new anatomical entity, named the Y-shaped trabecular structure of the odontoid process, on axial CT scans [23].
Tb.sp at the anterior base of the maxilla was the lowest among all regions in this study. Tb.sp is the average distance between trabeculae, and since it is related to the mean diameter of the cavities containing the bone marrow, not the bone, the low Tb.sp value tends to have a high trabecular bone density. The Hounsfield unit of this study was higher in the order of anterior base of the maxilla, mandibular body, mandibular condyle, and first cervical vertebra. In a medical CT, these scales are calibrated to express absolute values, but since the CBCT equipment may differ calibration, they are expressed as relative values rather than absolute values. If the imaging equipment is different or the settings are different, HU values may be different [24]. However, in this study, since the same region was measured with the same CBCT equipment and setting, the reliability of the comparison was secured even if the absolute value of HU was not measured. Among the trabecular microstructure parameters, bone volume fraction (BV/TV), a three-dimensional quantitative analysis, showed the most similar results to HU. When analyzing the structural characteristics of the trabecular bone, it is desirable to use Tb.th, Tb.n, Tb.sp, and it is considered that the method of BV/TV or HU is for the evaluation of the overall bone.
The limitation of this study was that the resolution of the used CBCT equipment was 250 µm, and some structural traits of the trabecular bone in the maxilla and mandible may be in fact below this threshold, so that cannot be completely measured [14]. If a higher-resolution CT is used, a more accurate three-dimensional structure of the trabecular bone and measurement of the Hounsfield unit will be possible. However, in that case, there is a disadvantage that more radiation doses are required than CBCT. The second was that the number of samples was small, so it is necessary to conduct the study with a large sample in the further research. Finally, this study was conducted on orthodontic patients, but the age distribution of orthodontic patients is often young and healthy, so the results may differ from those of elderly patients. Future studies on samples for various age groups and various systemic medical histories are needed. Koc, A. et al. reported that no significant difference was found when comparing the trabecular bone structures of edentulous patients and fully dentate patients [25]. In addition to age and gender, it may be necessary to control variables for other factors that may affect the trabecular bone density, such as the characteristics of skeletal patterns.

5. Conclusions

Both trabecular bone density measurement methods using the Hounsfield unit and trabecular microstructure patterns can be compared between regions in CBCT images. In addition, the measurement method using the Hounsfield unit showed a significant correlation with the method represented by trabecular microstructure parameters.

Author Contributions

Conceptualization, T.-H.K. and S.-K.J.; methodology, T.-H.K. and D.-Y.L.; software, T.-H.K.; validation, D.-Y.L. and S.-K.J.; formal analysis, S.-K.J.; investigation, T.-H.K.; resources, D.-Y.L.; data curation, T.-H.K. and S.-K.J.; writing—original draft preparation, T.-H.K., D.-Y.L. and S.-K.J.; writing—review and editing, T.-H.K., D.-Y.L. and S.-K.J.; visualization, D.-Y.L. and S.-K.J.; supervision, D.-Y.L.; project administration, S.-K.J. All authors have read and agreed to the published version of the manuscript.

Funding

This research received no external funding.

Institutional Review Board Statement

The study was conducted according to the guidelines of the Declaration of Helsinki, and approved by the Institutional Review Board of Korea University Guro Hospital (No. 2019GR0189).

Informed Consent Statement

Patient consent was waived because the x-ray image was taken for treatment use and there is no identifiable patient information.

Data Availability Statement

The data underlying this study will be available on reasonable request to the corresponding author.

Conflicts of Interest

The authors declare no conflict of interest.

References

  1. White, S.C.; Rudolph, D.J. Alterations of the trabecular pattern of the jaws in patients with osteoporosis. Oral Surg. Oral Med. Oral Pathol. Oral Radiol. Endod. 1999, 88, 628–635. [Google Scholar] [CrossRef]
  2. Roberts, W.E. Bone physiology, metabolism, and biomechanics in orthodontic practice. In Current Principles and Techniques, 4th ed.; Mosby: St. Louis, MO, USA, 2005. [Google Scholar]
  3. Silva, I.M.; Freitas, D.Q.; Ambrosano, G.M.; Boscolo, F.N.; Almeida, S.M. Bone density: Comparative evaluation of hounsfield units in multislice and cone-beam computed tomography. Braz. Oral Res 2012, 26, 550–556. [Google Scholar] [CrossRef] [PubMed]
  4. Misch, C.E.; Kircos, L.T. Diagnostic imaging and techniques. In Contemporary Implant Dentistry, 2nd ed.; Mosby: St Louis, MO, USA, 1999. [Google Scholar]
  5. Ibrahim, N.; Parsa, A.; Hassan, B.; van der Stelt, P.; Aartman, I.H.; Wismeijer, D. Accuracy of trabecular bone microstructural measurement at planned dental implant sites using cone-beam CT datasets. Clin. Oral Implant. Res. 2014, 25, 941–945. [Google Scholar] [CrossRef]
  6. Lee, M.-Y.; Park, J.-H.; Kim, S.-C.; Kang, K.-H.; Cho, J.-H.; Cho, J.-W.; Chang, N.Y.; Chae, J.M. Bone density effects on the success rate of orthodontic microimplants evaluated with cone-beam computed tomography. Am. J. Orthod. Dentofac. Orthop. 2016, 149, 217–224. [Google Scholar] [CrossRef]
  7. Hsu, J.T.; Chen, Y.J.; Ho, J.T.; Huang, H.L.; Wang, S.P.; Cheng, F.C.; Wu, J.; Tsai, M.T. A comparison of micro-CT and dental CT in assessing cortical bone morphology and trabecular bone microarchitecture. PLoS ONE 2014, 9, e107545. [Google Scholar] [CrossRef] [PubMed] [Green Version]
  8. Guerra, E.N.S.; Almeida, F.T.; Bezerra, F.V.; Figueiredo, P.; Silva, M.A.G.; De Luca Canto, G.; Pacheco-Pereira, C.; Leite, A.F. Capability of CBCT to identify patients with low bone mineral density: A systematic review. Dentomaxillofac. Radiol. 2017, 46, 20160475. [Google Scholar] [CrossRef]
  9. Genant, H.K.; Gordon, C.; Jiang, Y.; Lang, T.F.; Link, T.M.; Majumdar, S. Advanced imaging of bone macro and micro structure. Bone 1999, 25, 149–152. [Google Scholar] [CrossRef]
  10. Chugh, T.; Jain, A.K.; Jaiswal, R.K.; Mehrotra, P.; Mehrotra, R. Bone density and its importance in orthodontics. J. Oral Biol. Craniofac. Res. 2013, 3, 92–97. [Google Scholar] [CrossRef] [Green Version]
  11. Zioupos, P.; Cook, R.B.; Hutchinson, J.R. Some basic relationships between density values in cancellous and cortical bone. J. Biomech. 2008, 41, 1961–1968. [Google Scholar] [CrossRef]
  12. Ruijven, L.J.; Giesen, E.B.W.; Mulder, L.; Farella, M.; Eijden, T.M. The effect of bone loss on rod-like and plate-like trabeculae in the cancellous bone of the mandibular condyle. Bone 2005, 36, 1078–1085. [Google Scholar]
  13. Odgaard, A. Three-dimensional methods for quantification for cancellous bone architecture. Bone 1997, 20, 315–328. [Google Scholar] [CrossRef]
  14. Moon, H.-S.; Won, Y.-Y.; Kim, K.-D.; Ruprecht, A.; Kim, H.-J.; Kook, H.-K.; Chung, M.K. The three-dimensional microstructure of the trabecular bone in the mandible. Surg. Radiol. Anat. 2004, 26, 466–473. [Google Scholar] [CrossRef] [PubMed] [Green Version]
  15. Bouxsein, M.L.; Boyd, S.K.; Christiansen, B.A.; Guldberg, R.E.; Jepsen, K.J.; Muller, R. Guidelines for assessment of bone microstructure in rodents using micro–computed tomography. J. Bone Min. Res. 2010, 25, 1468–1486. [Google Scholar] [CrossRef] [PubMed]
  16. Dutra, V.; Yang, J.; Devlin, H.; Susin, C. Radiomorphometric indices and their relation to gender, age, and dental status. Oral Surg. Oral Med. Oral Pathol. Oral Radiol. Endod. 2005, 99, 479–484. [Google Scholar] [CrossRef] [PubMed]
  17. Ulm, C.W.; Kneissel, M.; Hahn, M.; Solar, P.; Matejka, M.; Donath, K. Characteristics of the cancellous bone of edentulous mandibles. Clin. Oral Implant. Res. 1997, 8, 125–130. [Google Scholar] [CrossRef]
  18. von Wowern, N. Bone mass of mandibles. In vitro and in vivo analyses. Dan. Med. Bull. 1986, 33, 23–44. [Google Scholar] [PubMed]
  19. Pavlova, M.N.; Peliakov, A.N. Age changes in the mineralization of the human femur according to quantitative microradiographic data. Arkhiv Anat. Gistol. Embriol. 1971, 61, 83–88. [Google Scholar]
  20. Yong, S.-J.; Lim, S.-K.; Huh, K.-B.; Park, B.-M.; Kim, N.-H. Bone mineral density of normal Korean adults. J. Korean Med. Assoc. 1988, 31, 1350–1358. [Google Scholar]
  21. Klemetti, E.; Vainio, P.; Kruger, H. Muscle strength and mineral densities in the mandible. Gerodontology 1994, 11, 76–79. [Google Scholar] [CrossRef]
  22. Perrini, P.; Gambacciani, C.; Martini, C.; Montemurro, N.; Lepori, P. Anterior cervical corpectomy for cervical spondylotic myelopathy: Reconstruction with expandable cylindrical cage versus iliac crest autograft. A retrospective study. Clin. Neurol. Neurosurg. 2015, 139, 258–263. [Google Scholar] [CrossRef]
  23. Montemurro, N.; Perrini, P.; Mangini, V.; Galli, M.; Papini, A. The Y-shaped trabecular bone structure in the odontoid process of the axis: A CT scan study in 54 healthy subjects and biomechanical considerations. J. Neurosurg. Spine 2019, 30, 1–8. [Google Scholar] [CrossRef] [PubMed]
  24. De Vos, W.; Casselman, J.; Swennen, G.R. Cone-beam computerized tomography (CBCT) imaging of the oral and maxillofacial region: A systematic review of the literature. Int J. Oral Maxillofac Surg. 2009, 38, 609–625. [Google Scholar] [CrossRef] [PubMed]
  25. Koc, A.; Kavut, I.; Ugur, M. Evaluation of trabecular bone microstructure of mandibular condyle in edentulous, unilateral edentulous and fully dentate patients using cone-beam computed tomography. Folia Morphol. 2020, 79, 829–834. [Google Scholar] [CrossRef] [PubMed] [Green Version]
Figure 1. Regions of trabecular bone density measurement (yellow square points): (a) Anterior basal bone beside the incisive foramen in maxilla (Mx); (b) body of mandible, medial side of mental foramen (Mn); (c) condyles of mandible, center of medial, and lateral pole (Co); (d) lateral mass of the first cervical vertebra (Cv).
Applsci 11 01028 g001
Figure 2. Two methods of trabecular bone density measurement: (a) Hounsfield unit, (b) trabecular bone microstructure parameters from reconstructed three-dimensional (3D) images.
Applsci 11 01028 g002
Figure 3. Correlations between the Hounsfield unit measurement and trabecular microstructure parameters: (a) Positive correlation between Hounsfield unit (HU) and trabecular thickness (Tb.th); (b) positive correlation between HU and trabecular number (Tb.n); (c) negative correlation between HU and trabecular seperation (Tb.sp); (d) positive correlation between HU and bone volume fraction (BV/TV). * p < 0.001.
Applsci 11 01028 g003
Table 1. Characteristics of the samples.
MaleFemaleTotal
Number of regions measured272192464
Number of patients342458
Mean age (SD)23.8 (6.5)19.5 (7.0)22.0 (7.0)
SD: Standard deviation.
Table 2. Description of trabecular microstructure parameters.
DescriptionUnit
Tb.thTrabecular thickness: Mean thickness of trabeculaemm
Tb.nTrabecular number: Measure of the average number of trabeculae per unit length1/mm
Tb.spTrabecular separation: Mean distance between trabeculaemm
BV/TVBone volume fraction: Ratio of the segmented bone volume to the total volume of the region of interest%
Table 3. Bone mineral density measurement in the right and left side and the differences between males and females.
Region RightLeftDifferencep-Value
MedianIQRMedianIQRMedianIQR
MxTb.th3.791.113.710.790.100.940.568
Tb.n0.140.040.140.030.000.030.298
Tb.sp3.570.823.520.85−0.020.810.640
BV/TV54.5210.2353.1011.810.499.340.502
HU1441.41332.271505.36268.68−74.48331.900.268
MnTb.th3.450.673.420.680.040.690.497
Tb.n0.140.060.140.070.020.100.572
Tb.sp3.621.173.710.91−0.080.980.354
BV/TV49.8613.2548.0311.851.7911.210.374
HU1401.38304.891416.11283.95−13.08290.250.248
CoTb.th3.170.513.240.43−0.060.580.349
Tb.n0.140.040.130.030.010.030.130
Tb.sp4.463.964.553.75−0.314.730.811
BV/TV48.0721.8344.5823.50−0.7533.200.868
HU653.02315.91715.49378.01−49.77383.400.402
CvTb.th3.220.603.350.47−0.140.650.201
Tb.n0.130.090.140.05−0.010.070.366
Tb.sp4.503.793.962.480.792.890.659
BV/TV43.8628.8149.2620.35−6.5125.540.383
HU511.09236.07575.71279.92−45.18235.750.186
IQR: Interquartile range; Tb.th: Trabecular thickness; Tb.n: Trabecular number; Tb.sp: Trabecular separation; BV/TV: Bone volume fraction; HU: Hounsfield unit; Mx: Anterial base of the maxilla; Mn: Mandibular body; Co: Mandibular condyle; Cv: First cervical vertebra.
Table 4. Bone mineral density measurement in males and females and the differences.
Region MaleFemaleDifferencep-Value
MedianIQRMedianIQRMedianIQR
MxTb.th3.920.903.710.59−0.210.310.647
Tb.n0.140.020.150.040.010.020.776
Tb.sp3.510.643.500.74−0.010.100.825
BV/TV54.3610.5854.209.80−0.160.780.991
HU1482.81269.651456.87213.89−25.9455.760.752
MnTb.th3.420.463.500.690.080.230.412
Tb.n0.140.040.140.060.000.020.328
Tb.sp3.680.943.750.870.070.070.290
BV/TV51.419.9747.0112.97−4.403.000.602
HU1441.03234.831346.83304.60−94.2069.770.097
CoTb.th3.190.303.230.390.040.090.468
Tb.n0.140.030.140.030.000.010.412
Tb.sp4.382.264.313.53−0.071.270.962
BV/TV45.6113.9549.6320.434.026.480.122
HU656.03253.57739.79343.8883.7690.310.067
CvTb.th3.230.483.370.430.140.050.190
Tb.n0.130.070.140.050.010.020.728
Tb.sp4.483.234.101.86−0.381.370.776
BV/TV45.9224.5252.5119.556.594.970.507
HU522.27232.53549.13255.9226.8623.390.764
IQR: Interquartile range; Tb.th: Trabecular thickness; Tb.n: Trabecular number; Tb.sp: Trabecular separation; BV/TV: Bone volume fraction; HU: Hounsfield unit; Mx: Anterial base of the maxilla; Mn: Mandibular body; C: Mandibular condyle; Cv: First cervical vertebra.
Table 5. Comparison of the bone mineral density parameters among regions.
MxMnCoCvp-Value
Median(IQR)Median(IQR)Median(IQR)Median(IQR)
Tb.th3.84(0.85) a3.49(0.53) b3.21(0.36) c3.25(0.50) bc0.025
Tb.n0.14(0.034) a0.14(0.05) ab0.13(0.03) b0.14(0.05) ab0.032
Tb.sp3.51(0.73) c3.74(1.05) bc4.51(3.21) a4.27(2.79) ab0.015
BV/TV53.42(9.78) a50.29(12.35) b47.50(16.72) bc46.58(24.06) c0.008
HU1458.69(227.17) a1414.19(265.78) b697.14(264.81) c540.51(226.40) d<0.001
IQR: Interquartile range; Tb.th: Trabecular thickness; Tb.n: Trabecular number; Tb.sp: Trabecular separation; BV/TV: Bone volume fraction; HU: Hounsfield unit; Mx: Anterial base of the maxilla; Mn: Mandibular body; Co: Mandibular condyle; Cv: First cervical vertebra. a,b,c,d The small caps indicates the statistically relation between sites. The same letters indicate non-significant difference between sites (p > 0.05).
Publisher’s Note: MDPI stays neutral with regard to jurisdictional claims in published maps and institutional affiliations.

