Review

Sensory Panel Performance Evaluation—Comprehensive Review of Practical Approaches

1
Department of Postharvest, Supply Chain, Commerce and Sensory Science, Institute of Food Science and Technology, Hungarian University of Agriculture and Life Sciences, 39-43 Villányi Street, 1118 Budapest, Hungary
2
Department of Refrigeration and Livestock Product Technology, Institute of Food Science and Technology, Hungarian University of Agriculture and Life Sciences, 43-45 Ménesi Street, 1118 Budapest, Hungary
*
Author to whom correspondence should be addressed.
Appl. Sci. 2021, 11(24), 11977; https://doi.org/10.3390/app112411977
Submission received: 5 November 2021 / Revised: 10 December 2021 / Accepted: 14 December 2021 / Published: 16 December 2021
(This article belongs to the Special Issue Advances in Food Sensory Sciences)

Abstract

:

Featured Application

Authors are encouraged to provide a concise description of the specific application or a potential application of the work. This section is not mandatory.

Abstract

Sensory assessors determine the result of sensory analysis; therefore, investigation of panel performance is inevitable to obtain well-established results. In the last few decades, numerous publications examine the performance of both panelists and panels. The initial point of any panelist measures are the applied selection methods, which are chosen according to the purpose (general suitability or product-specific skills). A practical overview is given on the available solutions, methods, protocols and software relating to all major panelist and panel measure indices (agreement, discrimination, repeatability, reproducibility and scale usage), with special focus on the utilized statistical methods. The novel approach of the presented methods is multi-faceted, concerning time factor (measuring performance at a given moment or over a period), the level of integration in the sensory testing procedure and the target of the measurements (panelist versus panel). The present paper supports the choice of the performance parameter and its related statistical procedure. Available software platforms, their accessibility (open-source status) and their functions are thoroughly analyzed concerning panelist or whole panel evaluation. The applied sensory test method strongly defines the applicable performance evaluation tools; therefore, these aspects are also discussed. A special field is related to proficiency testing. With the focus on special activities (product competitions, expert panels, food and horticultural goods), practical examples are given. In our research, special attention was given to sensory activity in companies and product experts or product-specific panels. Emerging future trends in this field will involve meta-analyses, application of AI and integration of psychophysics.

Graphical Abstract

1. Introduction

Sensory evaluation is a science that measures, analyzes and interprets the reactions of people to products as perceived by the senses [1]. A fundamental pillar of international sensory testing practice is the application of Good Sensory Practices (GSP), which cover a number of elements: sensory testing environment, test protocol considerations, experimental design, panelist considerations, etc. [2]. Sensory assessors work as a panel, which is managed by a panel leader who is responsible for the general monitoring of the panel and for their training [3]. In case of home care or food products, which require more complex preparation, the assessments may take place at the panelists’ homes rather than a company site. This panel might be referred to as a home panel. The remote sensory testing, might be a reliable alternative in pandemic situations if all critical principles follow the guidelines of good practices. This protocol is equally suitable for both trained panelists and consumers even beyond the global pandemic (COVID-19) [4]. Food science was the first area to use sensory methods extensively, especially in the fields of new product development, product specifications, shelf-life studies and sensory quality control. Following this trend, these methods have spread widely to other products that have dominant attributes perceived by the senses. Cosmetic ingredients are developed for their technical functions, but also for specific sensory targets [5]. Sensory assessments can involve some home and personal care products or products, which cause excess sensory fatigue [6].
Sensory assessment can be performed by several types of assessors: sensory assessors, selected assessors and expert sensory assessors. Sensory assessors are any people taking part in a sensory test and can be “naive assessors” who do not have to meet any precise criteria, or initiated assessors who have already participated in sensory tests [7]. Selected assessors are chosen for their ability to perform a sensory test. Expert sensory assessors are selected assessors with a demonstrated sensory sensitivity and with considerable training and experience in sensory testing, who are able to make consistent and repeatable sensory assessments of various products. Performance of these assessors should be monitored regularly to ensure that the criteria by which they were initially selected continue to be met [8,9]. The selection and training methods to be employed depend on the tasks to intend for the selected assessors and expert sensory assessors [3]. In the present paper we focus on these assessor types. “Three of the main structural areas for panel performance systems are: time period (performance at one point in time versus monitoring trends over time), intra- or extra project work (as part of normal panel work versus specific performance test sessions) and target (for individual panelists versus the whole panel)” [6]. Expert assessors have a considerable practical sensory testing experience in the related fields. It does not mean that their sensory acuity should not be measured or monitored, but the emphasis is on their product-specific knowledge, which makes them very effective in training product-specific sensory panels.
The sensory analysis panel constitutes a true measuring instrument [3] in the sense that it utilizes human perceptions as instrumental measures to quantify the sensory features of products [8]. Many instrumental methods have been developed to determine the textural properties of food, for example, with emphasis on the method which imitates human perception (e.g., the Texture Profile Analysis) [10,11]. However, only humans are able to deliver comprehensive sensory testing results, because of how they can combine sensory impressions in their brains and draw on past experiences [12]. Human sensory analysis can now be supported by technology-based chemical sensor arrays, these techniques are already proven in case of food and beverage production line testing system.
There are generally accepted terms, techniques and organizations, which are specific to the given type of food or beverage in case of product-specific tests. The wine, beer, coffee, tea and spirit industries have strong traditions in creating schemes for selecting, training and monitoring the assessors. The structure of the training programs is often as follows: major elements of sensory perception, most important standardized test methods and finally a large number of product-specific tests in order to learn the diversity of the evaluated product and the descriptive terminology [8,9,13].
There are several requirements toward the performance indices of panelists. Specifically, assessors should use the scale correctly (location and range); score the same product consistently in different replicates (reliability/repeatability); agreement with the panel in attribute intensity evaluation (validity/consistency); discrimination among samples (sensitivity) [14].
In the present paper, we aimed for a comparison of the panel performance protocols, although the numbers of such frameworks are dynamically changing. In product competitions and quality evaluations in an industrial environment, the agreement among panelists is crucial. This parameter can be improved if assessors are regularly trained (refreshment courses) and evaluated, not only the day before the evaluation takes place. This way the panel manager will have an access to the trends, changes in the panel performance measures and will be able to provide individual help and support to the panelists. One should be aware of the fact that the individual differences in sensory perceptions will remain even after thorough training, since these are based on biological structures. Based on our literature review we provide some relevant insights and practical implications for the sensory oriented researchers. There is also a growing demand from the part of both researchers and practitioners to have an overview of the available methods, especially from the point of statistical issues and software relations. In the present paper, a complex and novel overview is provided, which might help the audience in selecting the protocol they apply during their studies.

2. Materials and Methods

Literature search was based on the main criteria that papers should focus on the topic of panelist or panel performance and should not be published earlier than 1990. Keywords included “panel performance”, “panelist performance” and “panel monitoring”, “statistical method” and “food”. Articles were accessed through Web of Science, Scopus, ScienceDirect and Google Scholar. Only those studies were utilized creating the present paper, which were available in English in their full extent. Only those articles, were considered which gave a thorough analysis of a given panel performance method concerning its feasibility during routine sensory protocols. Conference proceedings and conference websites were also screened, especially for the following events: Sensometrics Conference, Pangborn Sensory Science Symposium, Symposium and European Conference on Sensory and Consumer Research (EuroSense). International standards, especially ISO documents were also involved, since these are intensively applied by the researchers and sensory practitioners. Textbooks and independent organizations’ publications were also included (European Sensory Network (ESN), European Sensory Science Society (E3S), Society of Sensory Professionals (SSP), Sensometric Society (SS)).

3. Panelist Selection, Monitoring and Product-Specific Tests

The initial point of establishing any panel performance measuring system is the selection of appropriate panelists [8]. For this purpose, several international standards are available, primarily focusing on the color vision (ISO 11037), taste perception (ISO 3972) and odor sensitivity (ISO 5496). Since panelists change with time, one should pay attention to provide a sufficient pool of backup or additional individuals, who might take the place of those who are unable to participate in a session or who leave the organization. The ISO guideline [3] gives a rough estimate that in order to provide 10 panelists for each session, one should recruit 40 candidates and select 20 panelists. Although the ratio of these values may be well experienced by practicing panel leaders, in industrial environments these numbers often raise the mind-set that it is impossible to reach as many people in regular sensory activity. It is recommended to be aware of the fact that usually ISO standards are initiated and published to be applied primarily at large companies. However, small and medium enterprises (SMEs) need a helping hand in this field [15]. It is also necessary to clarify that panel selection procedures and panel performance protocols are different tools related to the same object. Panel selection is a set of standard methods, which helps the panel leader to identify those candidates who perform better than others. Once the panel election procedure has been completed, other issues such as the performance monitoring of the individual panelists and the panel during their regular activities have to be dealt with. In a recent review, the authors found that only 20% of the analyzed papers applied at least one tool to measure their panel performance [16].
Working with a trained panel is usually a time consuming and much detailed procedure, thus one should see clearly the goal of setting up this framework. The first type of application is the field of research and development (R&D), when decision makers need reliable and detailed information on the changes, which took place in the product due to the improvements made [17]. In this case, panel leaders and decision makers need to negotiate the critical points, since quite often decision makers are primarily interested in the question ‘Which is the best?’, and that type of question cannot be answered by trained assessors. Even in those situations, it is possible to find such critical product attributes, which can be measured with a trained panel, and provide an indirect answer to the above-mentioned question. Finally, it is essential to perform a consumer test before the new product is released to the market, in order to validate the expected results of the development [18]. However, the issue of consumer panels is not the focus of this paper.
Panel size is often discussed in research papers [19], and in company guidelines. In this negotiation, all stakeholders have their interest and preferences. Statisticians who focus their attention to the descriptive parameters of the data set (normality, variation, etc.) often prefer even slightly larger panels. Company QC managers and plant managers, however, face difficulties when recruiting panelists, and they might be satisfied with a smaller number of participants. Especially if the case is a routine QC test, which is performed for three shifts daily, it is practically impossible to have 10 panelists at each session. However, there are valuable resources which are also available at this field [15]. Researchers often face the difficulty that the sensory tests are usually only a part of a larger project, and in the publications, reviewers and editors prefer those studies which at least have repetition (similarly to the instrumental tests). In the case of a project, when a scientific paper is a required outcome, one should consider both the applied ISO standard’s requirements and the typical studies accepted in this field or journal.
An important issue is the application of experts [20]. Some papers give the impression to the readers that such individuals who work at a university department for a long time are also called experts. This might be true when referring to their field of research, but to be a sensory expert requires a demonstrated sensitivity and the ability to perceive product attributes and describe samples. In several cases, the label ‘expert’ is applied to balance the relatively low number of sensory panelists. An expert panelist can be a product expert (typical company panelist, who is very familiar with the product) or a method expert (who is frequently involved in sensory-method-specific tests). Another critical point is the type of questions answered by expert tests. The reader might be sadly too familiar with the phenomenon that a small panel of expert panelists is measuring attributes, e.g., appearance, odor, texture, etc. but they use a hedonic type of scale.
There is a noticeable dominance of applying expert panelists in some fields of food and beverage technology. These are usually products with a high hedonic value, thus requiring rigorous measurements and grading the sensory attributes of the products. Due to the long history of systematic sensory testing, these products have a specific sensory language, usually summarized in the form of flavor wheels. These complex classification systems of descriptors require well-established training programs for those specific food and beverage types.
In case of these product-specific tests there are relevant and generally accepted terms, techniques and organizations which are specific to the given type of food or beverage. In particular, the wine, beer and spirits industries have strong traditions in creating schemes for selecting, training and monitoring the assessors. In the wine sector, the International Organization of Vine and Wine (OIV) is one of the major bodies of providing guidelines for those who organize wine competitions. It is a general observation that product competitions have a higher importance in the mind of the general sensory practitioners than the routine, QC type of test, or even the R&D sessions. OIV created a freely accessible sensory guide, which is strongly based on the ISO documents listed in the reference section. One of the recommendations is the pre-testing of wine panelists with the triangle test [21]. Participants receive three samples, where two samples are identical, and the third is different. The magnitude of the difference is usually low in order to test the perception and the practical experience of the tasters.
The beer industries use different guidelines, depending on their size and structure. Large breweries very often utilize the protocols of the European Brewery Convention (EBC). The Analytica EBC is a series of manuals, which describe a part of the beer QC system, in order to help stakeholders to better identify the critical points and aspects of a given part of brewing. To be a member of EBC is a voluntary decision, and Analytica guides can be purchased by anyone, not only EBC members. Currently, there are 15 documents available at the sensory section, and only one deals with the selection and training of assessors. Many documents were published more than twenty years ago; this might refer to the fact, that large breweries also utilize ISO or ASTM standards beside EBC guides, thus this community is not overly motivated to develop and update these guidelines.
Another beer-related scheme is the Beer Judge Certification Program (BJCP), which was founded in the USA in 1985. Their assessor training and evaluation program is mainly focusing on the knowledge of beer styles and the description of samples. One part of the protocol is the detection of possible faults in beers. Generally, there are a list of negative (faulty) descriptors on the scoresheet, which should be marked according to the problems detected. However, some experts argue that this technique might trigger an attitude in the panelists looking for faults. If a taster is well-trained, they will be able to find alterations from the target without these lists.
Coffee and tea have also a rich history in evaluating cup quality. This system was primarily related to the trade procedures, when a relatively small panel of experts investigated the sensory characteristics of the batches in order to categorize them. In many countries, there are special quality grades which might be assigned to a batch if the desirable attributes are in the pre-determined range. Usually for these special classes a simplified sensory profile is created. For the general quality classes, tasters use a category scale, where the highest values represent excellent quality and the lower the value is the less distinguished the quality of the batch. Trained panelists and experts in the field of coffee evaluation are called cuppers. Similarly, to the beer program, the coffee cuppers are also evaluated, for example, by the assignment of the Q-grader test. Q-grader means that a person has the formal training and the possibility to evaluate individual batches to the described quality categories (for example by the Specialty Coffee Association of America, SCAA). To achieve the status of a Q-grader, one has to pass a large number of practical exams (at the time of this article that means 22 exams). The logical structure of these training programs is usually the same: major elements of sensory perception, most important standardized test methods and finally a very large number of product-specific tests in order to learn the diversity of the evaluated product and the descriptive terminology.
In industrial practice, the use of specific sensory panels is common for some product categories. For these, it is observed that there are guidelines, company specifications, standards for testing protocols, which cover the sensory testing environment, specific vessel, sample presentation, etc. Several publications have been published, for example, on the testing of olive oil, honey and protected designation of origin (PDO) expert panels [22,23,24,25,26,27,28,29].
Reliance on the same subjects for all testing is not recommended. Such a practice will create a variety of problems including elitism. Instead, a pool of qualified subjects should be developed [30]. This practice can show that by learning how to taste for example wines, even novices can come to appreciate better and more interesting wines. It is the interplay between tasting and knowing that leads to refined discrimination and a better understanding of the wine [31].
Although food and beverages are the primary fields where sophisticated sensory methods are applied and the panel performance is taken into consideration, there are other fields which also require this approach. In horticultural and postharvest sciences, varieties are evaluated in a multi-perspective way. Breeders, growers and traders have different priorities, and quite often the sensory quality of the grown goods is not prioritized. However, there are a number of references where the sensory evaluation was performed in a standardized manner in order to acquire reliable and reproducible data sets. Csambalik and co-workers have evaluated cherry tomato landrace samples, with the application of sensory profile analysis [32]. In another study, disease-resistant apple varieties were characterized, in order to better understand the sensory quality of these apple types, which were originally intended to be used for processing only [33]. During the farming experiments, researchers have noticed that in beneficial climatic conditions these apples might be also suitable for fresh consumption, especially in those consumer segments which prefer acidic apple types. For the characterization of these varieties the sensory profile analysis was used, where the performance of the panelists is a major issue. In horticultural studies, the variance of the sensory data may result from the biological heterogeneity of the sample batches. Bavay and co-workers have investigated this effect in the case of apples [34]. Results have shown that the differences from one sample batch to the other were more dominant than the assessors’ differences. For the evaluation of these effects, a mixed ANOVA model was used [13]. Especially in those cases when the sensory data is parallel used with instrumental measures [35], the sensory panel should be evaluated with standardized methods. In another study, gene bank ascensions of basil (Ocimum basilicum L.) were investigated with sensory profiling and GC-MS evaluation [36]. This joint research has facilitated the joint analysis of sensory and chemical data to find possible correlations among the two matrixes. A similar approach was used for the characterization of bee pollens [37], where sensory analysis, electronic nose, electronic tongue and NIR (Near Infrared Spectroscopy) were applied. In another study, the authors have created a sensory lexicon for fresh and dried mushroom samples [38]. During the evaluation, a highly trained panel was utilized to identify and collect the relevant sensory terms, since panel performance strongly influences the quality of sensory data [39].
From the previous section, it seems evident that in product-specific testing systems there are at least two factors related to the efficiency of the sensory program. The first and most definitive factor is the inherited ability of the individual to perceive and analyze sensory stimuli. The second aspect is the practical experience which is gained through a longer time period of regular product testing. In an ideal case, both components are present; in other situations, one can be more dominant than the other. Quite often, these product-specific experts perform detailed tests to investigate how much samples derivate from the ‘ideal’ or from the ‘true to type’ product.
From that point, it is clear that in product-specific training programs, the performance of the panelists is rather evaluated by their ability to describe and identify product types, styles and batch qualities. In a product-specific relation such as coffee, the different methods applied for the description of samples usually follow some pre-determined evaluation systems [40]. It does not mean that their performance cannot be measured by more rigid and statistical evaluation methods. It simply reflects the fact that in practical product evaluation, the importance of product characterization and defect identification is much more relevant than standardized measure indices (e.g., repeatability, consistency, accuracy). The commercially available sensory kits for the characterization of food and beverage products also reflect this attitude. Some of these kits are based on scent samples, preserved in small glass vials. The number of these scent reference samples might be smaller for the simpler or the more focused product range, and can be relatively high for more general product families. In case of aroma samples, the Le Nez du Vin master kit contains 54 samples for wines and for whiskies, whereas the most complex kit available for coffee is made up of 36 odors.
Each reference material is accompanied by a material safety data sheet, instructions for use and technical specifications. Mandatory parts of the safety data sheet include: product and company, composition/ingredient information, hazard identification, first aid, fire protection measures, measures for accidental release, handling and storage, exposure controls/personal protection, physical and chemical properties, stability and reactivity, toxicological information, environmental information, waste management considerations, transport information, regulatory information and other information. The instructions for use show, step by step, how to use the aroma flavorings. Flavorings (powder) are stored in blister capsules for flavor protection and increased shelf life. Each box contains 5–10 capsules. Flavor standards (AROXA™) are contained in these small capsules. Aroma cards contain the technical specification that presents the most important information for sensory detection and testing: the best way to test, amount of aroma per capsule, detection threshold, origin of aroma formation, importance of organoleptic property, CAS (Chemical Abstracts Service) registry number, additional names, comments, threshold distribution and number of capsules in the box [6].

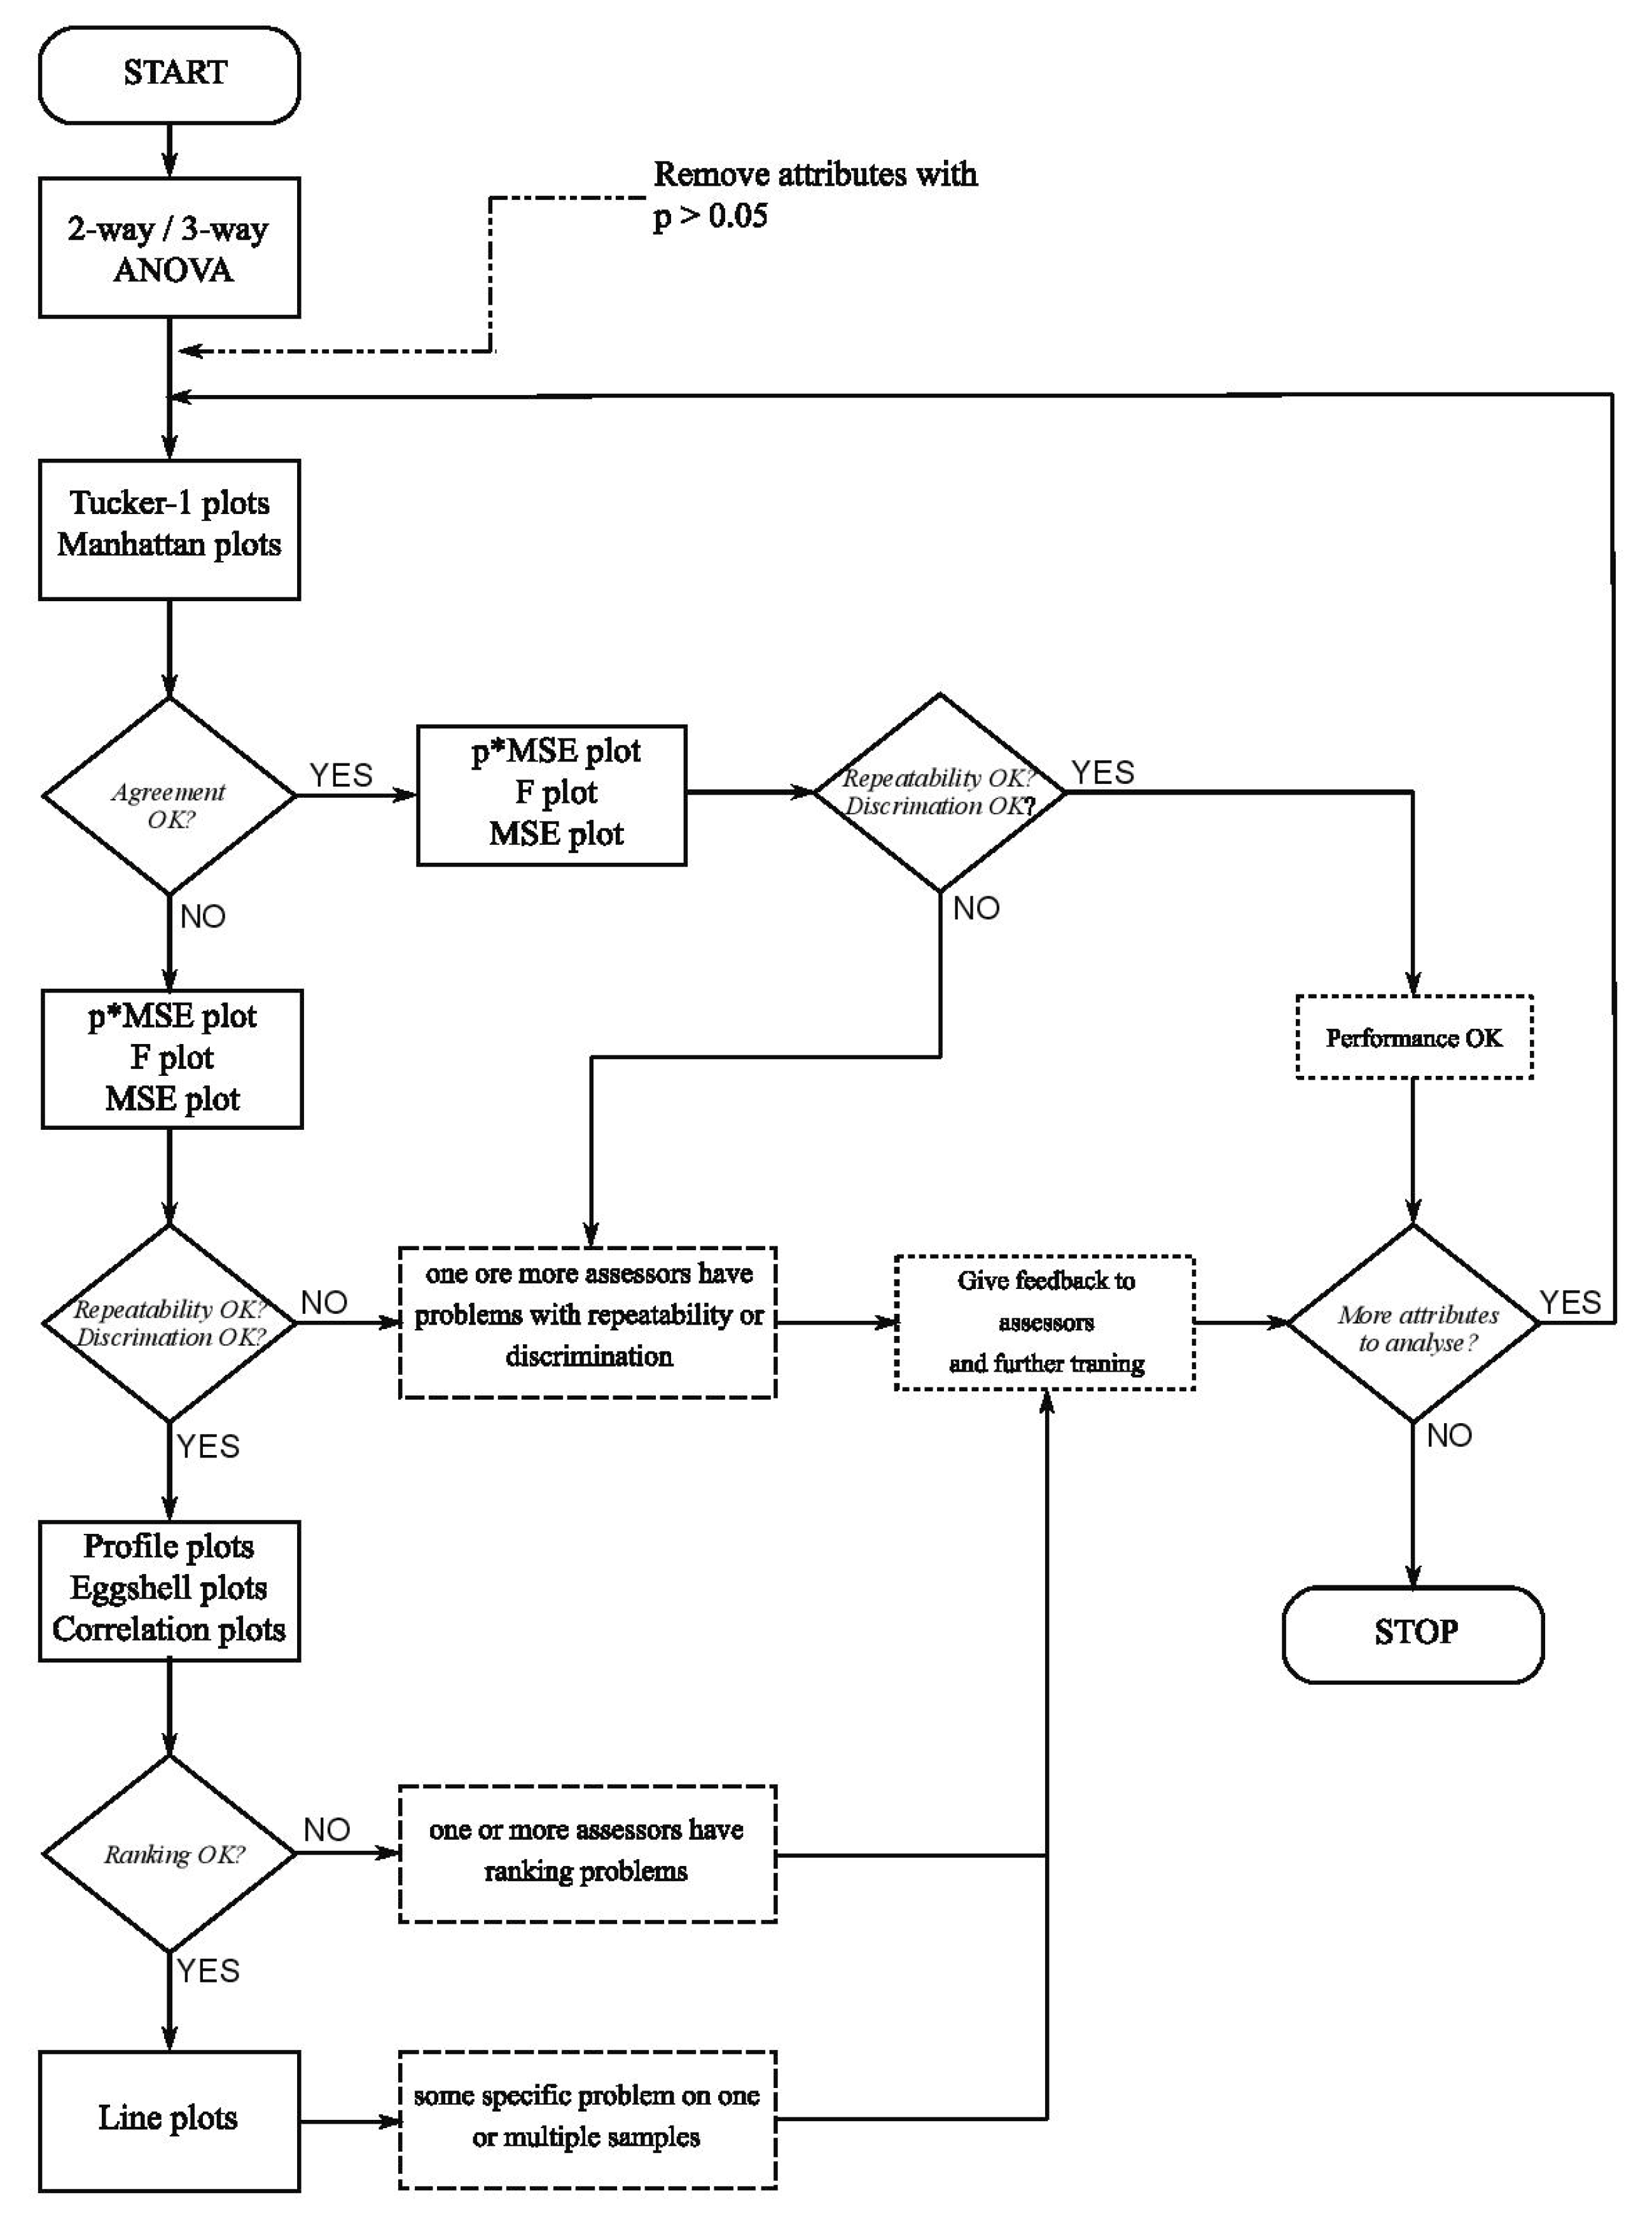
4. Methods, Models and Frameworks in Sensory Panel Evaluation

4.1. Classification of Panel Performance Tools according to Sensory Method Types

Panel performance evaluation approaches might vary depending on the type of sensory tests applied by the assessors. It can be a critical and controversial point in methodology, since the most detailed measuring systems were created for descriptive analysis methods, such as sensory profile or quantitative descriptive analysis (QDA) [41]. However, in industrial laboratories and in product competitions several other types of test methods are performed. For these methods, in some cases, the relevant international standards provide guidance through some practical examples and with a list of further references. It is notable that the ISO subcommittee for sensory analysis decided to create a working document (and later on hopefully a new ISO standard) for panel performance measurement, especially for those methods which are different from the traditional descriptive analysis. In the following sections, the authors go through the major types of sensory test methods, and the possible panel performance measuring tools.
Difference tests seem to be rather easy and suitable methods for panelist evaluation, since due to the basic idea of difference testing in most cases there is a good (valid) and a wrong (invalid) answer. However, even these simply constructed procedures might be challenging to the practitioner if all relevant criteria should be met [42]. One of the standards is fully dedicated to the statistical analysis of the responses and their graphical representation [43]. The sequential analysis is a systematic procedure of plotting the panelists’ correct responses versus the number of total tests performed. The idea of this approach is to create a graphical representation of the statistical truth behind the test outcome analysis [8]. If the laboratory is computerized, the panel leader is able to monitor the responses online, and has the possibility to end the test session (if a large number of good response are collected), or can decide to continue the session for a longer time. In case of triangle tests, the major focus is usually on the general outcome of the test (are the samples significantly different or not), but in some cases the individual performance is also measured.
For almost all difference tests, the international standards (ISO) specify those procedures as suitable methods for panelist selection and panelist training. This recommendation is usually found in the scope section. These test methods are the following: ‘A’—Not ‘A’ test, duo-trio test, triangle test, tetrad test, 2 out of 5 test and paired comparison test. Some of these methods are harmonized at a national level, e.g., the tetrad test is just a sub-section of ISO 6658, but a whole ASTM is dedicated to the description of it.
Ranking tests are based on the relatively simple task to create an order among samples based on a single attribute. The complexity and difficulty of these tests comes from the relative similarity of the test samples (e.g., product re-formulation studies, sweetener replacement project, etc.). Panel leaders might apply ranking tests in order to test the ability of panelist to re-create a known order of the samples. If one sensory parameter (e.g., the amount of the applied sweetener) is given as an experimental factor, the panel leader will be able to present each panelist with a randomized sample set, and assessors will have to arrange those samples in the right order. Statistically, in this case the Page test is recommended, which measures the similarity of the rank order given by the panelists and the expected rank order. Page test results will give an insight into the overall performance of the panel at the pre-determined significance level. In this case, first the rank sums of the samples are calculated. Thereafter, each rank sum is multiplied with that value, where the sample is positioned in the theoretical order. Therefore, the sample, which is in 1st place in the theoretical order, is multiplied with 1; the sample which is in 2nd place is multiplied with 2, and so on. The formula of the Page test is as follows:
L = R 1 + 2 R 2 + 3 R 3 + + k R k
where L is the value of the Page test, Rk is the rank sum of the kth sample. The calculated L value is compared with a critical value and on the basis of this comparison a decision is made, whether the rank order given by the panel is statistically different from the theoretical or not. For those cases where no tabulated critical values are available, a further formula should be applied. This is especially useful for larger panels, since most statistical tables for the Page test provide critical values for a maximum of 20 panelists. The formula of Page test for non-tabulated cases is as follows:
L = 12 L 3 j p ( p + 1 ) 2 p ( p + 1 ) j ( p 1 )
where L is the calculated value of the Page test, j is the number of assessors and p is the number of samples. The current edition of the relevant standard [22] does not include any further analysis for pairwise significant differences among the samples. Some other platforms (e.g., sensory specialized statistical software) offer a suitable tool for the investigation of that type of differences [23]. If the individual panelists are evaluated, Spearman’s rank correlation coefficient shall be calculated:
r s = 1 6 i d i 2 p ( p 2 1 )
where p is the number of samples, d is the rank number differences/actual rank number—theoretical rank number. In cases where Spearman’s rank correlation value is close to one, this means that the order of the samples assigned by the panelist is near to the theoretical order. On the other hand, if this value is close to the −1 value, the panelist’s evaluation is strongly different from the expected order.
Descriptive tests are the prime example for applying panelist and panel performance methods. This approach is usually applied for R&D or scientific purposes, which initiates the necessity of measuring acuity and reproducibility. Profile analysis is described by several international standards, and these involve references to panel performance parameters [3,44,45]. Since descriptive tests are the most frequent types of analysis in sensory research, the related panelist and panel performance methods are abundant. These will be discussed at length at the following sections [3,44,45].

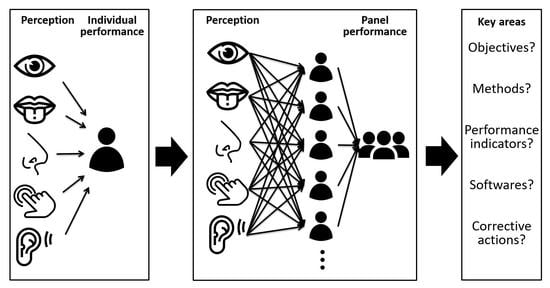
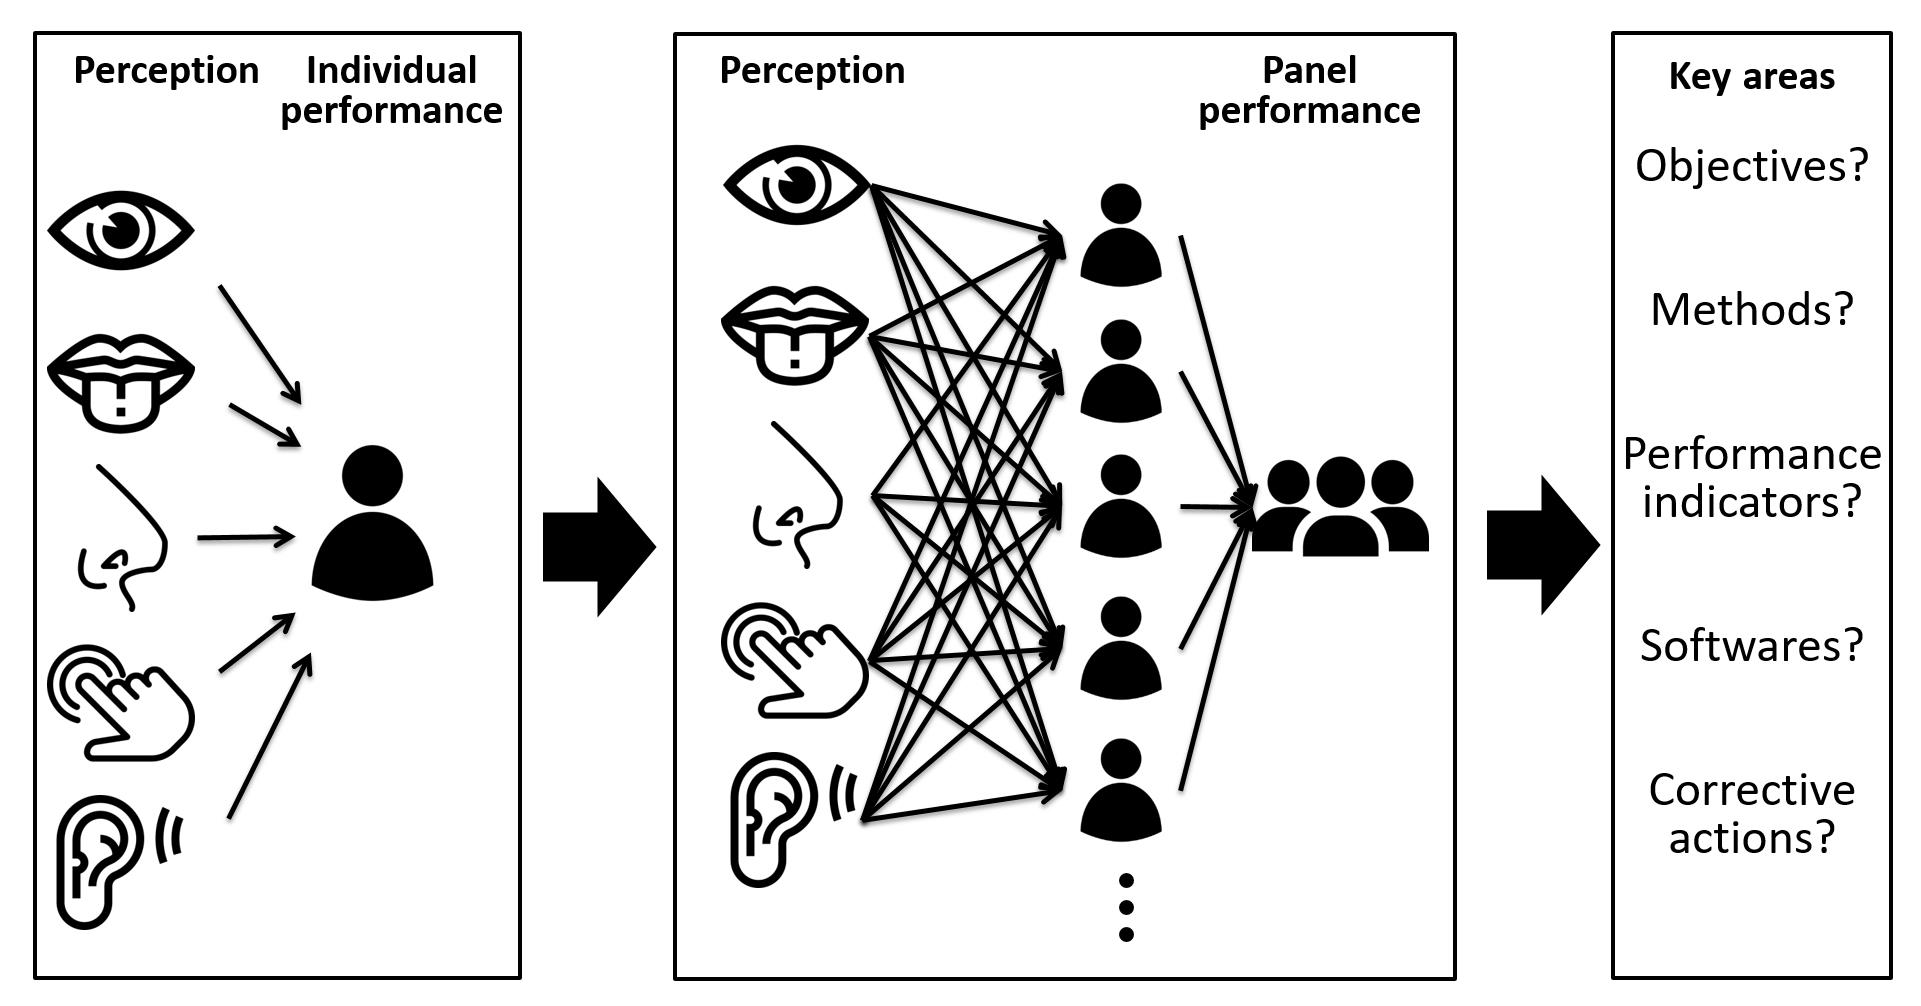
4.2. Indicators and Effects of Individual Assessor and Panel Performance

There are three classic performance indicators for individual assessors and for the panel: discrimination, agreement and repeatability. The reproducibility indicator is added to the panel performance standard [44]:
Discrimination of an assessor/panel: ability of the assessor/panel to exhibit significant differences among products, (assessor: ANOVA one fixed factor (product); panel: ANOVA two fixed factors (product, assessors) and interaction).
Agreement of an assessor/panel: agreement ability of different panels or assessors to exhibit the same product differences when assigning scores on a given attribute to the same set of products, (assessor: distance and correlation to panel median; panel: significant difference among assessors).
Repeatability of an assessor: the degree of homogeneity between replicated assessments of the same product. Repeatability of a panel: the agreement in assessments of the same set of products under similar test conditions by the same assessors at different time points (assessor: ANOVA one fixed factor (product); panel: ANOVA two fixed factors (product, assessors) + interaction).
Reproducibility of the panel: the agreement in assessments of the same set of products under similar test conditions by different assessors (panel) at different time points (between-sessions in three-way ANOVA).
Discrimination is, in fact, the ability to distinguish between products, and is, therefore, usually characterized by discriminatory and/or separating ability. Non-conform discrimination is possible due to the use of inappropriate assessor selection methods, sensory fatigue or inadequate sensory memory or concentration. The repeatability of an assessor/panel shows to what extent an assessor/panel is able to perform the same assessment to the same product at another test session. Measurements of repeatability of the assessors are typically performed on two consecutive days, but it is also feasible to implement those tests on the same date with two sessions. Repeatability is affected by the altered sensitivity, the adapted cognitive processing of sensory stimuli, the mental conditions, the health status, the motivation, and the different test dates. If an assessor/panel does not have sufficient repeatability, targeted training is necessary or the result should be excluded from further evaluations. Inadequate repeatability can be influenced by several factors: firstly, from the natural heterogeneity of the samples (shape, size, color of vegetables and fruits); secondly, from the applied processing technology (position of the baked goods on the baking tray, salting homogeneity of French fries, the composition of complex meat products, etc.); third, they result from the differences in the preparation and presentation of the sensory test samples. It is recommended that one person should always prepare sensory test samples for better homogeneity. The reproducibility of the panels is determined by the sensory abilities of the members, their proficiency in the test method and their knowledge of the product and its intensities [13,44,46].
All performance characteristics can be affected by different scale usage, which can result in distorting effects. Based on the patterns of the scale evaluation, level effect, range effect and variability effect are distinguished (Figure 1).
The level effect shows the location of the average points on the intensity scale, the range effect is the exact variance and the variability effect is characterized by the extent of the values. The reasons for the different use of the scale are worth exploring because this allows the panel leader to define individualized tests, thus improving the reliability of the assessor and the entire panel. Correcting differences in scale use reduces the interaction effect [13,14]. During sensory evaluations, differences in the range, standard deviation and mean of the points are due to the different use of the scale (level, range, variability). In general, scale effects are usually solved in practice by product-specific training of the assessors. In particular, the scale anchoring method is used with reference samples and/or reference materials, to calibrate the panel with appropriate reference standards. It is appropriate to use an unstructured scale with values fixed at both ends [47,48].
Selected and expert sensory assessors are able to make consistent and repeatable assessments of various products, thus an appropriate sensory panel will provide results that are accurate, discriminating and precise. Ideal group performance can be achieved if the products are differentiated by each assessor (large between product variability) and the same results are obtained several times (small within-assessor variability). However, there should be agreement between assessors regarding the sensory property within a given tolerance (small between assessor variability). The performance of selected and expert assessors should be regularly monitored. They should use the scale correctly (location and range), score the same product consistently in different replicates (reliability/repeatability), attribute intensity evaluation in agreement with other assessors (validity/consistency) and discriminate among samples (sensitivity) [14,49,50]
According to the requirements of guidelines for monitoring the performance of a quantitative sensory panel its analysis between the individual assessor and the sensory panel, the average of the entire panel is used as a reference by standard. It recommends the determination of Pearson’s correlation coefficient, slope and intercept of the regression line fitted to the individual panelist’s points [44]. Because the panel average also contains the data of the panelist for whom the comparison is performed, the panel average recommended by ISO distorts the results; therefore, for a correct calculation, the value of the panelist to be examined has to be excluded when calculating the average. After the proposed correction, the correlation coefficient always decreases—except that all assessors give the same score. However, the value of slope and intercept depends on the panelist’s rating. If the conditions of the parametric tests are not met, instead of Pearson’s correlation it is advisable to calculate the non-parametric Spearman rho correlation. The published research results give sufficient evidence to incorporate international sensory standards into a future revision [51].

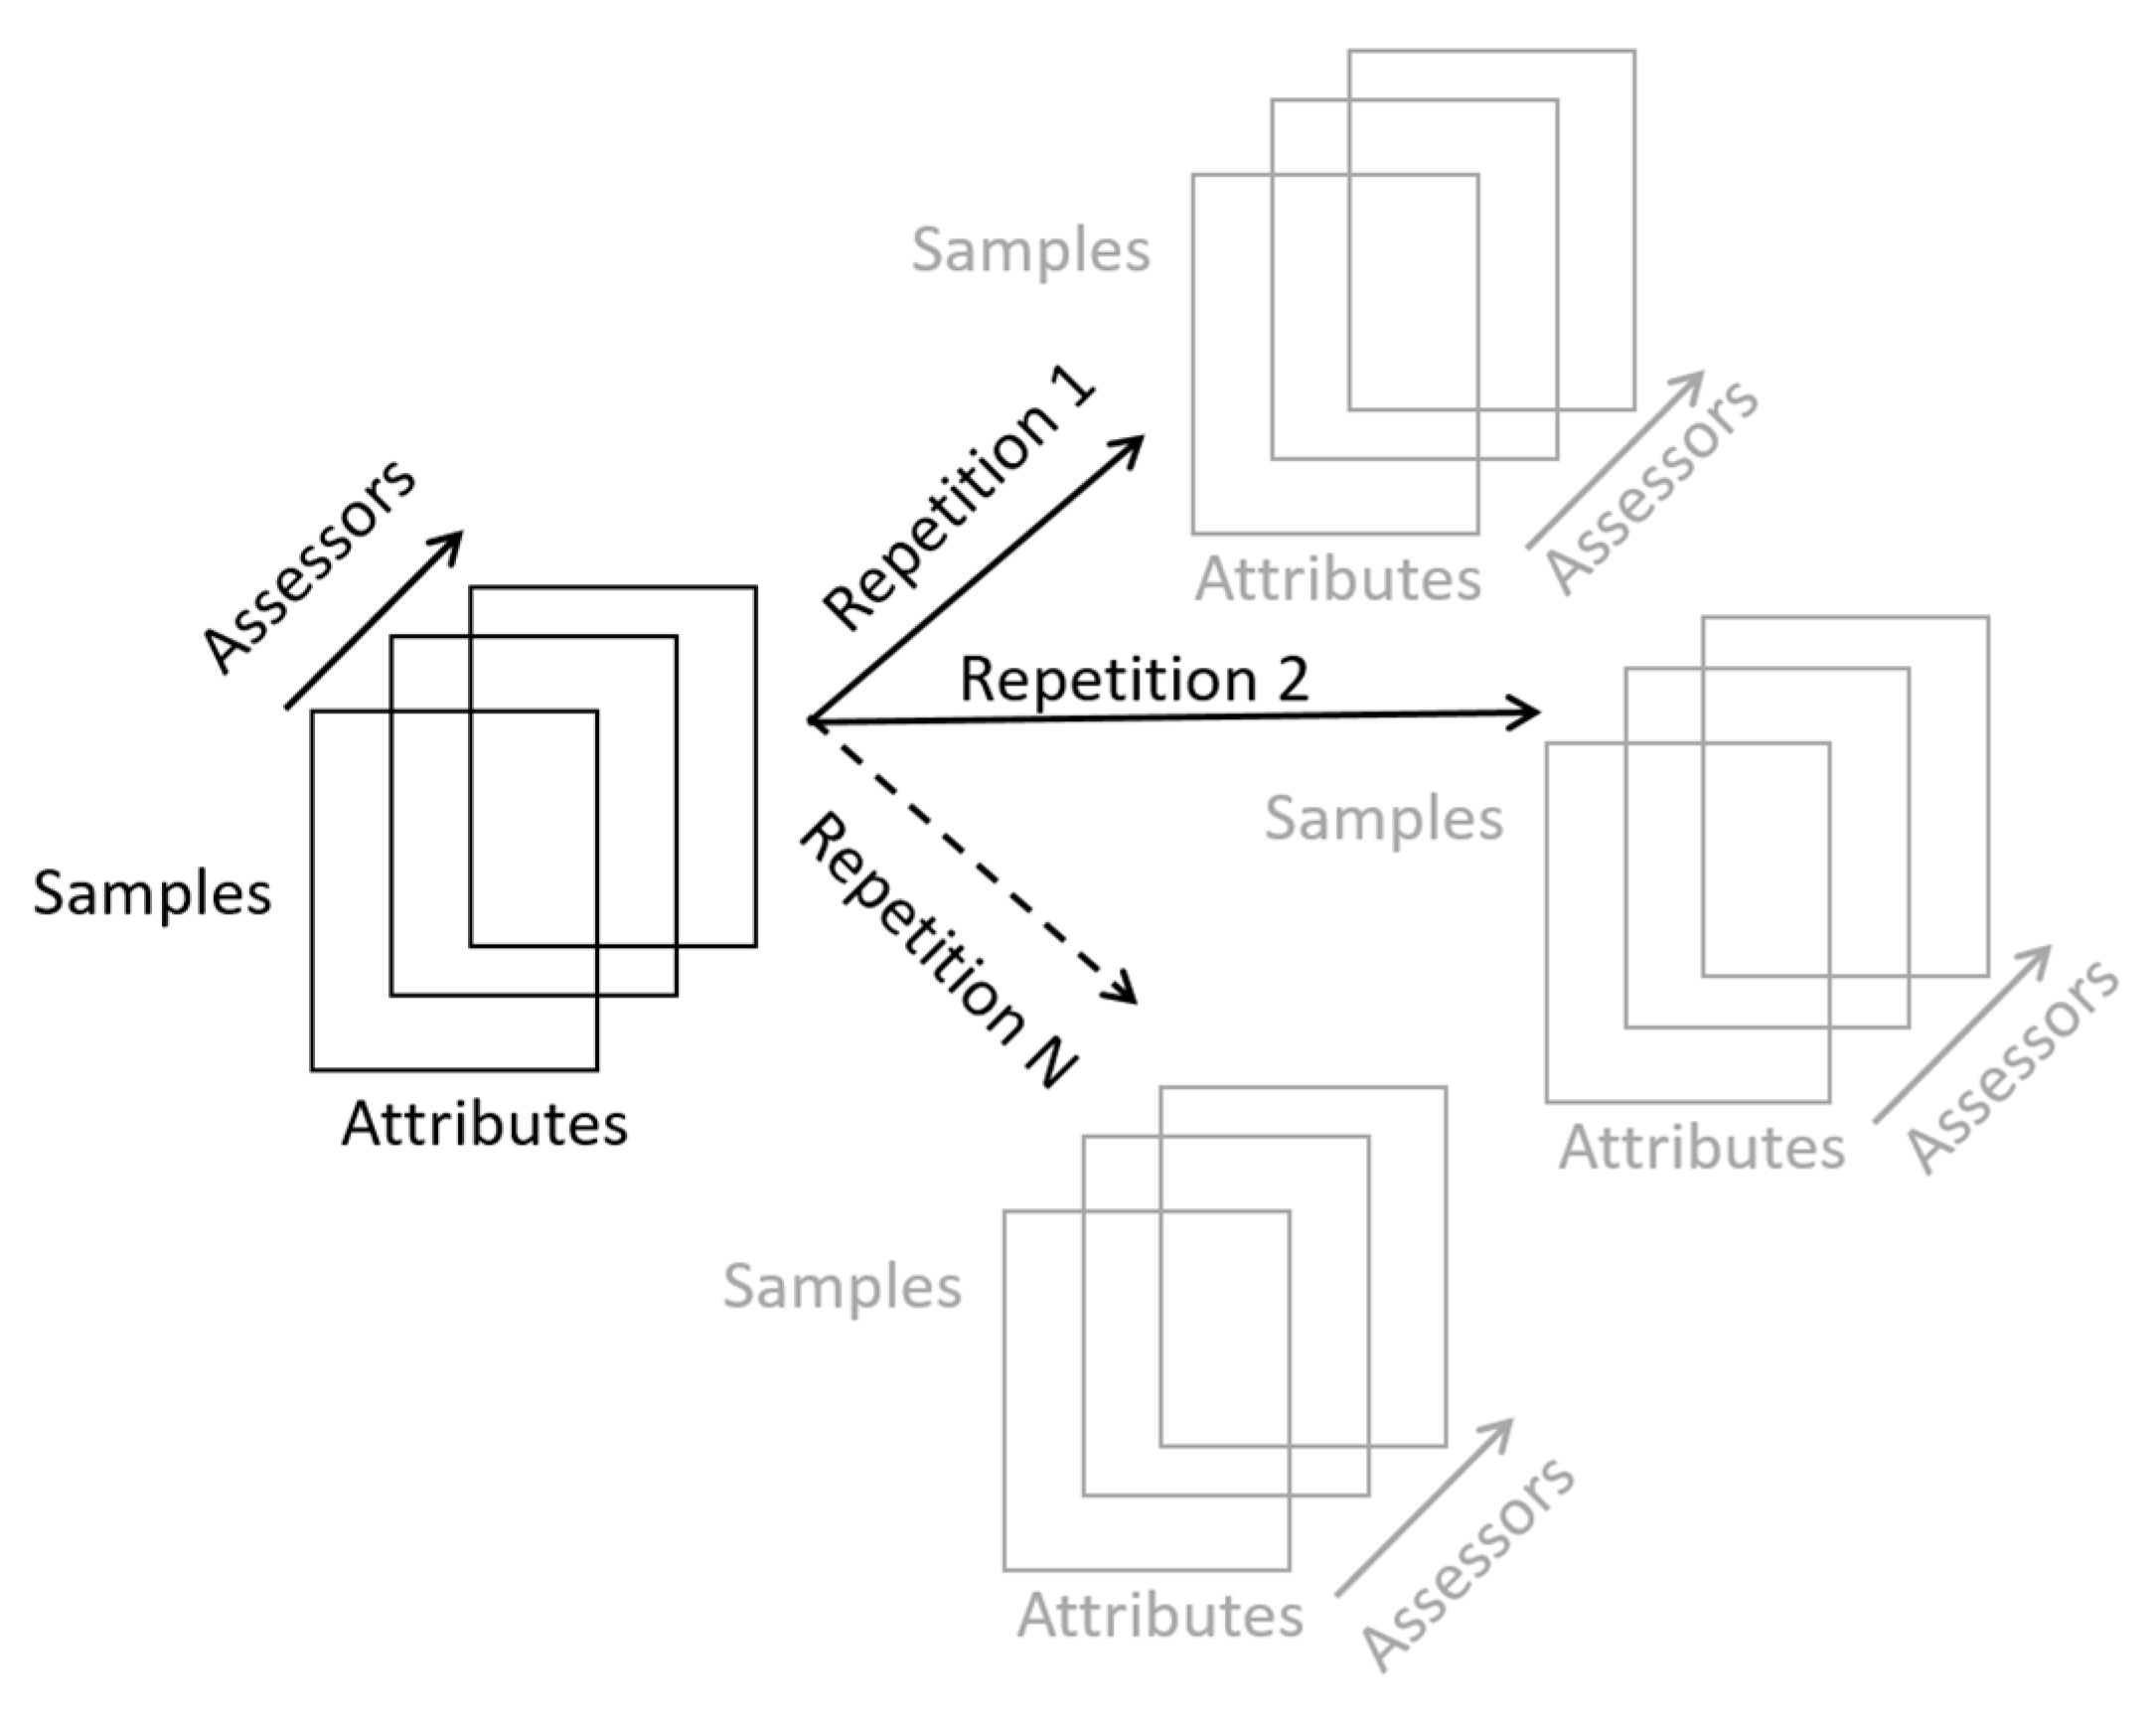
4.3. Structure and Models of Sensory Data

Sensory data are typically available as a four-way data structure: numbers of assessors, products, attributes and replicates are the four data modes. This structure determines what types of models can be used. Linear models are routinely used to analyze data (Figure 2).
Mostly ANOVA models are used on mean sensory data with the design of experiment (DoE) parameters as factors. Sensory data are first averaged across panelists and replicates, then with the help of DoE parameters (fixed effects) ANOVA models are run on these data. Mixed models on raw sensory data have the subject as a random effect and DoE parameters as fixed effects. In the case of panel performance examinations, significant effects and interactions are chosen [52]. For panel performance tests, only the full factorial design is used. However, balanced incomplete block design (BIBD) is also applied in tests with a high number of samples [53].
The commonly used experimental design is often named Randomized Complete Block Design, within-assessors design or a repeated measures design. In the case of replications, the design is named the Randomized Complete Block Design with more than one observation per experimental unit, then the ANOVA model is as follows [45]:
Y i j k = μ + α l + v j + c i j + ε i j k
where μ is the grand mean for attributes, with α1 as the assessor effect, vj is the product effect, cij is the interaction effect (panelist × product) and εijk N(0, σ2) is the random replicate error. Instead of the commonly used ANOVA model, Brockhoff and coworkers [48] propose a mixed assessor model (MAM). In the mixed assessor model, the interaction in commonly used ANOVA tests is broken down into a scaling coefficient and a clear disagreement effect. As a result, the products are better separated and the agreement of the assessors is also improved. The MAM model breaks down the interaction into the sum of the scaling coefficient ( β i χ j ) and the pure disagreement (dij). Thus, the following mixed assessment model is:
Y i j k = μ + α l + v j + β i χ j + d i j + ε i j k
where i is the number of assessors, j is the number of products, k is the number of repetitions, αi is the assessor effect, vj is the product effect, βi is the scaling coefficient resulting from the different use of scales by the assessors and dij is the clear disagreement. The scaling coefficient βi is obtained from the linear regression. If the assessor uses the scale in the same way as the panel, then βi = 1, if the assessor’s scale is larger than the panel, then βi > 1, if the assessor’s scale is smaller than the panel, then 0 < βi < 1. If a negative value is given, the scale is misunderstood by βi < 0. In summary, the advantage of the mixed assessor model is that it takes into account the scaling differences, as product averages are incorporated into the modeling as covariates and allows the covariance regression coefficients to depend on the assessors [54].
Peltier and co-workers implemented the generalization of the CAP (Control of Assessor Performances) system developed by Schilch to evaluate assessors and panel using the MAM-CAP table (Mixed Assessor Model-Control of Assessment Performances). The main purpose of the MAM-CAP table is to help the panel leader to make decisions concerning the individual assessors and the panel: discrimination (F-Prod), agreement (F-Disa), repeatability (RMSE) and scale usage (F-Scal). The MAM-CAP table is a fast and synthetic diagnostic tool, and each row corresponds to a sensory attribute. One part of the table summarizes the performance of the panelist, and the other part corresponds to the panel. Each cell encapsulates the signals and the color codes for discrimination, agreement, repeatability and scaling [55].
There are some difficulties, contradictions, and problems with the MAM-CAP method. Due to the different degrees of freedom (assessor/panel), a situation may arise where there is no discrimination and consensus at the level of the individual, but exists at the level of the panel. In the MAM-CAP table, the repeatability of the assessor can be evaluated only in relation to the repeatability of the panel, and there is no test related to the repeatability of the panel. A solution to this could be to compare the distribution of root mean square error (RMSE) extracted by the meta-analysis of the database. The CAP method should be used instead of the MAM-CAP method if the data set is unbalanced and/or contains only one or two products. The overall utility of an extended model such as MAM may depend on the profiling approach. For example, if using an absolute scale-based system, it may not be appropriate to remove the scaling differences from the error term in the analysis [6]. In further research, descriptor-specific and overall coefficients were created by multiplicative decomposition of the scaling effect. The overall scaling coefficient is independent of the descriptors and expresses the psychological trend of the panelist in the case of a scoring task. The corrected scaling coefficient for each descriptor expresses specific sensitivity of the panelist to the descriptor [54]. Lepage and his co-workers created a method to determine the temporal dominance of sensations (TDS) to measure the performance of sensory assessors and the panel [56]. Several statistical methods were used to evaluate the performance of the panels. These methods have been implemented in various programming environments. The present comparison supports the choice of the performance parameter and its related statistical procedures. Available software platforms, their accessibility (open-source status) and their functions are analyzed in detail concerning panelist or whole panel evaluation. For the convenience of the audience, the statuses of software platforms were indexed according to their accessibility (open source status). Practical applications and case studies are also displayed in the last column of the table, to support the panel leaders’, panel analysts’ and sensory scientists’ work (Table 1).
In the industrial practice of panel performance monitoring, panel drift can be measured using different statistical process control (SPC) methods (period of time): X-chart, CUSUM analysis, Manhattan plot and Shewhart diagram. Sensory results are often set in parallel with the results of instrumental measurements, which is an appropriate way to externally validate sensory results in quality control [30].
Laboratories accredited for sensory tests should demonstrate their proficiency in accredited tests. Proficiency tests can be performed on the results of routine tests or by analyzing independent results. The proficiency testing is determinate of laboratory testing performance by the means of two or more interlaboratory comparisons with blind samples [87,88,89]. Reproducibility is sometimes also seen as an element of proficiency [9]. Hyldig presents “the steps of proficiency test: selection of method; selection and test of material for the proficiency test items; guidelines for preparation of the proficiency test items and the execution of the test; training material and guidelines for training; coding and consignment of the proficiency test items to the participating laboratories; proficiency test, collection of data from the proficiency test round; analysis of data and report of the results” [90]. The proficiency items (products) are different in the published studies: compotes, black and mi-doux chocolates/profile [91], candies/profile [58], red wines/profile [92], apple juices/ranking test [93], soft drinks/triangle tests [94], cooked beef/profile [95] and virgin olive oil/profile [96]. PanelCheck software can be recommended to analyze the performance of sensory assessors and panels in these cases [58].

5. Software

In order to support the procedure of sensory analysis in research and in QC it is essential to rely on a specialized sensory software system. Generally, there are at least two possible solutions: commercially available platforms, or self-developed scripts. The former requires a considerable financial investment, the latter provides a larger degree of freedom for the end user. However, in case of a self-developed software one needs to be familiar with the programming languages and platforms (e.g., R-project, Python, etc.).
Among the commercially available programmes, there are three major types: (a) supports the whole process of testing; (b) supports only the statistical analysis; (c) measuring panel performance or test performance parameters:
Panelists’ recruitment, training, test design, scoresheet editing, test implementation, statistical analysis and reporting. Such programmes include the followings: Compusense (Compusense 20), Fizz, Redjade, EyeQuestion (V12021), SIMS (SIMS Sensory Software Cloud).
Specified statistical analysis of the test data and visualization. Some typical examples are: Senstools, XLSTAT (2021.5), SensoMineR (V3.1-5-1).
Measuring panel performance or test performance parameters: PanelCheck (V1.4.2), V-Power, SensCheck.
In the last decade, there has been a shift from purchasing software towards subscribing to its use. The name of the technology is SaaS (Software as a Service); it provides a cloud technology, and users access the servers through a lean client. Some companies offer a larger SaaS package with annual subscription, whereas there are other solutions with a one-time purchase (this is quite popular among the academic sector). For users who prefer the self-developed platforms, one of the most popular languages is the R-project ((R Core Team, a Language and Environment for Statistical Computing, Austria: R Foundation for Statistical Computing Vienna https://www.R-project.org/, accessed on 14 December 2021)).
The entire sensory process is based and can be implemented electronically in every step and with the software support: experimental design, sensory testing, statistical evaluation and graphical representation, as well as the production of reports. In addition to the computer support for the entire sensory process, these programmes also include the monitoring of sensory procedures and the measurement of sensory assessor and panel performance. The commercially available programmes that support the entire sensory process include the following:
Compusense Cloud (Compusense, 679 Southgate Drive, Guelph, ON N1G 4S2, Canada) https://compusense.com/en/ accessed on 14 December 2021
Fizz (Biosystemes, 9, rue des Mardors, 21560 Couternon, France) http://www.biosystemes.com/fizz.php accessed on 14 December 2021
Red Jade Sensory (Tragon Corporation, 350 Bridge Parkway, Redwood Shores, CA 94065, USA) http://www.redjade.net/ accessed on 14 December 2021
Eye Question (Nieuwe Aamsestraat 90D Elst(Gld), PO Box 206 NL-6660 AE The Netherlands) https://eyequestion.nl/ accessed on 14 December 2021
TimeSens (l’Institut National de Recherche Agronomique (INRA), 35 rue Parmentier, 21000 Dijon, France) http://www.timesens.com/contact.aspx accessed on 14 December 2021
SIMS (Sensory Computer Systems: 144 Summit Avenue, Berkeley Heights, NJ, USA) http://www.sims2000.com/ accessed on 14 December 2021
Smart Sensory Box (Via Rockefeller 54, 07100 Sassari, Italy) https://www.smartsensorybox.com accessed on 14 December 2021
Some of the commercially available sensory programmes support the design of sensory experiments, the control of assessors’ performance and the sub-processes of statistical evaluation and the visualization of the collected data. However, these programmes do not support the compilation, distribution or collection of sensory questionnaires:
XLSTAT (Addinsoft Corporation, 40, rue Damrémont, 75018 Paris, France) https://www.xlstat.com/en/ accessed on 14 December 2021
Senstools (OP&P Product Research BV, Burgemeester Reigerstraat 89, 3581 KP Utrecht, The Netherland) http://www.senstools.com/ accessed on 14 December 2021
SensoMineR (The R Foundation for Statistical Computing, Institute for Statistics and Mathematics, Wirtschaftsuniversität Wien, Augasse 2-6, 1090 Vienna, Austria) http://sensominer.free.fr/ accessed on 14 December 2021
SensoMaker (Federal University of Lavras, CP 3037, 37200-000 Lavras-MG, Brazil) http://ufla.br/sensomaker/ accessed on 14 December 2021
Chemoface (Federal University of Lavras, CP 3037, 37200-000 Lavras-MG, Brazil) http://ufla.br/chemoface/ accessed on 14 December 2021
Another type of sensory software is specifically designed to solve some special sensory task (for evaluation of the performance of the panel (PanelCheck), for the performance evaluation of product-specific taste panels, for quality assurance (SensCheck), for experimental design (Design Express, V-Power), for sensory profile data analysis (SenPAQ), for evaluation of consumer studies (ConsumerCheck, OptiPAQ, MaxDiff (Best-Worst) Scaling Apps) and for sensory statistical analyzes (R-project packages). Special sensory programmes include:
PanelCheck (Nofima, Breivika, PO Box 6122, NO-9291 Tromsø, Norway, Danish Technical University (DTU), Informatics and Mathematical Modelling, Lyngby, Denmark) http://www.panelcheck.com/ accessed on 14 December 2021
SenseCheck (AROXA™, Cara Technology Limited, Bluebird House, Mole Business Park, Station Road, Leatherhead, Surrey KT22 7BA, UK) https://www.aroxa.com/about-sensory-software accessed on 14 December 2021
V-Power (OP & P Product Research BV, Burgemeester Reigerstraat 89, 3581 KP Utrecht, The Netherland) http://www.senstools.com/v-power.html accessed on 14 December 2021
Design Express (Qi Statistics Ltd., Ruscombe Lane, RG10 9JN Reading, UK) https://www.qistatistics.co.uk/product/design-express/ accessed on 14 December 2021
SenPAQ (Qi Statistics Ltd., Ruscombe Lane, RG10 9JN Reading, UK) https://www.qistatistics.co.uk/product/senpaq/ accessed on 14 December 2021
ConsumerCheck (Nofima, Norway, Danish Technical University (DTU), Denmark, University of Maccherata, Italy, Stellenbosch University, South Africa, CSIRO, Australia) https://consumercheck.co/ accessed on 14 December 2021
OptiPAQ (Qi Statistics Ltd., Ruscombe Lane, RG10 9JN Reading, UK) https://www.qistatistics.co.uk/product/optipaq/ accessed on 14 December 2021
MaxDiff (Best-Worst) Scaling Apps (Qi Statistics Ltd., Ruscombe Lane, RG10 9JN Reading, UK) https://www.qistatistics.co.uk/product/maxdiff-best-worst-scaling-apps/ accessed on 14 December 2021
QualiSense (CAMO Software Inc, One Woodbridge Center Suite 319 Woodbridge, NJ 07095, USA) http://www.solutions4u-asia.com/pdt/cm/CM_Unscrambler-Quali%20Sense.html accessed on 14 December 2021
RapidCheck (Nofima, Breivika, PO Box 6122, NO-9291 Tromsø, Norway) http://nofima.no/en/forskning/naringsnytte/learn-to-taste-yourself/ accessed on 14 December 2021
Targeted software developed for performance evaluation of individual assessors and assessment panels typically provides numerical and graphical feedback to the panel leader on individual and panel performance in addition to statistical evaluation. To improve discrimination, repeatability, reproducibility and scale usage, individualized targeted tasks can be prescribed to the panelists and implemented under monitored conditions. The basic methods of the programmes listed here related to the assessors are scatter plots, which make the raw data easy to assess. The assessor-centric scatter plots make it possible to represent the assessors’ raw data by product and by property. They can be used to determine if the use and referencing in the international literature made it a benchmark in this field. The development of the software was supported by the European Union. The Nofima (Norwegian Food Research Institute, Ås, Norway) and the Danish DTU (Technical University of Denmark, Lyngby Denmark) have jointly developed the open-source PanelCheck software released under a free license. The software developers implemented several uni- and multivariate statistical methods to measure the performance of sensory panels. In order to evaluate either an individual assessor or the panel, it is advisable to combine several performance measurement tools; however, there may be an overlap between the information provided. Among the methods, a number of easy-to-interpret yet univariate graphical methods—line diagram, mean and standard deviation diagram, correlation diagram, profile diagram, eggshell diagram, F and p diagram, mean squared error (MSE) diagram, prediction mean squared error (p-MSE) diagram—in addition to multivariate methods—Tucker-1 diagram, Manhattan diagram, two- and three-way ANOVA, principal component analysis (PCA)—can also be found. The use of the software is also facilitated by the quick entry of data and easy exportability. With the assistance of the “help” function, the most important methods are presented to the end users, and the evaluation of the panel is also suggested through a workflow (Figure 3) [13,57].
The SenseCheck software was developed to facilitate and support product-specific panel tests performed with the nanocapsulated, validated and safe sensory reference materials developed by the AROXA™ company for the work of sensory panels in the food industry. The company’s aroma standards are several specialized food and beverage types: beers, cider, soft drinks, water and wine, but the encapsulated reference standards can also be applied to other product groups. The advantage of reference standards is that they allow the panelists to identify and recognize the properties of the product. The AROXA™ standards are at pharmaceutical grade and comply with the strict manufacturing practices of pharmaceutical quality control (GMP).
The use of AROXA™ reference materials and SenseCheck software provides an opportunity to test the proficiency of product expert panels. There are a number of ways to assess different skills and abilities related to sensory analysis. Proficiency tests using SenseCheck involve:
Examination of discriminatory abilities (using samples with a certain degree of difference);
Testing of aroma identification abilities (using samples to which special aromas with known concentration and purity have been added);
Scale usage analysis (using series of samples covering a wide range of intensities in a single flavor);
Statistical analysis of repeated evaluations of samples (by analyzing routine test tasks evaluated by assessors).
Other software packages used in the field of sensory science are often general statistical software packages, which are typically not target programmes, but might be applied to solve panel performance-related issues:
Matlab (MathWorks Inc., 3 Apple Hill Drive Natick, MA 01760-2098, USA) https://www.mathworks.com/products/matlab.html accessed on 14 December 2021
SPSS Statistics (IBM Corporation Software Group, Route 100 Somers, NY 10589, USA) https://www.ibm.com/se-en/products/spss-statistics accessed on 14 December 2021
Statistica (StatSoft, Inc. 2300 East 14th Street Tulsa, OK 74104, USA) http://www.statsoft.com/Products/STATISTICA-Features accessed on 14 December 2021
SAS (SAS Institute Inc., 100 SAS Campus Drive, Cary, NC 27513-2414, USA) https://www.sas.com/en_us/home.html accessed on 14 December 2021
Unscrambler (CAMO Software Inc., One Woodbridge Center Suite 319 Woodbridge, NJ 07095, USA) https://www.camo.com/unscrambler/ accessed on 14 December 2021
R-project (The R Foundation for Statistical Computing, Institute for Statistics and Mathematics, Wirtschaftsuniversität Wien, Augasse 2-6, 1090 Vienna, Austria) https://www.r-project.org/ accessed on 14 December 2021
Palisade (Palisade Corporation, 798 Cascadilla Street, Ithaca, NY 14850, USA) https://www.palisade-br.com/stattools/testimonials.asp accessed on 14 December 2021
SYSTAT (Systat Software, Inc. 501 Canal Blvd, Suite E, Point Richmond, CA 94804-2028, USA) https://systatsoftware.com/ accessed on 14 December 2021
Special studies such as the ones which focus on the structural models integrating the tasting process and final decision can facilitate the decision support systems [97].
Generally, there are at least two possible software solutions available to support the procedure of sensory analysis in research and in quality control: commercially available platforms and self-developed scripts. Additionally, in the case of a self-developed software, one needs to be familiar with the programming languages and platforms. In the last decade, there has been a shift from purchasing software towards subscribing to SaaS (Software as a Service). The programmes supporting the entire sensory process also include the monitoring of sensory procedures and the measurement of sensory assessor and panel performance. Targeted programmes developed for performance evaluation of individual assessors and assessment panels typically provide numerical and graphical feedback to the panel leader. They also make it possible that individualized targeted tasks can be prescribed to the panelists and implemented under monitored conditions. General statistical software packages can be applied to solve panel performance-related issues too.

6. Conclusions and Outlook

Since the target of food and beverage production is still and will be the consumer, its final evaluation involves integrating the application of the human senses. This way, the utilization of sensory tests and panels will still be commonplace in the research and in development activities. Thus, the performance and efficacy of these tests and panels should be carefully monitored in order to provide reliable information and datasets. The integration of psychophysics in the training and monitoring of panelists is a possible way to ensure future sensory panel development. The sensory analysis panel constitutes a true measuring instrument that utilizes human perceptions as instrumental measures to quantify the sensory parameters of products. Many instrumental methods have been developed for this purpose, but only humans are able to deliver comprehensive sensory testing results. Food science was the first area to use sensory methods extensively, but these have spread widely to other product areas that have attributes perceived by the senses. The panel performance monitoring and panel drift can be measured using different statistical process control methods in the industrial practice. Sensory results are more often set in parallel with the results of instrumental measurements, which is an appropriate way to externally validate the sensory results in quality control. Laboratories accredited for sensory tests need to demonstrate their proficiency in accredited tests. The laboratory testing performance is determined by means of two or more interlaboratory comparisons. In general, the sensory methods are based on the profile-analytical descriptive method, but are inherently more difficult to handle than less complex difference analysis, ranking or scoring methods.
Product-specific evaluations give a further diversity to applied and approved methods, both for performing the sensory tests and for evaluating the panelists’ performance. There is an increasing demand for platforms which facilitate and integrate the panel performance measurements in the routine procedures of a sensory laboratory. In the present overview, we applied a novel approach of separating the platforms based on several criteria: integrity (whole testing procedure vs. dedicated sub-tasks), business model (purchase vs. software as a service), accessibility (open-source status) and its function related to panel issues and statistical tools.
Digitization will have an impact on sensory data access. SensoBase is a prime example of building a robust and complex database where researchers have the possibility to perform meta-analyses and identify patterns for panel performance. Preference mapping is another field where the advanced technologies such as artificial intelligence (AI) can be used to build artificial neural networks (ANNs) to predict consumer preference from descriptive profiles. This procedure requires simultaneous implementation of descriptive and consumer studies to build the initial model. Once the robust model has been created in further studies, the descriptive analysis provides a strong basis for consumer preference prediction.

Author Contributions

All authors have contributed to the research. Conceptualization, L.S. and Z.K.; methodology, L.S. and Z.K., software L.S. and Z.K.; funding acquisition, L.S., G.H., L.F.F. project administration, G.H.; supervision, G.H. and L.F.F.; writing—original draft, L.S., Á.N. and Z.K.; writing—review and editing, Z.K. All authors have read and agreed to the published version of the manuscript.

Funding

This paper was supported by the János Bolyai Research Scholarship of the Hungarian Academy of Sciences. This work was partly supported by the European Union and co-financed by the European Social Fund (grant agreement no. EFOP-3.6.3-VEKOP-16-2017-00005). This research was funded by National Research, Development and Innovation Office of Hungary (OTKA, contracts No. 135700). This research was supported by the Ministry for Innovation and Technology within the framework of the Thematic Excellence Programme 2020—Institutional Excellence Subprogram (TKP2020-IKA-12) for research on plant breeding and plant protection.

Acknowledgments

This research was supported by the Ph.D. School of Food Science of Hungarian University of Agriculture and Life Sciences. The authors are grateful for John-Lewis Zinia Zaukuu for proofreading the manuscript.

Conflicts of Interest

The authors declare no conflict of interest.

References

  1. Stone, H. Example Food: What Are Its Sensory Properties and Why Is That Important? NPJ Sci. Food 2018, 2, 11. [Google Scholar] [CrossRef] [PubMed] [Green Version]
  2. Lawless, H.T.; Heymann, H. Sensory Evaluation of Food: Principles and Practices. In Food Science Text Series, 2nd ed.; Springer: New York, NY, USA, 2010; ISBN 978-1-4419-6487-8. [Google Scholar]
  3. ISO 8586. Sensory Analysis—General Guidelines for the Selection, Training and Monitoring of Selected Assessors and Expert Sensory Assessors; ISO: Geneva, Switzerland, 2012. [Google Scholar]
  4. Dinnella, C.; Pierguidi, L.; Spinelli, S.; Borgogno, M.; Gallina Toschi, T.; Predieri, S.; Lavezzi, G.; Trapani, F.; Tura, M.; Magli, M.; et al. Remote Testing: Sensory Test during COVID-19 Pandemic and Beyond. Food Qual. Prefer. 2022, 96, 104437. [Google Scholar] [CrossRef]
  5. Moussour, M.; Lavarde, M.; Pensé-Lhéritier, A.-M.; Bouton, F. Sensory Analysis of Cosmetic Powders: Personal Care Ingredients and Emulsions. Int. J. Cosmet. Sci. 2017, 39, 83–89. [Google Scholar] [CrossRef] [PubMed]
  6. Rogers, L. Sensory Panel Management: A Practical Handbook for Recruitment, Training and Performance; Woodhead Publishing: Shaston, UK, 2017; ISBN 978-0-08-101115-7. [Google Scholar]
  7. ISO 5492. Sensory Analysis—Vocabulary; ISO: Geneva, Switzerland, 2008. [Google Scholar]
  8. Meilgaard, M.C.; Carr, B.T.; Civille, G.V. Sensory Evaluation Techniques, 4th ed.; CRC Press: Boca Raton, FL, USA, 2006; ISBN 978-0-8493-3839-7. [Google Scholar]
  9. Raithatha, C.; Rogers, L. Panel Quality Management: Performance, Monitoring and Proficiency. In Descriptive Analysis in Sensory Evaluation; John Wiley & Sons: Hoboken, NJ, USA, 2018; pp. 113–164. ISBN 978-0-470-67139-9. [Google Scholar]
  10. Bourne, M. Food Texture and Viscosity, 2nd ed.; Academic Press: San Diego, CA, USA, 2002. [Google Scholar]
  11. ISO 11036. Sensory Analysis—Methodology—Texture Profile; ISO: Geneva, Switzerland, 2020. [Google Scholar]
  12. Aprea, E.; Charles, M.; Endrizzi, I.; Laura Corollaro, M.; Betta, E.; Biasioli, F.; Gasperi, F. Sweet Taste in Apple: The Role of Sorbitol, Individual Sugars, Organic Acids and Volatile Compounds. Sci. Rep. 2017, 7, 44950. [Google Scholar] [CrossRef] [PubMed]
  13. Næs, T.; Brockhoff, P.B.; Tomic, O. Statistics for Sensory and Consumer Science, 1st ed.; John Wiley & Sons, Ltd.: Hoboken, NJ, USA, 2010. [Google Scholar]
  14. Romano, R.; Vestergaard, J.S.; Kompany-Zareh, M.; Bredie, W.L.P. Monitoring Panel Performance Within and between Sensory Experiments by Multi-Way Analysis. In Classification and Multivariate Analysis for Complex Data Structures; Fichet, B., Piccolo, D., Verde, R., Vichi, M., Eds.; Springer: Berlin/Heidelberg, Germany, 2011; pp. 335–342. [Google Scholar]
  15. Bleibaum, R.N.; Kern, M.J.; Thomas, H. 24—Contextual Product Testing for Small to Medium Sized Enterprises (SMEs). In Context; Meiselman, H.L., Ed.; Woodhead Publishing: Shaston, UK, 2019; pp. 501–520. ISBN 978-0-12-814495-4. [Google Scholar]
  16. Djekic, I.; Lorenzo, J.M.; Munekata, P.E.S.; Gagaoua, M.; Tomasevic, I. Review on Characteristics of Trained Sensory Panels in Food Science. J. Texture Stud. 2021, 52, 501–509. [Google Scholar] [CrossRef]
  17. Halagarda, M.; Suwała, G. Sensory optimisation in new food product development: A case study of polish apple juice. Ital. J. Food Sci. 2018, 30, 317–335. [Google Scholar] [CrossRef]
  18. Giacalone, D. Chapter 4—Sensory and Consumer Approaches for Targeted Product Development in the Agro-Food Sector. In Case Studies in the Traditional Food Sector; Cavicchi, A., Santini, C., Eds.; Woodhead Publishing Series in Food Science, Technology and Nutrition; Woodhead Publishing: Shaston, UK, 2018; pp. 91–128. ISBN 978-0-08-101007-5. [Google Scholar]
  19. King, B.M.; Arents, P.; Moreau, N. Cost/Efficiency Evaluation of Descriptive Analysis Panels—I. Panel Size. Food Qual. Prefer. 1995, 6, 245–261. [Google Scholar] [CrossRef]
  20. Zamora, M.C.; Guirao, M. Performance Comparison Between Trained Assessors and Wine Experts Using Specific Sensory Attributes. J. Sens. Stud. 2004, 19, 530–545. [Google Scholar] [CrossRef]
  21. Pinto, F.S.T.; Fogliatto, F.S.; Qannari, E.M. A Method for Panelists’ Consistency Assessment in Sensory Evaluations Based on Cronbach’s Alpha Coefficient. Food Qual. Prefer. 2014, 32, 41–47. [Google Scholar] [CrossRef]
  22. Monteleone, E.; Langstaff, S. Olive Oil Sensory Science; John Wiley & Sons: Hoboken, NJ, USA, 2013; ISBN 978-1-118-33250-4. [Google Scholar]
  23. Rébufa, C.; Pinatel, C.; Artaud, J.; Girard, F. A Comparative Study of the Main International Extra Virgin Olive Oil Competitions: Their Impact on Producers and Consumers. Trends Food Sci. Technol. 2021, 107, 445–454. [Google Scholar] [CrossRef]
  24. Borràs, E.; Ferré, J.; Boqué, R.; Mestres, M.; Aceña, L.; Calvo, A.; Busto, O. Prediction of Olive Oil Sensory Descriptors Using Instrumental Data Fusion and Partial Least Squares (PLS) Regression. Talanta 2016, 155, 116–123. [Google Scholar] [CrossRef]
  25. Delgado, C.; Guinard, J.-X. How Do Consumer Hedonic Ratings for Extra Virgin Olive Oil Relate to Quality Ratings by Experts and Descriptive Analysis Ratings? Food Qual. Prefer. 2011, 22, 213–225. [Google Scholar] [CrossRef]
  26. Pearson, W.; Schmidtke, L.; Francis, I.L.; Blackman, J.W. An Investigation of the Pivot© Profile Sensory Analysis Method Using Wine Experts: Comparison with Descriptive Analysis and Results from Two Expert Panels. Food Qual. Prefer. 2020, 83, 103858. [Google Scholar] [CrossRef]
  27. da Costa, A.C.V.; Sousa, J.M.B.; da Silva, M.A.A.P.; Garruti, D.; dos Santos, G.; Madruga, M.S. Sensory and Volatile Profiles of Monofloral Honeys Produced by Native Stingless Bees of the Brazilian Semiarid Region. Food Res. Int. 2018, 105, 110–120. [Google Scholar] [CrossRef]
  28. Piana, M.L.; Oddo, L.P.; Bentabol, A.; Bruneau, E.; Bogdanov, S.; Declerck, C.G. Sensory Analysis Applied to Honey: State of the Art. Apidologie 2004, 35, S26–S37. [Google Scholar] [CrossRef] [Green Version]
  29. Pérez-Elortondo, F.J.; Symoneaux, R.; Etaio, I.; Coulon-Leroy, C.; Maître, I.; Zannoni, M. Current Status and Perspectives of the Official Sensory Control Methods in Protected Designation of Origin Food Products and Wines. Food Control 2018, 88, 159–168. [Google Scholar] [CrossRef]
  30. ISO 20613. Sensory Analysis—General Guidance for the Application of Sensory Analysis in Quality Control; ISO: Geneva, Switzerland, 2019. [Google Scholar]
  31. Smith, A.M.; McSweeney, M.B. Partial Projective Mapping and Ultra-Flash Profile with and without Red Light: A Case Study with White Wine. J. Sens. Stud. 2019, 34, e12528. [Google Scholar] [CrossRef]
  32. Csambalik, L.; Divéky-Ertsey, A.; Pap, Z.; Orbán, C.; Stégerné Máté, M.; Gere, A.; Stefanovits-Bányai, É.; Sipos, L. Coherences of Instrumental and Sensory Characteristics: Case Study on Cherry Tomatoes. J. Food Sci. 2014, 79, C2192–C2202. [Google Scholar] [CrossRef]
  33. Sipos, L.; Ficzek, G.; Kókai, Z.; Tóth, M. New Multiresistant Apple Cultivars—Complex Assessment of Sensory and Some Instrumental Attributes. Acta Aliment. 2013, 42, 264–274. [Google Scholar] [CrossRef]
  34. Bavay, C.; Symoneaux, R.; Maître, I.; Kuznetsova, A.; Brockhoff, P.B.; Mehinagic, E. Importance of Fruit Variability in the Assessment of Apple Quality by Sensory Evaluation. Postharvest Biol. Technol. 2013, 77, 67–74. [Google Scholar] [CrossRef]
  35. Corollaro, M.L.; Aprea, E.; Endrizzi, I.; Betta, E.; Demattè, M.L.; Charles, M.; Bergamaschi, M.; Costa, F.; Biasioli, F.; Corelli Grappadelli, L.; et al. A Combined Sensory-Instrumental Tool for Apple Quality Evaluation. Postharvest Biol. Technol. 2014, 96, 135–144. [Google Scholar] [CrossRef]
  36. Bernhardt, B.; Sipos, L.; Kókai, Z.; Gere, A.; Szabó, K.; Bernáth, J.; Sárosi, S. Comparison of Different Ocimum Basilicum L. Gene Bank Accessions Analyzed by GC–MS and Sensory Profile. Ind. Crop. Prod. 2015, 67, 498–508. [Google Scholar] [CrossRef]
  37. Sipos, L.; Végh, R.; Bodor, Z.; Zaukuu, J.-L.Z.; Hitka, G.; Bázár, G.; Kovacs, Z. Classification of Bee Pollen and Prediction of Sensory and Colorimetric Attributes—A Sensometric Fusion Approach by e-Nose, e-Tongue and NIR. Sensors 2020, 20, 6768. [Google Scholar] [CrossRef]
  38. Chun, S.; Chambers, E.; Han, I. Development of a Sensory Flavor Lexicon for Mushrooms and Subsequent Characterization of Fresh and Dried Mushrooms. Foods 2020, 9, 980. [Google Scholar] [CrossRef] [PubMed]
  39. Chambers, D.H.; Allison, A.-M.A.; Chambers Iv, E. Training Effects on Performance of Descriptive Panelists. J. Sens. Stud. 2004, 19, 486–499. [Google Scholar] [CrossRef]
  40. Di Donfrancesco, B.; Gutierrez Guzman, N.; Chambers, E., IV. Comparison of Results from Cupping and Descriptive Sensory Analysis of Colombian Brewed Coffee. J. Sens. Stud. 2014, 29, 301–311. [Google Scholar] [CrossRef] [Green Version]
  41. Varela, P.; Ares, G. Sensory Profiling, the Blurred Line between Sensory and Consumer Science. A Review of Novel Methods for Product Characterization. Food Res. Int. 2012, 48, 893–908. [Google Scholar] [CrossRef]
  42. O’Mahony, M. Who Told You the Triangle Test Was Simple? Food Qual. Prefer. 1995, 6, 227–238. [Google Scholar] [CrossRef]
  43. ISO 16820. Sensory Analysis—Methodology—Sequential Analysis; ISO: Geneva, Switzerland, 2019. [Google Scholar]
  44. ISO 11132. Sensory Analysis—Methodology—Guidelines for Monitoring the Performance of a Quantitative Sensory Panel; ISO: Geneva, Switzerland, 2012. [Google Scholar]
  45. ISO 13299. Sensory Analysis—Methodology—General Guidance For Establishing A Sensory Profile; ISO: Geneva, Switzerland, 2016. [Google Scholar]
  46. Kilcast, D. Sensory Analysis for Food and Beverage Quality Control: A Practical Guide; Elsevier: Amsterdam, The Netherlands, 2010; ISBN 978-1-84569-951-2. [Google Scholar]
  47. Brockhoff, P.B. Statistical Testing of Individual Differences in Sensory Profiling. Food Qual. Prefer. 2003, 14, 425–434. [Google Scholar] [CrossRef]
  48. Brockhoff, P.B.; Schlich, P.; Skovgaard, I. Taking Individual Scaling Differences into Account by Analyzing Profile Data with the Mixed Assessor Model. Food Qual. Prefer. 2015, 39, 156–166. [Google Scholar] [CrossRef]
  49. Derndorfer, E.; Baierl, A.; Nimmervoll, E.; Sinkovits, E. A Panel Performance Procedure Implemented in R. J. Sens. Stud. 2005, 20, 217–227. [Google Scholar] [CrossRef]
  50. Kermit, M.; Lengard, V. Assessing the Performance of a Sensory Panel–Panellist Monitoring and Tracking. J. Chemom. 2005, 19, 154–161. [Google Scholar] [CrossRef]
  51. Sipos, L.; Ladányi, M.; Gere, A.; Kókai, Z.; Kovács, S. Panel Performance Monitoring by Poincaré Plot: A Case Study on Flavoured Bottled Waters. Food Res. Int. 2017, 99, 198–205. [Google Scholar] [CrossRef]
  52. Pineau, N.; Moser, M.; Rawyler, F.; Lepage, M.; Antille, N.; Rytz, A. Design of Experiment with Sensory Data: A Pragmatic Data Analysis Approach. J. Sens. Stud. 2019, 34, e12489. [Google Scholar] [CrossRef]
  53. ISO 29842. Sensory Analysis—Methodology—Balanced Incomplete Block Designs; ISO: Geneva, Switzerland, 2011. [Google Scholar]
  54. Peltier, C.; Visalli, M.; Schlich, P. Multiplicative Decomposition of the Scaling Effect in the Mixed Assessor Model into a Descriptor-Specific and an Overall Coefficients. Food Qual. Prefer. 2016, 48, 268–273. [Google Scholar] [CrossRef]
  55. Peltier, C.; Brockhoff, P.B.; Visalli, M.; Schlich, P. The MAM-CAP Table: A New Tool for Monitoring Panel Performances. Food Qual. Prefer. 2014, 32, 24–27. [Google Scholar] [CrossRef]
  56. Lepage, M.; Neville, T.; Rytz, A.; Schlich, P.; Martin, N.; Pineau, N. Panel Performance for Temporal Dominance of Sensations. Food Qual. Prefer. 2014, 38, 24–29. [Google Scholar] [CrossRef]
  57. Tomic, O.; Nilsen, A.; Martens, M.; Næs, T. Visualization of Sensory Profiling Data for Performance Monitoring. LWT-Food Sci. Technol. 2007, 40, 262–269. [Google Scholar] [CrossRef]
  58. Tomic, O.; Luciano, G.; Nilsen, A.; Hyldig, G.; Lorensen, K.; Næs, T. Analysing Sensory Panel Performance in a Proficiency Test Using the PanelCheck Software. Eur. Food Res. Technol. 2009, 230, 497. [Google Scholar] [CrossRef]
  59. Rossi, F. Assessing Sensory Panelist Performance Using Repeatability and Reproducibility Measures. Food Qual. Prefer. 2001, 12, 467–479. [Google Scholar] [CrossRef]
  60. Le, S.; Husson, F. Sensominer: A Package for Sensory Data Analysis. J. Sens. Stud. 2008, 23, 14–25. [Google Scholar] [CrossRef]
  61. Le, S.; Worch, T. Analyzing Sensory Data with R; CRC Press: Boca Raton, FL, USA, 2018; ISBN 978-1-315-36274-8. [Google Scholar]
  62. Latreille, J.; Mauger, E.; Ambroisine, L.; Tenenhaus, M.; Vincent, M.; Navarro, S.; Guinot, C. Measurement of the Reliability of Sensory Panel Performances. Food Qual. Prefer. 2006, 17, 369–375. [Google Scholar] [CrossRef]
  63. Moussaoui, K.A.; Varela, P. Exploring Consumer Product Profiling Techniques and Their Linkage to a Quantitative Descriptive Analysis. Food Qual. Prefer. 2010, 21, 1088–1099. [Google Scholar] [CrossRef] [Green Version]
  64. López-López, A.; Sánchez-Gómez, A.H.; Montaño, A.; Cortés-Delgado, A.; Garrido-Fernández, A. Panel and Panelist Performance in the Sensory Evaluation of Black Ripe Olives from Spanish Manzanilla and Hojiblanca Cultivars. Foods 2019, 8, 562. [Google Scholar] [CrossRef] [Green Version]
  65. Elía, M. A Procedure for Sensory Evaluation of Bread: Protocol Developed by a Trained Panel. J. Sens. Stud. 2011, 26, 269–277. [Google Scholar] [CrossRef]
  66. Castura, J.C.; Findlay, C.J.; Lesschaeve, I. Monitoring Calibration of Descriptive Sensory Panels Using Distance from Target Measurements. Food Qual. Prefer. 2005, 16, 682–690. [Google Scholar] [CrossRef]
  67. Bi, J. Agreement and Reliability Assessments for Performance of Sensory Descriptive Panel. J. Sens. Stud. 2003, 18, 61–76. [Google Scholar] [CrossRef]
  68. Bi, J.; Kuesten, C. Intraclass Correlation Coefficient (ICC): A Framework for Monitoring and Assessing Performance of Trained Sensory Panels and Panelists. J. Sens. Stud. 2012, 27, 352–364. [Google Scholar] [CrossRef]
  69. Kuesten, C.; Bi, J. Application of a Panel Performance Reliability versus Product Effect Size (PR-ES) Framework: A Protein Powder Case Study. Food Qual. Prefer. 2021, 89, 104152. [Google Scholar] [CrossRef]
  70. Kollár-Hunek, K.; Heszberger, J.; Kókai, Z.; Láng-Lázi, M.; Papp, E. Testing Panel Consistency with GCAP Method in Food Profile Analysis. J. Chemom. 2008, 22, 218–226. [Google Scholar] [CrossRef]
  71. Sipos, L.; Kovács, Z.; Szöllősi, D.; Kókai, Z.; Dalmadi, I.; Fekete, A. Comparison of Novel Sensory Panel Performance Evaluation Techniques with E-Nose Analysis Integration. J. Chemom. 2011, 25, 275–286. [Google Scholar] [CrossRef]
  72. Peltier, C.; Visalli, M.; Schlich, P. Canonical Variate Analysis of Sensory Profiling Data. J. Sens. Stud. 2015, 30, 316–328. [Google Scholar] [CrossRef]
  73. Wilderjans, T.F.; Cariou, V. CLV3W: A Clustering around Latent Variables Approach to Detect Panel Disagreement in Three-Way Conventional Sensory Profiling Data. Food Qual. Prefer. 2016, 47, 45–53. [Google Scholar] [CrossRef] [Green Version]
  74. Kollár-Hunek, K.; Héberger, K. Method and Model Comparison by Sum of Ranking Differences in Cases of Repeated Observations (Ties). Chemom. Intell. Lab. Syst. 2013, 127, 139–146. [Google Scholar] [CrossRef]
  75. Amelio, M. Olive Oil Sensory Evaluation: An Alternative to the Robust Coefficient of Variation (CVr %) for Measuring Panel Group Performance in Official Tasting Sessions. Trends Food Sci. Technol. 2019, 88, 567–570. [Google Scholar] [CrossRef]
  76. Findlay, C.J.; Castura, J.C.; Schlich, P.; Lesschaeve, I. Use of Feedback Calibration to Reduce the Training Time for Wine Panels. Food Qual. Prefer. 2006, 17, 266–276. [Google Scholar] [CrossRef]
  77. Schlich, P. Grapes: A Method and a Sas® Program for Graphical Representations of Assessor Performances. J. Sens. Stud. 1994, 9, 157–169. [Google Scholar] [CrossRef]
  78. Kazi-Aoual, F.; Hitier, S.; Sabatier, R.; Lebreton, J.-D. Refined Approximations to Permutation Tests for Multivariate Inference. Comput. Stat. Data Anal. 1995, 20, 643–656. [Google Scholar] [CrossRef]
  79. Schlich, P. Defining and Validating Assessor Compromises about Product Distances and Attribute Correlations. Data Handl. Sci. Technol. 1996, 16, 259–306. [Google Scholar]
  80. Pineau, N.; Chabanet, C.; Schlich, P. Modeling the Evolution of the Performance of a Sensory Panel: A Mixed-Model and Control Chart Approach. J. Sens. Stud. 2007, 22, 212–241. [Google Scholar] [CrossRef]
  81. Amorim, I.S.; Ferreira, E.B.; Lima, R.R.; Pereira, R.G.F.A. Monte Carlo Based Test for Inferring about the Unidimensionality of a Brazilian Coffee Sensory Panel. Food Qual. Prefer. 2010, 21, 319–323. [Google Scholar] [CrossRef]
  82. Bro, R.; Qannari, E.M.; Kiers, H.A.L.; Næs, T.; Frøst, M.B. Multi-Way Models for Sensory Profiling Data. J. Chemom. 2008, 22, 36–45. [Google Scholar] [CrossRef]
  83. Aguirre, V.M.; Huerta-Pacheco, N.S.; Lopez, M.T. CONS an R Based Graphical Interface to Perform Consonance Analysis. Food Qual. Prefer. 2017, 62, 183–189. [Google Scholar] [CrossRef]
  84. Elgaard, L.; Mielby, L.A.; Hopfer, H.; Byrne, D.V. A Comparison of Two Sensory Panels Trained with Different Feedback Calibration Range Specifications via Sensory Description of Five Beers. Foods 2019, 8, 534. [Google Scholar] [CrossRef] [PubMed] [Green Version]
  85. Talsma, P. Assessing Sensory Panel Performance Using Generalizability Theory. Food Qual. Prefer. 2016, 47, 3–9. [Google Scholar] [CrossRef]
  86. Tomic, O.; Forde, C.; Delahunty, C.; Næs, T. Performance Indices in Descriptive Sensory Analysis—A Complimentary Screening Tool for Assessor and Panel Performance. Food Qual. Prefer. 2013, 28, 122–133. [Google Scholar] [CrossRef]
  87. ISO EA-4/09. Accreditation for Sensory Testing Laboratories; ISO: Geneva, Switzerland, 2017. [Google Scholar]
  88. ISO/IEC 17043. Conformity Assessment—General Requirements for Proficiency Testing; ISO: Geneva, Switzerland, 2010. [Google Scholar]
  89. ISO/IEC 17025. Testing and Calibration Laboratories; ISO: Geneva, Switzerland, 2017. [Google Scholar]
  90. Hyldig, G. 3-Proficiency Testing of Sensory Panels. In Sensory Analysis for Food and Beverage Quality Control; Kilcast, D., Ed.; Woodhead Publishing Series in Food Science, Technology and Nutrition; Woodhead Publishing: Shaston, UK, 2010; pp. 37–48. ISBN 978-1-84569-476-0. [Google Scholar]
  91. Pagès, J.; Husson, F. Inter-Laboratory Comparison of Sensory Profiles: Methodology and Results. Food Qual. Prefer. 2001, 12, 297–309. [Google Scholar] [CrossRef]
  92. McEwan, J.A.; Hunter, E.A.; van Gemert, L.J.; Lea, P. Proficiency Testing for Sensory Profile Panels: Measuring Panel Performance. Food Qual. Prefer. 2002, 13, 181–190. [Google Scholar] [CrossRef]
  93. McEwan, J.A.; Heiniö, R.-L.; Hunter, E.A.; Lea, P. Proficiency Testing for Sensory Ranking Panels: Measuring Panel Performance. Food Qual. Prefer. 2003, 14, 247–256. [Google Scholar] [CrossRef]
  94. Sauvageot, F.; Herbreteau, V.; Berger, M.; Dacremont, C. A Comparison between Nine Laboratories Performing Triangle Tests. Food Qual. Prefer. 2012, 24, 1–7. [Google Scholar] [CrossRef]
  95. Gagaoua, M.; Micol, D.; Picard, B.; Terlouw, C.E.M.; Moloney, A.P.; Juin, H.; Meteau, K.; Scollan, N.; Richardson, I.; Hocquette, J.-F. Inter-Laboratory Assessment by Trained Panelists from France and the United Kingdom of Beef Cooked at Two Different End-Point Temperatures. Meat Sci. 2016, 122, 90–96. [Google Scholar] [CrossRef] [PubMed] [Green Version]
  96. Barbieri, S.; Brkić Bubola, K.; Bendini, A.; Bučar-Miklavčič, M.; Lacoste, F.; Tibet, U.; Winkelmann, O.; García-González, D.L.; Gallina Toschi, T. Alignment and Proficiency of Virgin Olive Oil Sensory Panels: The OLEUM Approach. Foods 2020, 9, 355. [Google Scholar] [CrossRef] [PubMed] [Green Version]
  97. Meullenet, J.-F.; Xiong, R.; Findlay, C.J. Multivariate and Probabilistic Analyses of Sensory Science Problems; John Wiley & Sons: Hoboken, NJ, USA, 2008; ISBN 978-0-470-27631-0. [Google Scholar]
Figure 1. Individual differences in scale usage (based on [13]).
Applsci 11 11977 g001
Figure 2. Classical four-way data structure of sensory data (based on [13]).
Applsci 11 11977 g002
Figure 3. The workflow of the PanelCheck [13].
Applsci 11 11977 g003
Table 1. Method and software developments in assessor and sensory panel performance evaluation.
Panelist or PanelPanel Performance ParameterStatistical Method/PlotSoftwareReferences
Panelist and panelDiscriminationANOVA1 (Fisher’s F)PanelCheck *[57,58]
AgreementCPCA2 (Tucker-1), Kendall’s τ (Eggshell)
ConsensusPCA3 (Manhattan)
RepeatabilityMSE4
Repeatability and Discriminationp * MSE
Panelist and panelDiscriminationANOVA1MAM-CAP *[55,56]
AgreementANOVA1
RepeatabilityRMSE5TimeSens
ScalingANOVA1
Panelist and panelRepeatabilityh6, k7S-Plus 2000[59]
Reproducibility
Panelist and panelDiscriminationANOVA1SensoMineR * and FactoMineR *[60,61]
Agreement
Repeatability
PanelReproducibilityMFA8FactoMineR *[60,61]
Panelist and panelDiscriminationANOVA1SAS macro[62]
Agreement
Repeatability
PanelistDiscriminationANOVA1SenPAQ[63]
AgreementANOVA1XLSTAT[64]
RepeatabilityRMSE5Fizz[65]
PanelistResponse accuracyfrequency countsCompusense[66]
DT 9, ADT 10
Panelist and panelAccuracyICC11
Cronbach’s α
R-code *[67]
Validity[68]
Reliability[69]
Panelist and panelAgreementCSM12R-code *[51]
(Consensus)Poincaré plot
Panelist and panelConsistencyGCAP13Excel macro[70]
Reliability[71]
PanelDiscriminationCVA14CVApack *[72]
PanelistAgreementANOVA1SAS macro PANMODEL[47]
Scaling
Sensitivity
PanelAgreementCLV3W15ClustVarLV *[73]
Panelist and panelAgreementSRD16Excel macro[74]
PanelReproducibilityCVr%17Excel macro[75]
Panelist and panelDiscriminationPCA3R-project *[49,61]
Agreement
Repeatability
Panelist and panelDiscriminationANOVA1CompuSense[76]
Panelist and panelDiscriminationANOVA1SAS macro GRAPES[77]
Agreement
Repeatability
PanelAgreementRV18CompuSense[78]
[79]
RepeatabilityNRV19
Panelist and panelRepeatabilityRMSE5 control chartSAS[80]
PanelAgreementMC simulation with PCA 3R-project *[81]
Panelist and panelAgreementPARAFAC20MATLAB
N-way Toolbox
[82]
[14]
Sensitivity
Consistency
PanelPredictive abilityN-PLS21Unscrambler[14]
PanelistAgreementPCAR-project *[83]
PANCA22
Panelist and panelAgreementGPA 23CompuSense[76,84]
DiscriminationGPA23
Scale usageFCM24
RepeatabilityMSE4
DiscriminationANOVA1
PanelistAgreement (Consonance)VAF25CONS[83]
C26
Panelist and panelDiscriminationG27
Φ 28
Excel Macro[85]
Agreement
Repeatability
Panelist and panelDiscriminationANOVA1PanelCheck 2010 *[86]
AgreementRV16RV229
RepeatabilityRV16RV229
Panelist and panelAgreement (Consonance)Cronbach’s αSPSS[21]
Repeatability
Reproducibility
1 ANOVA: Analysis of variance; 2 CPCA: Consensus Principal Component Analysis; 3 PCA: Principal Component Analysis; 4 MSE plot: Mean Squared Error plot; 5 RMSE: Root Mean Square Error; 6 h: Mandel’s repeatability measure; 7 K: Mandel’s reproducibility measure; 8 MFA: Multiple factor analysis; 9 DT: distance from target; 10 ADT: adjusted distance from target; 11 ICC: Intraclass correlation coefficient; 12 CSM: Complex Self-similarity Measure; 13 GCAP: Gravity Centre and Area/Perimeter; 14 CVA: Canonical Variate Analysis; 15 CLV3W: Clustering latent variables (three-way data); 16 SRD: Sum of ranking differences; 17 CVr%: Robust Coefficient of Variation, 18 RV: Regression Vector; 19 NRV: Normalized regression vector; 20 PARAFAC: Parallel factor analysis; 21 N-PLS: N-way Partial Least Squares; 22 PANCA: Panel concordance analysis; 23 GPA: Generalized Procrustes analysis; 24 FCM: Feedback Calibration Method; 25 VAF: Variance Accounted For; 26 C: Consonance; 27 G: reliability (generalizability) coefficient, univariate quality index; 28 ϕ: coefficient, focus on the absolute scores produced by the panel; 29 RV2: modified Regression Vector coefficient; * open-source software.
Publisher’s Note: MDPI stays neutral with regard to jurisdictional claims in published maps and institutional affiliations.

