
Bert-Based Latent Semantic Analysis (Bert-LSA): A Case Study on Geospatial Data Technology and Application Trend Analysis

 ,
,  ,
,  , and
, and
Abstract
:1. Introduction
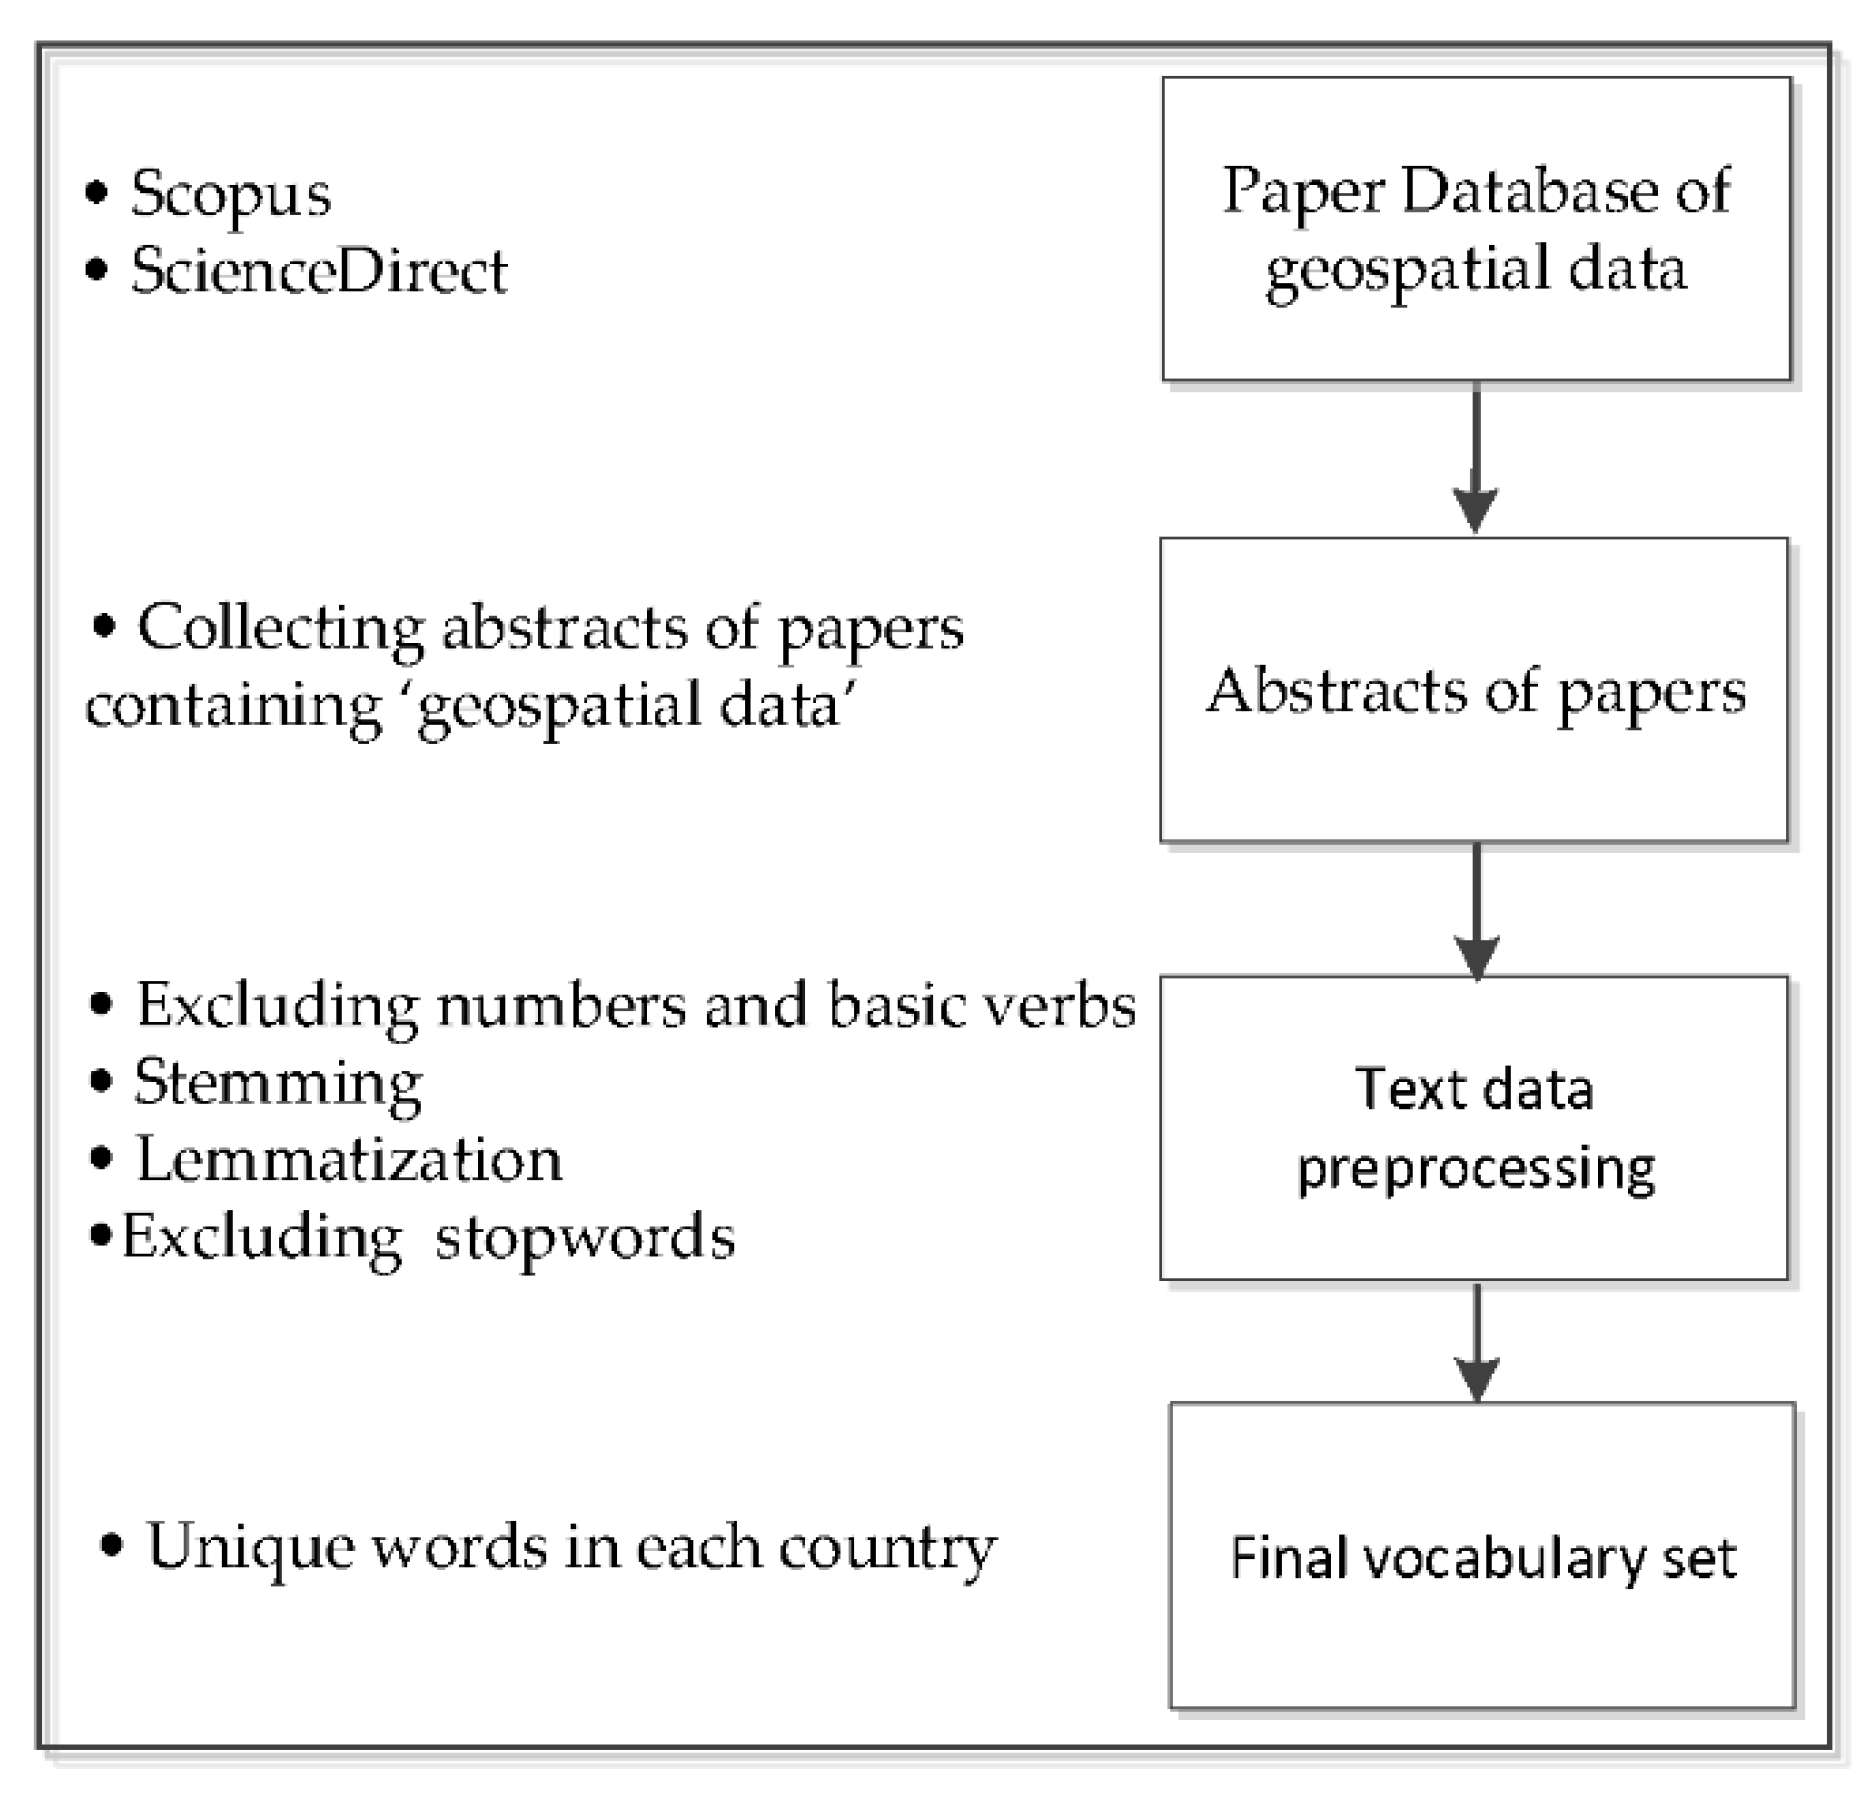
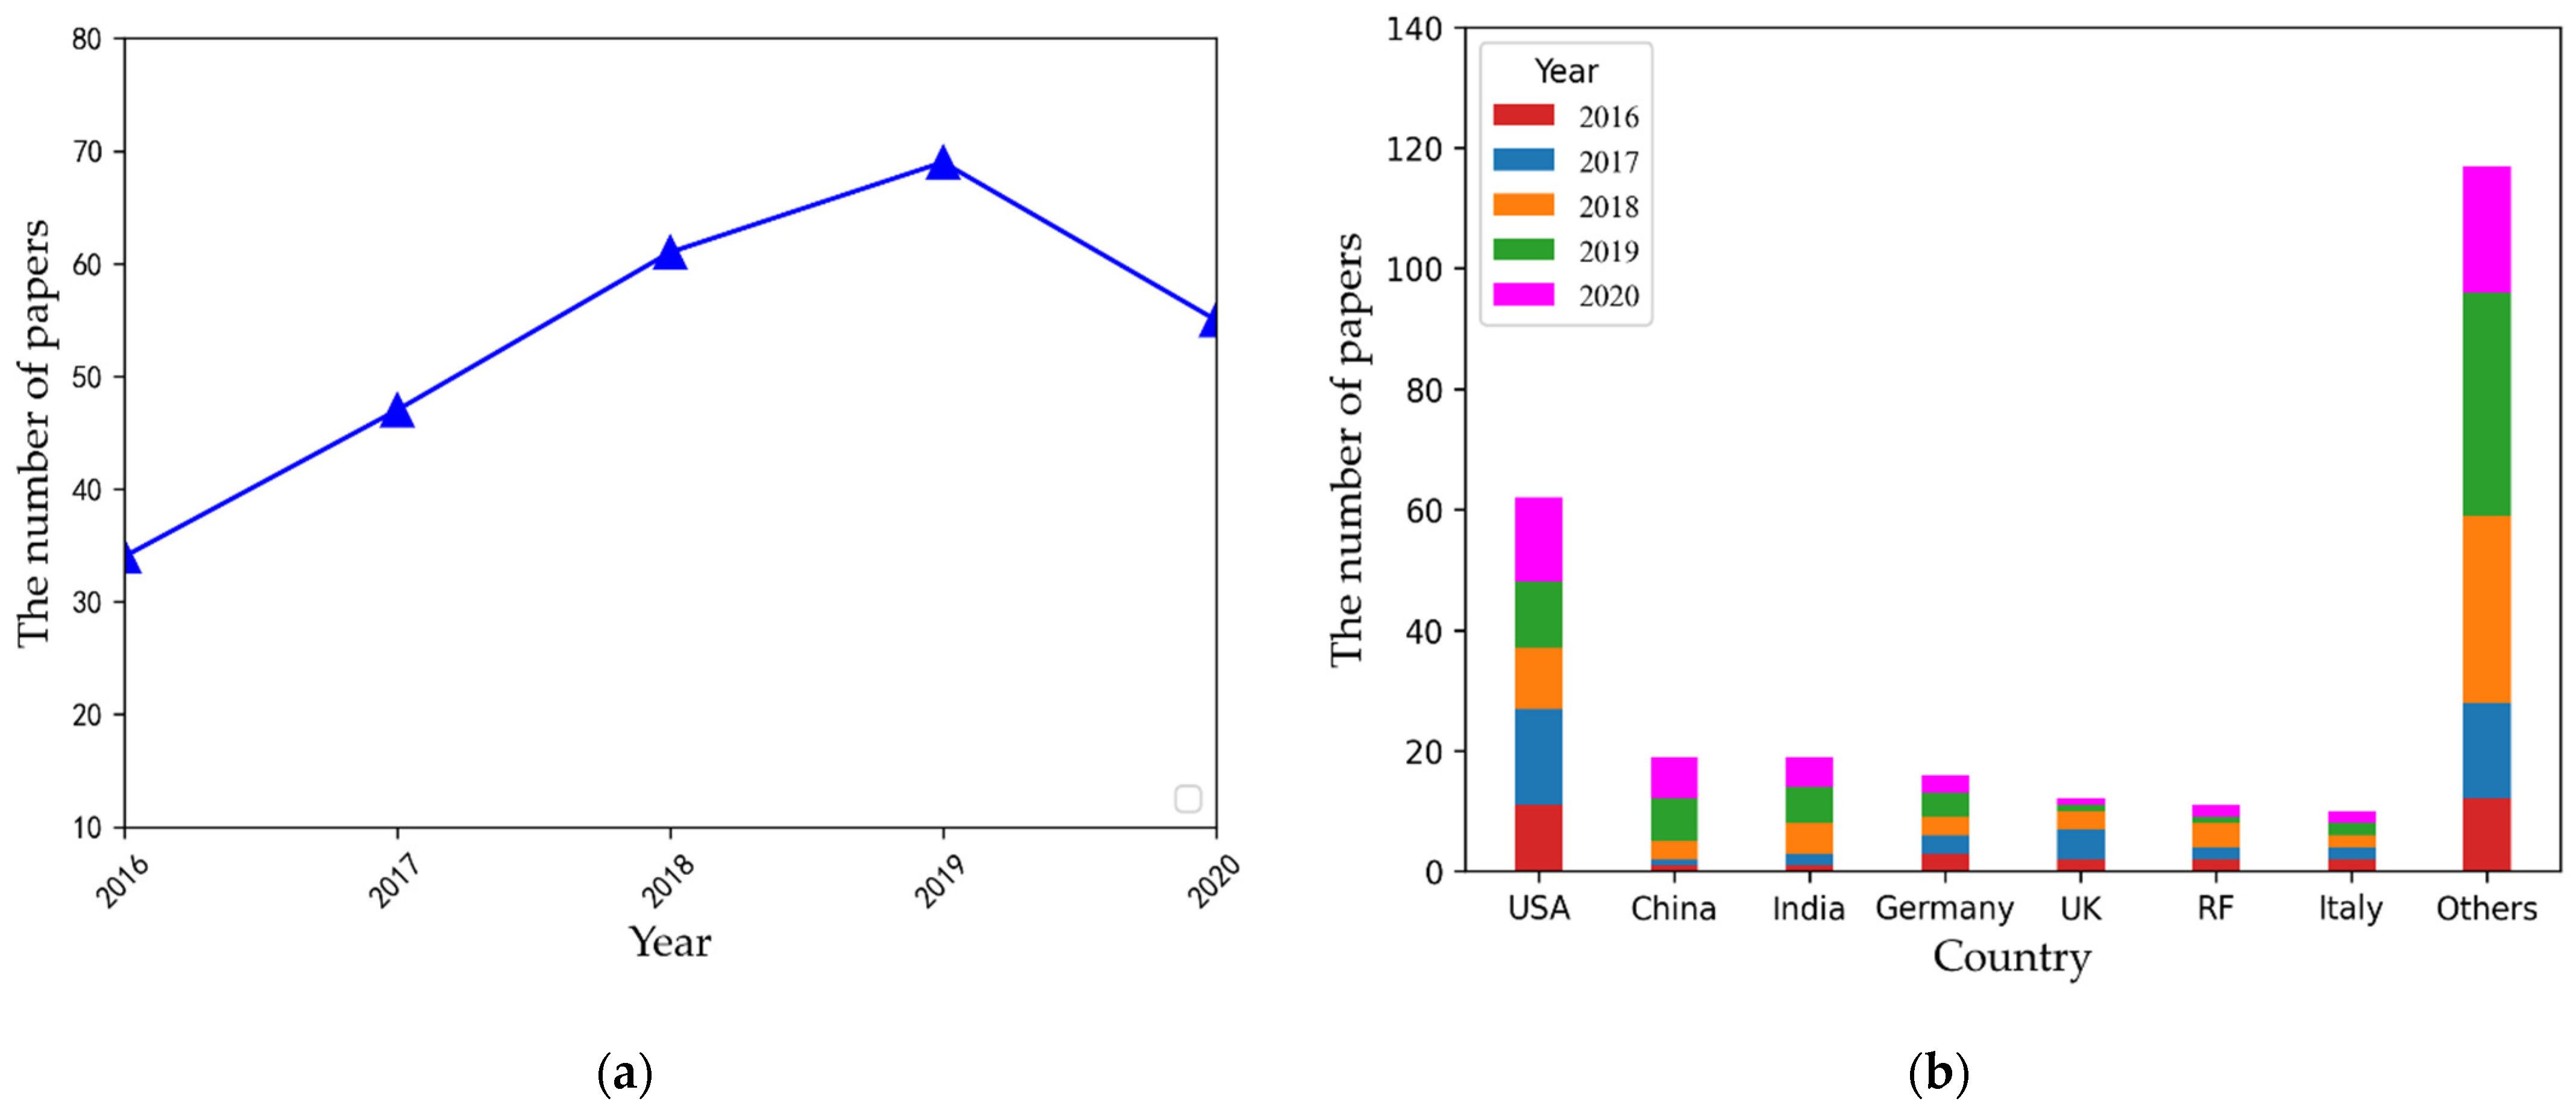
2. Materials
3. Methodology
3.1. Overall Framework
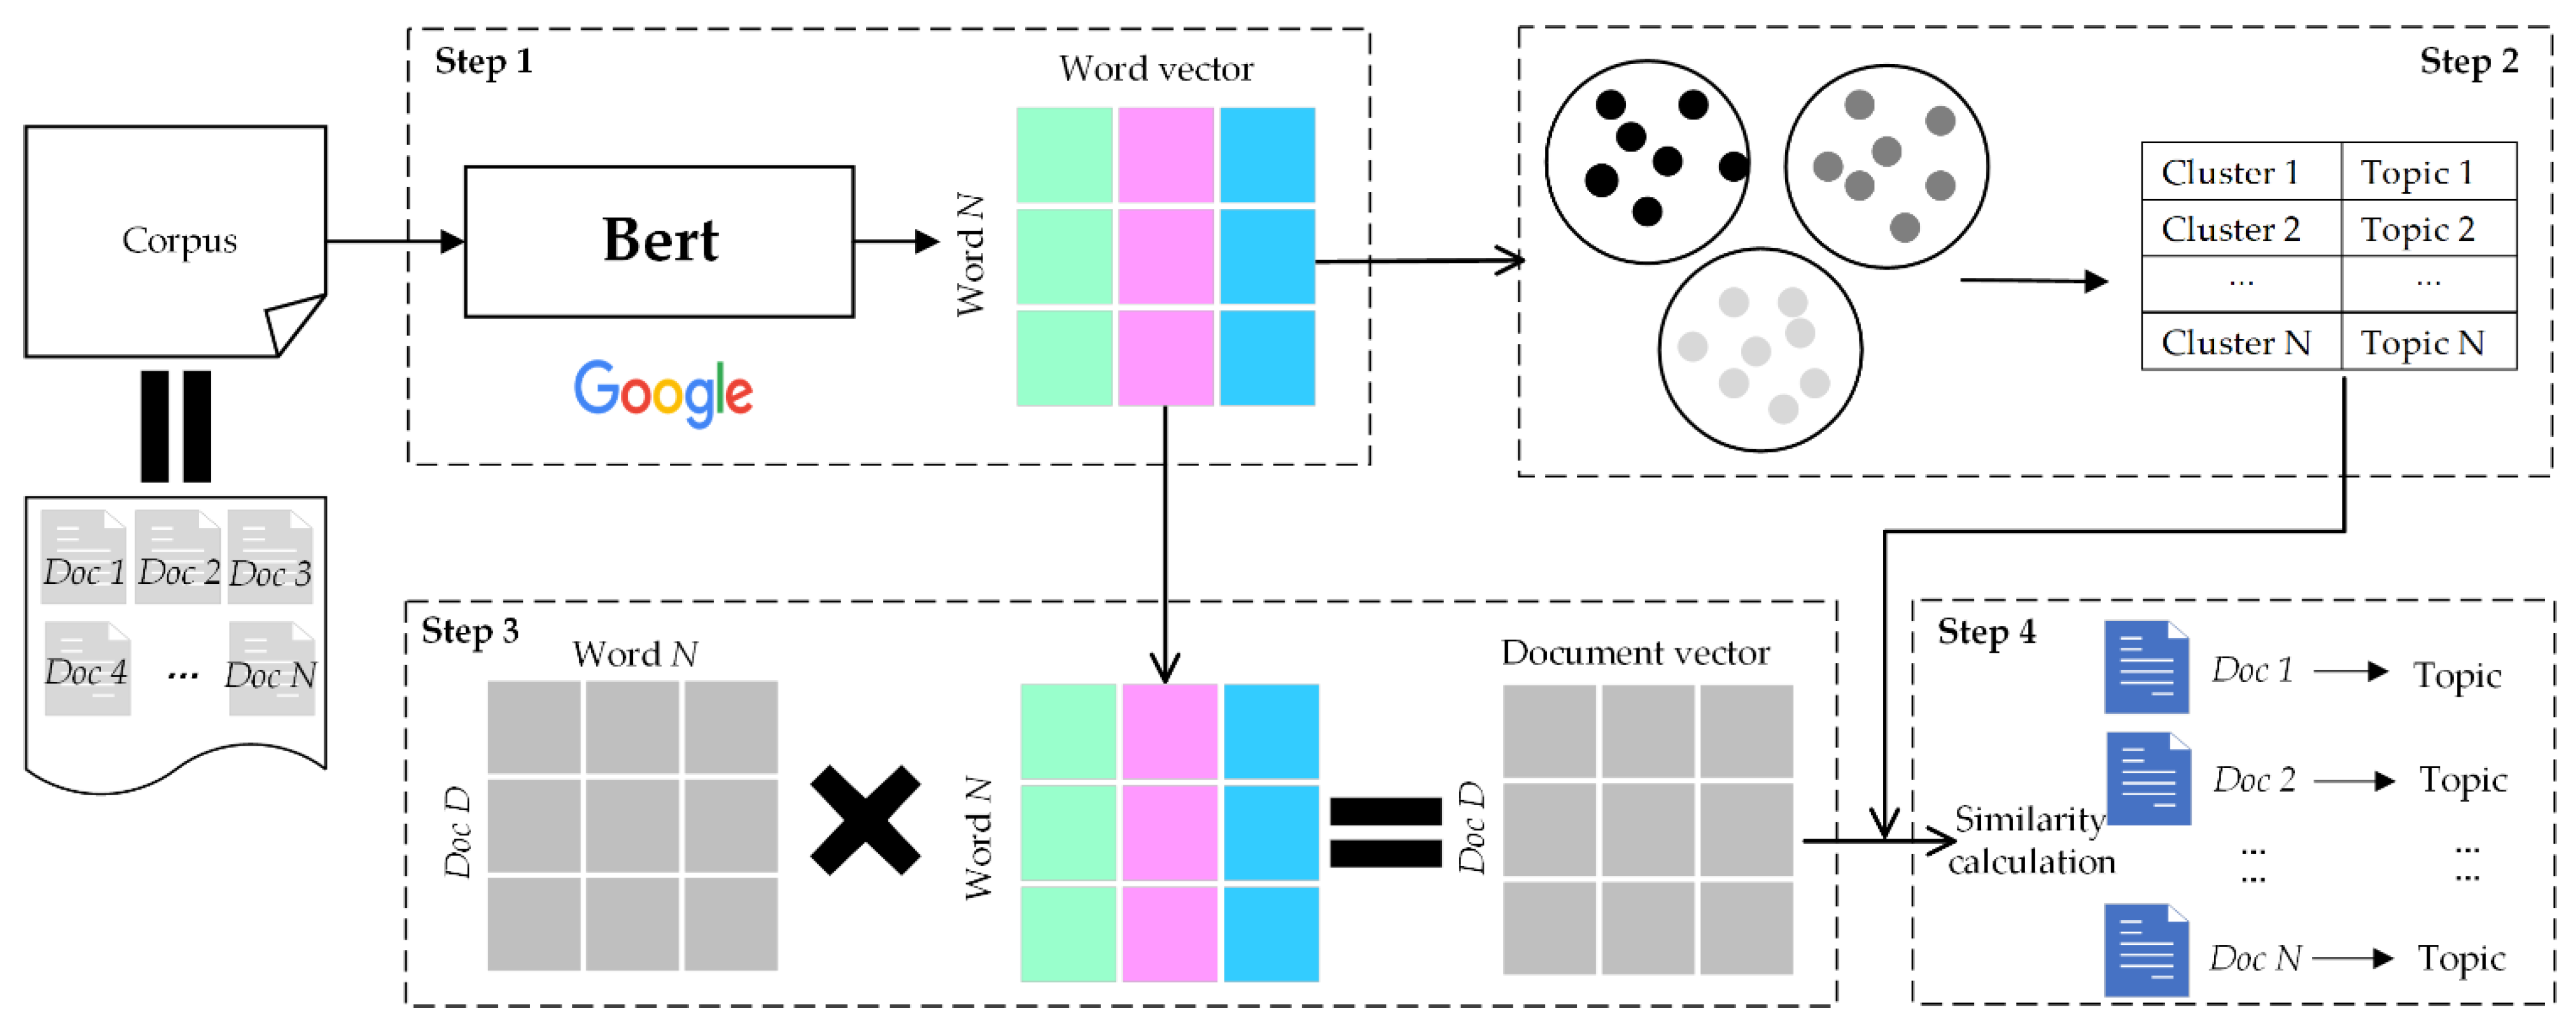
- Step 1: All documents are taken as corpus, and the m-dimensional word vector corresponding to the documents is obtained by the Bert model, which is denoted as , where is the word vector and is the m-dimensional vector space. Note that here the word vectors are obtained after the documents are processed as inputs into the Bert model, rather than being directly obtained from the pre-trained model.
- Step 2: All vectorized words undergo spherical k-means clustering, which first initializes the centroid according to the K value, and then calculates the spherical distance from each word vector to the centroid. According to the distance value, will be assigned to different categories, which will be iterated until convergence. Finally, K clusters are obtained, each of which is called a topic.
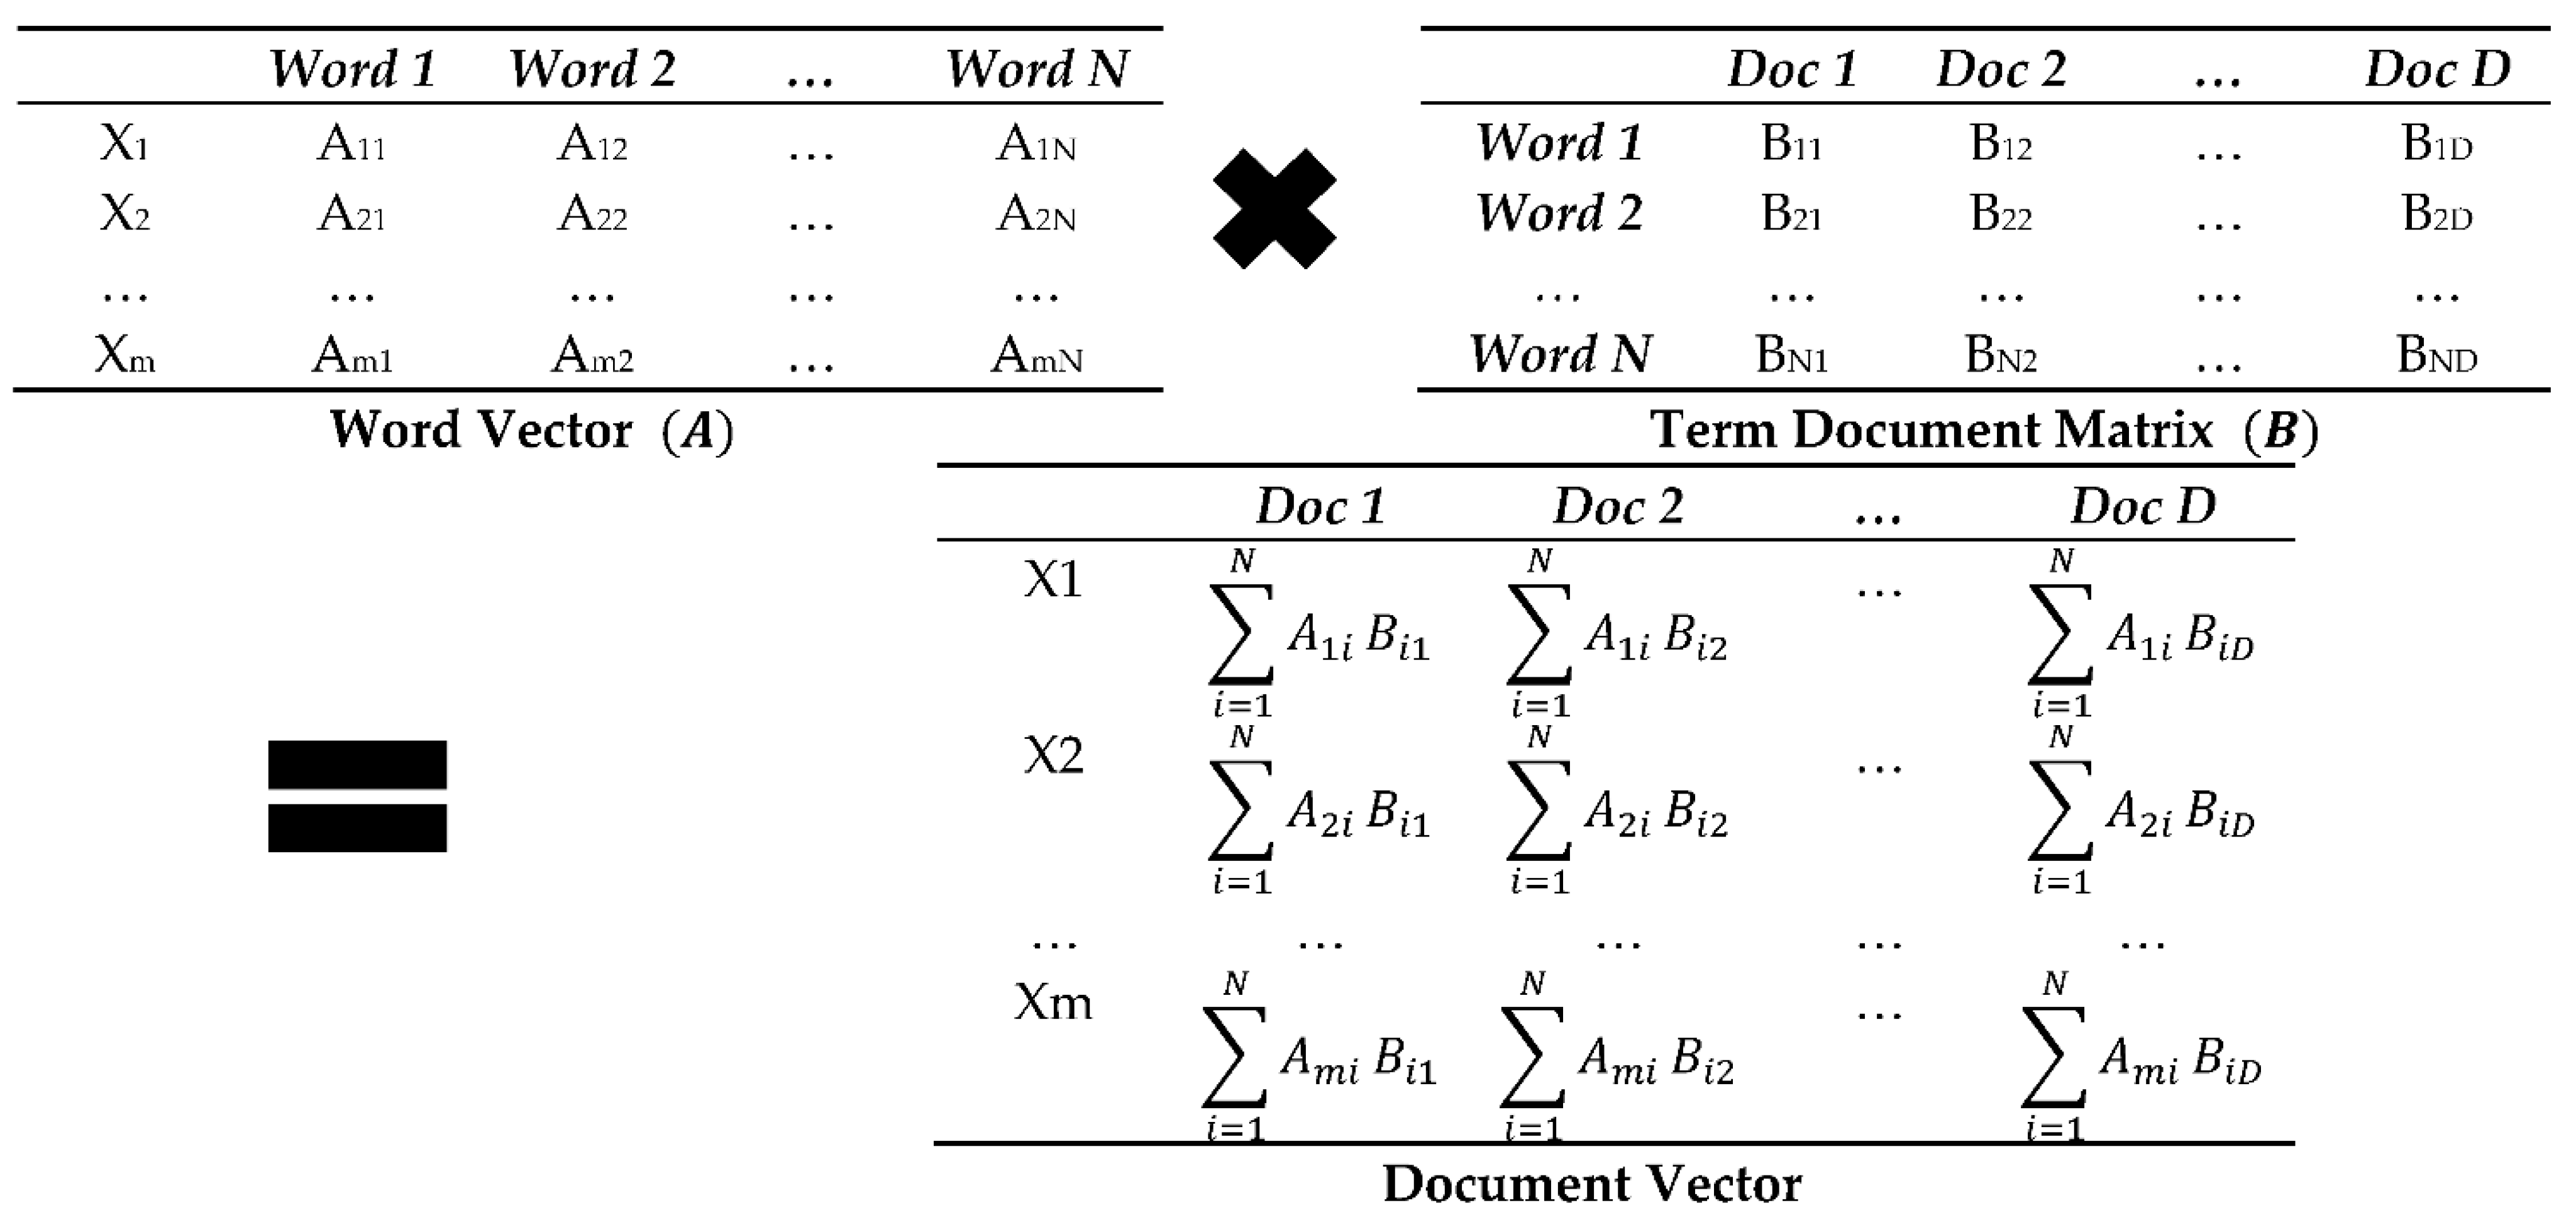
- Step 3: The graphical representation of the generation method for each particular document vector , , is shown in Figure 4, which is obtained by multiplying the m-dimensional vector of all words in the corpus with the term document matrix , where is the number of words in the corpus and is the number of documents. See Section 3.4 for details.
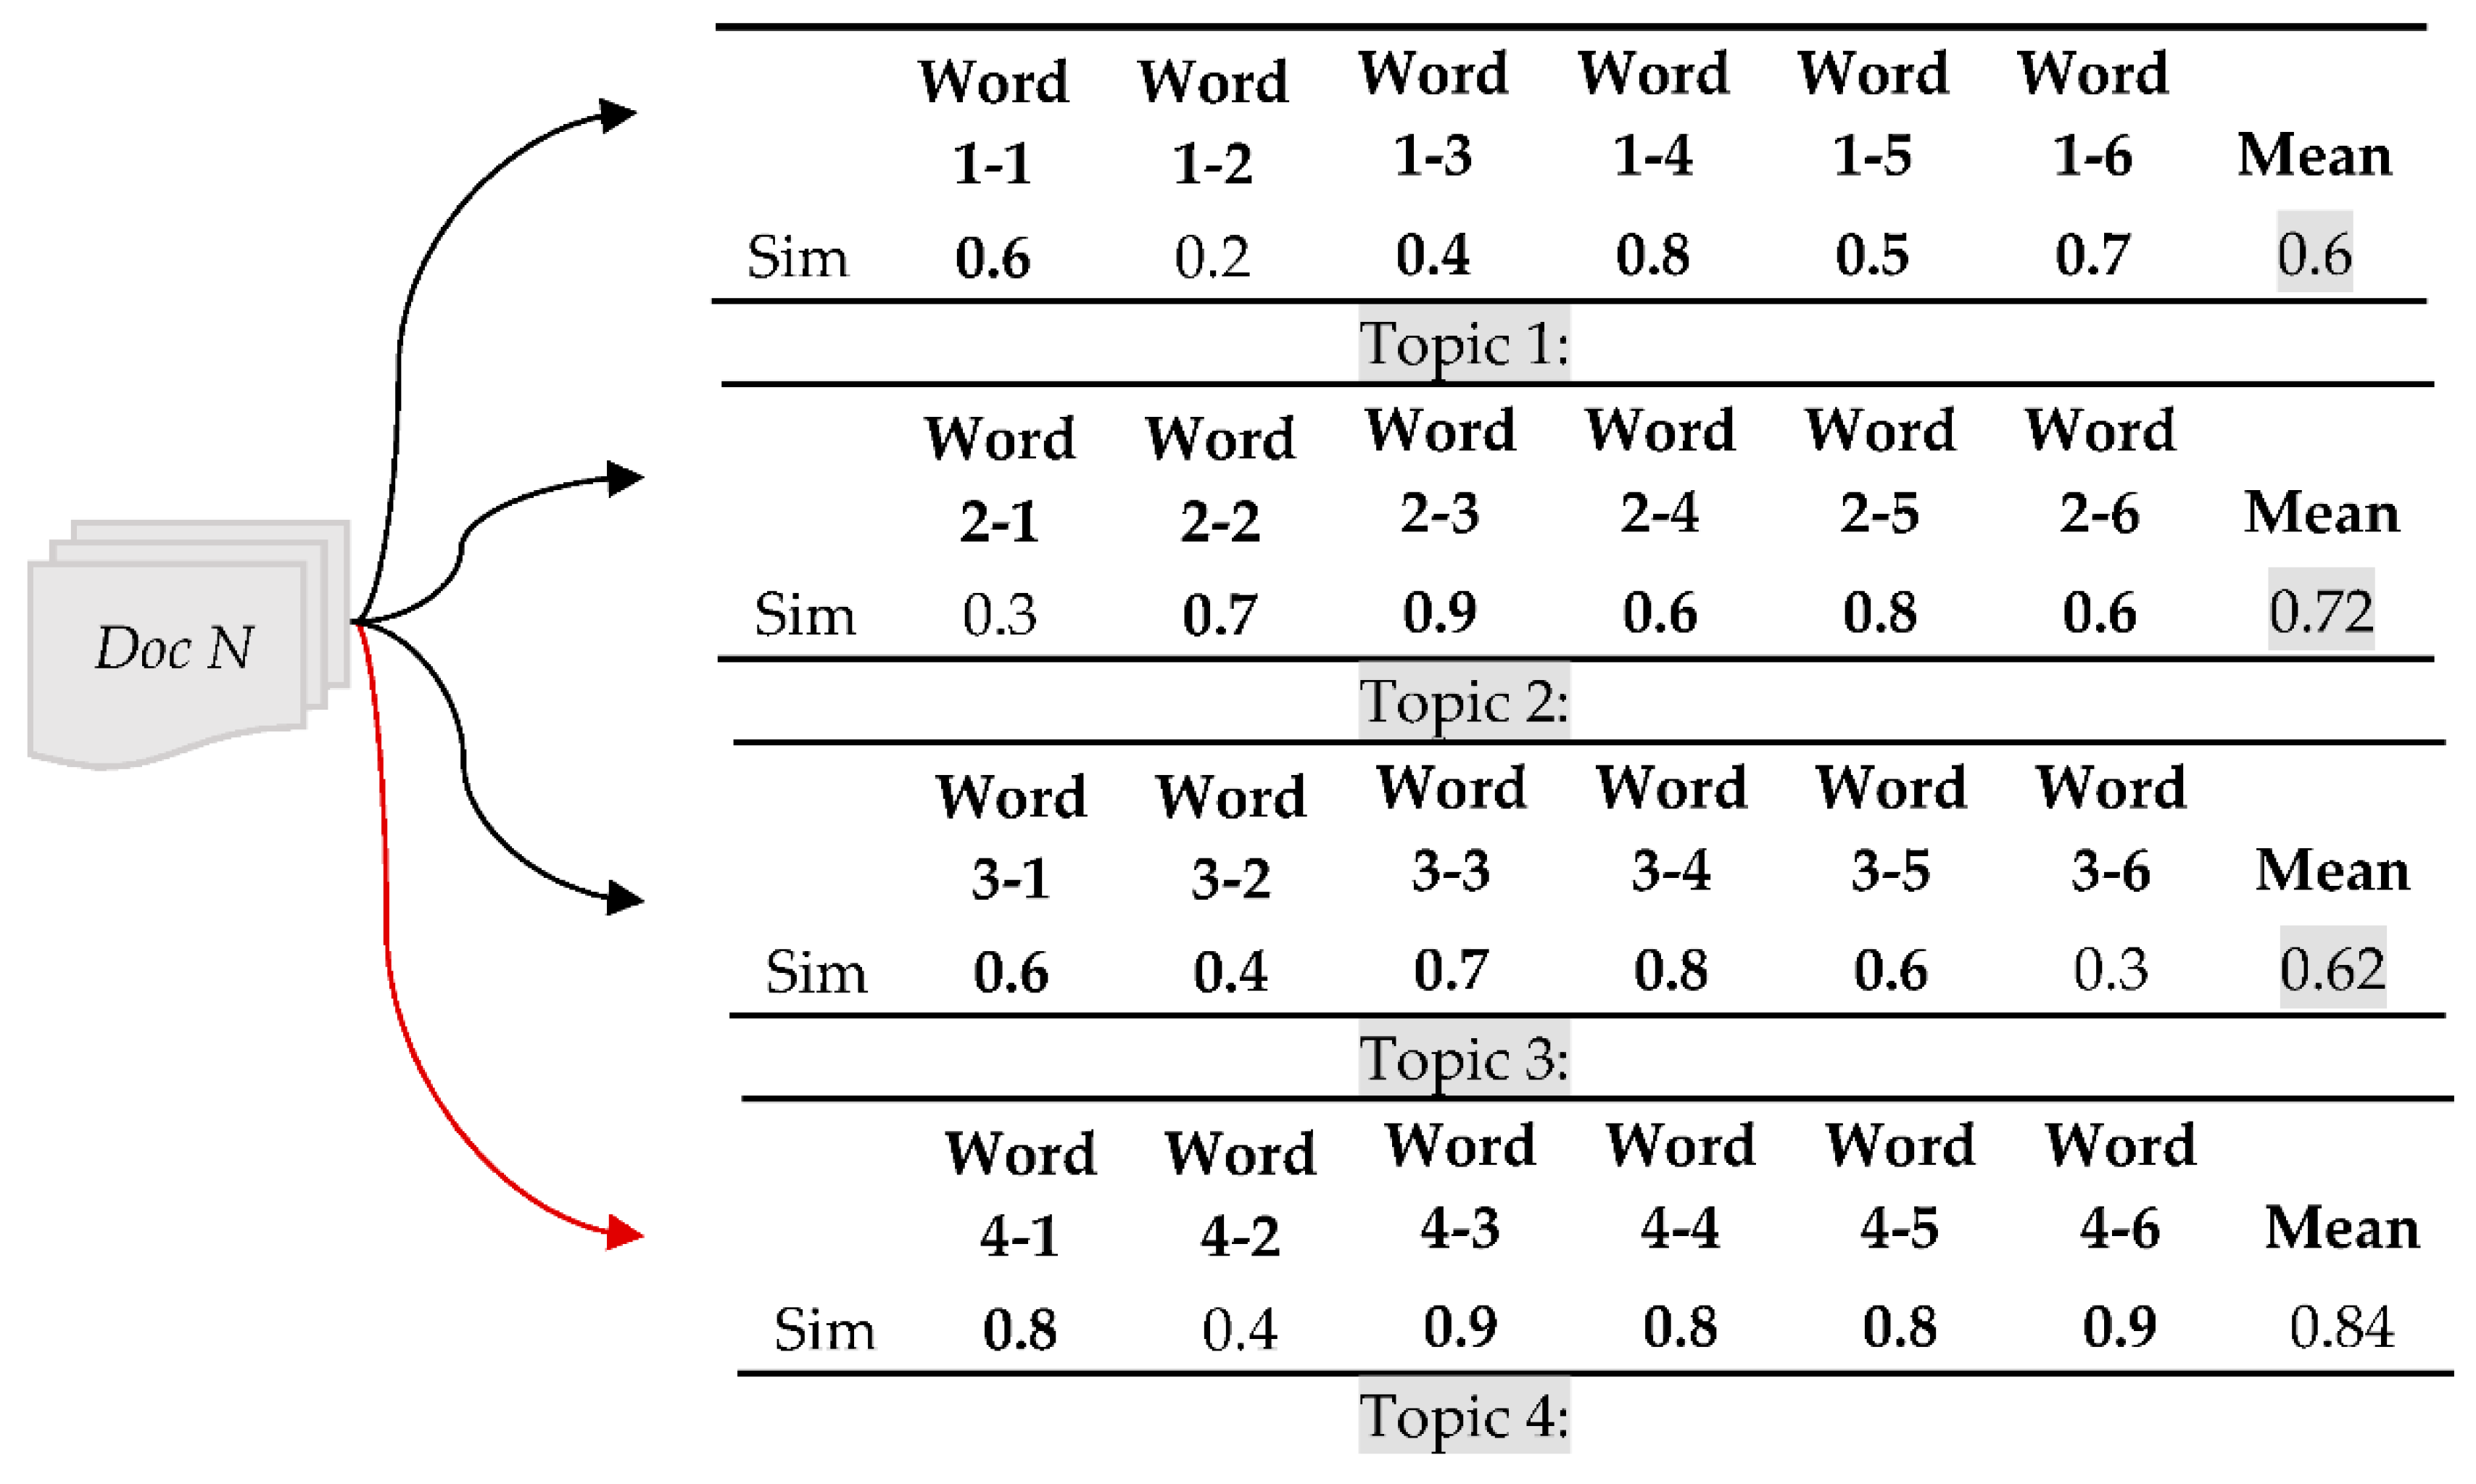
- Step 4: Figure 5 depicts the process of document topic generation. The cosine distance between each document and the word vector contained in each topic in Step 2 is calculated in turn, and each document is assigned to a different topic by using a topic assignment method. See Section 3.5 for details.
3.2. Word Vector Generation Based on Bert
3.3. Spherical k-Means Clustering
3.4. Example of Document Vector Generation
3.5. Method of Document Topic Determination
4. Trend Analysis Based on Bert_LSA
4.1. Topic Selection
4.2. The Result of Trend Analysis
5. Quantitative Evaluation
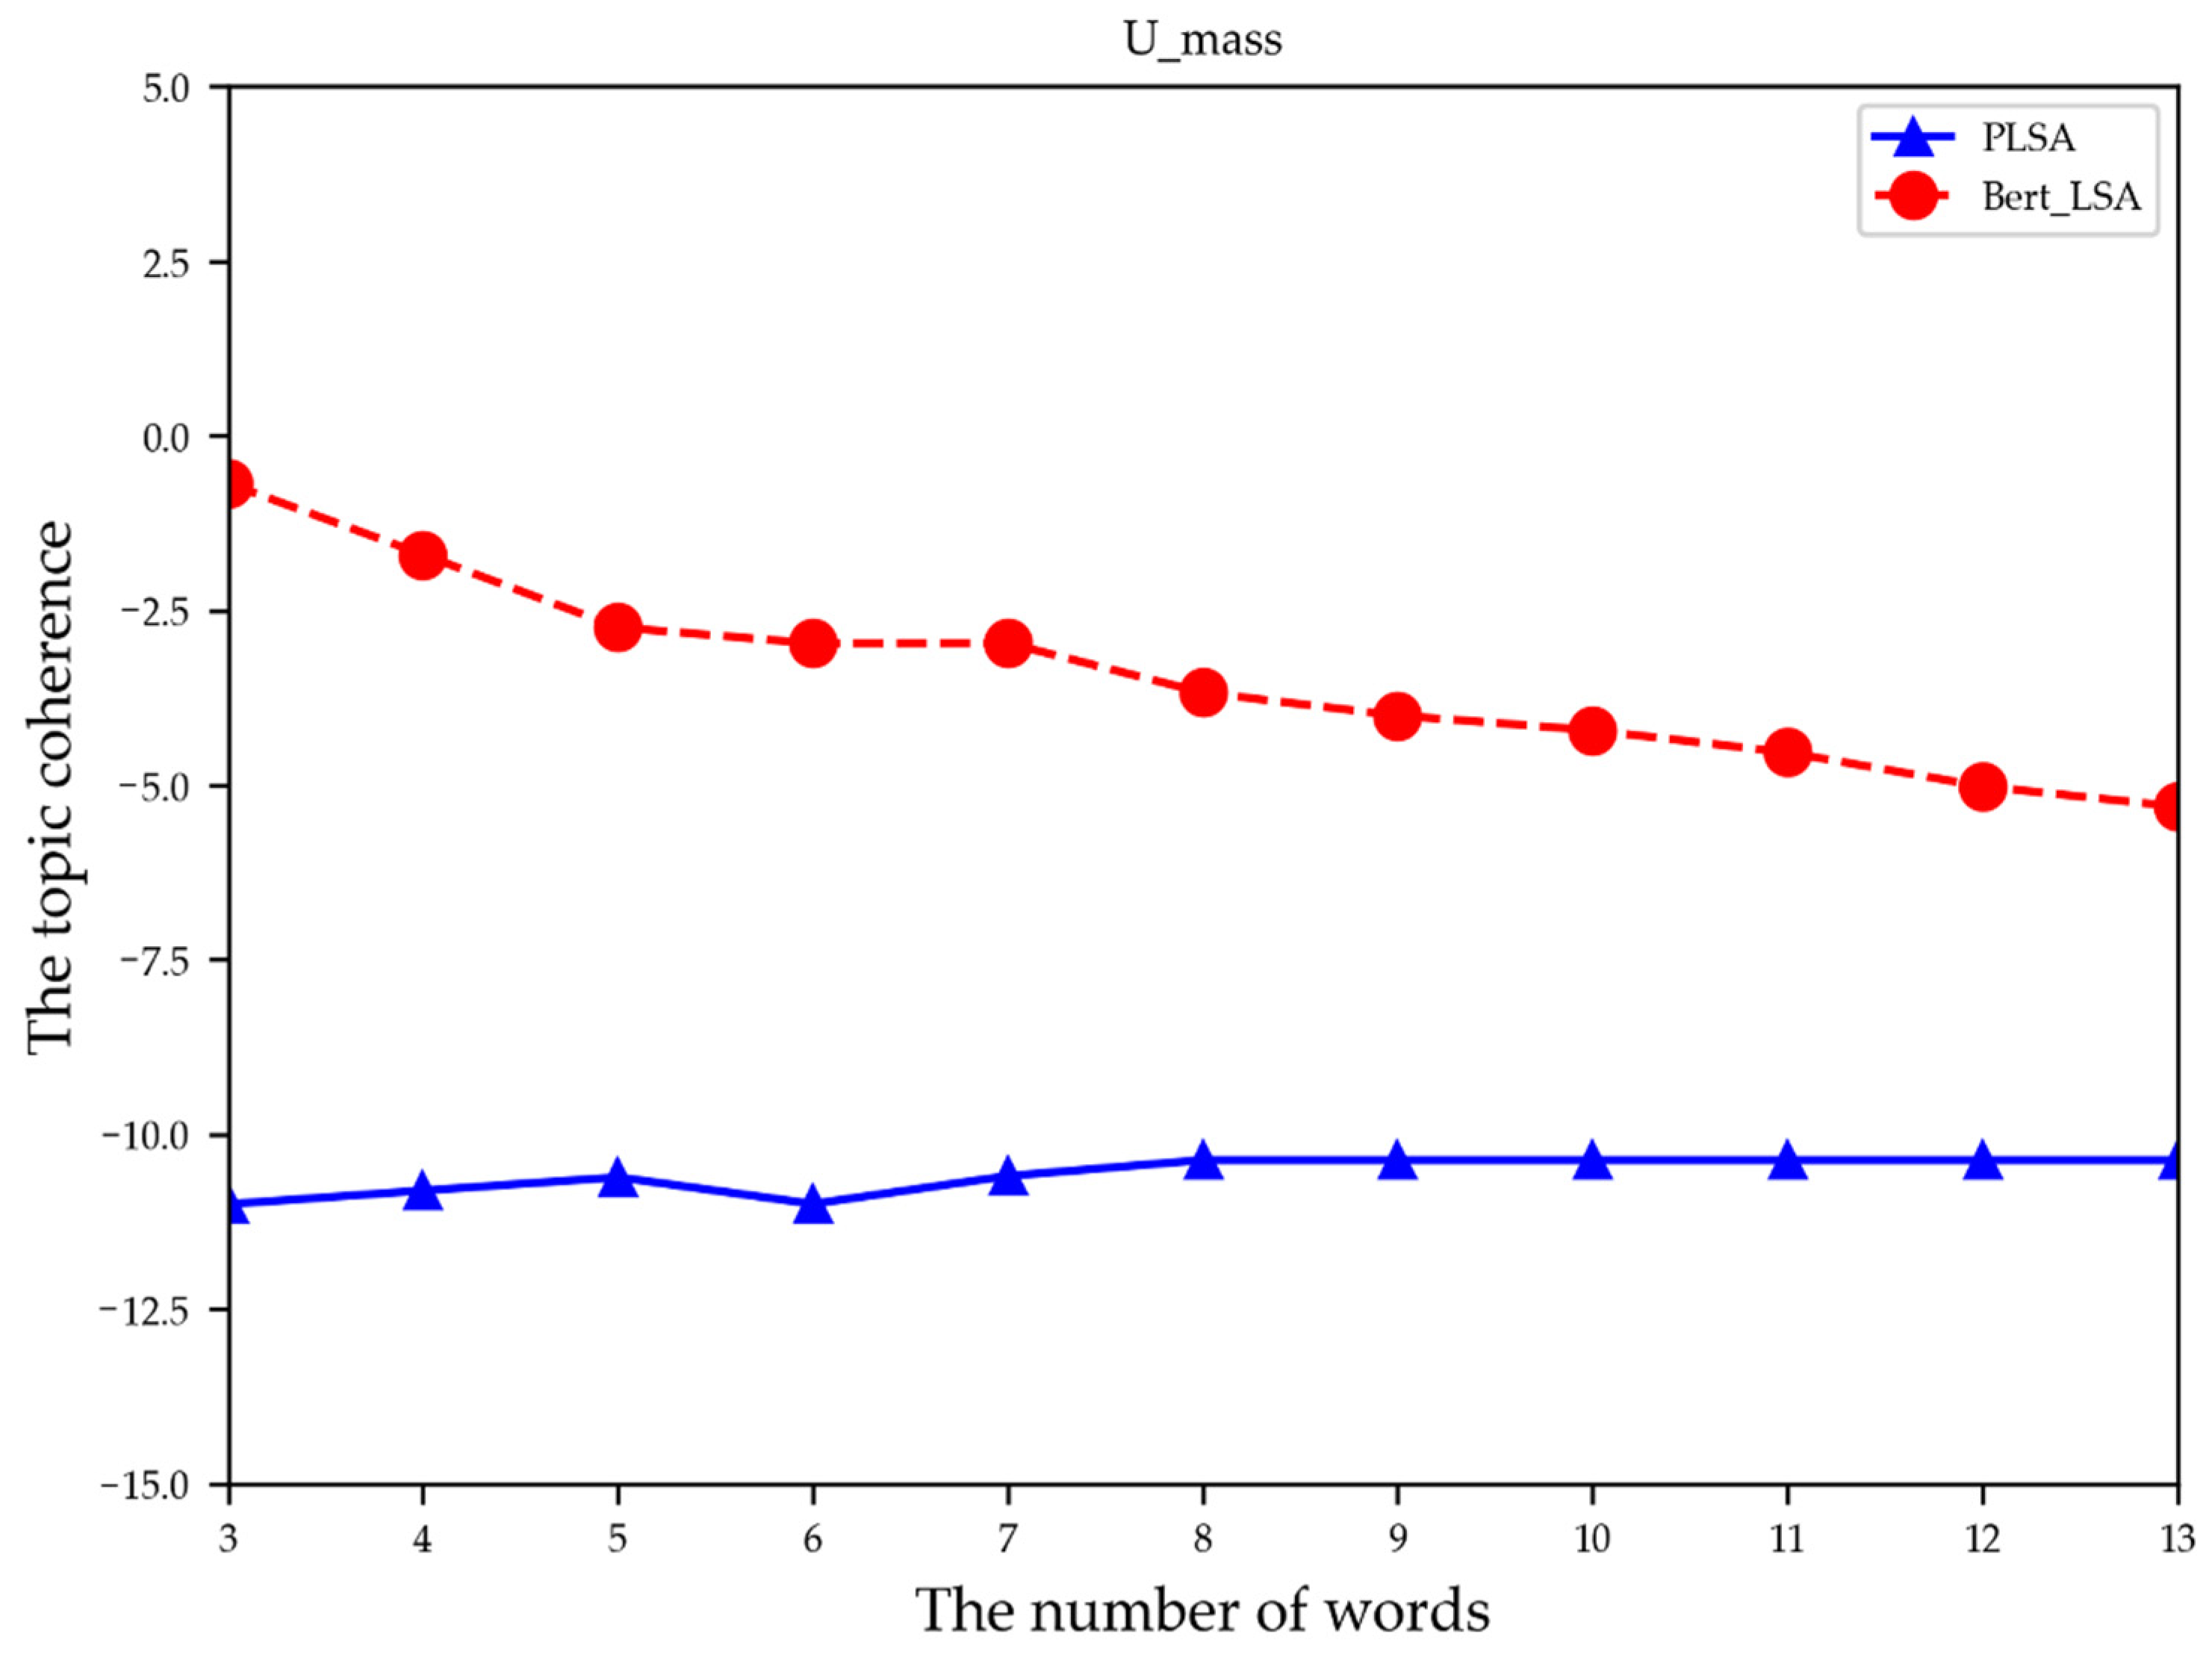
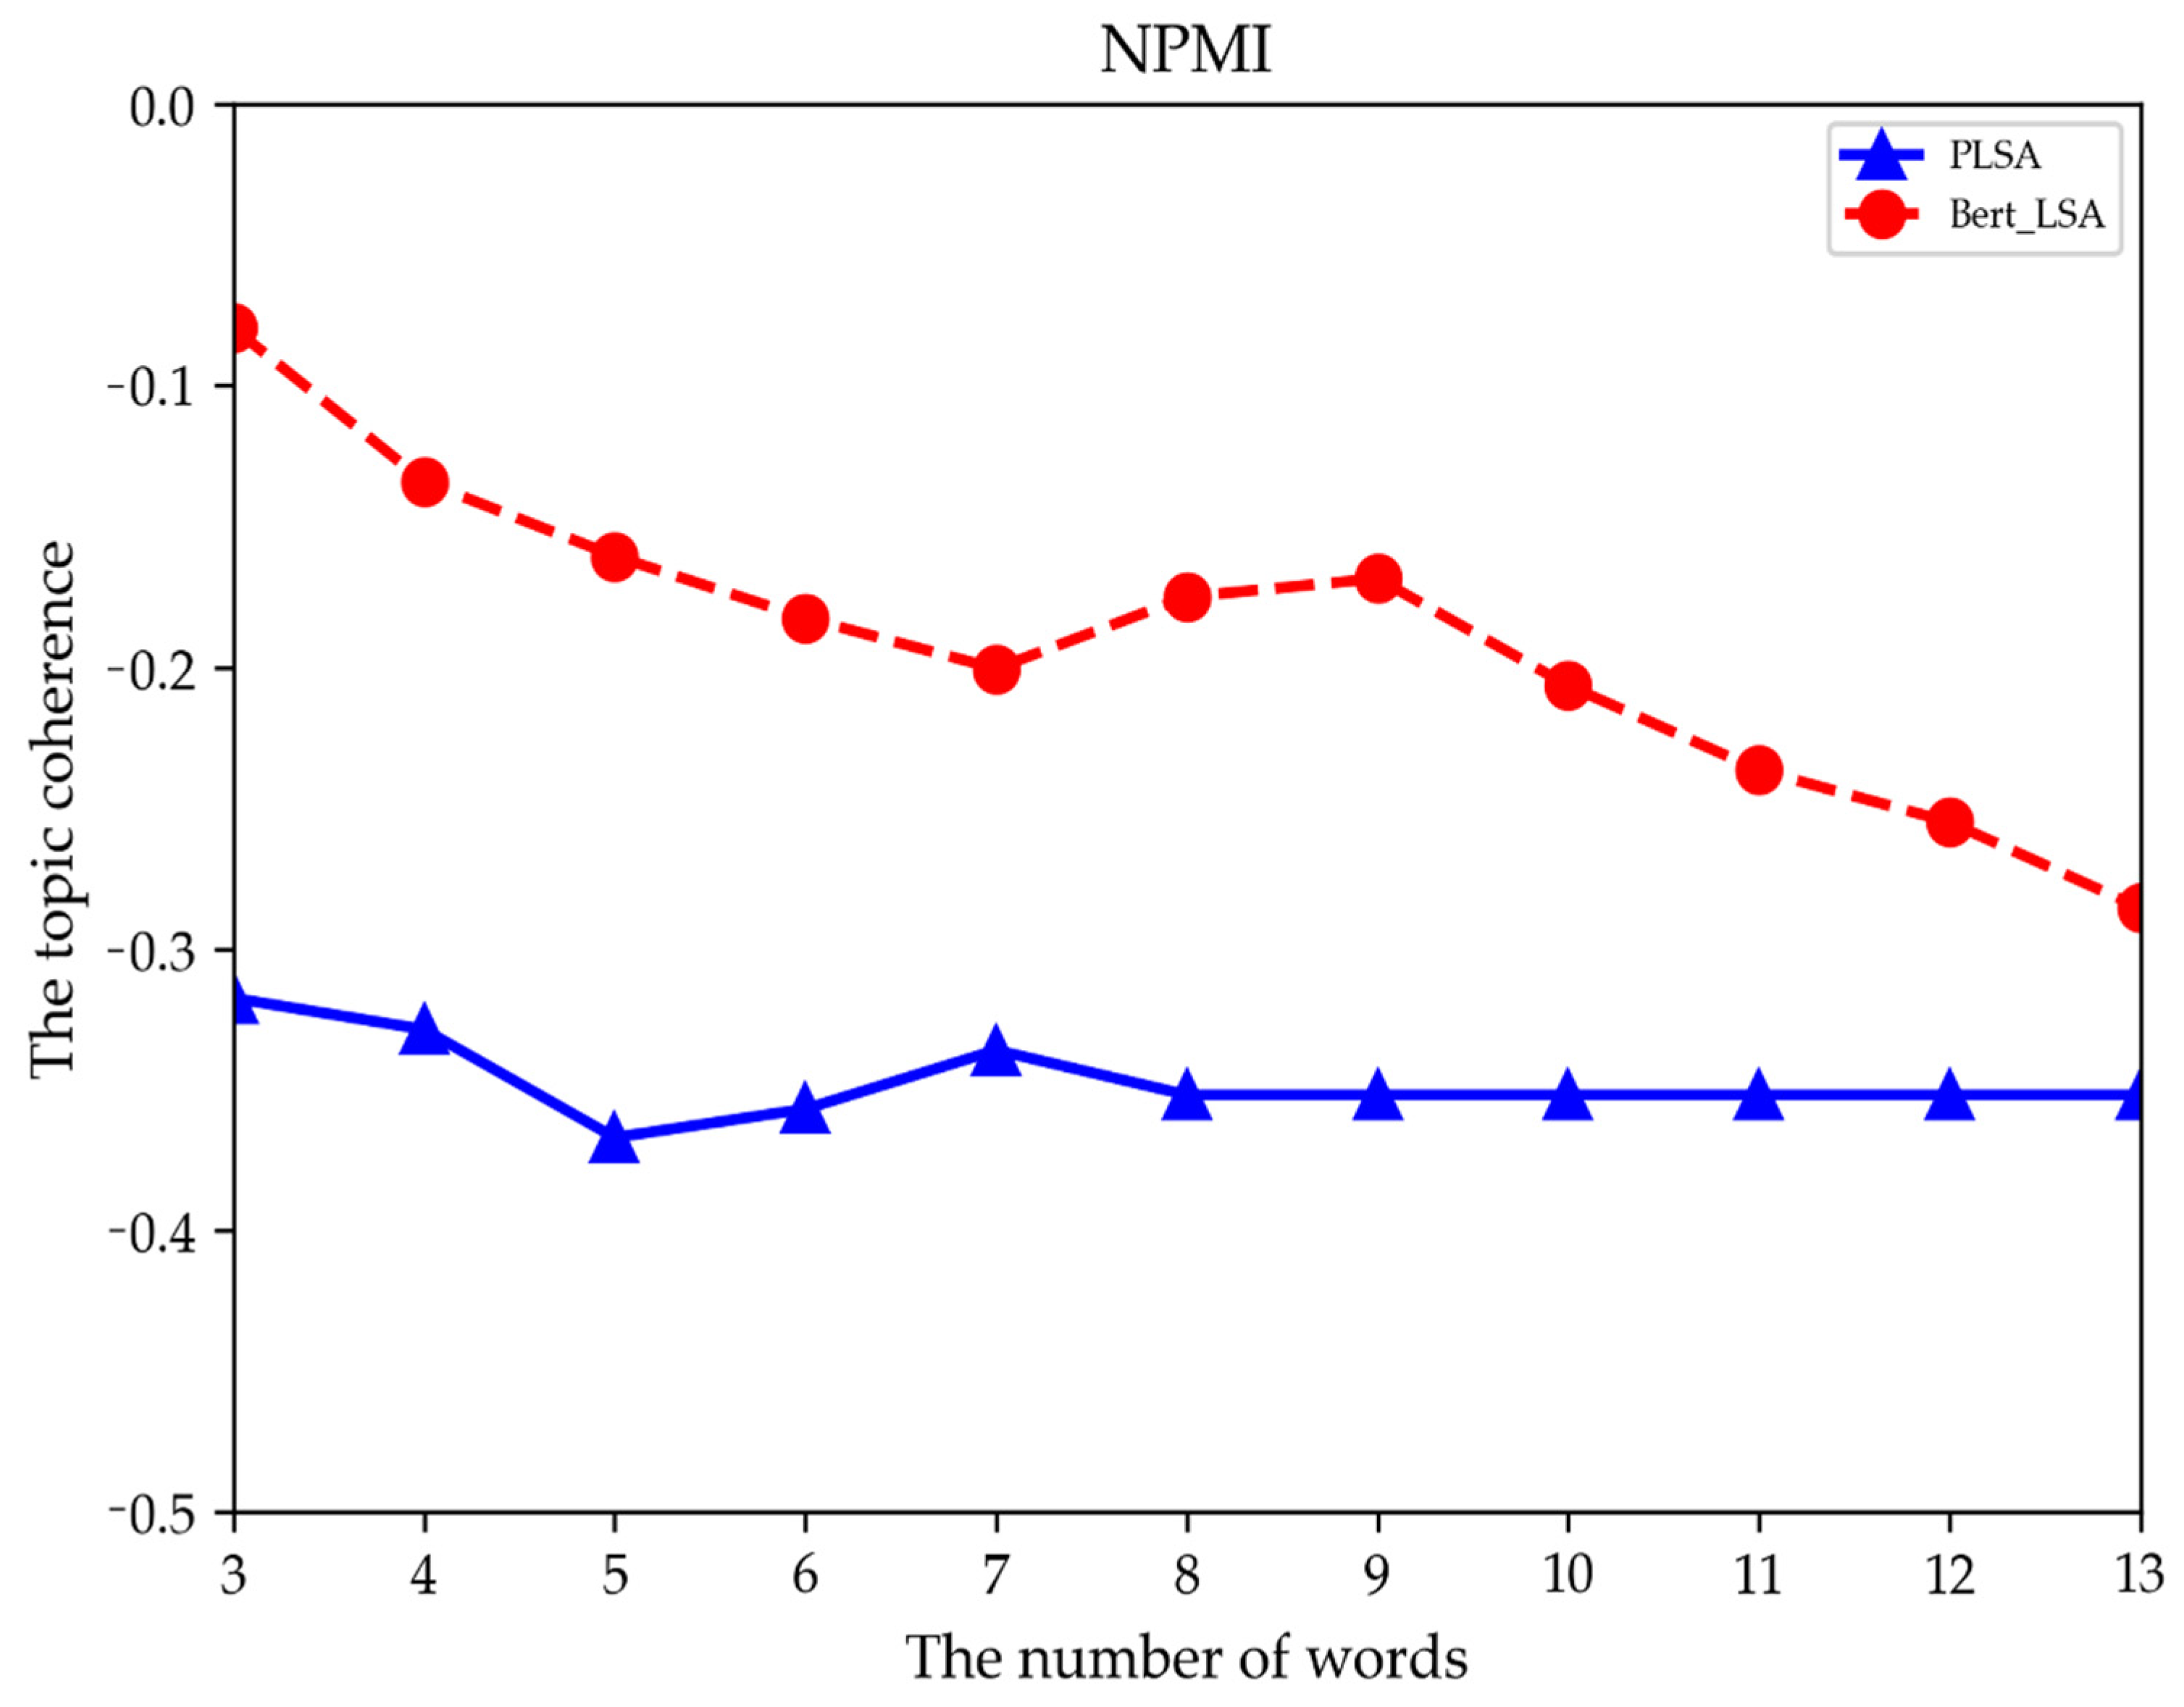
5.1. Evaluation Method
5.2. Evaluation Result
6. Conclusions and Discussion
Author Contributions
Funding
Institutional Review Board Statement
Informed Consent Statement
Data Availability Statement
Conflicts of Interest
References
- Lu, Y.; Zhai, C.X. Opinion Integration through Semi-Supervised Topic Modeling. In Proceedings of the 17th International Conference on World Wide Web, Beijing, China, 21–25 April 2008; pp. 121–130. [Google Scholar]
- Li, F.; Li, M.; Guan, P.; Ma, S.; Cui, L. Mapping publication trends and identifying hot spots of research on Internet health information-seeking behavior: A quantitative and co-word biclustering analysis. J. Med. Internet Res. 2015, 17, e81. [Google Scholar] [CrossRef] [PubMed]
- Ying, D. Community detection: Topological vs. Topical. J. Informetr. 2011, 5, 498–514. [Google Scholar]
- Chen, X.; Wang, S.; Tang, Y.; Hao, T. A bibliometric analysis of event detection in social media. Online Inf. Rev. 2019, 43, 29–52. [Google Scholar] [CrossRef]
- Jacobi, C.; Atteveldt, W.V.; Welbers, K. Quantitative analysis of large amounts of journalistic texts using topic modelling. Digit. J. 2016, 4, 89–106. [Google Scholar] [CrossRef]
- Alami, N.; Meknassi, M.; En-Nahnahi, N.; Adlouni, Y.E.; Ammor, O. Unsupervised Neural Networks for Automatic Arabic Text Summarization Using Document Clustering and Topic modeling. Expert Syst. Appl. 2021, 172, 114652. [Google Scholar] [CrossRef]
- Chertow, M.R.; Kanaoka, K.S.; Park, J. Tracking the diffusion of industrial symbiosis scholarship using bibliometrics: Comparing across Web of Science, Scopus, and Google Scholar. J. Ind. Ecol. 2021, 25, 913–931. [Google Scholar] [CrossRef]
- Bornmann, L.; Angeon, F.D.M. Hot and cold spots in the US research: A spatial analysis of bibliometric data on the institutional level. J. Inf. Sci. 2019, 45, 84–91. [Google Scholar] [CrossRef]
- Kivikunnas, S. Overview of process trend analysis methods and applications. In Proceedings of the Erudit Workshop on Applications in Pulp and Paper Industry, Aachen, Germany, 9 September 1998; pp. 395–408. [Google Scholar]
- Song, M.; Kim, S.Y.; Lee, K. Ensemble analysis of topical journal ranking in bioinformatics. J. Assoc. Inf. Sci. Technol. 2017, 68, 1564–1583. [Google Scholar] [CrossRef]
- Hung, J.L. Trends of e-learning research from 2000 to 2008: Use of text mining and bibliometrics. Br. J. Educ. Technol. 2012, 43, 5–16. [Google Scholar] [CrossRef]
- Hung, J.L.; Zhang, K. Examining mobile learning trends 2003–2008: A categorical meta-trend analysis using text mining techniques. J. Comput. High. Educ. 2012, 24, 1–17. [Google Scholar] [CrossRef]
- Kim, H.J.; Jo, N.O.; Shin, K.S. Text Mining-Based Emerging Trend Analysis for the Aviation Industry. J. Intell. Inf. Syst. 2015, 21, 65–82. [Google Scholar] [CrossRef] [Green Version]
- Kim, Y.M.; Delen, D. Medical informatics research trend analysis: A text mining approach. Health Inform. J. 2018, 24, 432–452. [Google Scholar] [CrossRef] [PubMed]
- Terachi, M.; Saga, R.; Tsuji, H. Trends Recognition in Journal Papers by Text Mining. In Proceedings of the 2006 IEEE International Conference on Systems, Man and Cybernetics, Taipei, Taiwan, 8–11 October 2006; IEEE: Taipei, Taiwan, 2006; Volume 6, pp. 4784–4789. [Google Scholar]
- Tseng, Y.H.; Lin, C.J.; Lin, Y.I. Text mining techniques for patent analysis. Inf. Process. Manag. 2007, 43, 1216–1247. [Google Scholar] [CrossRef]
- Kang, H.J.; Kim, C.; Kang, K. Analysis of the Trends in Biochemical Research Using Latent Dirichlet Allocation (LDA). Processes 2019, 7, 379. [Google Scholar] [CrossRef] [Green Version]
- Deerwester, S.; Dumais, S.T.; Furnas, G.W.; Landauer, T.K.; Harshman, R. Indexing by latent semantic analysis. J. Am. Soc. Inf. Sci. 1990, 41, 391–407. [Google Scholar] [CrossRef]
- Guo, A.Z.; Tao, Y. Research and improvement of feature words weight based on TFIDF algorithm. In Proceedings of the 2016 IEEE Information Technology, Networking, Electronic and Automation Control Conference, Chongqing, China, 20–22 May 2016; pp. 415–419. [Google Scholar]
- Li, J.Z.; Fan, Q.N.; Zhang, K. Keyword Extraction Based on tf/idf for Chinese News Document. Wuhan Univ. J. Nat. Sci. 2007, 12, 917–921. [Google Scholar] [CrossRef]
- Mihalcea, R.; Tarau, P. TextRank: Bringing Order into Text. In Proceedings of the 2004 Conference Empirical Methods in Natural Language Processing, Stroudsburg, PA, USA, 25–26 July 2004; pp. 404–411. [Google Scholar]
- Zhang, X.; Wang, Y.; Wu, L. Research on cross language text keyword extraction based on information entropy and TextRank. In Proceedings of the Information Technology, Networking, Electronic and Automation Control Conference, Chengdu, China, 15–17 March 2019; pp. 16–19. [Google Scholar]
- Wei, H.X.; Gao, G.L.; Su, X.D. LDA-based word image representation for keyword spotting on historical Mongolian documents. In Proceedings of the International Conference on Neural Information Processing, Kyoto, Japan, 30 September 2016; pp. 432–441. [Google Scholar]
- Blei, D.M.; Ng, A.Y.; Jordan, M.I. Latent Dirichlet allocation. J. Mach. Learn. Res. 2003, 3, 993–1022. [Google Scholar]
- Hofmann, T. Probabilistic latent semantic analysis. In Proceedings of the Fifteenth Conference on Uncertainty in Artificial Intelligence, Stockholm, Sweden, 30 July 1999; pp. 289–296. [Google Scholar]
- Newman, D.J.; Block, S. Probabilistic topic decomposition of an eighteenth-century American newspaper. J. Am. Soc. Inf. Sci. Technol. 2006, 57, 753–767. [Google Scholar] [CrossRef]
- Xie, P.; Yang, D.; Xing, E. Incorporating word correlation knowledge into topic modeling. In Proceedings of the 2015 Conference of the North American Chapter of the Association for Computational Linguistics: Human Language Technologies, Denver, CO, USA, 31 May–5 June 2015; pp. 725–734. [Google Scholar]
- Yang, Y.; Downey, D.; Boyd-Graber, J. Efficient methods for incorporating knowledge into topic models. In Proceedings of the 2015 Conference on Empirical Methods in Natural Language Processing, Lisbon, Portugal, 17–21 September 2015; pp. 308–317. [Google Scholar]
- Das, R.; Zaheer, M.; Dyer, C. Gaussian LDA for topic models with word embeddings. In Proceedings of the 53rd Annual Meeting of the Association for Computational Linguistics and the 7th International Joint Conference on Natural Language Processing, Beijing, China, 26–31 July 2015; Volume 1, pp. 795–804. [Google Scholar]
- Nguyen, D.Q.; Billingsley, R.; Du, L.; Johnson, M. Improving topic models with latent feature word representations. Trans. Assoc. Comput. Linguist. 2015, 3, 299–313. [Google Scholar] [CrossRef]
- Moody, C.E. Mixing Dirichlet topic models and word embeddings to make lda2vec. arXiv 2016, arXiv:1605.02019. [Google Scholar]
- Callaghan, D.; Greene, D.; Carthy, J.; Cunningham, P. An analysis of the coherence of descriptors in topic modeling. Expert Syst. Appl. 2015, 42, 5645–5657. [Google Scholar] [CrossRef] [Green Version]
- Ding, R.; Nallapati, R.; Xiang, B. Coherence-aware neural topic modeling. Comput. Sci. 2018, arXiv:1809.02687. [Google Scholar]
- Bengio, Y.; Ducharme, R.; Vincent, P.; Jauvin, C. A neural probabilistic language model. J. Ma-Chine Learn. Res. 2003, 3, 1137–1155. [Google Scholar]
- Zhou, Y.; Li, C.; He, S.; Wang, X.; Qiu, Y. Pre-trained contextualized representation for chinese conversation topic classification. In Proceedings of the 2019 IEEE International Conference on Intelligence and Security Informatics (ISI), Shenzhen, China, 1–3 July 2019; IEEE: Piscataway, NJ, USA; pp. 122–127. [Google Scholar]
- Ji, Q.; Pang, X.; Zhao, X. A bibliometric analysis of research on Antarctica during 1993–2012. Scientometrics 2014, 101, 1925–1939. [Google Scholar] [CrossRef]
- Natale, F.; Fiore, G.; Hofherr, J. Mapping the research on aquaculture: A bibliometric analysis of aqua-culture literature. Scientometrics 2012, 90, 983–999. [Google Scholar] [CrossRef]
- Sung, H.Y.; Yeh, H.Y.; Lin, J.K.; Chen, S.H. A visualization tool of patent topic evolution using a growing cell structure neural network. Scientometrics 2017, 111, 1267–1285. [Google Scholar] [CrossRef]
- Qi, Y.; Zhu, N.; Zhai, Y.; Ding, Y. The mutually beneficial relationship of patents and scientific literature: Topic evolution in nanoscience. Scientometrics 2018, 115, 893–911. [Google Scholar] [CrossRef]
- Devlin, J.; Chang, M.W.; Lee, K.; Toutanova, K. BERT: Pre-training of Deep Bidirectional Transformers for Language Understanding. Comput. Sci. 2018, arXiv:1810.04805. [Google Scholar]
- Vaswani, A.; Shazeer, N.; Parmar, N.; Uszkoreit, J.; Jones, L.; Gomez, A.N.; Kaiser, L.; Polosukhin, I. Attention is all you need. In Proceedings of the Advances in Neural Information Processing Systems, Long Beach, CA, USA, 4–9 December 2017; pp. 5998–6008. [Google Scholar]
- Yoo, S.Y.; Jeong, O.R. Automating the expansion of a knowledge graph. Expert Syst. Appl. 2019, 141, 112965. [Google Scholar] [CrossRef]
- Sun, C.; Qiu, X.; Xu, Y.; Huang, X. How to Fine-Tune BERT for Text Classification? In Proceedings of the China National Conference on Chinese Computational Linguistics, Kunming, China, 13 October 201; pp. 194–206.
- Available online: https://storage.googleapis.com/bert_models/2018_10_18/uncased_L-12_H-768_A-12.zip (accessed on 7 November 2021).
- Available online: https://github.com/hanxiao/bert-as-service (accessed on 7 November 2021).
- Wu, Y.H.; Schuster, M.; Chen, Z.F.; Le, Q.V.; Norouzi, M.; Macherey, W.; Krikun, M.; Cao, Y.; Gao, Q.; Macherey, K.; et al. Google’s neural machine translation system: Bridging the gap between human and machine translation. Comput. Sci. 2016, arXiv:1609.08144. [Google Scholar]
- Available online: https://spacy.io/ (accessed on 7 November 2021).
- Dhillon, I.S.; Modha, D.S. Concept decompositions for large sparse text data using clustering. Mach. Learn. 2001, 42, 143–175. [Google Scholar] [CrossRef] [Green Version]
- Buchta, C.; Kober, M.; Feinerer, I.; Hornik, K. Spherical k-means clustering. J. Stat. Softw. 2012, 50, 1–22. [Google Scholar]
- Peter, R.J. Silhouettes: A graphical aid to the interpretation and validation of cluster analysis. J. Comput. Appl. Math. 1987, 20, 53–65. [Google Scholar]
- Chang, J.; Gerrish, S.; Wang, C.; Boyd-Graber, J.L.; Blei, D.M. Reading tea leaves: How humans interpret topic models. In Proceedings of the Advances in Neural Information Processing Systems, Vancouver, BC, Canada, 7–10 December 2009; pp. 288–296. [Google Scholar]
- Aletras, N.; Stevenson, M. Evaluating topic coherence using distributional semantics. In Proceedings of the 10th International Conference on Computational Semantics (IWCS 2013)—Long Papers, Potsdam, Germany, 19–22 March 2013; pp. 13–22. [Google Scholar]
- Li, C.; Wang, H.; Zhang, Z.; Sun, A.; Ma, Z. Topic modeling for short texts with auxiliary word embed-dings. In Proceedings of the 39th International ACM Sigir Conference on Research and Development in Information Retrieval, Pisa, Italy, 17–21 July 2016; ACM: New York, NY, USA, 2016; pp. 165–174. [Google Scholar]
- Mimno, D.M.; Wallach, H.M.; Talley, E.M.; Leenders, M.; McCallum, A. Optimizing semantic coherence in topic models. In Proceedings of the 2011 Conference on Empirical Methods in Natural Language Processing, John McIntyre Conference Centre, Edinburgh, UK, 27–31 July 2011; pp. 262–272. [Google Scholar]
- Fu, Q.; Zhuang, Y.; Gu, J.; Zhu, Y.; Guo, X. Agreeing to Disagree: Choosing Among Eight Topic-Modeling Methods. Big Data Res. 2021, 23, 100173. [Google Scholar] [CrossRef]
- Röder, M.; Both, A. Hinneburg, Exploring the space of topic coherence measures. In Proceedings of the 8th ACM International Conference on Web Search and Data Mining, Shanghai, China, 2–6 February 2015; ACM: New York, NY, USA, 2015; pp. 399–408. [Google Scholar]
- Verlag, G.N.; Informatik, F. Von der Form zur Bedeutung: Texte automatisch verarbeiten/From Form to Meaning: Processing Texts Automatically. 2009. Available online: http://tubiblio.ulb.tu-darmstadt.de/98069/ (accessed on 7 November 2021).

| USA | China | ||
| Topic | Ratio (%) | Topic | Ratio (%) |
| Water/Polarhub/Enviroatlas | 21% | Landscape/Livability/Government | 29.4% |
| Building/Air/BIM | 19.4% | Extraction/Metadata/Information | 23.5% |
| Fire/Risk/Precipitation | 17.7% | Soybean/Crop/Area/Policy | 17.6% |
| GEE/ Framework / Model | 17.7% | Geohazards/Landslide/ Anomaly | 14.8% |
| Stream/Land/Temperature | 12.9% | Multisource/Search/Metadata | 14.7% |
| Greenery /Heat | 11.3% | ||
| India | Germany | ||
| Topic | Ratio (%) | Topic | Ratio (%) |
| Cloud/computing/Hadoop/Share | 26.3% | Navigation/Prediction/Street | 25% |
| Flood/Distribution/Coastline | 21.1% | Visualization/Database/Datasets | 25% |
| SDI/WPS/Framework | 21.1% | Change/Land/Observation | 18.8% |
| Stormwater/ Groundwater/Conserve | 10.5% | Stress/Life/Measurement | 18.8% |
| Land/Investor/Vicinity | 10.5% | Demand/Heat/Supply | 12.4% |
| School/Platform/location | 10.5% | ||
| UK | Russian Federation | ||
| Topic | Ratio (%) | Topic | Ratio (%) |
| Geohazards/Household/Landslide | 16.7% | Risk/Environment/Management | 27.3% |
| Point cloud/Framework | 16.7% | Network/Generation/Transport | 18.2% |
| Feature/Attribute/Database | 16.7% | Customer/Bank/Transaction | 18.2% |
| Mangrove/Fishing/Intensity | 16.7% | Monitoring/Change/Climate/Season | 18.2% |
| BIM/Project/Evaluation | 16.7% | Client/Cloud/computing/Device | 9.1% |
| Weather/MCSA (Multi-Channel Sequences Analysis)/Condition | 8.3% | Image/Anomaly/Validation | 9% |
| Network/Source/Accessibility | 8.2% | ||
| Italy | Others | ||
| Topic | Ratio (%) | Topic | Ratio (%) |
| Geo/Disaster/Cluster | 30% | Land/Housing/City/Water | 41.2% |
| Challenge/Spiral/OpenGIS | 20% | Village/Fire/model/System | 23.5% |
| Crop/Precision/Classification | 10% | Datasets/Soil/Accuracy | 23.5% |
| Landslide/Hazard/Flood | 10% | SDI/Web/Collection | 11.8% |
| Map/Territory/Accessment | 10% | ||
| Location/Behavior/Category | 10% | ||
| GNSS/Radar/Remote/sensing | 10% |
Publisher’s Note: MDPI stays neutral with regard to jurisdictional claims in published maps and institutional affiliations. |
© 2021 by the authors. Licensee MDPI, Basel, Switzerland. This article is an open access article distributed under the terms and conditions of the Creative Commons Attribution (CC BY) license (https://creativecommons.org/licenses/by/4.0/).
Share and Cite
Cheng, Q.; Zhu, Y.; Song, J.; Zeng, H.; Wang, S.; Sun, K.; Zhang, J. Bert-Based Latent Semantic Analysis (Bert-LSA): A Case Study on Geospatial Data Technology and Application Trend Analysis. Appl. Sci. 2021, 11, 11897. https://doi.org/10.3390/app112411897
Cheng Q, Zhu Y, Song J, Zeng H, Wang S, Sun K, Zhang J. Bert-Based Latent Semantic Analysis (Bert-LSA): A Case Study on Geospatial Data Technology and Application Trend Analysis. Applied Sciences. 2021; 11(24):11897. https://doi.org/10.3390/app112411897
Chicago/Turabian StyleCheng, Quanying, Yunqiang Zhu, Jia Song, Hongyun Zeng, Shu Wang, Kai Sun, and Jinqu Zhang. 2021. "Bert-Based Latent Semantic Analysis (Bert-LSA): A Case Study on Geospatial Data Technology and Application Trend Analysis" Applied Sciences 11, no. 24: 11897. https://doi.org/10.3390/app112411897
APA StyleCheng, Q., Zhu, Y., Song, J., Zeng, H., Wang, S., Sun, K., & Zhang, J. (2021). Bert-Based Latent Semantic Analysis (Bert-LSA): A Case Study on Geospatial Data Technology and Application Trend Analysis. Applied Sciences, 11(24), 11897. https://doi.org/10.3390/app112411897