Abstract
Sectionalizing 0.4 kV power transmission lines (PTL) improves power supply reliability and reduces electricity undersupply through the prevention of energy disconnection of consumers in the event of a short circuit in the power line behind the sectionalizing unit (SU). This research examines the impact of sectionalizing on power supply reliability and reviews the literature on sectionalizing unit allocation strategies in electrical networks. This paper describes the experience of the use of sectionalizing units with listing strengths and weaknesses of adopted technical solutions and describes the new structure of sectionalizing units. A new methodology is proposed, whereby there are two criteria for allocating SU in 0.4 kV power transmission lines. The first criterion is the sensitivity limits against single-phase short circuits used for calculating the maximum distance at which SU can be installed. The second criterion is power supply reliability improvement, evaluating the cost-effectiveness of installing sectionalizing equipment by reducing power supply outage time. The established methodology was put to the test on an actual electrical system (Mezenka village, Orel area, Russia), which demonstrated that the installation of a sectionalizing unit paid off.
1. Introduction
1.1. Impact of Power Line Sectionalizing on Power Supply Reliability
Sectionalizing power transmission lines (PTL) is mainly used to increase power supply (PS) reliability for consumers in power transmission lines of medium voltage (MV) level (6–35 kV). A fairly large number of devices usually called sectionalizing units (SU) and reclosers have been developed for sectionalizing electrical networks of this voltage class by such companies as Siemens, ABB, S&C Electric Co, etc. [1,2,3,4]. In Russia, the most popular reclosers are produced by Tavrida Electric company group, LLC “Elektroshchit-Samara” [5,6]. According to statistics given in [7], over 70% of faults in overhead distribution networks are temporary and can be cleared satisfactorily by the reclosing process. By contrast, permanent faults, despite their low frequency, have a long lifespan as compared to transient ones. The area affected by permanent faults can also be decreased using sectionalizing units, hence increasing PS reliability. Sectionalizing units divide the entire network into pieces and ensure the isolation of damaged PTL sections. As a result, a vast chunk of the network, except the faulted segments, can be spared from PS outage.
According to [8,9,10], the experience of using protective devices such as SUs and reclosers shows that PS reliability for consumers increases by 15–30% depending on the type of used device, the length of sectionalized PTL, the allocation of load over the PTL sections, and other factors. For example, the paper [8] proved that the right choice of recloser placement gives improvements in SAIDI by 15–20% and in CENS (costs of energy not supplied) by up to 30%. The installation of reclosers in the electrical networks of ELMŰ Network Ltd. and ÉMÁSZ Network Ltd. allowed decreasing the PS reliability indicator SAIDI (system average interruption duration index) by 25–29% [9]. The mounting of feeder automation and remotely controlled disconnectors along with the MV PTLs’ renovation at Swedish Fortum Distribution Networks showed a reduction in SAIDI indicator by a significant number—42% [10].
In considering low voltage (LV) networks, that is, up to 1 kV, sectionalizing means are promising both for improving PS reliability for consumers and for enhancing PTL protection against remote short circuits (SC) and the differentiation of electricity metering. The fact is that the lines of this level are of large length and the sensitivity of the protective devices installed at the beginning of lines to single-phase SC currents is not provided. In addition, in PTLs up to 1 kV (usually 0.4 kV lines), there are increased electricity losses often associated with unaccounted and non-contractual consumption, that is, with the theft of electricity [11]. These losses are often referred to as commercial losses, and the majority of developing countries suffer from them. So, the losses in such counties as India, South Africa, Brazil, China, and Russia account for approximately 10–40%, whereas in the UK, the USA, and Australia, it equals roughly 0.2–1% [12]. Differentiation of electricity metering consisting of the installation of additional metering devices at different line sections (e.g., at reclosers and SUs) allows identifying line sections with increased losses [13].
Although the experience of usage of distribution network protection means shows a significant increase in PS reliability, PTL sectionalizing and redundancy means in rural areas including both LV and MV electrical networks are not widespread due to moderate consumer loads as well as a radial design of used PTLs, their excessive length, and the lack of alternate backup supplies from other adjacent feeders [14]. This is despite the fact that the permanent fault frequency for rural networks is much more than for urban ones; for example, this indicator at the premises of Finish rural networks exceeds urban ones by approximately two times (according to the data presented in paper [15]). Nevertheless, in rural networks, especially in 0.4 kV ones, sectionalizing units and reclosers were practically not applied previously due to the lack of low-cost technologies for their implementation, and therefore, the investments in rural distribution network protection were not paid off. Nowadays, that situation is being ameliorated, and emerging means of data transmission as well as inexpensive sensors and processors make it possible to recoup the introduction of SUs and reclosers in rural networks.
1.2. Allocation Problem of Sectionalizing Units within Electrical Networks
One of the important issues is the problem of efficient distribution of sectionalizing units, and there have, to date, been many scientific works aimed at its solution. Most research proposes the selection of installation places for protective devices in terms of increasing the reliability of power supply because the reliability indices are convenient for PS companies. In most cases, they are authorized by the Institute of Electrical and Electronics Engineers (IEEE) [16]. According to [17], the most widely utilized indices are the system average interruption frequency index (SAIFI), the system average interruption duration index (SAIDI), the customer average interruption duration index (CAIDI), and the average service availability index (ASAI).
Thus, research [14] discusses ways to lower the SAIDI index for a feeder of 11 kV distribution system located in a remote place. The approaches are based on a reliability-network-equivalent model that takes into account the effects of feeder layout, the location of recloser, and the application of distributed generators. In paper [18], authors use only SAIFI reliability index in a method to predict reliability improvements, that is, a method for the determination of the quantity, type, and placement of protective devices. Authors in paper [19] also suggested solving the same problem relying on the SAIFI index but by application of a binary programming optimization with the usage of engineering heuristics algorithm in order to reduce the duration of calculation. However, already, in paper [20], the same scientific team extended their work by adding indices MAIFI (momentary average interruption event frequency index) and ASIFI (average system interruption frequency index). They proposed an improved method for reaching a compromise between a decrease in the SAIFI and ASIFI and an increase in MAIFI by identifying what protective scheme should be chosen. In paper [21], an increase in the efficiency of network protective design also correlates with lowering SAIFI and ASIFI indices, and a binary programming method is proposed to choose the type of protective apparatus at a predetermined position on a distribution feeder. Considering papers [22,23,24], it is also noted that, for the determination of protective device location in a distribution feeder, authors use non-linear binary programming models also based on the minimization of SAIFI and ASIFI indices. In [25], already, a set of three indices, SAIFI, SAIDI, and MAIFI, is taken into account within a method for placing an optimal number of reclosers, which are based on genetic algorithm (GA). Study [26] presents a methodology for the allocation of distributed generators and reclosers in a security-constrained distribution network through analyzing reliability indices SAIFI, SAIDI, and MAIFI and power flow equations. It should be noted that power flow analysis is a powerful tool to assess PS reliability [27] in order to solve such tasks as optimal network configuration [28,29] and PS restoration process [30].
In spite of the fact that the majority of methods are based on the reliability indices listed above because they are well-known to PS companies and directly influenced by the number, type, and location of the protective devices, the indices reflecting the financial component are more precise due to the fact that they allow directly calculating the investment cost for the deployment of protective systems. For that reason, the authors in paper [8] propose using CENS index, showing the cost of electricity undersupply for the benefit assessment of protective system introduction. In paper [31], the authors present an optimization methodology to find the placement and types of protective devices, e.g., breakers, reclosers, and disconnecting switches. The methodology enables the identification of optimal SAIFI and SAIDI indices and the minimization of outage cost. Paper [32] proposes a fuzzy optimization procedure on an ant colony optimization-based method for allocating sectionalizers in distribution networks with distributed generation. The methodology is based on finding a compromise between the minimization of sectionalizers’ cost and the maximization of PS reliability expressed in the EENS (expected energy not supplied) index. In paper [33], the optimum number, type, and location of switching devices were determined by multiobjective problem genetic algorithm NSGA-II, considering the minimization of SAIDI, SAIFI, and DGUI (distributed generators unavailability index) indices and equipment cost. The approach was developed even further in papers [34,35], where a set of four indices, namely SAIFI, SAIDI, MAIFI, and ENS (energy not supplied), was applied in a methodology for determining the best location for reclosers in overhead distribution networks and calculating the amelioration with the deployment of each additional recloser. Economic metrics such as the net present value, internal rate of return, and the payback period were used to measure the investment costs’ effectiveness of the solution achieved in each iteration. In the presented methodology, a technical evaluation of service restoration feasibility through fault detection, isolation, and restoration, as well as an economic evaluation based on a cost–benefit analysis spanning the equipment’s life cycle, were also included.
1.3. Article Relevance, Contribution and Organization
In the works discussed above, a large number of approaches are used to determine the quantity and location of sectionalizing units for medium voltage lines. For networks with voltage below 1 kV, due to the small experience of using SU, there are almost no such developments. This is based mainly on the fact that SU installation in LV networks is considered economically irrational, since the calculations are carried out using the existing methods of economic justification for MV networks. However, LV networks often exceed the permissible length established by the regulatory documents’ requirements, for example, as indicated in [36], the average length of 0.4 kV rural PTLs in Russia is 0.9–1.2 km, and in some cases, it reaches 3–4 km. Thus, a situation arises when the current value of single-phase SC to ground at the end of PTL is less than the value of the load current of the whole line. Such short circuits often occur when a wire breaks and falls to the ground. As a result, the protective switching device at the beginning of PTL does not feel such short-circuits and does not trigger off when they appear. In such cases, SU installation in electrical networks should be obligatory to ensure electrical safety. In turn, this situation does not manifest itself in a similar way for MV power lines due to the design network features. Networks up to 1 kV are usually performed with solidly grounded neutrals, in contrast to MV networks performed with isolated neutrals and unsusceptible to SC to ground. Therefore, the calculations for determining the quantity and locations of sectionalizing units in PTLs of 10 kV and above do not take into account a restriction on the placement of SU on a power transmission line that is associated with ensuring the sensitivity of the protective device installed at the beginning of PTL. In the proposed methodology for SU allocation, this criterion is considered and adopted as a decisive one, which is its advantage along with taking into account the direction of its use in LV networks.
The second important criterion is power supply reliability improvement based on a decrease in the time of power supply outages, hence loss minimization from damage caused by electricity undersupply. Despite the fact that many of the above methods for SU allocating in electric networks highlight the economic component, the second advantage of the developed methodology is to determine the economic effect of reducing both the duration of emergency outages and the duration of scheduled repairs, taking into account capital and operating costs for equipment. In addition, in the current work, we consider the experience of using SU in 0.4 kV networks and the results of this experience in terms of reducing the power supply restoration time by more rapid information receipt about a failure and a more accurate determination of the search area for damage.
The current paper has been organized in the relevant sections. Section 1, ‘Introduction’, is devoted to a literature review on research in the field of impact of power line sectionalizing on power supply reliability and allocation problem of sectionalizing units within electrical networks. The experience of design of sectionalizing unit devices and their introduction in 0.4 kV networks are described in Section 2. Section 3 describes criteria for the proposed methodology for SU allocation in 0.4 kV power transmission lines. Section 4 contains the application results for the proposed methodology on a case study. The final conclusions are drawn in Section 5.
2. Design of Sectionalizing Devices
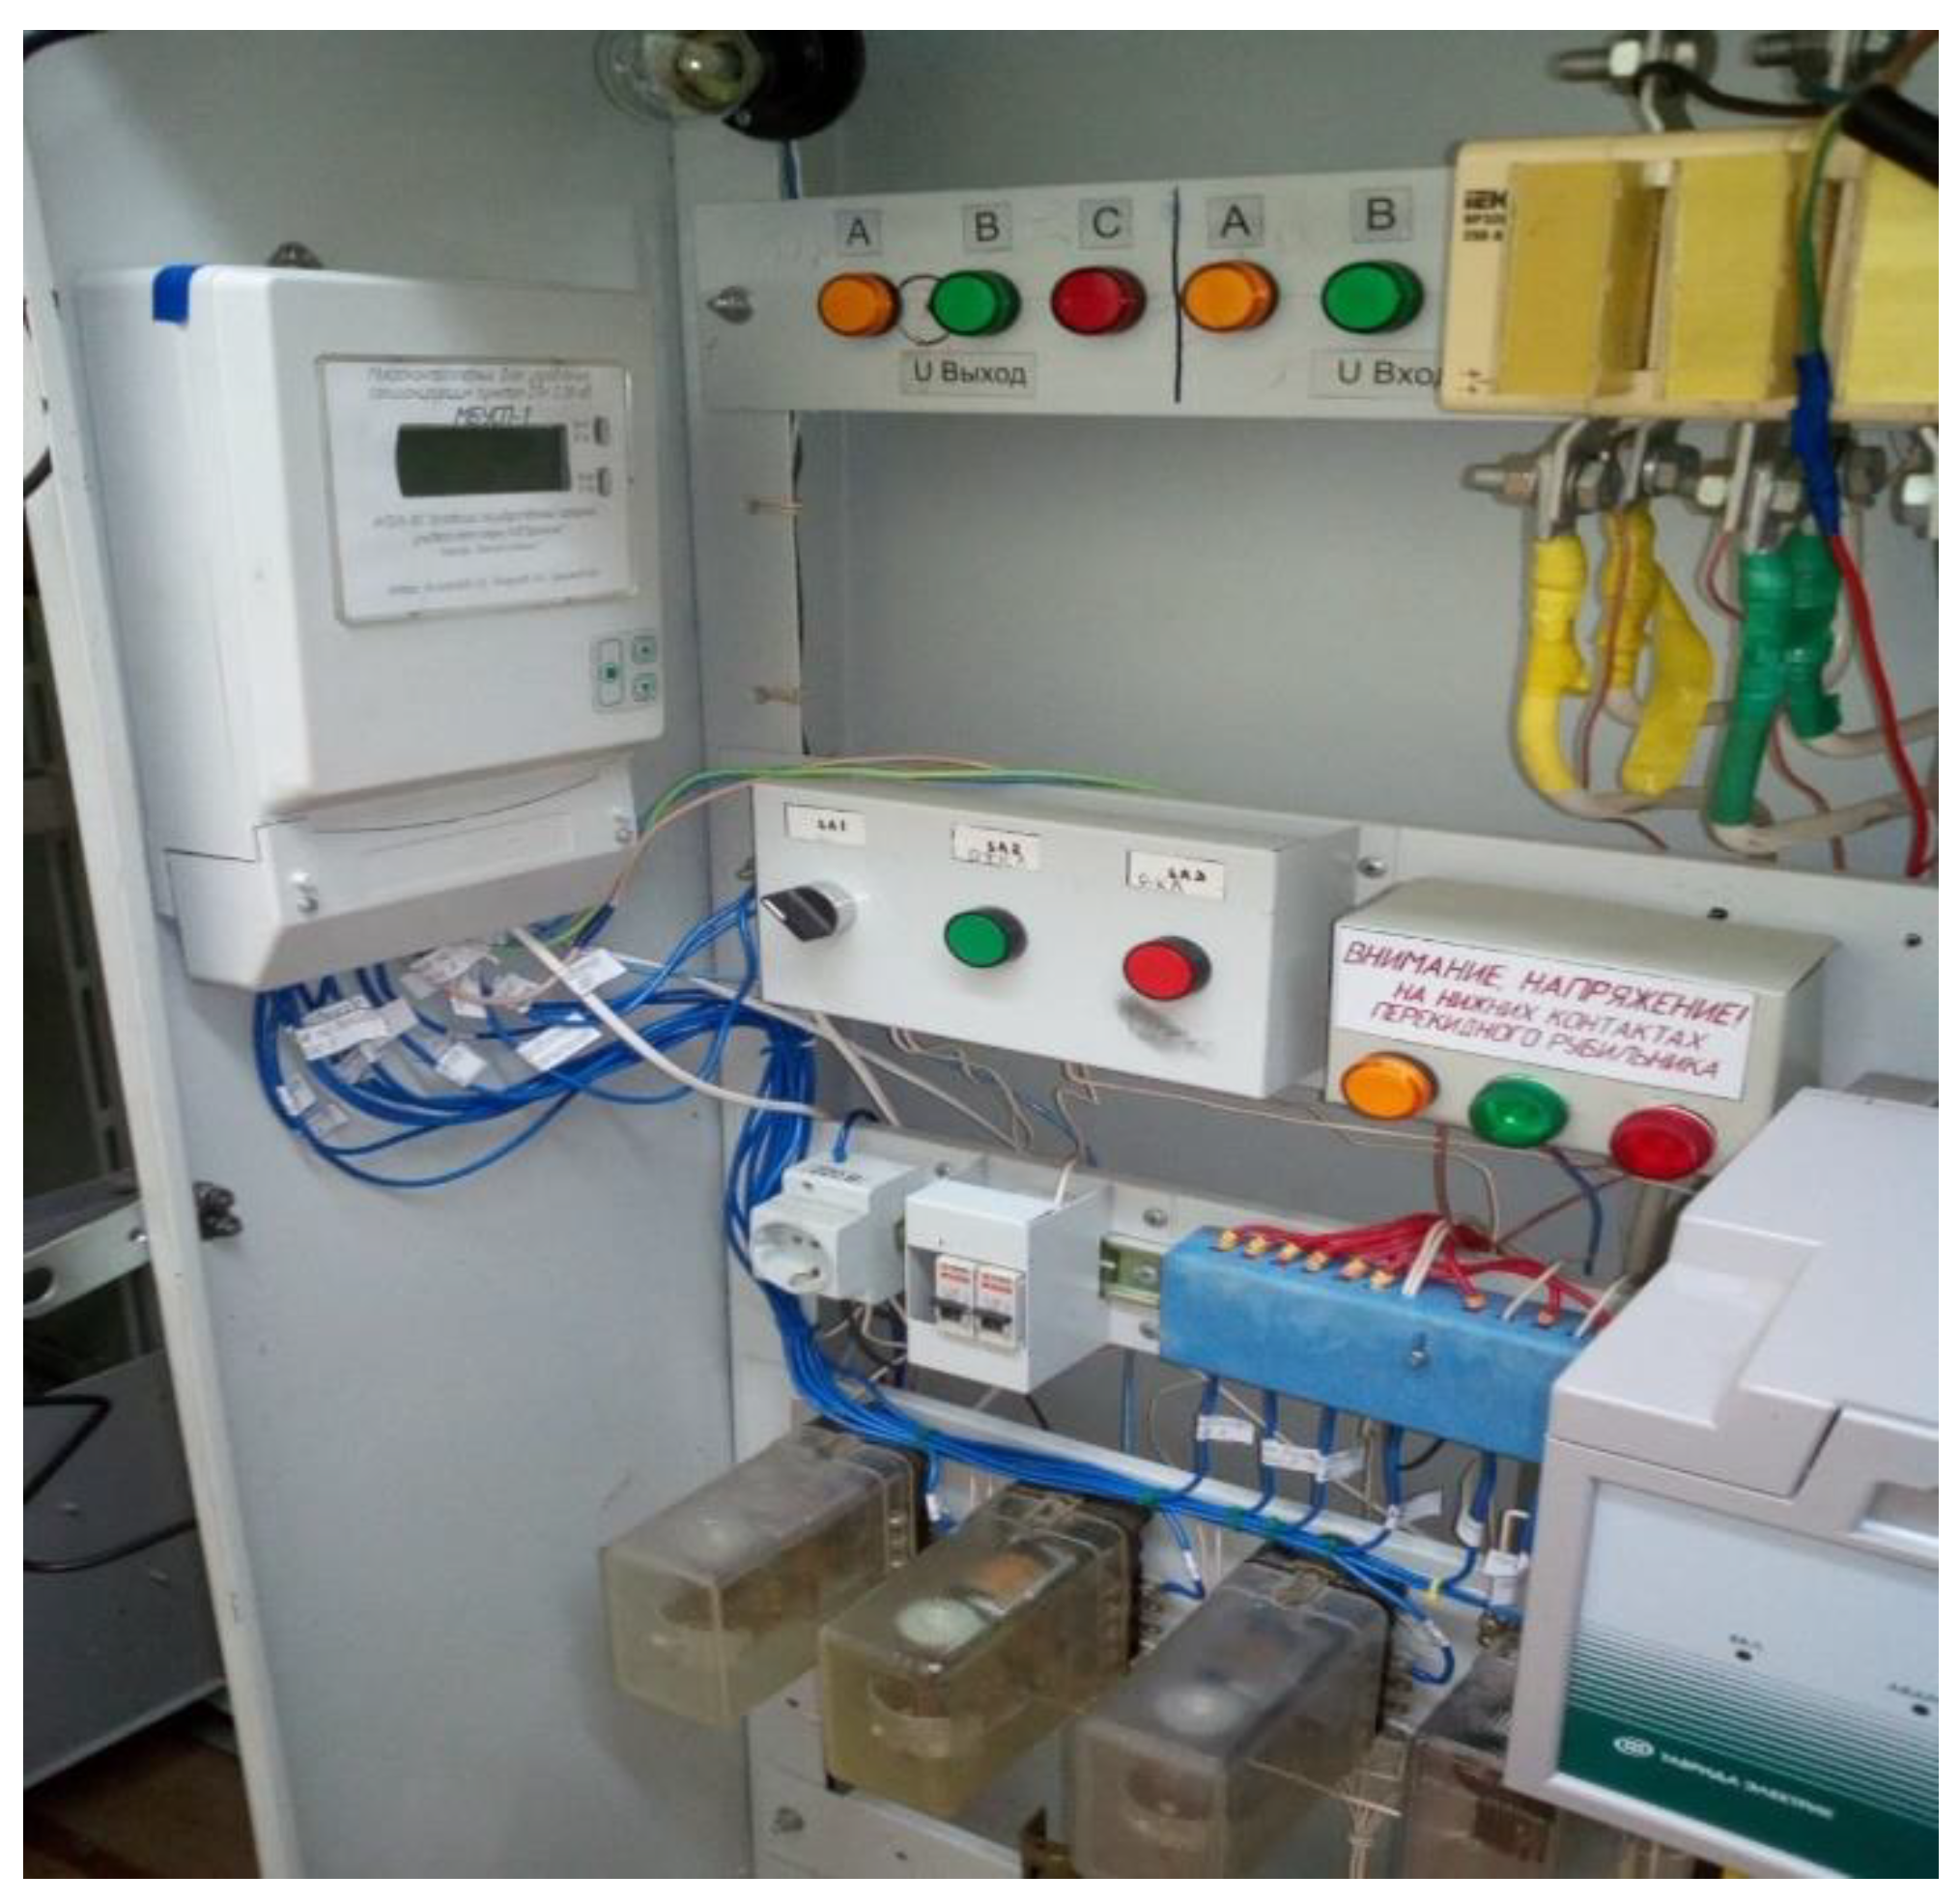
The work [37] describes our experience of development and usage of switching devices for sectionalizing 0.4 kV electrical networks and network redundancy. The manufactured devices were introduced in the electric networks of Orel region, the Russian Federation, in 2015–2016 and are currently working there. Figure 1 illustrates the mentioned sectionalizing units.
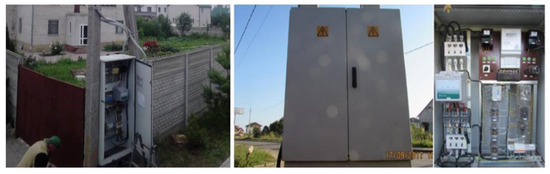
Figure 1.
Photos of sectionalizing units installed in Orel electrical networks [37].
The gained experience revealed the strengths and weaknesses of adopted technical solutions. So, it was confirmed that the choice of vacuum contactors as SU switching devices had been the right decision, since it had enabled SUs to successfully isolate network sections under single-phase short circuits. On the other hand, the successful manual reactivation of SUs after triggering revealed the need to equip the devoted SUs with an automatic reclosing function. In addition, the disadvantages of the presented SUs also include the lack of equipment for operating mode monitoring and remote control. As a result, the personnel of power grid companies learn about SU triggering if the disconnected consumers call them. This leads to an unreasonable increase in power supply outage time.
In order to eliminate the above disadvantages, in the Mezenka electrical network, it was proposed to install the modernized SU in accordance with the block diagram presented in Figure 2. In the diagram, a sectionalizing unit is combined with electricity metering, power quality control, control of the amount and time of voltage outages. The diagram provides for the possibility of SU remote control and data transmission from SU to a dispatcher of power grid company.
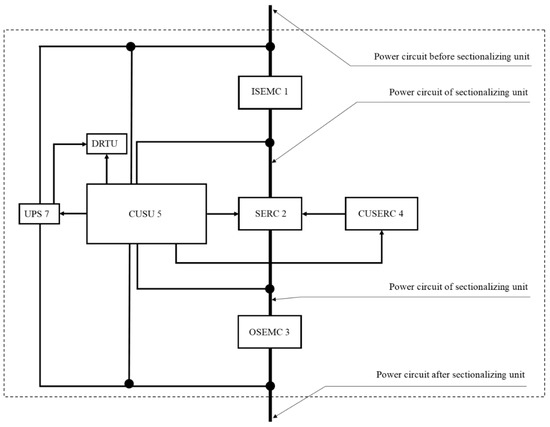
Figure 2.
Block diagram of SU combined with electricity metering and power quality control.
According to Figure 2, the diagram of SU contains input switching element of manual control (ISEMC 1), switching element of remote control (SERC 2), output switching element of manual control (OSEMC 3), control unit of switching element of remote control (CUSERC 4), control unit of sectionalizing unit (CUSU 5), data receiving and transmitting unit (DRTU 6), and uninterruptible power supply unit (UPS 7).
Load break switches are used, ISEMC 1 and OSEMC 3. They provide manual switching of power circuits. A vacuum contactor is used, SERC 2, which enables switching SC currents. In fact, SERC 2 is the power contact of a contactor. CUSERC4 is the control device of vacuum contactor. CUSERC4 enables SERC 2 to be switched on and off in accordance with the commands from CUSU 5. CUSU carries out the functions of monitoring, control, accounting, and management. With the help of this unit, the sectionalizing unit monitors the operating modes of device and the operating mode parameters of SU electric circuit, including the current and voltage before and after the SU. Monitoring SERC 2 position allows drawing conclusions about the causes for its triggering based on the comparison of facts of changes in current and voltage parameters as well as changes in SERC 2 position. CUSU 5 also monitors and takes into account the time of voltage outages both in the circuit before the SU and in the power circuit of device itself. This makes it possible to obtain reliable data on PS outage time for consumers as well as to analyze SU operation. CUSU 5 carries out technical electricity metering and implements the automation functions of SERC 2 control including automatic reclosing of SERC 2. The functions of CUSU 5 also allow switching SERC 2 off in case of short circuits and overloads.
In case of SU local control, a command to switch it off is also given with the help of CUSU 5. For this purpose, a signal is sent from CUSU 5 to CUSERC 4, which, in turn, switches SERC 2 off by stopping the power supply to the SERC coil. Then, the voltage in circuit behind SERC 2 disappears. Additionally, the disconnection of SU can be carried out using the commands that are sent to CUSERC 4 from DRTU 6 and processed by CUSU 5. It permits the SU to be remotely switched on. DRTU 6 receives signals to switch on or off SU using a coded signal transmitted through a communication channel, for example, JPS, JPRS, Glonass, radio, or another channel.
Data on electricity consumption and on power quality are sent to DRTU 6 and through it to a dispatcher of power supply company or the company on whose balance SU equipment is located.
The uninterruptible power supply unit (UPS 7) supplies power to CUSU 5 and DRTU 6 from both a power network and an independent power source contained in it, e.g., a battery or a capacitor.
Thus, SU enables us to carry out the switching and protection of 0.4 kV power lines, electricity metering, power quality control, and control of the amount and duration of PS outages. Its application prevents the development of various emergency-based scenarios and provides a reduction in electricity undersupply for consumers, a reduction in losses of power supply company, and thus, an increase in the reliability and efficiency of power supply systems.
Figure 3 presents an inside view of the sectionalizing unit on the basis of the block diagram presented in Figure 2.
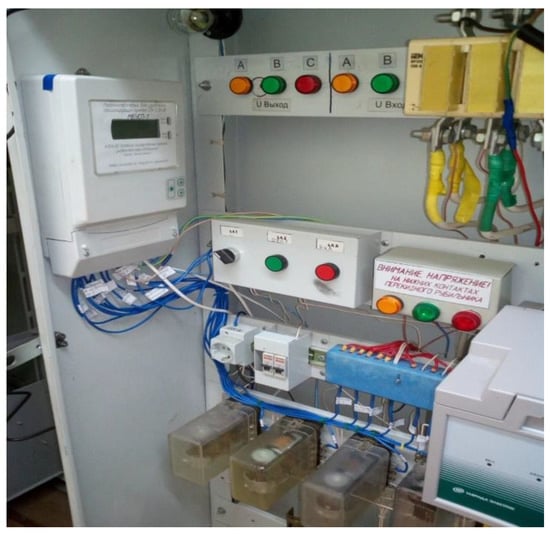
Figure 3.
Inside view of SU combined with electricity metering and power quality control.
The main elements of the SU are a vacuum contactor LSM/TEL-1/400-352 capable of switching device power circuits and a microcontroller control unit implementing the following functions:
- Two-way communication between SU and a network dispatcher;
- Constant monitoring of voltage and current parameters;
- Control of the vacuum contactor KM1 for automated (or remote) switching SU power circuits;
- Implementation of automatic (or remote) input or inhibit input of a reserve to an emergency PTL section (when using SU as a recloser);
- Automatic (or remote) control of automatic reclosing function;
- Providing an understandable interface and output of all information on a display for service personnel.
The use of MCUSU-1 allows informing a network dispatcher about:
- Changes in current and voltage parameters;
- Position of vacuum contactor;
- Successful implementation of automatic reclosing function;
- Fact and duration of voltage interruption in circuits under monitoring.
The cost of modernized SU amounts to USD 1173.6, which includes the cost of SU components and the cost of manufacturing, USD 973.6 and USD 200, respectively. The exchange rate of USD 1.00 is RUB 75.00. The capital investment in SU installation () will be USD 1467, consisting of SU cost, delivery costs (10–15% of SU cost), and installation costs (15–25% of SU cost). The operating costs of servicing SU for the year () will be USD 90.64 and consist of depreciation, maintenance and repair costs, and other costs.
3. Methodology for SU Allocation in 0.4 kV PTLs Based on Criteria of Sensitivity Limits and PS Reliability
A methodology for determining the placement of sectionalizing units in 0.4 kV power networks is based on two criteria. The first criterion is the main one, fulfilling sensitivity limits against single-phase SC current. The fulfillment of this criterion is obligatory, since it allows a sectionalizing unit (recloser) to perform the main function, that is, to disconnect the line under protection in case of a short circuit. The second criterion is used to assess the economic effectiveness of protective devices’ allocation in terms of the economic value of increasing power supply reliability minus the cost of investment and maintenance.
3.1. Criterion of Sensitivity Limits against Single-Phase SC
The main criterion that should be used for determining the maximum distance at which it is possible to install SU is the criterion for ensuring the protection of power transmission lines from single-phase short circuits. This subsection is devoted to a short description of this criterion; a detailed description is presented in the work [38].
According to this criterion, the length of power transmission line is compared with its maximum length, at which the sensitivity of a protective device to single-phase SC is ensured. The maximum length of transmission line (km), at which the protection sensitivity is provided, is determined by:
where
- is phase voltage, V;
- is impedance of a transformer feeding the PTL, Ohm;
- is specific active resistance of the phase wire, Ohm/km;
- is specific active resistance of the neutral wire, Ohm/km;
- is specific inductive resistance of the phase-zero loop, Ohm/km;
- and is current according to the sensitivity condition, A.
If the length of PTL turns out to be higher than the allowed level, it is necessary to install SU at a distance less than the maximum level. This criterion must be considered when choosing places for SU allocation in a power transmission line, since it limits the choice of places according to other criteria.
3.2. Criterion for Power Supply Reliability Improvement
Although the sensitivity criterion limits the possibility of choosing SU places by the distance from a transformer substation (TS), it is not the only selection criterion. The second criterion is to improve power supply reliability for consumers. This criterion depends on the configuration of the sectionalized PTL and the distribution of the load along it. In the case of sectionalizing, PS reliability increases for consumers connected to PTL section before SU. To determine the installation location of SU in terms of PS reliability, it is necessary to use the following methodology.
- To calculate the total number of hours of PS interruptions due to failures on PTL sections before SU. This time (h/year) is determined by equation:where
- is length of the ith PTL section, km;
- is average PS restoration time for the ith PTL section, h;
- and is failure flow for the ith PTL section per 100 km, year−1.
The values of failures flow and average PS restoration time for power lines are taken according to statistical data or literature sources.
- 2.
- To determine the total number of hours of PS interruptions from failures on PTL sections after SU:where
- is average restoration time for SU, h;
- is average restoration time for the jth PTL section, h;
- is failure flow at the jth PTL section per 100 km, year−1;
- is failure flow at SU per 100 pcs, year−1;
- and is the length of the jth PTL section after SU, km.
The average restoration time of SU is determined on the basis of experimental data on SU maintenance and amounts to 1 h. The parameter of SU failures flow per 100 pcs is taken to be 2 year−1.
- To determine the total number of hours of emergency outages within the entire PTL in the absence of SU (h/year):
- The damage caused by emergency outages for the year is calculated as follows. Failures on any PTL section without sectionalization and failures on PTL sections before SU with sectionalization are equivalent since they lead to a power failure for all consumers. Damage in these situations (USD/year) is determined as follows:where
- is specific damage from electricity undersupply for the gth consumer, USD/kWh;
- is electricity undersupply for the gth consumer, kWh/year;
- is maximum load of the gth consumer, kW;
- is usage time of maximum load by the gth consumer, h/year;
- and is the number of consumers connected to PTL, pcs.
In case of failures on PTL sections after SU, damage (USD/year) is determined by:
where
- is specific damage from electricity undersupply for the yth consumer after SU, USD/kWh;
- is electricity undersupply for the yth consumer, kWh/year;
- is maximum load of the yth consumer, kW;
- is usage time of maximum load by the yth consumer, h/year;
- and is the number of consumers connected to PTL after SU, pcs.
- 3.
- To calculate the effect of sectionalization (USD/year) for each intended installation location of SU:
- 4.
- To determine scheduled downtime (h/year):where is average scheduled downtime for the ith network element, h;is number of scheduled repairs during the repair cycle for the ith network element.
- 5.
- To determine damage caused by scheduled repairs for PTL both without sectionalizing when servicing at any point and with sectionalizing when servicing at PTL section before SU (USD/year):where
- is specific damage from electricity undersupply for the gth consumer during scheduled repairs of PTL, USD/kWh;
- is electricity undersupply for the gth consumer during scheduled repairs, kWh/year;
- is maximum load of the gth consumer, kW;
- is usage time of the maximum load by the gth consumer, h/year;
- is scheduled downtime for the whole PTL, h/year;
- and is number of consumers connected to PTL, pcs.
- 6.
- To determine damage caused by scheduled repairs at PTL sections after SU (USD/year):where
- is specific damage from electricity undersupply for the yth consumer during scheduled repairs of PTL, USD/kWh;
- is electricity undersupply for the yth consumer during scheduled repairs, kWh/year;
- is maximum load of the yth consumer, kW;
- is usage time of maximum load by the yth consumer, h/year;
- is planned downtime for the PTL after SU, h/year;
- and is number of consumers connected to PTL after SU, pcs.
- 7.
- To calculate the effect of sectionalization for each intended installation location of SU from reducing scheduled PTL repairs (USD/year):
- 8.
- To calculate the cumulative effect of sectionalizing for each intended location (USD/year):
- 9.
- To calculate the annual economic effect from SU installation (USD/year):where
- is operating cost of servicing SU, USD/year;
- is standard effectiveness ratio of capital investment. is taken in the range 0.1...0.3 [39]. For the energy industry, it usually equals 0.125, which corresponds to a payback period of 8 years, although PJSC ROSSETI [40] accepts a payback period of up to 10 years. can be set based on the desired payback period defining as: = 1/Payback period;
- is capital cost of SU implementation, USD;
- and is the number of SUs (if there are several SUs in a power line), pcs.
Sectionalizing units can be installed at all intended installation locations, for which G ≥ 0. The only limitation is that it is necessary to fulfill the first criterion, that is, to fulfill sensitivity limits against single-phase SC current.
It should be noted that, although the proposed methodology allows allocating sectionalizing units on the basis of data on load power distribution and line sections’ lengths, in practice, the rational SU location can be adjusted taking into account the design features of PTL, the location of the structural elements of the line relative to the road, buildings, etc., the location of significant consumers, and the state of various line sections. Thus, the calculated point of SU installation, and the actual one cannot coincide and PTL inspection is always required before deciding on the place of SU installation.
To determine optimal SU locations when using several devices, it is necessary to find the sectionalizing effects for all possible installation locations. The option with the maximum annual economic effect will be optimal. When installing several SUs in a power line, it is necessary to check the sensitivity of protection means to single-phase SC on PTL sections after SU.
4. Case Study for SU Allocation in 0.4 kV PTLs According to the Developed Methodology
4.1. Determination of SU Maximum Distance According to Criterion of Sensitivity Limits against Single-Phase SC
A case study for testing the developed methodology for allocation of SUs in 0.4 kV PTLs in terms of sectionalizing units with different sets of functions was conducted in the 0.4 kV electrical network of the Mezenka village located in Oryol region, Russia. Mezenka village has 43 consumers powered by a 10/0.4 kV transformer substation through a power transmission line. A capacity of power transformer installed at the TS is 250 kVA. The protection of PTLs is carried out by an automatic switch (AS) with an operating current of 160 A and the sensitivity current of 480 A. Power transmission lines are made with wires with a cross section of 3 × 50 + 1 × 50 mm2. The length of PTLs with branch lines is 1.85 km.
Table 1 presents the information on the calculations results of maximum length of PTLs with the wires of different cross-sections for cases when the PTLs are supplied from transformers with a capacity of 250 kVA. The calculations were based on the data presented in [38].

Table 1.
Maximum distance from TS with a 250 kVA transformer to SU when PTL wires are of different cross-sections.
In accordance with Table 1, the maximum length of a power transmission line in terms of the criterion of protection sensitivity in the case of Mezenka village is 0.29 km.
4.2. Determination of SU Installation Location According to Criterion for Power Supply Reliability Improvement
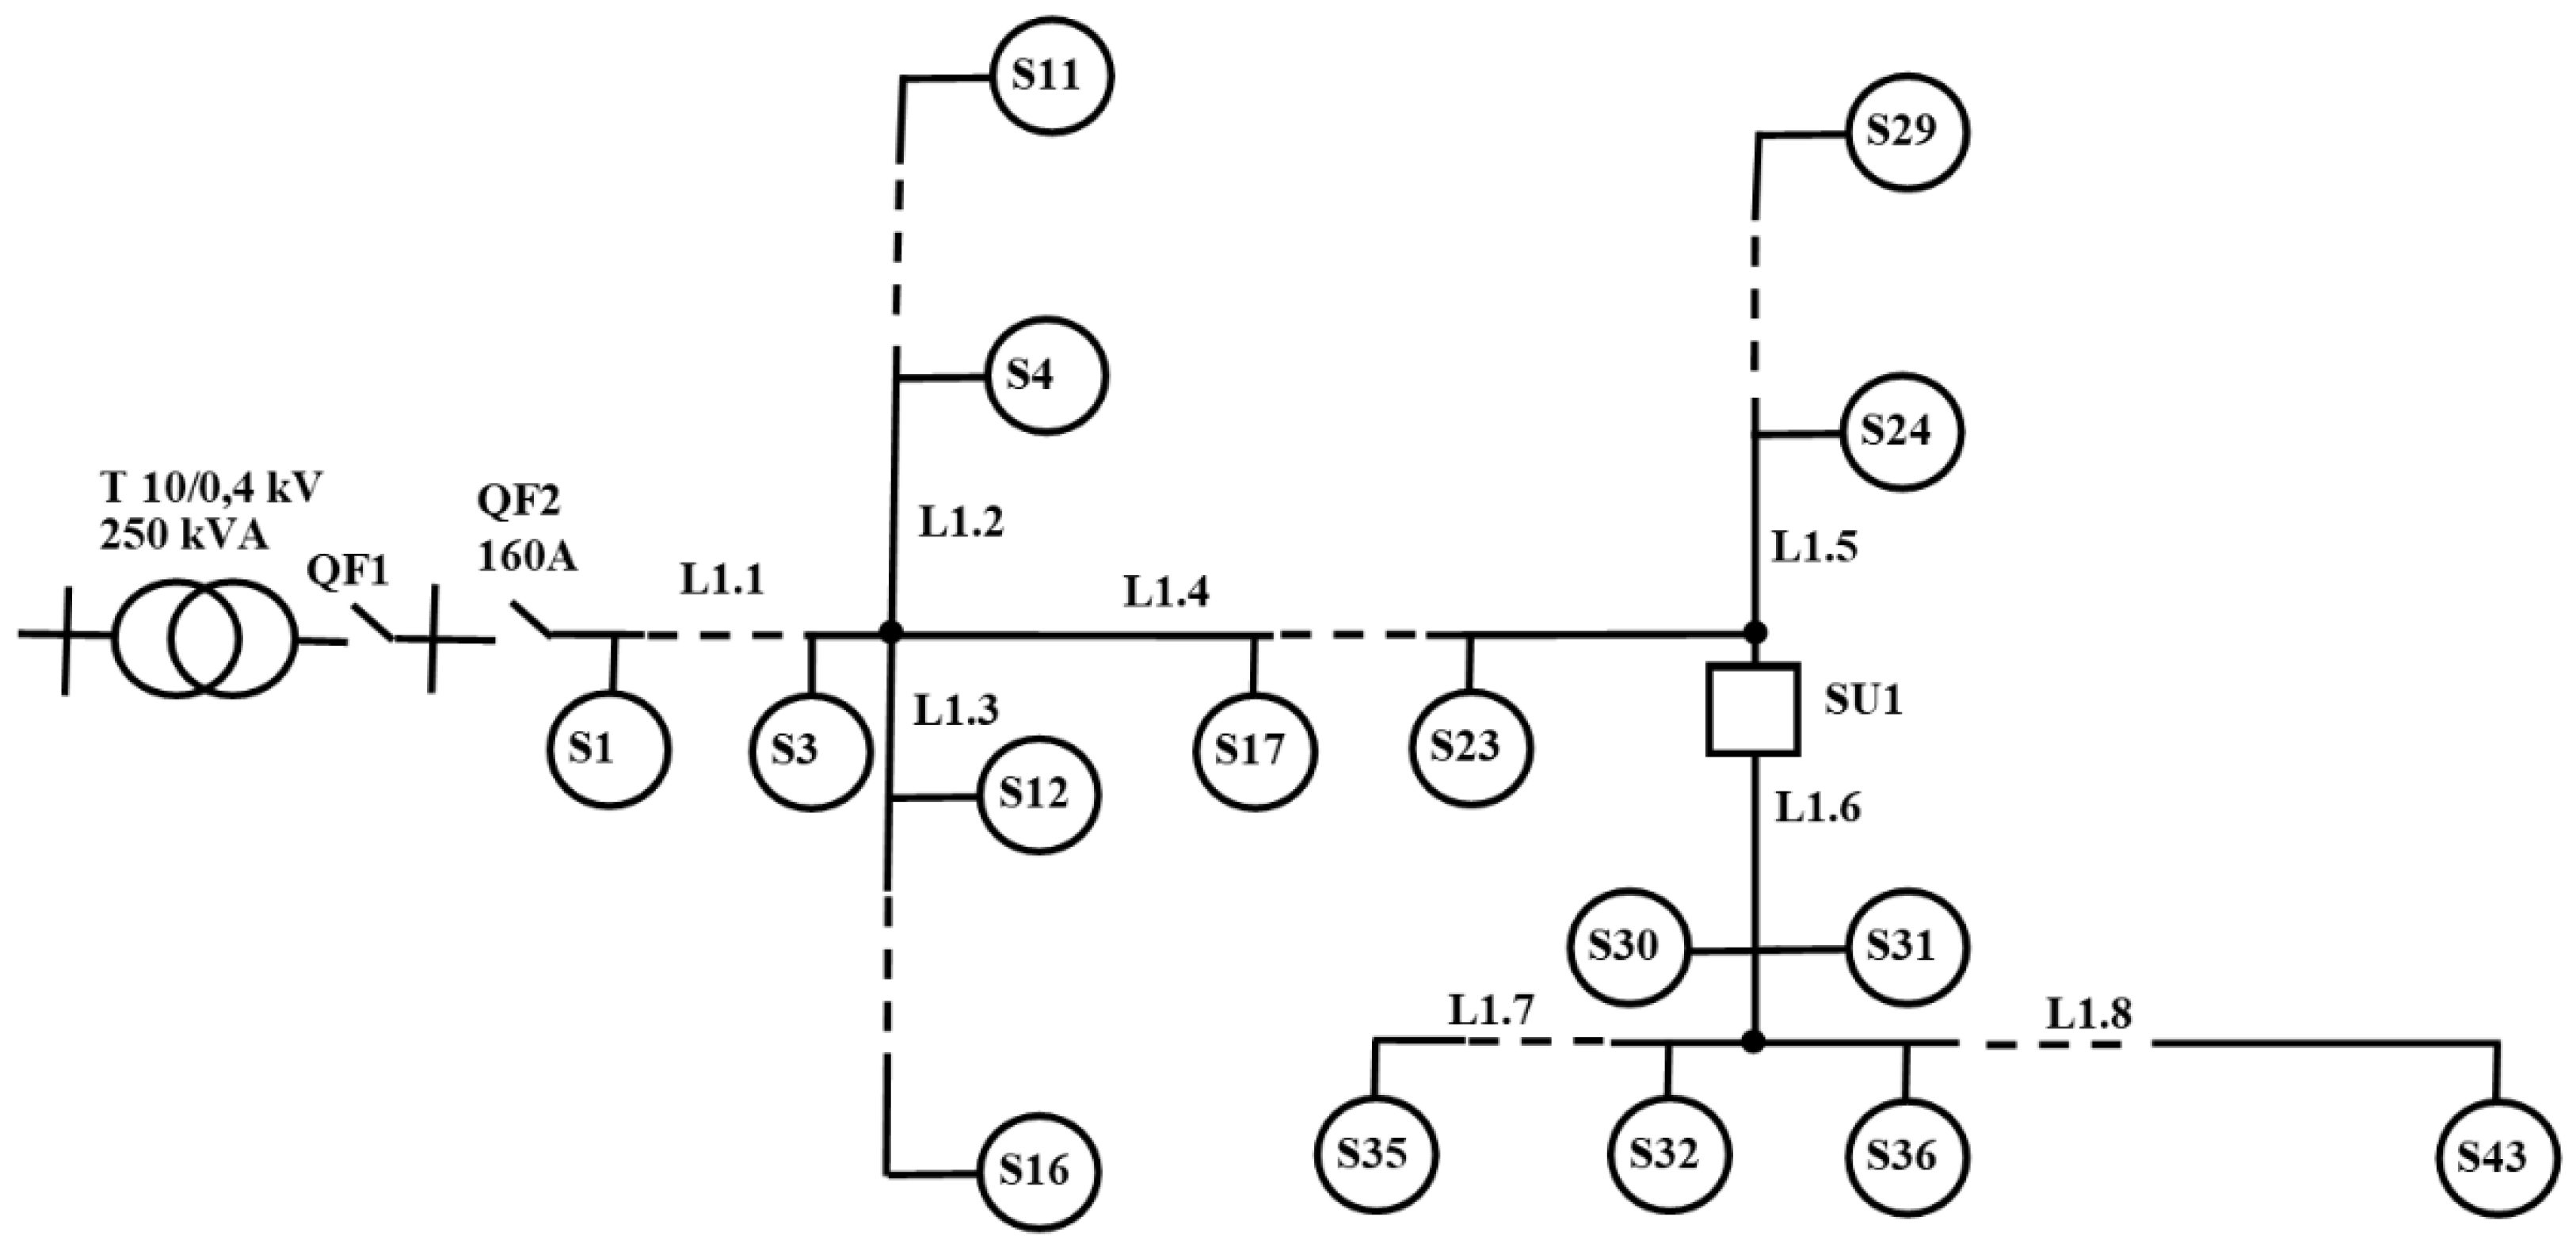
To assess the accuracy of the location choice for SU on the criterion for power supply reliability improvement, it is necessary to analyze the network configuration, data on electricity consumption by consumers connected to different network sections, and the importance of consumers. The diagram of power supply network of Mezenka village is shown in Figure 4.
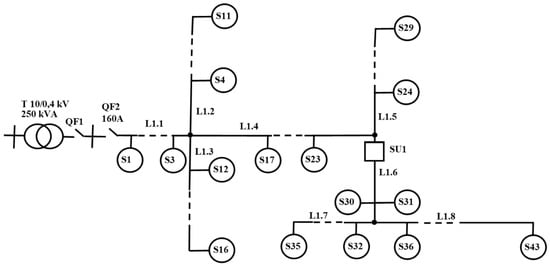
Figure 4.
Diagram of Mezenka power network with installed SU.
According to Figure 4, T is power transformer, QF1 is input automatic switch for 0.4 kV busbars, QF2 is automatic switch of outgoing PTL, L1.1–L1.8 are 0.4 kV PTL sections, and S1–S43 are consumers. Among them, consumer S23 is an experimental greenhouse, and consumer S29 is a pumping station, interruptions in the power supply of which must be as minimized as possible. At the same time, consumers S30–S43 are residential buildings having low power consumption and not requiring increased PS reliability. In addition, the data on accident rate for PTL sections were assessed. They revealed that the PTL section supplying consumers S30–S43 is the most urgent; that is, damage occurs on it much more often than on other sections. Therefore, the location of SU installation was tentatively determined on the branch line (section L1.6, Figure 4) at a distance of 0.25 km from TS (closer than 0.29 km). According to the technical reports of the power grid company servicing the Mezenka network, the annual electricity consumption by the entire PTL powering the village is 227,800 kWh per year, whereas the annual consumption for SU installation location at a distance of 0.25 km from TS is 63,070 kWh per year. The estimated time of scheduled outages during a year is 7.16 h, while emergency power supply outage time amounts to 3.59 h, with the proportion of unstable failures accounting for well over half of all cases (60%). The damage caused by electricity undersupply for the entire transmission line is RUB 56,820 per year, that is, USD 757.6 at the exchange rate of USD 1.00 per RUB 75.00.
4.3. Effect of Sectionalization in the Event of Unstable Failure
The trial operation of the SU without automatic reclosing function in the Mezenka electric grid since 2015 has confirmed the high reliability of the equipment. During the operation of SU, there have been no observed malfunctions or failures. So, 3 weeks after the installation of SU in Mezenka village (17 November 2015), a short circuit occurred at the PTL section behind the SU. As a result, the SU was triggered, preventing the disconnection of consumers connected before it. Power supply restoration time was 0.83 h from the moment a dispatcher received information about the outage. The volume of liquidated electricity undersupply during the outage was 20 kWh for consumers S1–S29; the effect of liquidated damage from electricity undersupply for these consumers was USD32 when a specific damage value is USD 1.6 (RUB 120) per kWh, according to [41]. Electricity undersupply for consumers S30–S43 amounted to 6 kWh per 0.83 h. The damage from the undersupply, respectively, was USD 9.6. The damage proved to be unstable, and manual re-switching the SU on was successful. It should be noted that a week before the SU installation, a 0.4 kV power transmission line was also disconnected. In that case, all consumers connected to the PTL were de-energized, since the AS at the beginning of PTL had been triggered. The outage was also 0.8–1 h.
The damage from electricity undersupply in the described case was taken from the technical reports of power grid company. The damage was calculated according to the methodology lying in the determination of power supply restoration time from the moment a dispatcher receives information about the shutdown. However, the actual damage was underestimated due to the fact that the time interval from the moment of the shutdown itself and the moment when the consumer reports it to a dispatcher is not taken into account in the methodology. According to our previous research [42], the power supply restoration time (h) can be disaggregated into the following constituents:
where
- tobt. infor. is time interval to obtain information about a failure, h;
- trec. infor. is time interval to recognize information about a failure, h;
- trepair is time interval to repair failed equipment, h;
- and tharmonize is time interval to connect repaired equipment including activities to harmonize connection, h.
The numerical values of these constituents have been deduced using the methods of expert assessments and analyzing statistical data provided by the electric grids of Orel region, Russia [43]. So, we have obtained tobt. infor.=1.01 h, trec. infor. = 2.94 h, trepair =1 h, and tharmonize = 0.33 h.
In the case of SU disconnection in Mezenka village, power supply restoration time was 0.83 h, and it included the time interval from the moment a dispatcher obtained information on a failure to the moment where disconnected consumers were energized. The constituents of PS restoration time were as follows:
- Time to obtain information on a failure, i.e., the time interval from the moment of the beginning of PS outage to the moment local residents reported this fact to a dispatcher, is not known;
- Time to recognize information on a failure was approximately 0.1–0.15 h and included time intervals on:
- Recognition of information about the failure place received during communication with a consumer and on making decision by a dispatcher (0.1–0.15 h);
- Preparation of a repair brigade for departure and reaching the failure place (amounted to 0.8 h);
- Inspection of SU (roughly 0.05–0.1 h);
- Search for the location of PTL failure (equal to 0 h, because the damage was unstable);
- Time to repair failed equipment was absent, since a repair team only re-switched the device on manually, and it turned out to be successful;
- Time to harmonize the connection of repaired equipment to PS network and the connection itself equaled to no more than 0.05 h.
The values of the indicated time intervals were determined by means of timing when modeling the situation of switching SU off after the present case.
Based on this information, the estimated actual PS restoration time in the event of unstable damage was determined taking actual time to obtain information (in view of the lack of information about the value) equal to 1.01 h in accordance with [43]:
Accordingly, the damage from electricity undersupply for consumers S30–S43 was not USD 9.6 as indicated in the PS company report but increased proportionally up to USD 21.28 with the same values of specific damage from electricity undersupply. The liquidated damage for consumers S1–S29 amounted to USD 70.93. This is due to the fact that our calculations take into account time to obtain information on a failure for the determination of PS restoration time as opposed to how it was calculated by power grid companies.
4.4. Effect of Sectionalization in the Event of Stable Failure
The economic effect of SU installation in the case of a failure turned out to be stable could be significantly higher. According to the same statistical values [43], time to carry out repairs can be assumed to be equal to 1 h. Time to recognize information in this case would include a constituent for finding the location of PTL failure. This time can amount to 1.2 h, where 0.4 h is spent on searching a failure location. Thus, PS restoration time will be:
Therefore, if the failure in Mezenka electrical network was stable, the damage from electricity undersupply for consumers S30–S43 would increase proportionally to USD 38.28. The liquidated damage for consumers S1–S29 would amount to USD 127.61.
4.5. Effect of Sectionalization and Automatic Reclosing in the Event of Unstable Failure
Equipping the SU with a microcontroller control unit capable of realizing an automatic reclosing function allows for a reduction in three constituents of PS restoration time. They are time for obtaining information (tobt. infor.), time for recognizing information (trec. infor.), and time for connecting the repaired equipment (tharmonize). If the PTL failure is unstable, PS restoration time could be reduced to the value of recloser time delay of SU contactor (in the experimental sample it is set equal to 0.5 min, or 0.0083 h), that is:
The reduction in PS restoration time would be:
Therefore, in case of the unstable failure, the application of SU with automatic reclosing function would enable us to reduce PS restoration time slightly more than 221 times. The damage would decrease significantly for consumers S30–S43 approaching USD 0.1, whereas the liquidated damage for consumers S1–S29 would amount to the same USD 70.93.
4.6. Effect of Sectionalization and Automatic Reclosing in the Event of Stable Failure
If a failure turned out to be stable, the main change in PS restoration time would be associated with a reduction in the duration of obtaining and recognizing information. In the considered case of failure in Mezenka village, the time to obtain information about it will be reduced up to time required for message transmission from SU to a dispatcher and its analysis. According to [43], this constituents can be also disaggregated into the constituents:
where
- tobt. infor.1 is time interval to obtain information about a failure by a sensor;
- tobt. infor.2 is time interval to obtain information about a failure by a signaling unit of dispatcher room;
- and tobt. infor.3 is time interval to obtain information about a failure by a dispatcher.
Time intervals tobt. infor.1 and tobt. infor.2 depend on the applied data transmission method, for example, for the GPRS data transmission technology, together, they will be less than one second (0.0002 h) [44]. The time interval tobt. infor.3 depends on the mode of information display to a dispatcher and includes the time required for a dispatcher to notice a message and read it. According to study [45], when equipping a dispatcher room with a SCADA system, this time interval is no more than 15 s (0.0042 h). Hence, time for receiving information about failure in the considered case would be 0.0044 h, and therefore, the power supply restoration time would be:
The reduction in PS restoration time would be:
Therefore, in the case of the stable failure, the application of SU with automatic reclosing function would enable to reduce PS restoration time over than 1.44 times. The damage would decrease for consumers S30–S43 up to USD 26.58, whereas the liquidated damage for consumers S1–S29 would amount to USD 127,61.
4.7. Payback of Capital Investment in SU Installation
According to the technical reports of power grid company, the estimated time of emergency power supply outages during a year is 3.59 h; however, as it has been explained in the particular case, the actual power supply outage time is 24% higher than the estimated, since the methodology does not take into consideration the time to obtain information on a failure. Thus, the actual power supply outage time will increase up to 4.44 h per year, whereby it will be 1.78 h/year for stable failures and 2.66 h/year for unstable failures. The damage caused by electricity undersupply for the entire transmission line will be USD 936.98 per year. From the calculations described above, it is shown that the installation of SU with automatic reclosing function will enable us to reduce PS restoration time by 1.44 times in case of stable failures and by 221.7 times in case of unstable failures. Thus, the installation of sectionalizing unit in Mezenka electrical network allows reducing power supply outage time for stable failures from 1.78 h/year to 1.24 h/year and, for unstable failures, from 2.66 h/year to almost zero (0.01 h/year). In total, power supply outage time during a year after SU installation will amount to 1.25 h. The damage caused by electricity undersupply in such a case will be USD 263.79 per year, that is, 3.6 times less than in the original case (without sectionalizing units), and the effect of sectionalization () will equal to USD 673.19 USD/year. Since the capital cost of SU implementation is 1467 USD/year and operating cost of servicing SU is 90.64 USD/year, annual economic effect from SU installation (Equation (13)) will be:
As G ≥ 0, SU installation in Mezenka electrical network will pay off.
The payback of capital investment in SU installation within the Mezenka electrical network will be:
A payback period of 2.52 years in the considered case demonstrates remarkable effectiveness of SU installation with automatic reclosing function in the Mezenka electrical network.
5. Conclusions
Sectionalizing 0.4 kV PTLs allows increasing power supply reliability and reducing the electricity undersupply by preventing disconnection of consumers connected to the PTL in the event of a short circuit in the PTL behind the sectionalizing unit. The proposed methodology allows allocating SU in 0.4 kV PTLs in terms of two criteria: criterion of sensitivity limits against single-phase short circuits and criterion of power supply reliability improvement. The main criterion is one for ensuring the sensitivity of line protection, as it is directly related to electrical safety. It allows determining the maximum distance from TS at which SU can be installed. Further, the second criterion is applied so as to set SU installation location as well as to test the feasibility of SU introduction. The developed methodology was tested in the Mezenka electrical network (Oryol region, Russia) and showed economic effects for SUs both with and without automatic reclosing function. The considered case of SU installation demonstrated the remarkable effectiveness with 2.52 years payback period, whereas our experience of the trial operation of sectionalizing units confirms such payback periods.
Future research directions are planned to develop the improved designs of sectionalizing units allowing for sectionalizing and reclosing PTLs with branch lines, to develop software products automating the process to determine the quantity and locations of SUs taking into account the methodology discussed in this work, and to adopt the proposed methodology for application in MV and HV electrical networks.
Author Contributions
Conceptualization, A.V. (Alexander Vinogradov); methodology, A.V. (Alexander Vinogradov); software, A.V. (Alina Vinogradova); validation, A.V. (Alexander Vinogradov) and A.D.; formal analysis, A.V. (Alina Vinogradova) and V.B.; investigation, A.V. (Alina Vinogradova), V.B. and A.B.; resources, A.I. and A.D.; data curation, A.V. (Alina Vinogradova) and V.B.; writing—original draft preparation, A.V. (Alexander Vinogradov) and A.V. (Alina Vinogradova); writing—review and editing, V.B.; visualization, V.B. and A.B.; supervision, A.I. and A.D.; project administration, A.D.; funding acquisition, A.I. All authors have read and agreed to the published version of the manuscript.
Funding
This research received no external funding.
Conflicts of Interest
The authors declare no conflict of interest.
References
- Smith, R.G.; Zhou, Y.; Montante, J.; Alejandro, M.; Ross, M. Dropout Recloser. U.S. Patent No US20150116878A1, 28 July 2020. [Google Scholar]
- Laplace, C.J.; Hart, D.G.; Egolf, W.M. Adaptive Recloser/Sectionalizer. U.S. Patent No US6778370B1, 17 August 2004. [Google Scholar]
- Siemens Industry, Inc. Siemens Distribution Feeder Automation (SDFA) System. Available online: https://assets.new.siemens.com/siemens/assets/api/uuid:91228e3d-2d52-495b-a9a7-d9cbddc70057/version:1573791922/sdfa-brochure-flisr.pdf (accessed on 10 November 2021).
- Junior, C.G.L.; De Oliveira, A.A.P. Single-Phase, Equipotential, Low-Cost, Easy-to-Install Recloser. U.S. Patent No US20200244059A1, 30 July 2020. [Google Scholar]
- Chaly, A.M.; Chervinsky, O.I. Reclouser (Air Line Circuit Breaker) TEL. RU Patent No RU2142187, 27 November 1999. [Google Scholar]
- Fursov, A.S.; Skazko, V.A. Reclouser. RU Patent No RU102840, 10 March 2011. [Google Scholar]
- IEC/IEEE International Standard—High-Voltage Switchgear and Controlgear—Part 111: Automatic Circuit Reclosers for Alternating Current Systems Up to and Including 38 kV; The Institute of Electrical and Electronics Engineers, Inc.: New York, NY, USA, 2019; p. 134.
- Haakana, J.; Lassila, J.; Kaipia, T.; Partanen, J. Comparison of Reliability Indices From the Perspective of Network Automation Devices. IEEE Trans. Power Deliv. 2010, 25, 1547–1555. [Google Scholar] [CrossRef]
- Pálfi, J.; Tompa, M.; Holcsik, P. Analysis of the efficiency of the recloser function of lv smart switchboards. Acta Polytech. Hung. 2017, 14, 131–150. [Google Scholar]
- Bengtsson, P.; Persson, L.-A.; Oberger, K.; Hasselstrom, J. Reliability-based planning in rural areas; goals, methods, prioritization, and follow-up at Fortum distribution. In Proceedings of the IET Conference Publications, Institution of Engineering and Technology (IET), Prague, Czech Republic, 8–11 June 2009; Volume 1, p. 442. [Google Scholar]
- Ramos, C.C.O.; Rodrigues, D.; De Souza, A.N.; Papa, J.P. On the Study of Commercial Losses in Brazil: A Binary Black Hole Algorithm for Theft Characterization. IEEE Trans. Smart Grid 2016, 9, 676–683. [Google Scholar] [CrossRef] [Green Version]
- Millard, R.; Emmerton, M. Non-technical losses—How do other countries tackle the problem? In Proceedings of the 22nd AMEU Technical Convention, Pretoria, South Africa, 28 September 2009; Available online: http://www.eepublishers.co.za (accessed on 10 November 2021).
- Kabalci, E. Emerging smart metering trends and integration at MV-LV level. In Proceedings of the 2016 International Smart Grid Workshop and Certificate Program (ISGWCP), Istanbul, Turkey, 21–25 March 2016; pp. 1–9. [Google Scholar]
- Zou, K.; Keerthipala, W.W.L.; Perera, S. SAIDI minimization of a remote distribution feeder. In Proceedings of the 2007 Australasian Universities Power Engineering Conference, Perth, Australia, 9–12 December 2007; pp. 1–5. [Google Scholar]
- Heine, P.; Lehtonen, M. Voltage sag distributions caused by power system faults. IEEE Trans. Power Syst. 2003, 18, 1367–1373. [Google Scholar] [CrossRef] [Green Version]
- IEEE Guide for Electric Power Distribution Reliability Indices; IEEE: Piscataway Township, NJ, USA, 2008; pp. 1–21. [CrossRef]
- Warren, C.; Ammon, R.; Welch, G. A survey of distribution reliability measurement practices in the US. IEEE Trans. Power Deliv. 1999, 14, 250–257. [Google Scholar] [CrossRef]
- Williams, C.; McCarthy, C.; Cook, C. Predicting Reliability Improvements. IEEE Power Energy Mag. 2008, 6, 53–60. [Google Scholar] [CrossRef]
- Soudi, F.; Tomsovic, K. Optimized distribution protection using binary programming. IEEE Trans. Power Deliv. 1998, 13, 218–224. [Google Scholar] [CrossRef]
- Soudi, F.; Tomsovic, K. Optimal trade-offs in distribution protection design. IEEE Trans. Power Deliv. 2001, 16, 292–296. [Google Scholar] [CrossRef]
- Soudi, F.; Tomsovic, K. Towards optimized distribution protection design. In Proceedings of the Third International Conference on Power System Planning and Operations, Abidjan, Ivory Coast, January 1997; pp. 354–358. Available online: http://citeseerx.ist.psu.edu/viewdoc/download?doi=10.1.1.33.3302&rep=rep1&type=pdf (accessed on 10 November 2021).
- Sohn, J.-M.; Nam, S.-R.; Park, J.-K. Value-Based Radial Distribution System Reliability Optimization. IEEE Trans. Power Syst. 2006, 21, 941–947. [Google Scholar] [CrossRef]
- Da Silva, L.G.; Pereira, R.A.; Mantovani, J.R.S. Allocation of protective devices in distribution circuits using nonlinear programming models and genetic algorithms. Electr. Power Syst. Res. 2004, 69, 77–84. [Google Scholar] [CrossRef]
- Zambon, E.; Bossois, D.Z.; Garcia, B.B.; Azeredo, E.F. A Novel Nonlinear Programming Model for Distribution Protection Optimization. IEEE Trans. Power Deliv. 2009, 24, 1951–1958. [Google Scholar] [CrossRef] [Green Version]
- Dehghani, N.; Dashti, R. Optimization of Recloser Placement to Improve Reliability by Genetic Algorithm. Energy Power Eng. 2011, 3, 508–512. [Google Scholar] [CrossRef] [Green Version]
- Popović, D.; Greatbanks, J.; Begović, M.; Pregelj, A. Placement of distributed generators and reclosers for distribution network security and reliability. Int. J. Electr. Power Energy Syst. 2005, 27, 398–408. [Google Scholar] [CrossRef]
- Abedi, A.; Gaudard, L.; Romerio, F. Power flow-based approaches to assess vulnerability, reliability, and contingency of the power systems: The benefits and limitations. Reliab. Eng. Syst. Saf. 2020, 201, 106961. [Google Scholar] [CrossRef]
- Tostado-Veliz, M.; Kamel, S.; Jurado, F. Power Flow Approach Based on the S-Iteration Process. IEEE Trans. Power Syst. 2020, 35, 4148–4158. [Google Scholar] [CrossRef]
- Mahdavi, M.; Alhelou, H.H.; Hatziargyriou, N.D.; Jurado, F. Reconfiguration of Electric Power Distribution Systems: Comprehensive Review and Classification. IEEE Access 2021, 9, 118502–118527. [Google Scholar] [CrossRef]
- Carrión, D.; García, E.; Jaramillo, M.; González, J.W. A Novel Methodology for Optimal SVC Location Considering N-1 Contingencies and Reactive Power Flows Reconfiguration. Energies 2021, 14, 6652. [Google Scholar] [CrossRef]
- Bupasiri, R.; Wattanapongsakorn, N.; Hokierti, J.; Coit, D. Optimal electric power distribution system reliability indices using binary programming. In Proceedings of the Annual Reliability and Maintainability Symposium, Tampa, FL, USA, 27–30 January 2003; pp. 556–561. [Google Scholar]
- Falaghi, H.; Haghifam, M.-R.; Singh, C. Ant Colony Optimization-Based Method for Placement of Sectionalizing Switches in Distribution Networks Using a Fuzzy Multiobjective Approach. IEEE Trans. Power Deliv. 2008, 24, 268–276. [Google Scholar] [CrossRef]
- Pombo, A.V.; Pina, J.M.; Pires, V.F. A multiobjective placement of switching devices in distribution networks incorporating distributed energy resources. Electr. Power Syst. Res. 2016, 130, 34–45. [Google Scholar] [CrossRef]
- Rodrigues, E.; Leite, H.; Silva, N.; Miranda, I. Reclosers to Self-Healing schemes in distribution networks: A techno-economic assessment. In Proceedings of the 2016 IEEE International Energy Conference (ENERGYCON), Leuven, Belgium, 4–8 April 2016; pp. 1–6. [Google Scholar]
- Rodrigues, E.; Miranda, I.; Silva, N.; Leite, H. Optimal recloser deployment to leverage self-healing: A techno-economic robustness assessment. CIRED-Open Access Proc. J. 2017, 2017, 2467–2470. [Google Scholar] [CrossRef]
- Popov, N.M. Emergency Modes in 0.38 kV Networks with a Dead-Grounded Neutral; KGSKhA: Kostroma, Russia, 2005. [Google Scholar]
- Vinogradov, A.V.; Vinogradova, A.V. Improving the Reliability of Power Supply to Rural Consumers through Sectionalizing and Redundancy of 0.38 kV; Orel GAU: Orel, Russia, 2016. [Google Scholar]
- Vinogradov, A.; Vasilyev, A.N.; Dorokhov, A.; Bolshev, V.; Psaryov, A. Place Selection of Sectionalizing Units in 0.38 kV Power Networks. Int. J. Energy Optim. Eng. 2021, 10, 35–52. [Google Scholar] [CrossRef]
- Khachaturov, T. Ways of Increasing the Effectiveness of Capital Investment. Probl. Econ. 1979, 22, 3–24. [Google Scholar] [CrossRef]
- ROSSETI. Concept Digital Transformation Moscow; ROSSETI: Moscow, Russia, 2018. [Google Scholar]
- Khorolskiy, V.Y.; Taranov, M.A.; Petrov, D.V. Technical and Economic Calculations of Distribution Electric Networks; Terra Print: Rostov-on-Don, Russia, 2009. [Google Scholar]
- Vinogradov, A.; Vasiliev, A.; Bolshev, V.; Semenov, A.; Borodin, M. Time Factor for Determination of Power Supply System Efficiency of Rural Consumers. In Handbook of Research on Renewable Energy and Electric Resources for Sustainable Rural Development; Kharchenko, V., Vasant, P., Eds.; IGI Global: Hershey, PA, USA, 2018; pp. 394–420. [Google Scholar]
- Vinogradov, A.; Bolshev, V.; Vinogradova, A.; Jasiński, M.; Sikorski, T.; Leonowicz, Z.; Goňo, R.; Jasińska, E. Analysis of the Power Supply Restoration Time after Failures in Power Transmission Lines. Energies 2020, 13, 2736. [Google Scholar] [CrossRef]
- Kuzlu, M.; Pipattanasomporn, M.; Rahman, S. Communication network requirements for major smart grid applications in HAN, NAN and WAN. Comput. Netw. 2014, 67, 74–88. [Google Scholar] [CrossRef]
- Kaptsevich, O.A.; Dubovskiy, A.V.; Rabchenok, D.I. The time component of analytical model of the air traffic control dispatcher actions. Dokl. BGUIR 2019, 123, 79–86. [Google Scholar] [CrossRef]


Publisher’s Note: MDPI stays neutral with regard to jurisdictional claims in published maps and institutional affiliations. |
© 2021 by the authors. Licensee MDPI, Basel, Switzerland. This article is an open access article distributed under the terms and conditions of the Creative Commons Attribution (CC BY) license (https://creativecommons.org/licenses/by/4.0/).