Article

Scaled Experiment of the Detonation Control System for the High-Speed Penetration on Concrete

State Key Laboratory of Explosion Science and Technology, Beijing Institute of Technology, Beijing 100081, China
*
Authors to whom correspondence should be addressed.
Appl. Sci. 2021, 11(23), 11556; https://doi.org/10.3390/app112311556
Submission received: 13 November 2021 / Revised: 2 December 2021 / Accepted: 4 December 2021 / Published: 6 December 2021

Abstract

:
The design scheme and fabrication technology of the detonation control system for the high-speed deep penetration need to be tested for reliability and effectiveness through shooting range tests. However, the shooting range tests of the high-speed deep penetration are so demanding and expensive that it is difficult for the detonation control system to be tested many times. This paper focuses on penetration characteristics of the detonation control system to put forward a laboratory-scaled experiment method with the low impact velocity. Independent parameters of projectile and target affecting the penetration characteristics are effectively analyzed and extracted. A multi-parameter programming method of the scaled experiment for high-speed deep penetration is established. By adjusting the key parameters, the loading conditions of the scaled experiment can be obtained, which can get the comparable deceleration curve with those of the high-speed deep penetration. Finally, the extreme working environment for the detonation control system in the high-speed deep penetration is simulated through the scaled experiment in the laboratory. The scaled experiment method can get the comparable deceleration peak and time history. It is highly economical, and the experimental process is also repeatable, which can provide a reliable reference for the protection design into the projectile.

1. Introduction

As the speed of the kinetic energy penetrator is getting faster and the geometry size is getting bigger, it is difficult to launch large-size and high-speed penetrators with the traditional two-stage gasgun [1]. Meanwhile, for the high-speed penetration with thick targets, the high cost, long test cycle and difficulty of shooting range tests greatly limit the number of tests. In addition, in the process of the high-speed penetration, the detonation control system will suffer from hardware damage or abnormal performance after a long period of high deceleration, which makes the projectile unable to achieve the damage effect [2]. The penetration characteristics need to be obtained effectively to optimize the detonation control system when the projectile penetrates the thick target. For these reasons, many researchers want to solve the difficulties encountered in the experimental technology through the scaled penetration.
In recent years, the laboratory-scaled experiments of high-speed penetration have been studied through dimensional analysis and optimization algorithms, but the scaled experiment research of large-scale and high-speed penetration still faces some problems. Chen [3,4,5], Huang and Peng et al. [6,7] has gradually carried out research on the scaled penetration of high-speed, which mainly focuses on the penetration depth of concrete targets. There is less research on the scaled optimization and overload characteristics. It mainly uses the dimensional analysis method to analyze, but this method often requires uniform shrinkage and can only be applied to static or low-speed impact problems. Dimensional analysis method does not meet the engineering application of high-speed penetration [8,9]. Li [10] proposed a scaled method for large projectiles with small ones to obtain equivalent deceleration by adjusting parameters such as the mass and the diameter of projectiles and targets. However, the authors only make a simple theoretical analysis based on the Pelodi formula, and the theoretical analysis needs to be further studied with the numerical simulation and experiments. The Kriging model is used to match the functions of the deceleration peak and time history for design variables [11]. After adjusting the simulation model and its internal program parameters, the suitable scaled experiment scheme is found. However, the workload is large and time-consuming, and lacks theoretical support through the amount of FE simulations. For the high-speed penetration, high-speed launches are still maintained in their optimal scaled experiment scheme, which does not reduce the experiment difficulty.
It is an effective method for some problems of the high-speed deep penetration to carry out scaled penetration experiments in the laboratory. The cycle of designing geometric parameters and material parameters of simulated projectiles and targets in the laboratory is short, which is conducive to adjusting the scaled scheme. The scaled experiments have the advantages of low difficulty, small scale and good economy, so many penetration experiments can be carried out. The scaled research of the high-speed deep penetration mainly focuses on the mechanical characteristics of the penetration process and the shape effect of the projectile nose shape [12,13]. At present, the scaled experiment verification is mainly used for predicting penetration depth, etc. In addition, in order to test the performance of the components used for the high-speed deep penetration, it is relatively easy to obtain a physical quantity characteristic similar to the original test, such as the deceleration peak or the time history, by using a small-size projectile and target. However, it is difficult to simulate both the deceleration peak and the time history at the same time.
In this paper, the deceleration characteristics of the high-speed deep penetration in shooting range tests are analyzed. Then, the independent parameters of the projectile and the target which significantly affect the penetration characteristics are extracted based on the spherical cavity-expansion theory. Based on the analysis of projectile parameters, target parameters and launch parameters, a multi-parameter programming method of the scaled experiment is established for high-speed deep penetration. At the same time, the required peak and time history of the deceleration are achieved, and the working environment of the projectile components is restored as much as possible under high-speed deep penetration conditions. The feasibility of the scaled scheme is further verified by the FE simulation and the scaled experiment.

2. Characteristics Analysis of the High-Speed Deep Penetration

The target to be hit by the kinetic energy penetrator is usually deep underground. After the meter-level penetration depth, the working time of the detonation control system can reach millisecond level. The high-speed deep penetration test can be used to examine whether the detonation control system can withstand such a complex working environment. The impact velocity of the projectile is more than 800 m/s, and the target material is generally concrete with a thickness unit of meter, which is much greater than the projectile length.
The sensor in the detonation control system collects the deceleration data of the whole process. The deceleration trend of the high-speed deep penetration can be like the curve in Figure 1. As can be seen from Figure 1, the peak collected by the sensor reaches 16,598 g. Before about 5.6 ms, the working environment of the components installed into the projectile is extremely harsh, so the initial stage of deep penetration needs to be mainly considered in the scaled experiment. Compared with the data in the initial stage, the deceleration decreases rapidly after about 5.6 ms, and the deceleration can be considered that it basically falls back to 0 and fluctuates around 0.
The high-speed deep penetration is a hot and difficult point in the field of penetration. When the launching platform provides the projectile with high speed (more than 800 m/s), and the concrete target is usually several meters thick, the deceleration data of the detonation control system during the high-speed deep penetration has three main characteristics.
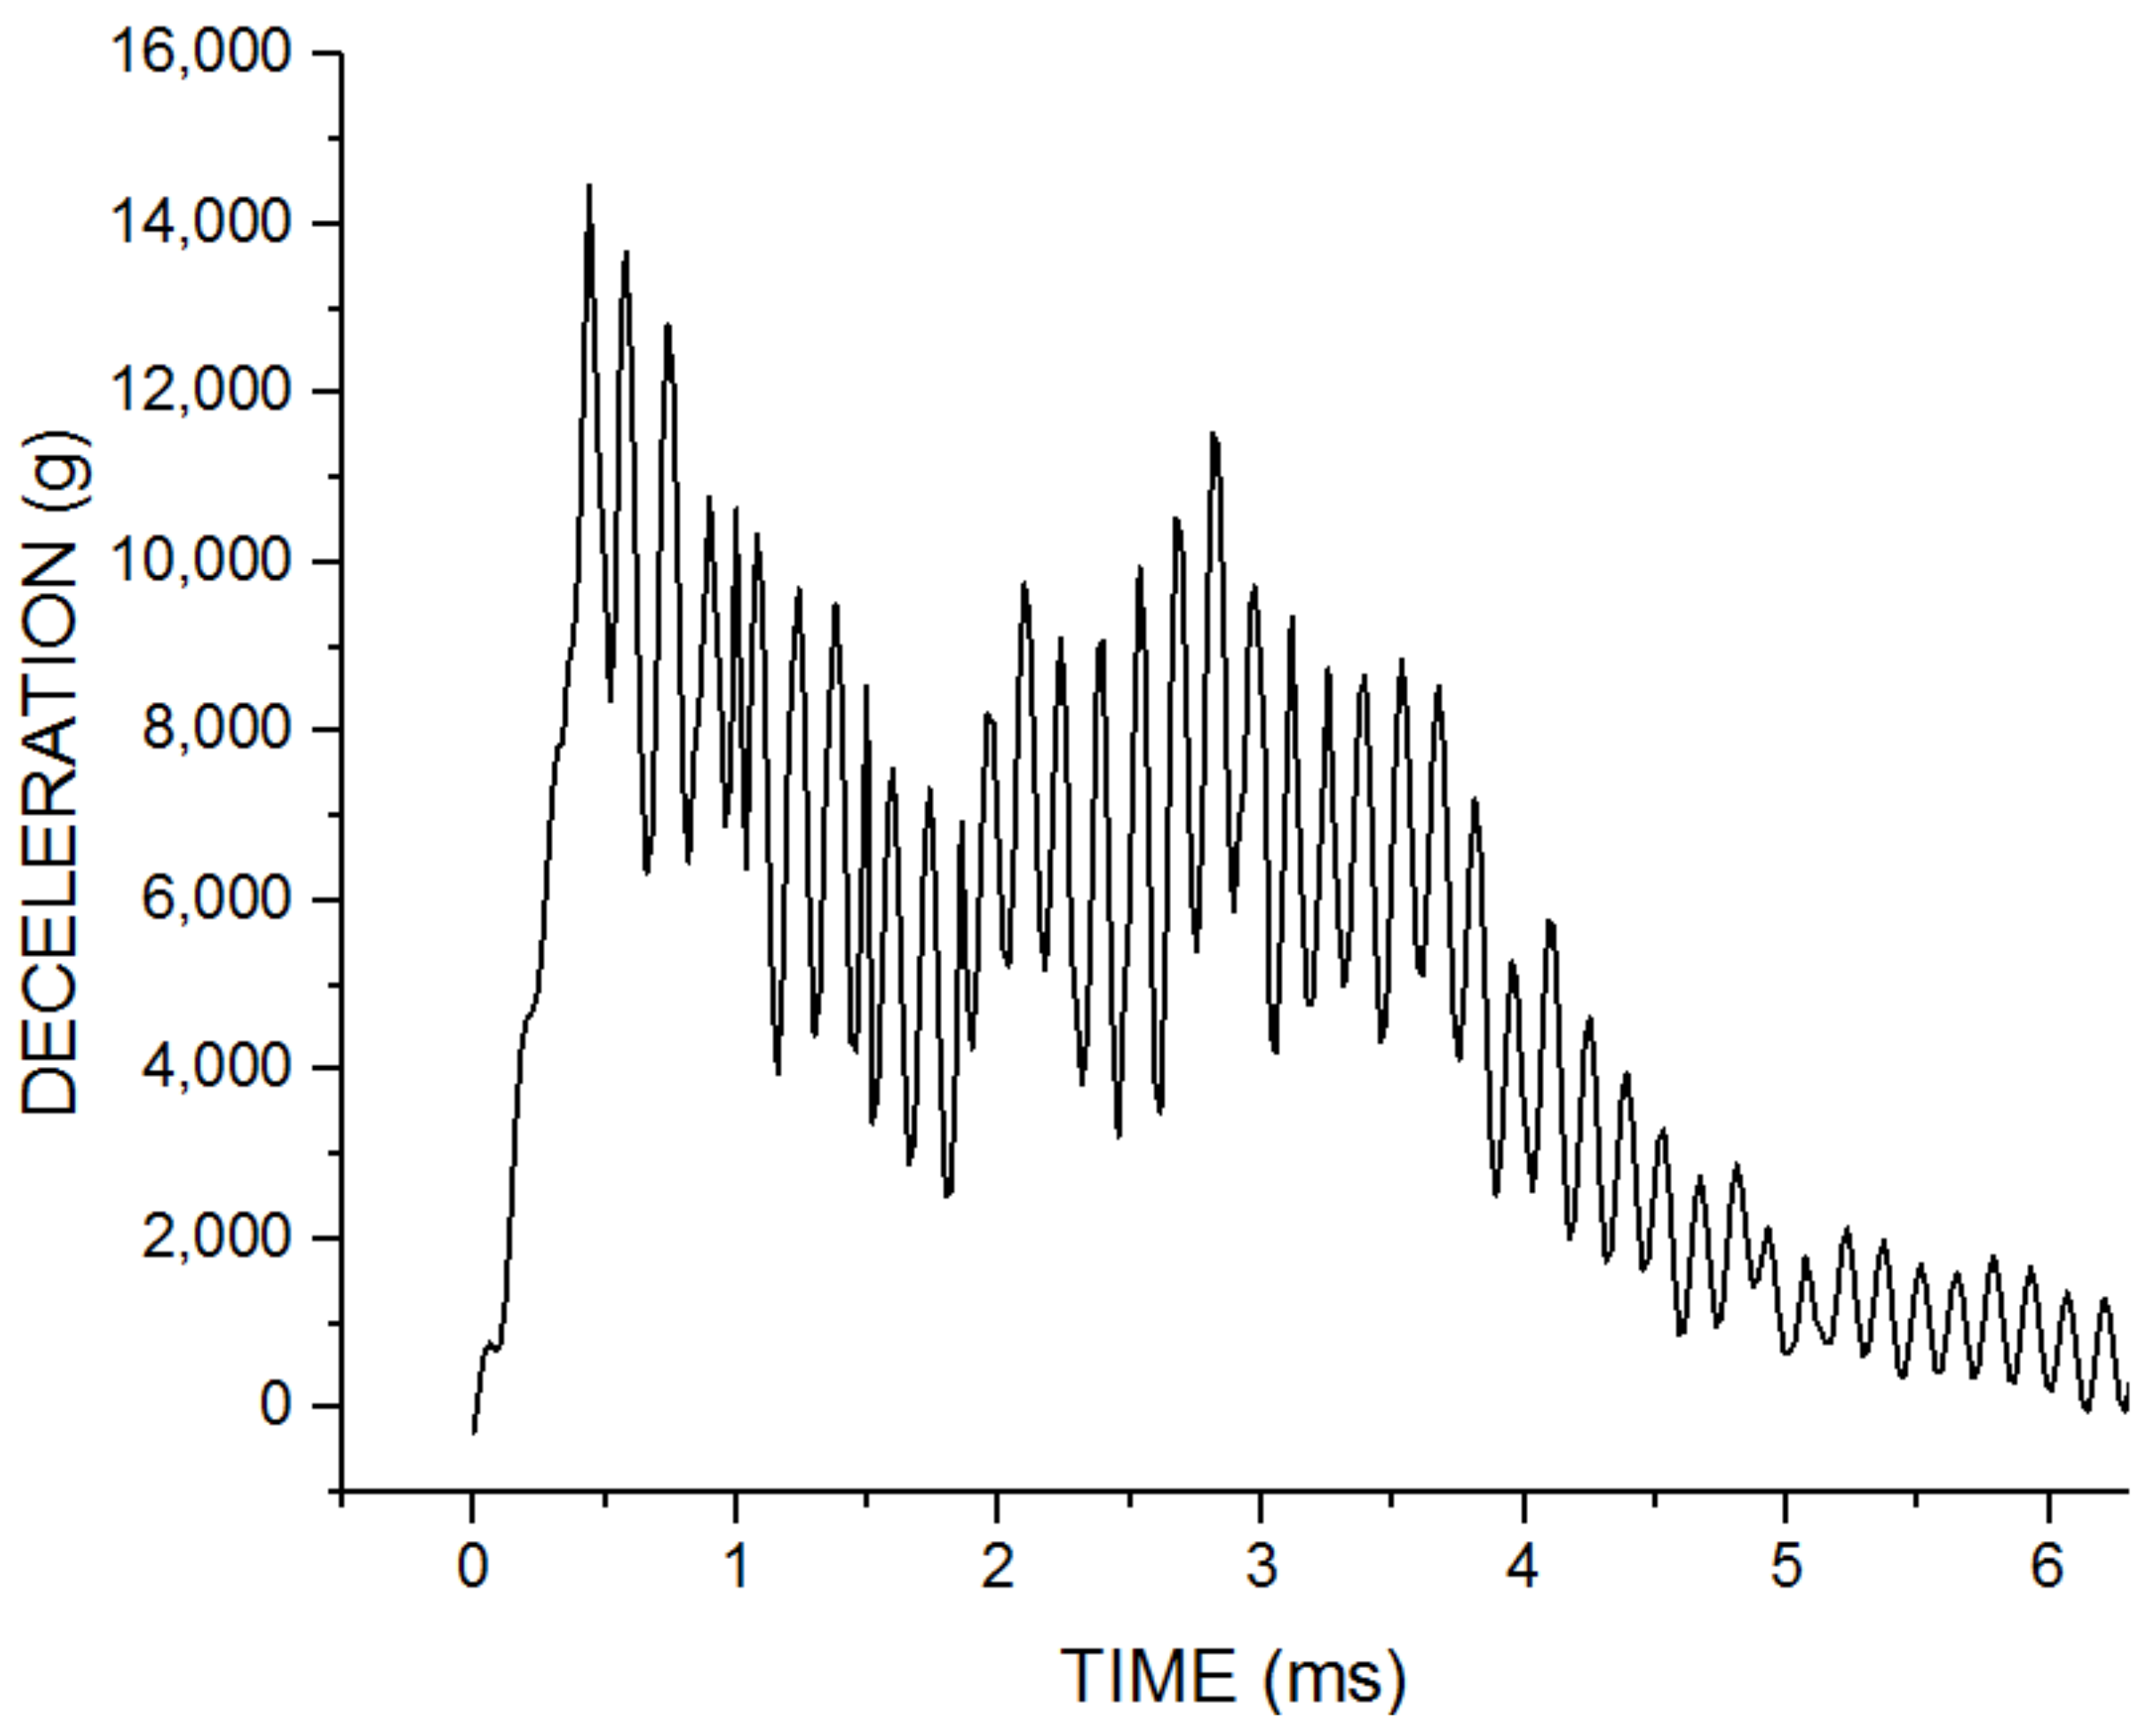
  • The deceleration peak is very high, which can reach 10 4 orders of magnitude;
  • The time history of deceleration is very long, and the significantly large oscillation time is usually at the millisecond level;
  • The attenuation of deceleration signal is obvious in the middle and rear section of the curve, and the deceleration can decay to 10 2 orders of magnitude.
Next, this paper will propose the scaled experiment method for the deceleration of the detonation control system during the high-speed deep penetration to simulate the complex working environment experienced by the detonation control system.

3. Parameter Analysis of the Deceleration

3.1. The Deceleration Model of the Deep Penetration

The spherical cavity expansion model proposed by Forrestal et al. has been verified by a lot of experiments, and it has been found to be suitable as an analysis model for concrete penetration [14,15,16]. When the projectile impacts a semi-infinite target, the following model derivation is based on the incompressibility of the material and the invariability of the projectile. The penetration process of projectile perpendicular to target can be divided into two different stages: the crater and steady penetration. In this section, the crater model and the steady penetration model, respectively, are described for high-speed deep penetration, based on the theory of spherical cavity expansion.
For the deep penetration, the crater stage is very short for the whole penetration process, and the impact on the penetration deceleration is very small. The relationships between the deceleration, velocity, penetration depth and time are
a = λ 1 v s sin λ 1 t , t t
v = v s cos λ 1 t , t t
z = v s λ 1 sin λ 1 t , t t
where a and v are the deceleration and the velocity of the detonation control system during the crater stage, z is the penetration depth, v s is the initial impact velocity, t is the time at the end of the crater stage, and λ 1 is a constant related to the initial impact velocity and the projectile diameter.
The steady penetration is the main stage of the deep penetration. The working environment of the detonation control system at this stage is extremely bad, and the deceleration signal is extremely complex [3,17].
When a rigid projectile with an arbitrary nose impacts a semi-infinite target, the motion equation can be written as
M d v d t = π d 2 4 A τ N 1 + B ρ N 2 v 2
where   M   is the projectile mass, d is the projectile diameter, N 1 and   N 2 are two dimensionless parameters relating to the nose shape and friction, ρ   is the initial density of the target material, τ   is the ultimate stress of the target material, and A, B are dimensionless material constants.
Derived from Equation (4), the relation between deceleration   a , time t and velocity   v can be obtained
a = π d 2 4 M A τ N 1 + B ρ N 2 v 2
t = 16 M 2 π 2 d 4 A τ N 1 B ρ N 2 arctan B ρ N 2 A τ N 1 v + c 1
In the steady penetration stage, the initial condition ( t = 0 , v = v 1 ) can be used to get the constant   c 1
c 1 = 16 M 2 π 2 d 4 A τ N 1 B ρ N 2 a r c tan B ρ N 2 A τ N 1 v 1
where v 1 is the projectile velocity at the beginning of the steady penetration stage.
It can be directly seen in Equations (5) and (6) that the parameters that affect the deceleration and time history are as follows: the projectile mass and diameter, the nose shape of the projectile, the target density and strength.
To describe the basic characteristics of the nose shape, a dimensionless quantity φ (the caliber-radius-head) is usually introduced. The expression is
φ = s d
where s has different meanings due to different shapes of noses. The value range of φ is   φ 1 2 , + . With the increase in the   φ , the nose shape changes from the blunt nose to the hemi-spherical nose and then to the ogive nose, and the most common one is the ogive nose. It can be seen from Equation (9) to Equation (12), the values of the φ directly affect the shape parameters N 1 and     N 2 of the ogive nose if   μ m = 0 [3,17]. The shape parameters of other projectile noses can also be expressed by   φ , so it is written as N 1 φ and   N 2 φ .
N 1 = 1 + 4 μ m φ 2 π 2 φ 0 sin 2 φ 0 2
N 2 = N * + μ m φ 2 π 2 φ 0 1 3 sin 2 φ 0 + sin 4 φ 0 24
where
N * = 1 3 φ 1 24 φ 2 ,   0 < N * 1 2
φ 0 = s i n 1 1 1 2 φ , φ 1 2
The projectile mass is not an independent parameter [18,19,20]. In Equation (13), the projectile mass is divided into two parts: the nose mass and the body mass [21,22,23]. The equivalent density   ρ e q u , the diameter   d , the   φ   and the length of the projectile body L can affect the projectile mass, which in turn will affect the deceleration and the time history.
M π d 2 = 1 4   ρ e q u L + ρ e q u d φ 3 1 φ 1 1 4 φ 1 1 3 φ + 1 12 φ 2 1 1 2 φ cos 1 1 1 2 φ
Combining with Equations (5) and (6) and the above analysis, the whole time t m and the deceleration peak a m of the steady penetration stage can be written for the semi-infinite target.
a m = A τ N 1 φ + B ρ N 2 φ v 1 2   ρ e q u L + 4 ρ e q u d φ 3 1 φ 1 1 4 φ 1 1 3 φ + 1 12 φ 2 1 1 2 φ cos 1 1 1 2 φ  
t m =   ρ e q u L + 4 ρ e q u d φ 3 1 φ 1 1 4 φ 1 1 3 φ + 1 12 φ 2 1 1 2 φ cos 1 1 1 2 φ 2 A τ N 1 φ B ρ N 2 φ   arctan B ρ N 2 φ A τ N 1 φ v 1 2 + c 1  
From Equations (14) and (15), the independent parameters affecting the deceleration peak and time history can be found directly, and they are listed in Table 1. The density of different structures inside the projectile is different, and sometimes there is the cavity structure inside the projectile [24]. Dealing with the density of each structure, it is regarded as the equivalent density of the whole projectile. The φ can not only determine different nose shapes of the projectile, but also determine the nose length b together with the projectile diameter. As independent parameters, the projectile diameter and body length can be determined according to the penetration capability required under different working conditions. Although the values of these two parameters are relatively flexible, the actual value range of the length-to-diameter ratio is   5 L + b / d 10   to avoid deforming or breaking.
The independent parameters of the target material are density and strength. Target materials can have different choices for different deceleration environments of the detonation control system, such as sand, concrete, metals, etc. With sand as the target material, its deceleration is characterized by a long time history [25,26]. With metal, on the contrary, as the target material, the deceleration peak is very high [27]. When the projectile penetrates the concrete thickness target, the deceleration value of the detonation control system is not only high, but also has a long time history. Therefore, this paper analyzes the concrete as the target material. For concrete material, the range of the initial density is limited, usually between 2400   kg / m 3 and 2500   kg / m 3 , and its effect on the deceleration is very small. τ is the compressive strength f c for concrete. The material constant A is related to the compressive strength f c and B is usually taken as 1. The compressive strength f c of the concrete varies widely, and its strength is constantly improving with the development of the concrete material.

3.2. Parameter Analysis of the Projectile

The influence of changes in main parameters on the scaled experiment is analyzed below. The control variable method is adopted to analyze the influence of the deceleration with the increase in the specified parameters and using a fixed value for the remaining parameters.

3.2.1. The Nose Shape of the Projectile

The projectile nose shape is a key factor [17]. The   φ   is an independent parameter which directly affects the nose shape. In order to understand the effect of the nose shapes on the deceleration, the design of projectiles with four different noses is listed, and the mass and the material are the same, as shown in Figure 2. At the same time, a simplified model of the detonation control system is established at the tail of the projectile. The deceleration sensor in the system is used to collect the deceleration data. The four projectiles penetrate the concrete targets, respectively, through FE simulation, and the deceleration-time history trend of the detonation control system is described, as shown in Figure 3. The deceleration of the flat-nosed projectile is very high, but its time history is too short, so it is more suitable to be used to simulate experiments with thin targets. Although the deceleration peak of the blunt-nosed projectile (   1 2 < φ < 1 ) decreases, the time history increases obviously. When the   φ > 1 , the nose shape becomes ogive. For the ogive nose, the actual value is   2.5 φ 4.5 , and φ = 3 is the most common. From the deceleration peak and the time history, it can be seen that the curve feature of ogive noses is more consistent with the deceleration characteristics of the high-speed deep penetration. It is suggested that the projectile with the ogive nose should be directly used in the laboratory-scaled experiment, and the φ can be slightly adjusted according to the different scaled requirements.

3.2.2. The Diameter and Length of the Projectile

Under the premise that the impact velocity of the projectile is unchanged, the increase in the projectile diameter and length will significantly increase the projectile mass, and then increase the kinetic energy of the projectile. From Equation (13), if the projectile diameter d is given, the caliber-radius-head (CRH) φ is the only parameter to represent the nose shape, and the body length L is an important parameter to represent the projectile mass.
According to the structure of the ogive-nosed projectile ( φ = 3) in Figure 2, the FE models of nine projectiles are established, and their design variables are listed in Table 2. The models of the detonation control systems are also established at the tail of these nine projectile models, and their structures are consistent with the detonation control system in Figure 2. These different projectiles penetrate the concrete with the strength of 20 MPa, 30 MPa and 40 MPa at a speed of 300 m/s and the deceleration data of the detonation control system are obtained. The deceleration peak and time history of the FE simulations are sorted out, as shown in Figure 4.
From the FE simulation results in Figure 4, the diameter and length of the projectile can significantly affect the deceleration. The larger the diameter and the length are, the lower the deceleration peak and the longer the time history is. According to the deceleration characteristics of the high-speed deep penetration, the part with the peak greater than 10,000 g on the deceleration peak surface is projected on the horizontal plane, and the part with duration greater than 4 ms on the time history surface is also projected on the horizontal plane, as shown in Figure 5. As shown in Figure 5a, when selecting a set of projectile length and diameter, the deceleration peak and time history of the detonation control system can be known intuitively when penetrating 40 MPa concrete. It should be noted that the length-to-diameter ratio of the projectile usually meets   5 L + b / d 10   , so it is best to select the projectile length and diameter in the purple area. It is also possible to find the corresponding points in the figure after clarifying the assessment indicators of the detonation control system (the deceleration peak and time history), so as to clarify the geometric size of the projectile in the scaled experiment. Figure 5b–d can be understood with the same idea. When the compressive strength of the concrete target is 40 MPa and 30 MPa, as shown in Figure 5a,b, the overlapping area between the deceleration peak and the time history is very large, which means that there are many groups of projectile diameters and lengths that can be selected to meet different high-speed deep penetration. Especially when the time history is longer than 7 ms, the deceleration peak can still be satisfied at the 10 4 orders of magnitude. When the compressive strength of the concrete target is 20 MPa, as shown in Figure 5c, the overlapping area becomes very small. When a long time history is needed, the deceleration peak will not be too high. In a word, when the solid projectile penetrates the concrete target, combined with Figure 5a–c, a suitable set of the diameter and the length can be selected for the scaled experiment to meet the needs of different deceleration peak and time history of the high-speed deep penetration. Compared with a solid projectile, the difference in a projectile with a cavity structure penetrating into the target is the different equivalent density. The simulation result of the compressive strength of 30MPa is shown in Figure 5d. It can be seen from Figure 5b,d that the cavity structure can make the deceleration peak higher, and the time history is slightly shortened.
In the laboratory-scaled experiment, if the diameter and the length of the projectile are too large, the mass of the projectile will be too heavy. This will not only improve the requirements of the launch device, but also is not conducive to the adjustment of the launch speed. For example, when the diameter of the projectile is 87 mm and the length of the projectile is 870 mm, it is difficult to apply 300 m/s to the projectile in the laboratory.

3.3. The Compressive Strength of the Target

It can be seen from Section 3.1 that independent and effective parameters for the concrete material that affect the deceleration are the density and the compressive strength. However, the density with different strength varies little, and its effect on deceleration is very weak. Different compressive strength has a significant impact on the deceleration, so the compressive strength as the main parameter is analyzed by the FE simulations.
According to the ogive-nosed projectile with φ = 3 and the structure of the detonation control system in Figure 2, the FE model of the projectile is established. In the FE simulations, the compressive strength of the concrete target is 20 MPa, 30 MPa and 40 MPa. The deceleration peak and time history of the detonation control system can be read in Figure 5 and Figure 6. Figure 5 shows the influence of the compressive strength with different geometric parameters of projectile under the constant impact velocity. Figure 6 shows the influence of the compressive strength with different impact velocities. In general, the stronger the concrete is, the higher the deceleration peak is. By using the ogive-nosed projectile, concrete targets of different compressive strength can basically make the deceleration peak on the 10 4 orders of magnitude. It should be noted that when the concrete strength is 20 MPa, the deceleration peak may be less than 10,000 g due to the limitation of the impact velocity or the projectile size. The deceleration peak can be further improved by reducing the mass of the projectile. In addition, choosing the concrete with lower strength is used to have a long time history. So, when selecting the concrete as a target material in the laboratory-scaled experiment, priority is given to low-strength concrete to obtain a long time history.

3.4. The Impact Velocity

Generally speaking, in the laboratory-scaled research, assuming that the projectile penetrates the target vertically, the angle and offensive angle of the projectile are ignored, so only the impact velocity affects the deceleration of the detonation control system. In the shooting range tests, the requirement of the high-speed experiment is high, and the cost is extremely expensive. The original intention of this paper is to carry out the scaled experiment in the laboratory to improve the repeatability of the experiment, so the impact velocity is controlled in a limited range. The single stage gasgun is widely used and cheaper [28]. The impact velocity can be adjusted in the limited low-speed range, and the single stage gasgun usually provides an impact velocity of 200~300 m/s.
In the FE simulation, the ogive-nosed projectile is applied with different impact velocities (200 m/s, 250 m/s, 300 m/s and 350 m/s) to penetrate the concrete targets, and deceleration peaks and time histories at different impact velocities are obtained. The simulation results can prove that the impact velocity has a very obvious impact on the time history and the deceleration, as shown in Figure 6. It can be seen from the peak trend of the deceleration that the change of the impact velocity between 250 m/s and 300 m/s is the most significant for the deceleration peak. When the impact speed is 300 m/s and the concrete with different strength is chosen as the target, the deceleration peak is more than 10,000 g. The higher the impact velocity is, the longer the time history is.
The faster the impact velocity is, the higher the requirements for the launcher in the laboratory are. The projectile models used in the simulations are all solid, and it is difficult for the single stage gasgun to provide these ogive-nosed projectiles with an impact velocity of more than 350 m/s. However, the actual design of the projectile is not a solid structure, and the actual mass will be less than that of the simulation model. The peak and time history of deceleration will be higher than the simulation results. Therefore, the impact velocity is a restrictive condition in the laboratory-scaled experiments, because it can only be adjusted within a limited range.

4. The FE Simulation Scheme of the Scaled Experiment

Based on the parameter analysis of the deceleration in the previous section, it can be known that there is a region that meets the deceleration peak and time history at the same time. A set of projectile length and diameter can be selected in the region to meet the needs of the scaled experiment. Then through the FE simulation, the effect of the scaled experiment scheme to simulate the complex working environment of the detonation control system is verified.

4.1. Description FEM

According to the characteristics analysis of high-speed deep penetration, especially referring to the deceleration curve in Figure 1, a set of projectile length and diameter can be selected in the region where the deceleration peak exceeds 14,000 g and the time history exceeds 5 ms in Figure 5d. The projectile size and structure are designed as shown in Figure 7. The concrete target is 1m in diameter and 0.9m in thickness. The full-scale model shown in Figure 8 is built in the simulation. The element number of the whole projectile is 49296, and that of the target is 480000. According to the Xu [29], the meshing size in this paper can be well matched with the experimental results. The meshing principle is to encrypt the local area of the projectile and target contact, and the periphery is gradually sparse. The initial velocity along the x-axis is applied to the projectile and internal structures. In the FE simulation, the initial velocity can be determined as 300 m/s. The contact definition is CONTACT_ERODING_SURFACE_TO_SURFACE.

4.2. Material Model

The key of the FE simulation is the material models of the projectile and concrete target. The projectile material is 45# steel, and its material model is MAT_PLASTIC_KINEMATIC. The detonation control system is made by 38CrMnSiA alloy steel, and its material model is MAT_JOHNSON_COOK, and the state equation is EOS_GRUNEISEN. The material parameters used in the FE simulation are shown in Table 3 and Table 4. After comparing and consulting the relevant literature, MAT_JOHNSON_HOLMQUIST_CONCRETE model is a dynamic material model specially developed for concrete subjected to impact loads. The HJC model is selected for the concrete in the FE simulation in this paper. Table 5 gives the main parameters of this material.

4.3. Results

The projectile penetrates the concrete at an impact velocity of 300 m/s, and the deceleration of the detonation control system is shown in Figure 9. The deceleration curve has several peaks on the 10 4 orders of magnitude, and the maximum deceleration value is nearly 14,000 g. The deceleration curve falls back to 0 after 6 ms and oscillates continuously near 0. Based on FE simulation results, the deceleration curve of the detonation control system conforms to the deceleration characteristics of the high-speed deep penetration. This means that the scaled experiment can simulate the deceleration environment of high-speed deep penetration for the detonation control system, which can be effectively tested in the process of the low-speed penetration in the laboratory. The simulation results will be further verified by the scaled experiment in the next section.

5. The Verification Experiment: The Scaled Experiment

The experiment is made on the single stage gasgun with a caliber of 152 mm, and structures and materials of the projectile and the detonation control system are consistent with the simulation models. The impact velocity is controlled at about 300 m/s. According to the space of the target cabin and safety, the target is 1.2 m in diameter and 0.9 m in thickness. The C30 concrete is used as the target material and the steel plate with a thickness of 2 mm is used to reinforce the periphery of the target. The purpose is to prevent equipment damage caused by the concrete falling and splashing around the target, and to reduce the influence of the side sparse effect on the experimental result. The overall experiment scheme is shown in Figure 10.
The high-speed camera model used in the experiment is FASTCAMSA5, which adopts a frame rate of 8000 fps, that is, the image is taken every 125 μs. The high-speed camera tracks the penetration process and obtains the visual image data of the projectile impacting the target and invading the target. The penetration process of projectile captured by the high-speed camera is shown in Figure 11. By processing video images, the impact velocity before entering the target is determined to be 291 m/s. From the high-speed camera, it can be seen that the projectile is perpendicular to the target, which meets the requirements of vertical penetration.
The red curve in Figure 12 shows the deceleration of the detonation control system in the scaled experiment. The deceleration peak collected by the sensor is 15,033 g. In the early stage of penetration, the working environment of the detonation control system is harsh, with two peaks reaching 10,000 g. From the deceleration curve, it can be seen that the experiment result agrees well with the calculated result of the FE simulation. The oscillation of the simulation curve is more severe, which is related to the sampling frequency, and can be solved by reducing the sampling frequency.
The deceleration curve of the detonation control system in the high-speed deep penetration is compared with that of the scaled penetration, as shown in Figure 13 and Table 6. The red and black dotted lines show the deceleration trend of the scaled experiment and the high-speed deep penetration. The oscillation of these two deceleration curves can intuitively reflect the working environment of the deceleration sensor and other components of the detonation control system. From the deceleration on the detonation control system, the scaled penetration experiment simulates the process of the high-speed deep penetration from the following two points.
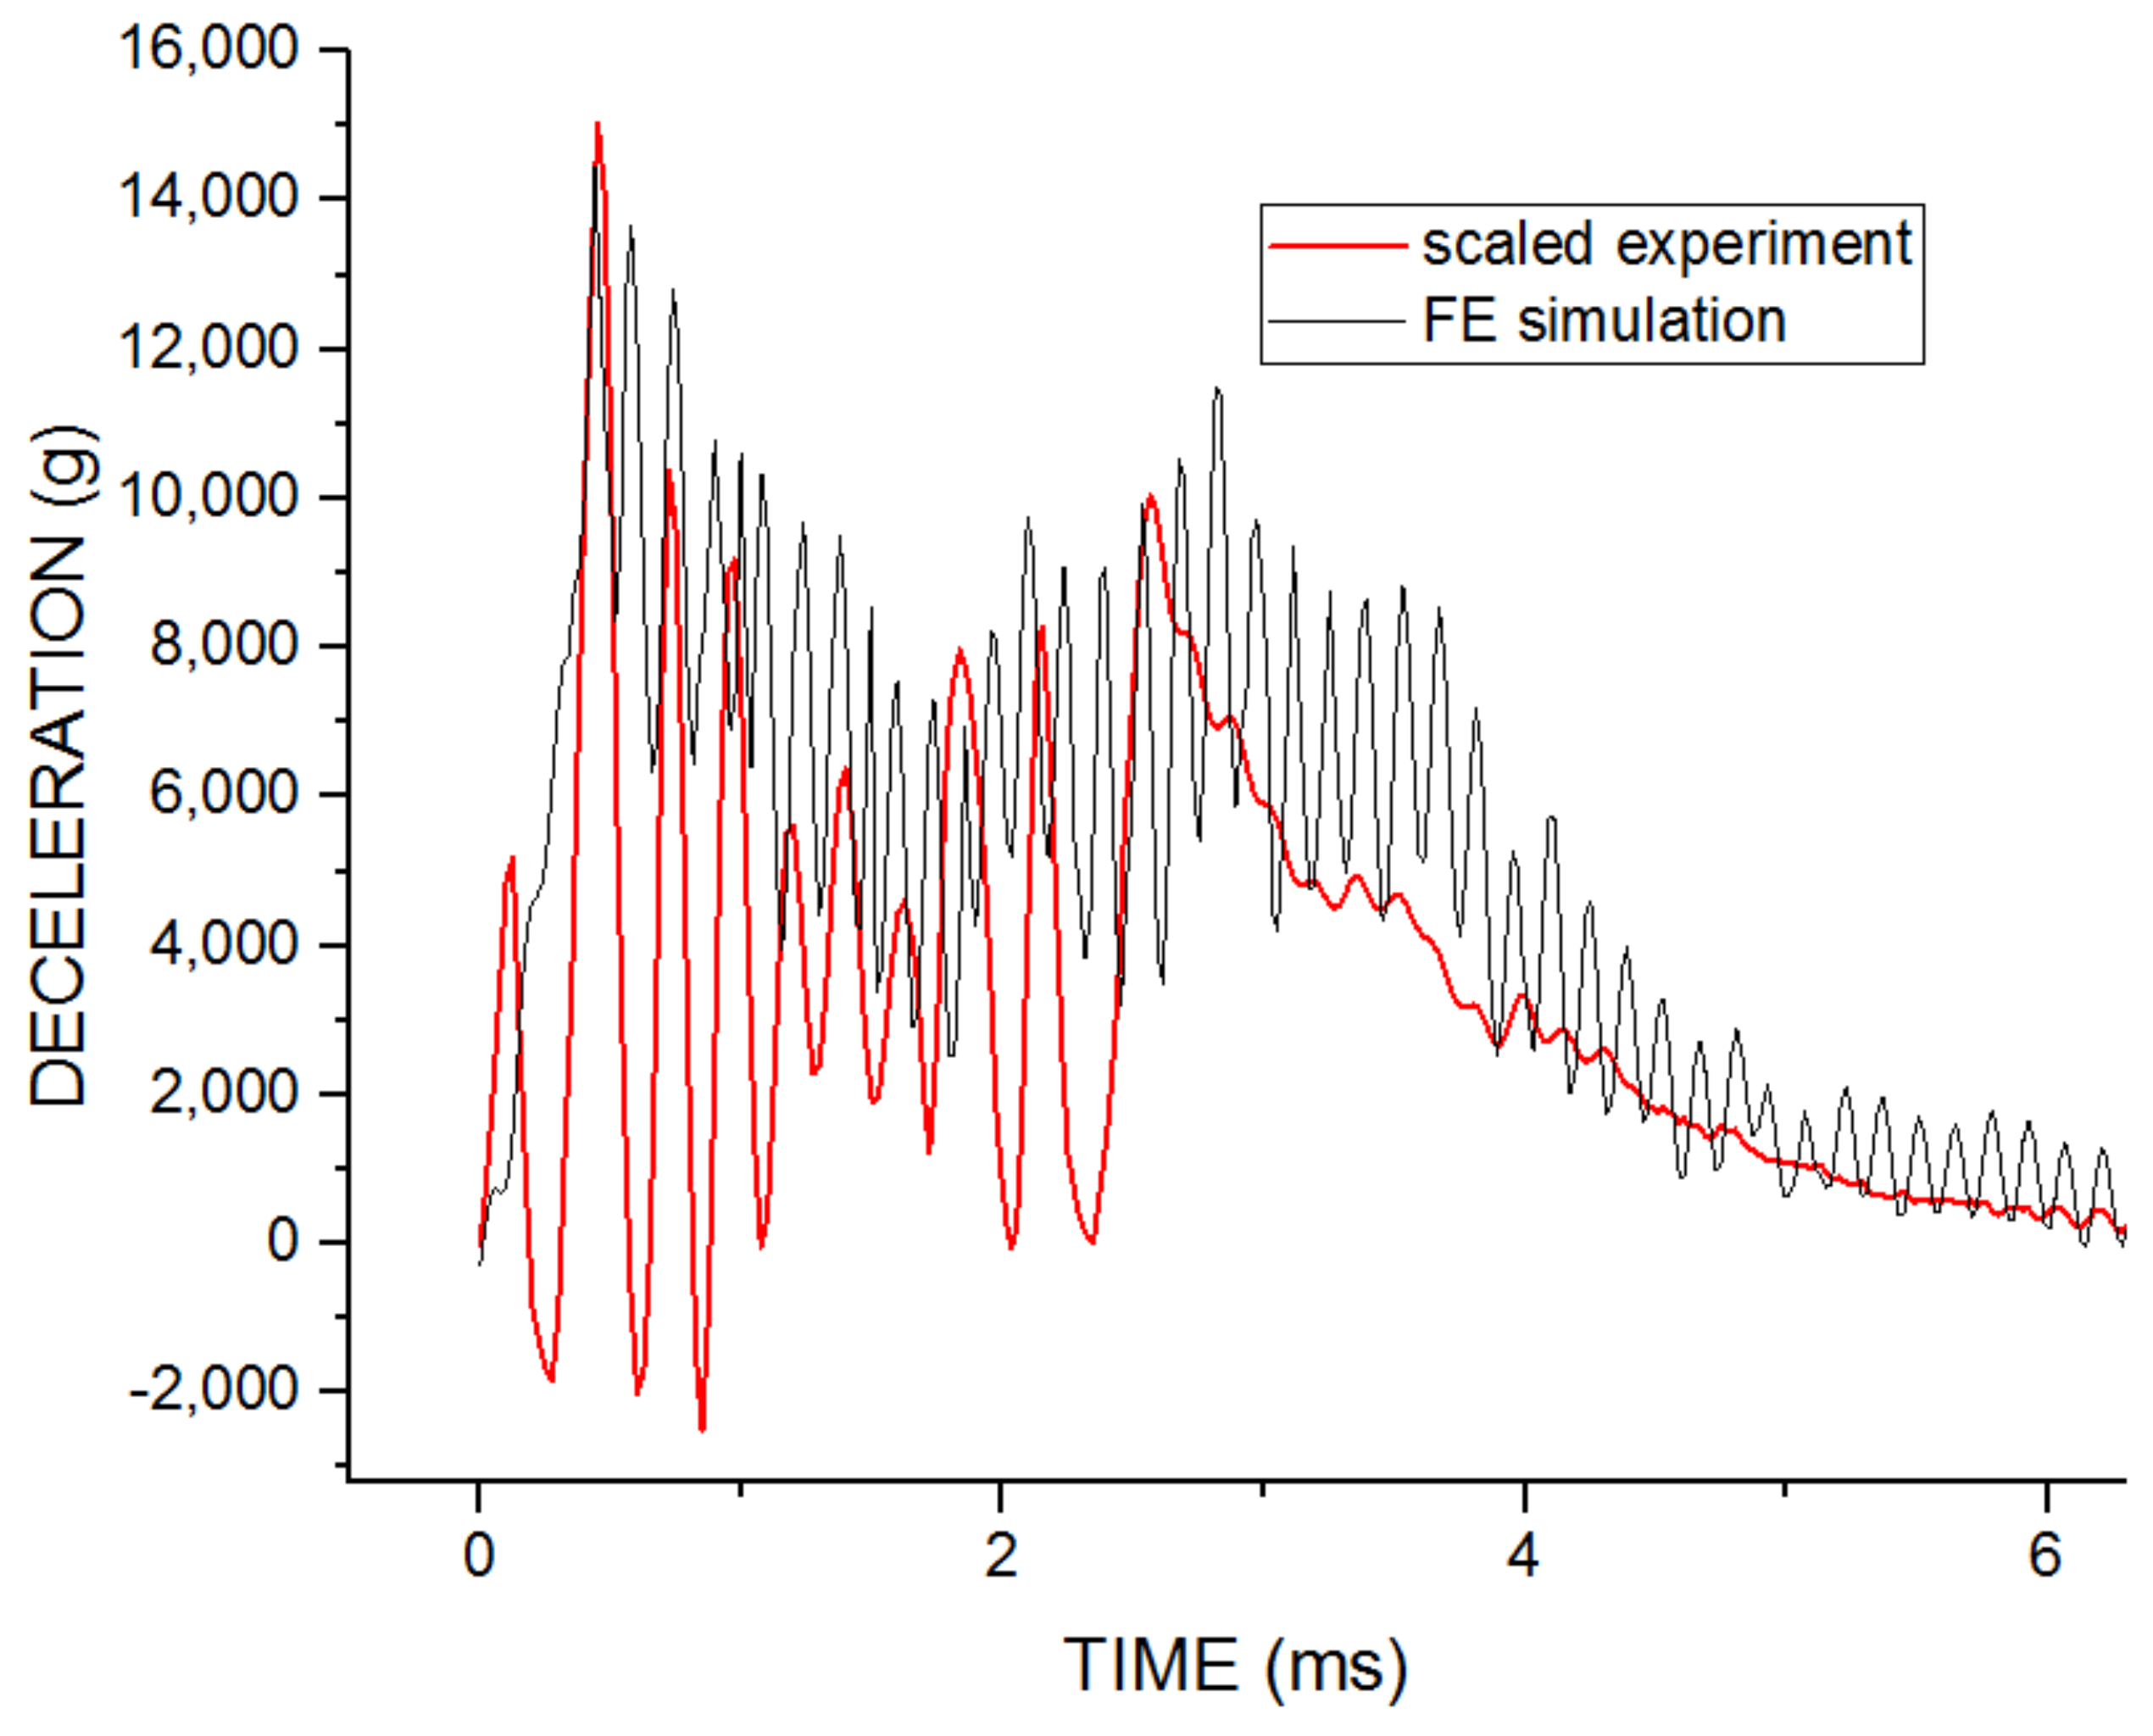
  • The deceleration peaks of these two curves are in the same order of magnitude, with a difference of only 9.4%. The deceleration oscillates greatly before 5 ms. This shows that the detonation control system can experience extremely complex working environments in the scaled experiment.
  • The time history of the two deceleration curves is similar before the large attenuation, and then they are in a small oscillation for a long time in the later stage. This shows that in the scaled experiment, it can create a long-time complex working environment for the detonation control system.

6. Conclusions

In this paper, the independent parameters affecting the penetration characteristics are effectively extracted from the deep penetration model, and the key parameters such as projectile length and projectile diameter are analyzed combined with the FE simulation. The deceleration contour maps containing multiple parameters are obtained, which can visually show the appropriate loading conditions of the scaled experiment. Then, a set of loading conditions is selected, and the scaled scheme is verified by the FE simulation and the scaled experiment. The FE simulation data and the experimental result show that the scaled experiment method in this paper can simulate the penetration characteristics of the detonation control system in the high-speed deep penetration experiment with the low impact velocity well.
The authors believe that the ogive-nosed projectile and the concrete are suitable for the scaled experiment for the high-speed deep penetration, so as to give consideration to both deceleration value and time history. Because the detonation control system is studied in this paper, considering the geometry size of the projectile in the scaled experiment, the single stage gasgun is used as the launcher. It not only reduces the experimental difficulty, but also improves the repeatability.

Author Contributions

This work was carried out in collaboration among all authors. H.Y. and S.G. investigated and conceived the work. H.Y. carried out the theoretical analysis and the FE simulation. S.G. and L.J. assisted in the scaled experiment. H.Y. wrote the paper. All authors have read and agreed to the published version of the manuscript.

Funding

This research received no external funding.

Institutional Review Board Statement

Not applicable.

Informed Consent Statement

Not applicable.

Data Availability Statement

Not applicable.

Conflicts of Interest

The authors declare no conflict of interest.

References

  1. Mahesh, V.; Joladarashi, S.; Kulkarni, S.M. Damage mechanics and energy absorption capabilities of natural fiber reinforced elastomeric based bio composite for sacrificial structural applications. Def. Technol. 2021, 17, 161–176. [Google Scholar] [CrossRef]
  2. Kennedy, R.P. A review of procedures for the analysis and design of concrete structures to resist missile impact effect. Nucl. Eng. Des. 1976, 37, 183–203. [Google Scholar] [CrossRef]
  3. Chen, X.W.; Li, Q.M. Deep penetration of a non-deformable projectile with different geometrical characteristics. Int. J. Impact Eng. 2002, 27, 619–637. [Google Scholar] [CrossRef]
  4. Li, Q.M.; Chen, X.W. Dimensionless formulae for penetration depth of concrete target impacted by a non-deformable projectile. Int. J. Impact Eng. 2003, 28, 93–116. [Google Scholar] [CrossRef]
  5. He, L.L.; Chen, X.W.; Wang, Z.H. Study on the penetration performance of concept projectile for high-speed penetration (CPHP). Int. J. Impact Eng. 2016, 94, 1–12. [Google Scholar] [CrossRef]
  6. Peng, Y.; Wu, H.; Fang, Q.; Gong, Z.M. Geometrical scaling effect for penetration depth of hard projectiles into concrete targets. Int. J. Impact Eng. 2018, 120, 46–59. [Google Scholar] [CrossRef]
  7. Huang, M.; Ou, Z.C.; Tong, Y.; Duan, Z.P.; Huang, F.L. Similarity analysis of Projectile Penetration into Concrete. Def. Sci. J. 2018, 120, 46–59. [Google Scholar] [CrossRef] [Green Version]
  8. Me-Bar, Y. A method for scaling ballistic penetration phenomena. Int. J. Impact Eng. 1997, 19, 821–829. [Google Scholar] [CrossRef]
  9. Canfield, J.; Clator, I. Development of a scaling law and techniques to investigate penetration in concrete. In NWL Report No 2057; US Naval Weapons Laboratory: Dahlgren, VA, USA, 1966. [Google Scholar]
  10. Li, M.Y.; Jing, H.S.; Liu, Q.; Wu, P. Penetration Fuze Scaling Test Method of Using Small Projectile Simulating Big Ones. J. Detect. Control. 2017, 39, 21–24. [Google Scholar]
  11. Yin, H. Kriging Model Approach to Modeling Study on Relationship between Molecular Quantitative Structures and Chemical Properties; Hong Kong Baptist University: Hong Kong, China, 2005. [Google Scholar]
  12. Zheng, H.; He, Y.; Guo, L.; Zhang, X.F.; Zhang, N.S. Numerical simulations of normal penetration of concrete target with ogive-nose steel projectile by high-speed. J. Syst. Simul. 2013, 25, 1508–1512. [Google Scholar]
  13. Huang, M.R.; Gu, X.H.; Gao, Y.H. The Experimental and Numerical Studies on the Penetrating into Concrete Targets with Kinetic Energy Projectiles. ICMEM 2009, 2, 1237–1241. [Google Scholar]
  14. Forrestal, M.J.; Tzou, D.Y. A spherical cavity-expansion penetration model for concrete targets. Int. J. Solids Struct. 1997, 34, 4127–4146. [Google Scholar] [CrossRef]
  15. Forrestal, M.J.; Altman, B.S.; Cargile, J.D. An empirical equation for penetration depth of ogive-nose projectiles into concrete targets. Int. J. Impact Eng. 1994, 15, 395–405. [Google Scholar] [CrossRef]
  16. Forrestal, M.J.; Frew, D.J.; Hanchak, S.J. Penetration of grout and concrete targets with ogive-nose steel projectiles. Int. J. Impact Eng. 1996, 18, 465–476. [Google Scholar] [CrossRef] [Green Version]
  17. Gao, S.Q.; Liu, H.P.; Jin, L.; Niu, S.H. Mechanics of Concrete Penetration; China Science and Technology Press: Beijing, China, 2012. [Google Scholar]
  18. Chen, S.Y.; Huang, C.G. A semi-empirical equation of penetration depth on concrete target impacted by ogive-nose projectiles. J. Phys. IV 2006, 134, 403–408. [Google Scholar] [CrossRef] [Green Version]
  19. Siddiqui, N.A.; Choudhury, M.A.; Abbas, H. Reliability analysis of projectile penetration into geological targets. Reliab. Eng. Syst. Safe. 2002, 78, 13–19. [Google Scholar] [CrossRef] [Green Version]
  20. Baldwin, J.L. Vertical Water Entry of Some Ogives, Cones, and Cusps; Naval Surface Weapons Center, White Oak Lab: Silver Spring, MD, USA, 1975. [Google Scholar]
  21. He, L.L.; Chen, X.W. Analyses of the penetration process considering mass loss. Eur. J. Mech. A Solids 2011, 30, 145–157. [Google Scholar] [CrossRef]
  22. Chen, X.W.; He, L.L.; Yang, S.Q. Modeling on mass abrasion of kinetic energy penetrator. Eur. J. Mech. A Solids 2010, 26, 585–597. [Google Scholar] [CrossRef]
  23. He, L.L.; Chen, X.W. Simulation of shape variation of projectile nose during high-speed penetration into concrete. Theor. Appl. Mech. Lett. 2012, 2, 29–32. [Google Scholar] [CrossRef] [Green Version]
  24. Xiao, Q.Q.; Huang, Z.X.; Zu, X.D.; Jia, X.; Zhu, Q.F.; Cai, W. Shaped charge penetration into high- and ultrahigh-strength Steel—Fiber reactive powder concrete targets. Def. Technol. 2020, 16, 217–224. [Google Scholar] [CrossRef]
  25. Shi, C.C.; Wang, M.Y.; Li, M.S. A model of depth calculation for projectile penetration into dry sand and comparison with experiments. Int. J. Impact Eng. 2014, 73, 112–122. [Google Scholar] [CrossRef]
  26. Borg, J.P.; Morrissey, M.P.; Perich, C.A.; Vogler, T.J.; Chhabildas, L.C. In Situ velocity and stress characterization of a projectile penetrating a sand target: Experimental measurements and continuum simulations. Int. J. Impact Eng. 2013, 51, 23–35. [Google Scholar] [CrossRef]
  27. An, X.Y.; Tian, C.; Sun, Q.T.; Dong, Y.X. Effects of material of metallic frame on the penetration resistances of ceramic-metal hybrid structures. Def. Technol. 2019, 16, 77–87. [Google Scholar] [CrossRef]
  28. Landi, L.; Stecconi, A.; Pera, F.; Prete, E.D. Calibration of an Air Cannon for Safety Penetration Tests. In Proceedings of the 29th European Safety and Reliability Conference (ESREL), Hannover, Germany, 22–26 September 2019. [Google Scholar]
  29. Xu, X.; Gao, S.Q.; Zhang, D.M.; Niu, S.H.; Jin, L.; Ou, Z.C. Mechanical behavior of liquid nitrile rubber-modified epoxy resin: Experiments, constitutive model and application. Int. J. Mech. Sci. 2019, 151, 46–60. [Google Scholar] [CrossRef]
Figure 1. Deceleration-time history of the detonation control system for the high-speed deep penetration.
Applsci 11 11556 g001
Figure 2. Projectiles with four different noses and the detonation control system structure.
Applsci 11 11556 g002
Figure 3. Deceleration-time history characteristics of the detonation control system of projectiles with different noses.
Applsci 11 11556 g003
Figure 4. FE simulation results of deceleration peak and time history of the detonation control system for projectiles with different diameters and lengths.
Applsci 11 11556 g004
Figure 5. Contour map of deceleration peak and time history of the detonation control system under different target compressive strength. (a) Contour map with the compressive strength of 40 MPa. (b) Contour map with the compressive strength of 30 MPa. (c) Contour map with the compressive strength of 20 MPa. (d) Contour map with the compressive strength of 30 MPa (the cavity structure).
Applsci 11 11556 g005
Figure 6. FE simulation results of deceleration peak and time history of the detonation control system under different impact velocities and target compressive strength.
Applsci 11 11556 g006
Figure 7. The structure of the projectile.
Applsci 11 11556 g007
Figure 8. The full-scale FEM.
Applsci 11 11556 g008
Figure 9. Deceleration-time history of the FE simulation.
Applsci 11 11556 g009
Figure 10. The experiment scheme.
Applsci 11 11556 g010
Figure 11. Penetration Process.
Applsci 11 11556 g011
Figure 12. Deceleration-time history of the scaled experiment and FE simulation.
Applsci 11 11556 g012
Figure 13. Deceleration-time history comparison.
Applsci 11 11556 g013
Table 1. Independent parameters affecting the deceleration peak and time history.
Independent Parameters
Projectile ρ equ (equivalent density)
d (diameter)
L (projectile body length)
φ (caliber-radius-head)
Target ρ (initial density)
f c (compressive strength)
Table 2. Design variables and value ranges.
Design VariableValue
d   (mm)67, 77, 87
L + b / d 6, 8, 10
Table 3. Model coefficients of 45# steel.
Density
( k g / m 3 )
Young’s Modulus
(GPa)
Tangent Modulus
(GPa)
Yield Stress
(GPa)
7800 2102.10.5
Table 4. Model coefficients of 38CrMnSiA alloy steel.
Density
( k g / m 3 )
Shear Modulus
(GPa)
Young’s Modulus
(GPa)
Yield Stress Constant
(GPa)
Strain Hardening Constant
(GPa)
7850852111.32751.186
strain hardening exponentStrain rate correlation coefficienttemperature
correlation coefficient
Melt temperature
(k)
Failure parameter
0.2320.00341.2717930.8
Table 5. Model coefficients of concrete.
Density
( k g / m 3 )
Quasi-Static Uniaxial Compressive Strength
(MPa)
Maximum Tensile Hydrostatic Pressure
(MPa)
Locking Volumetric Strain
2440303.190.1
Normalized cohesive strengthNormalized pressure hardeningStrain rate coefficientPressure hardening exponent
0.891.650.0070.76
Crushing pressure
(MPa)
Shear modulus
(GPa)
1618
Table 6. Comparison of experiment data.
High-Speed Deep PenetrationScaled ExperimentThe Difference
Deceleration Peak16,598 g15,033 g9.4%
Time (Back to 0)about 6 ms5.5 msabout 8%
Publisher’s Note: MDPI stays neutral with regard to jurisdictional claims in published maps and institutional affiliations.

