Article

Analysis of Interference-Fit Joints

Department of Mechanical Engineering Fundamentals, Faculty of Mechanical Engineering and Computer Science, University of Bielsko-Biala, Willowa 2, 43-309 Bielsko-Biała, Poland
*
Author to whom correspondence should be addressed.
Appl. Sci. 2021, 11(23), 11428; https://doi.org/10.3390/app112311428
Submission received: 2 November 2021 / Revised: 28 November 2021 / Accepted: 30 November 2021 / Published: 2 December 2021
(This article belongs to the Section Mechanical Engineering)

Abstract

:
Interference fit joints have been widely used in many engineering constructions, in particular in electric motors. It is of particular importance to calculate the load capacity of press-fit joints, especially in the overload ranges of construction to estimate the safety factor. The article presents a FEM numerical simulation of pressing the shaft into the hub, taking into account various types of fits. The results of numerical simulations presented in the article were positively verified with the MTS measuring device, which confirmed the correctness of the numerical model. So far, the load-bearing capacity of press-fit joints has been calculated from Lame’s formulas. The results of the load capacity of the joints obtained by the FEM simulation were compared with the results obtained from Lame’s formula. The comparison shows that when designing interference fit joints, attention should be paid to the fact that the press-in process, depending on the type of fit, may be elastic-plastic. Plastic deformations in the contact zone of the joint affect its load-bearing capacity. Therefore, the design of press-fit joints should not be based on Lame’s formulas, which do not take into account the range of plastic work of the material.

Graphical Abstract

1. Introduction

Interference-fit joints are commonly used in engineering constructions for connecting the shaft and the hub [1]. They are particularly common in the design of electric motors. An interference-fit joint is obtained by selecting appropriate dimensions of the joined elements [2]. The initial difference in dimensions of these elements is an important factor influencing the load capacity of the joint.
Depending on the assembly method, a distinction is made between press-fit joints obtained by pressing one element into another and shrink-fit joints obtained by heating or cooling one component before assembly and allowing it to return to the ambient temperature after assembly, employing the phenomenon of thermal expansion.
Press-fit and shrink joints ensure good coaxiality. They are also characterized by the ability to carry variable and impact loads. The lack of additional connecting elements makes these joints simple and quick to make, and therefore relatively cheap.
To determine the surface pressure in the joint zone and the load capacity of an interference-fit joint, formulas derived from analogy to the circular-symmetric Lame’s task are used [3]. According to this analogy, the condition of load transfer by the interference-fit joint is the initial difference between the hub inside diameter and the shaft diameter. After the joint has been assembled, surface pressure ps equal to the radial pressure occurs on the contact surface of the shaft and the hub (Figure 1).
This pressure can be calculated from the following Formula (1) [4,5]:
ps = E·Δ·(dw2 − dww2)(dzo2 − dw2)/dw3·(dzo2 − dww2)
where:
E—is Young’s modulus,
Δ = Δdo − Δdw
dw—outer diameter of the shaft,
dww—inner diameter of the shaft,
dzo—outer diameter of the hub.
The value of axial force breaking the interference-fit joint can be calculated from the following formula:
F = π·µ·ps·d·l
where:
µ—coefficient of friction of the joined parts contact surfaces,
d—nominal shaft diameter,
l—length of the press-fit joint.
Calculating the load capacity of a press-fit joint from the formulas using the assumptions of the linear theory of elasticity is possible assuming that the value of the surface pressure is lower than the yield point.
In the literature on design issues of interference-fit joints, one can find a modification of Formula (1) which takes into account surface roughness of joined elements [6]. The modification assumes reducing the size of parameter Δ by the smoothing G dimension factor according to the following Formula (3):
G = 0.8(Rzw + Rzo)
where:
Rzw—roughness coefficient Rz of the shaft,
Rzo—roughness factor Rz of the hub.
Formula (1) takes the form:
ps = E·(Δ − G)·(dw2 − dww2)(dzo2 − dw2)/dw3·(dzo2 − dww2)
This formula is recommended for calculating the surface pressure in press-fit joints.
Calculating the load capacity of press-fit joints using formulas based on the assumptions of the linear theory of elasticity is possible only on the condition that the surface pressure value is lower than the yield point. However, depending on the type of fit, it is difficult to assume in advance that the pressing process will occur in the elastic range. Therefore, when determining the value of the load breaking the joint, it is problematic to use Formula (2) based on Formula (1) or (4).
The literature on the design of load-bearing capacity of press-fit joints is not very extensive. The authors have not found any formulas that would allow one to determine the load-bearing capacity of joints for different types of fits, except for those mentioned above. However, the articles cited below show that the problem of interference fit design is open and noteworthy.
Paper [7] present the results of the simulation of bending interference-fit joints in the elastic range. Simulation results were verified by strain gauge measurements. The values of surface pressure obtained from Lame’s formulas were compared with the results of the FEM simulation, obtaining a relative error of 6.4%. In [8], the influence of the fillet of the hub inner edge at the point of contact with the shaft was analyzed, proving that it had a negligible effect on the value of stresses generated during the joint assembly. Article [9] presents the results of numerical tests and simulations concerning the increase in the load capacity of joints by using an adhesive. In [10], two discrete models, which use surface and spatial finite elements, were applied to simulate the joint. However, the relative error of the simulation compared to the experiment was 10% (2D model) and 15% (3D model). To reduce the error, the authors’ suggestion is to use the Bay-Wanheim friction model instead of the Coulomb friction model for the calculations. The performed studies prove that increasing interference does not increase the load capacity of the joint. Errors resulting from the use of Lame’s formulas were also signaled in [11], indicating differences in stress values obtained as a result of a numerical simulation. Errors can reach even 60% depending on the modeling method. An analysis of interference fit joints in hot rolled working shafts can also be found in [12]. In [13], the authors deal with rotating bending fatigue tests of interference-fit joints with a rounded edge of the hub opening. The fatigue stress concentration coefficient was determined experimentally by comparing the results of the fatigue strength of the “notched” specimen and the plain specimen. In article [14], a press-fit joint subjected to bending is analyzed to identify the variables causing the onset of elastic stress concentration. The influence of interference level and coupling procedure on the shear strength of Loctite 648 anaerobic adhesive can be found in [15].
This article is an introduction to a broader analysis and development of a method of interference joint design. It compares the load-bearing capacity of interference joints obtained as a result of numerical simulations with the results obtained from Formulas (1) and (4) based on Lame’s theory, for various types of fits.
Simulation results and the correctness of the numerical model have been experimentally verified for the selected type of fit. They showed that plastic deformations occur in press-fit joints and the joint breaking forces differ significantly from those calculated based on Formulas (1) and (4).

2. Materials and Methods

The object of the analysis is a press-fit joint of a 20 mm long shaft with a nominal diameter of ø 8 mm with four different fits and a 40 mm long hub with an outer diameter of ø 20 mm and an inside diameter of ø 8H7 (Figure 2a). The interference fit joint before assembly is shown in Figure 2b.
After assembly, the set was subjected to tests aimed at verifying the correctness of the numerical model which was built for the analysis of the load-bearing capacity of the joint depending on the interference value.
The hole in each hub was measured on a coordinate measuring machine at four points on a circle every 90°. The measurement was repeated in three sections at the depth of the hole. The adjacent cylinder with a mean diameter of ø 8.0050 ± 0.0011 mm was determined from the measurements for each hub [16].
Measurements of the shaft diameters were performed in the same way as of the holes in the hub obtaining a mean shaft diameter of ø 8.0170 ± 0.0013 mm. Measurements were carried out on Sheffield discovery III cordax d-28 coordinate measuring machine. The resolution of the machine is 1 μm. Based on the mean values of the shaft and the hub hole diameters, interference Δ of 0.012 mm was calculated. The shaft was pressed into the hub to a depth of 15 mm. Both parts were made of S235 JR steel with a Young’s modulus of 200 GPa, the yield point of 225 MPa, and ultimate tensile strength of 360 MPa.
Four types of joints made for various fits presented in Table 1 were subject to numerical analysis [17].
The surface pressure value and the value of the maximum force breaking the joint, calculated according to Formulas (1) and (4), are presented in Table 2. In each of the considered types of fit, the joints are assumed to be elastic in nature and the friction coefficient is µ = 0.1 [10]. Calculations in Formula (4) were performed assuming roughness of Ra = 0.4 obtained by finishing turning.
The results presented in Table 2 show that taking into account the roughness of joined surfaces reduces the load-bearing force of the joint.

3. Results of Numerical Calculations and Experimental Studies

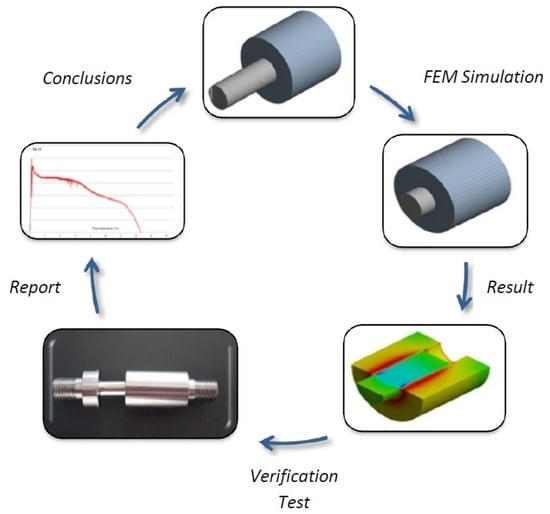
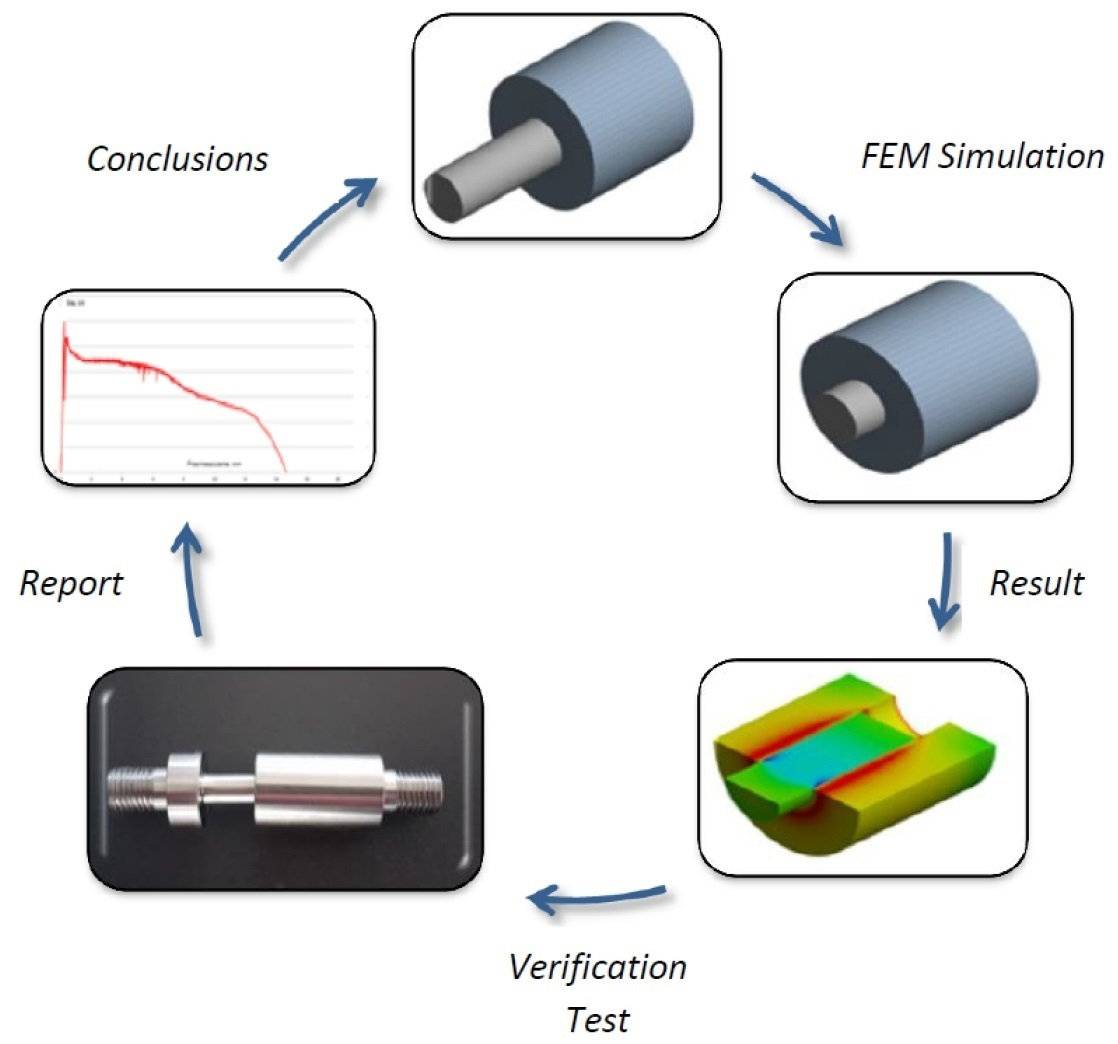
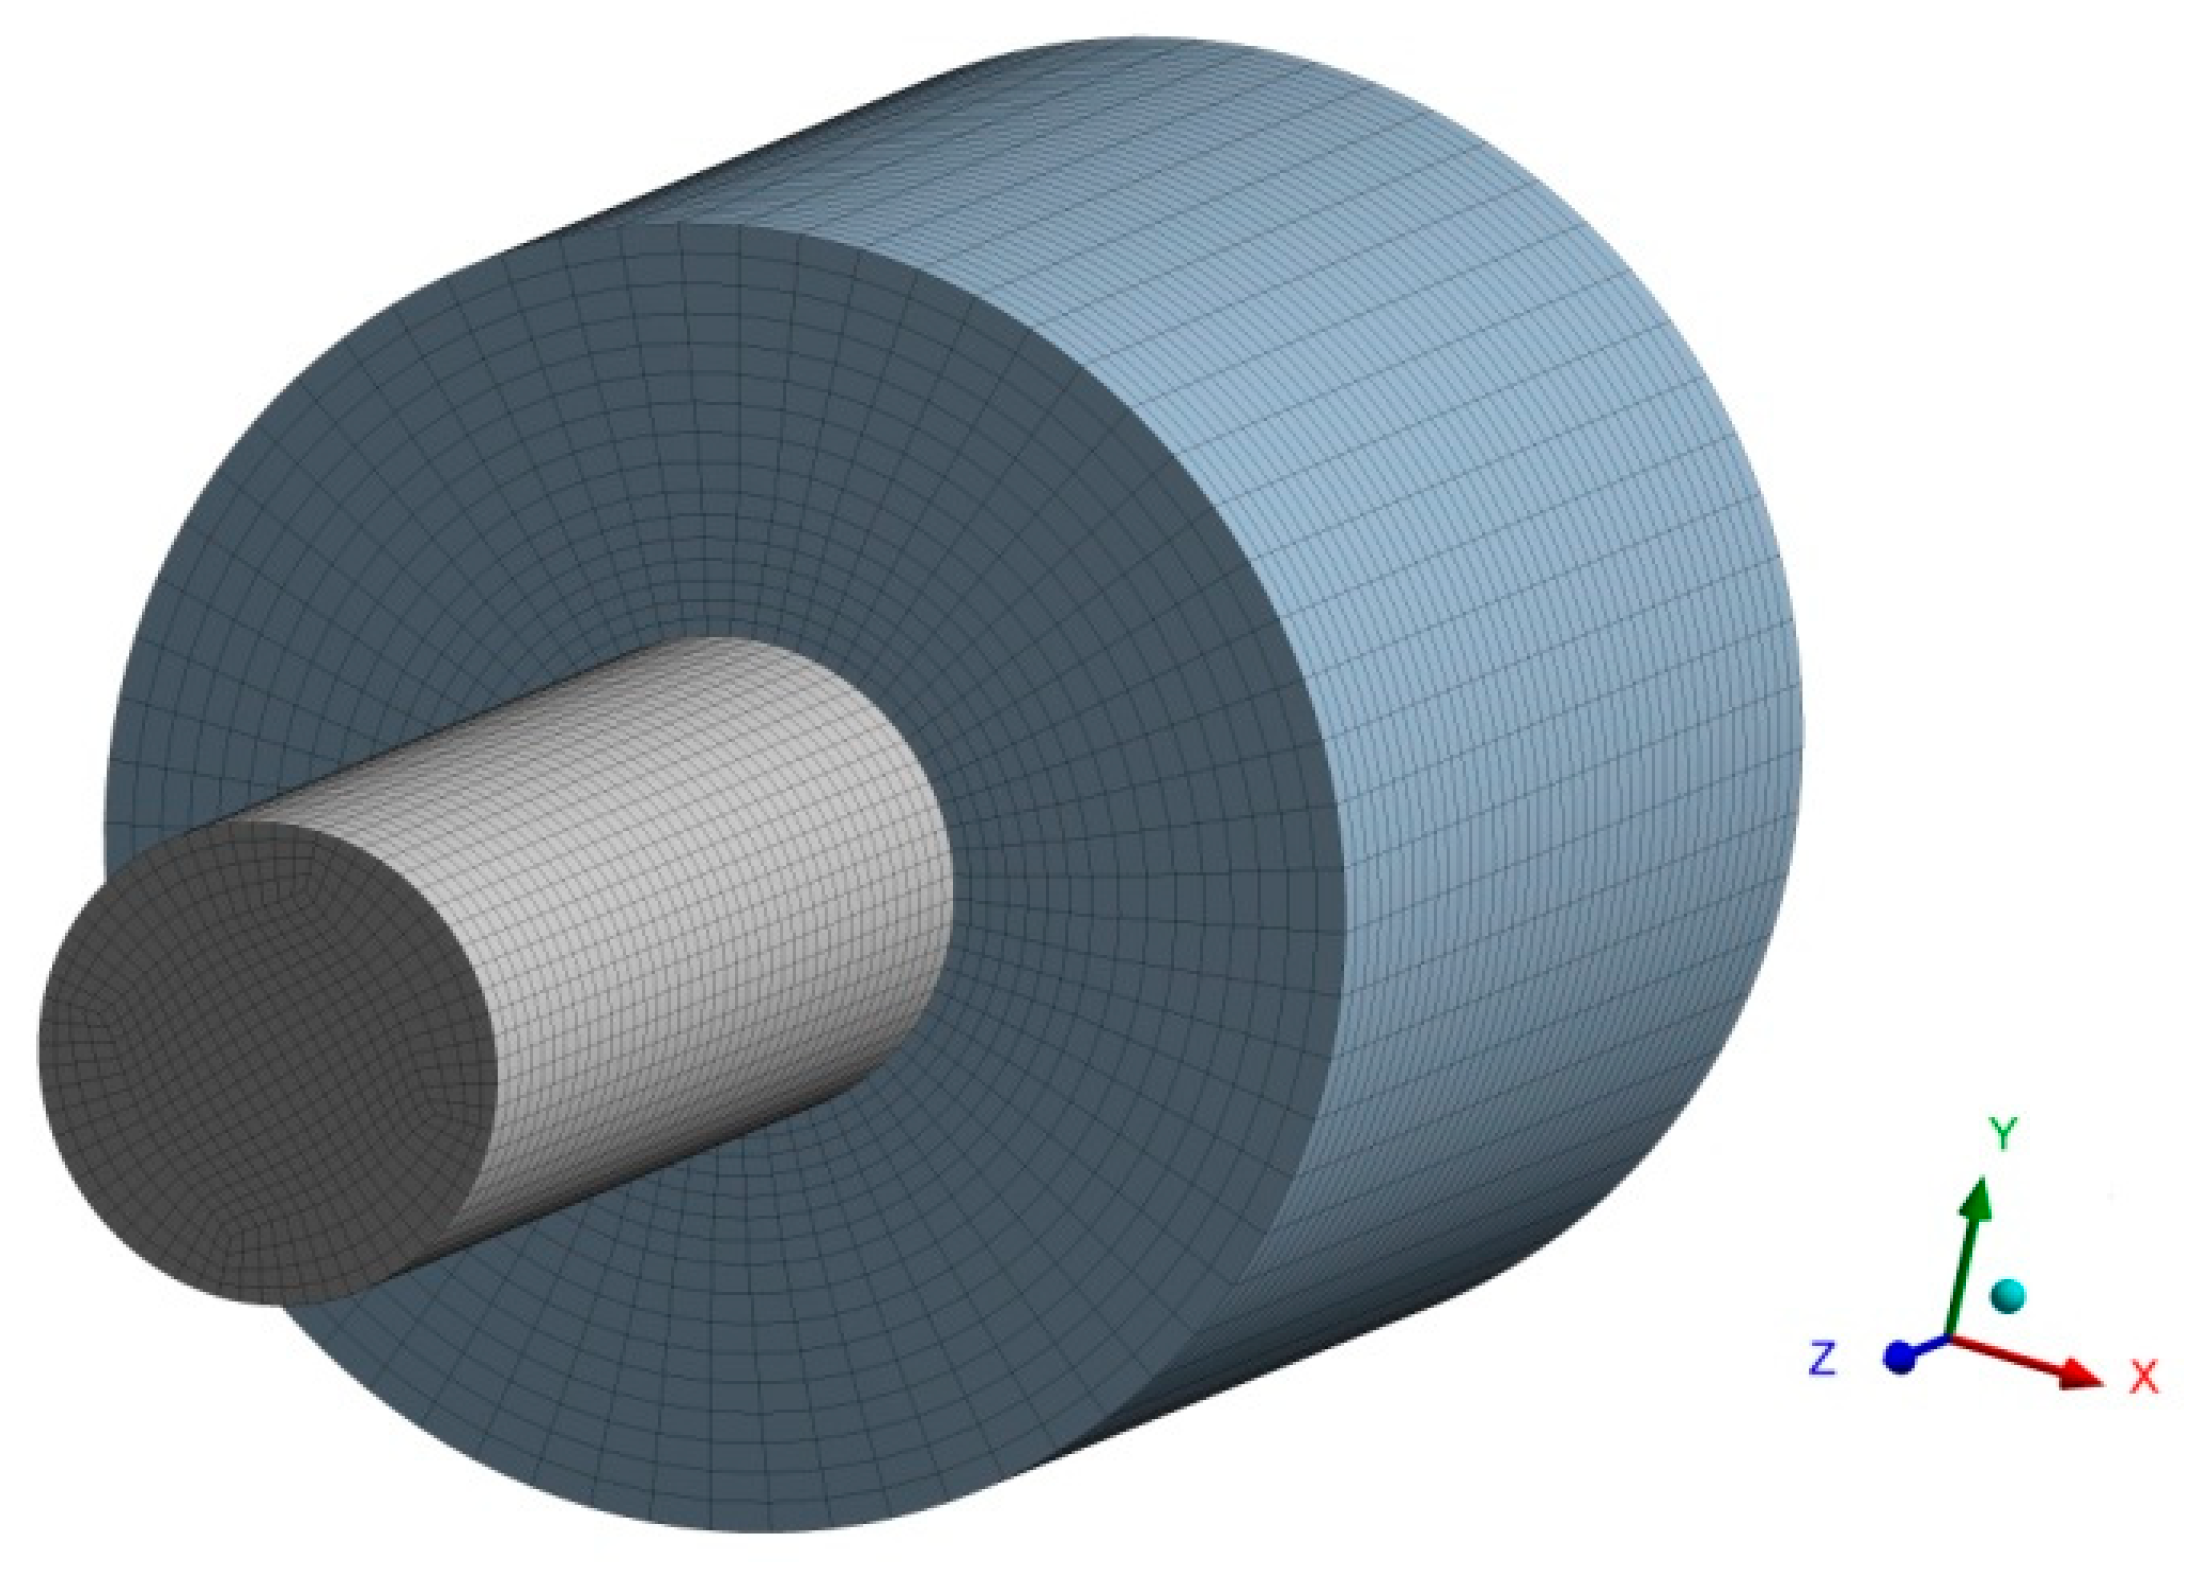
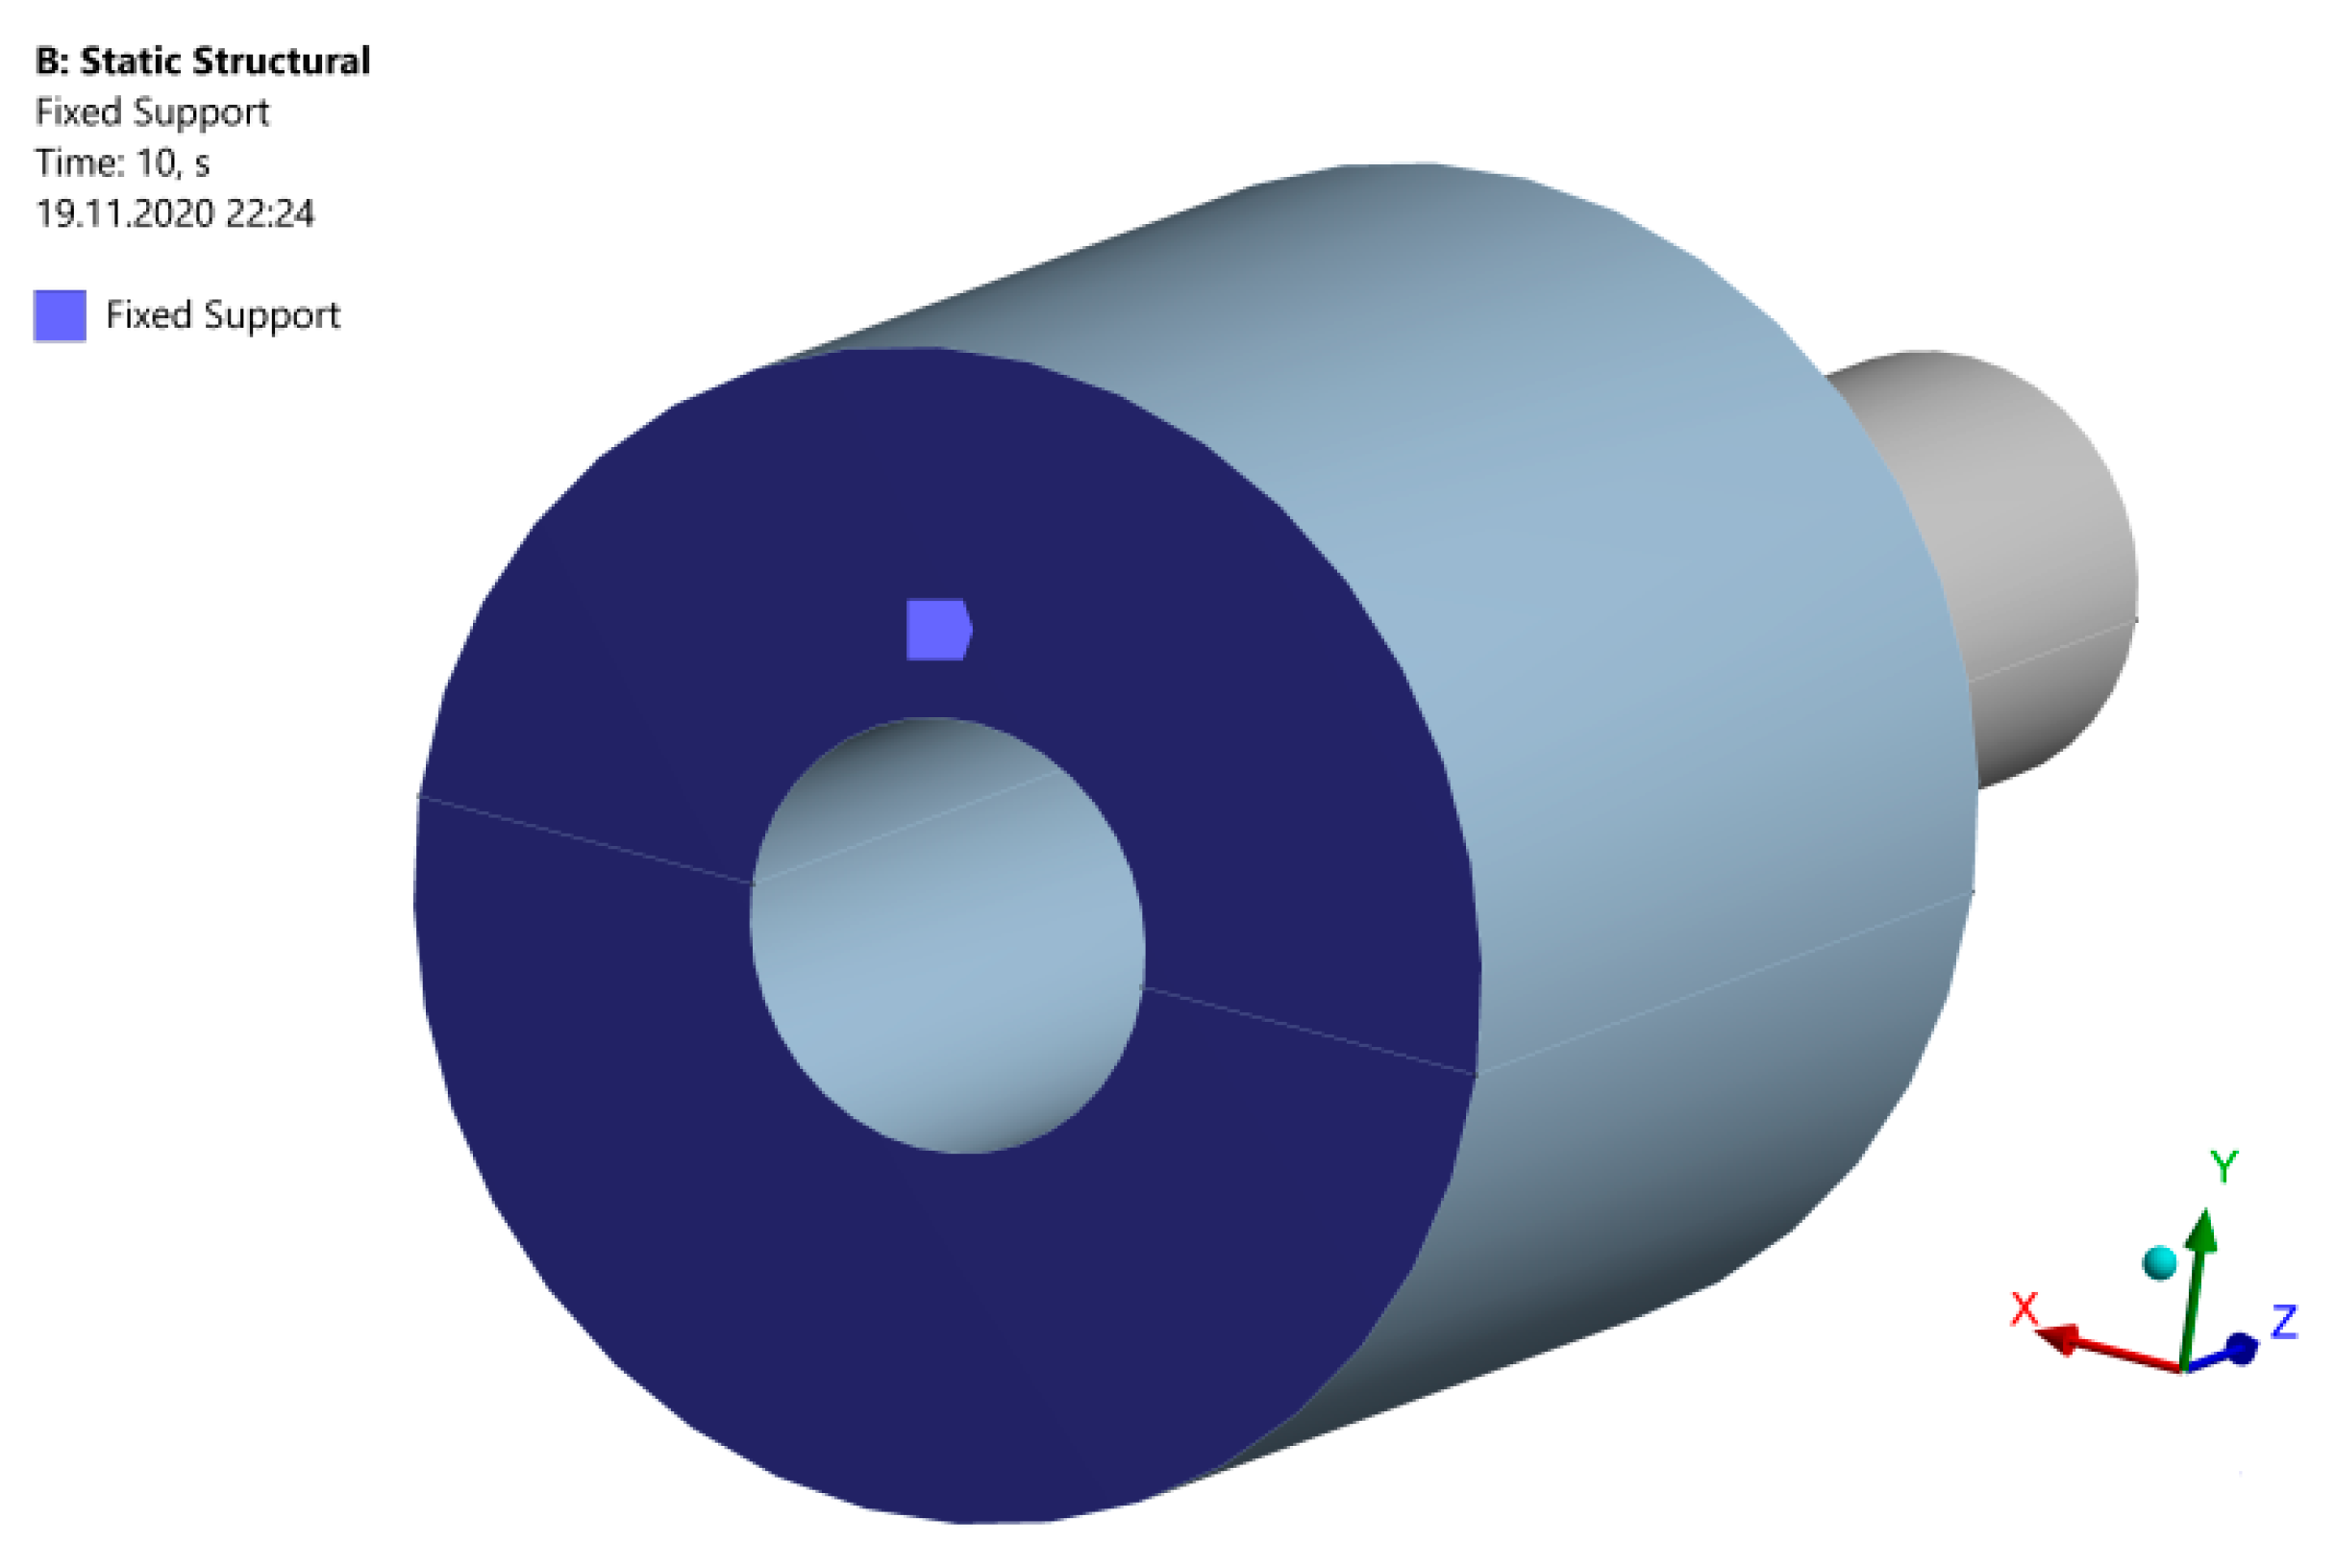
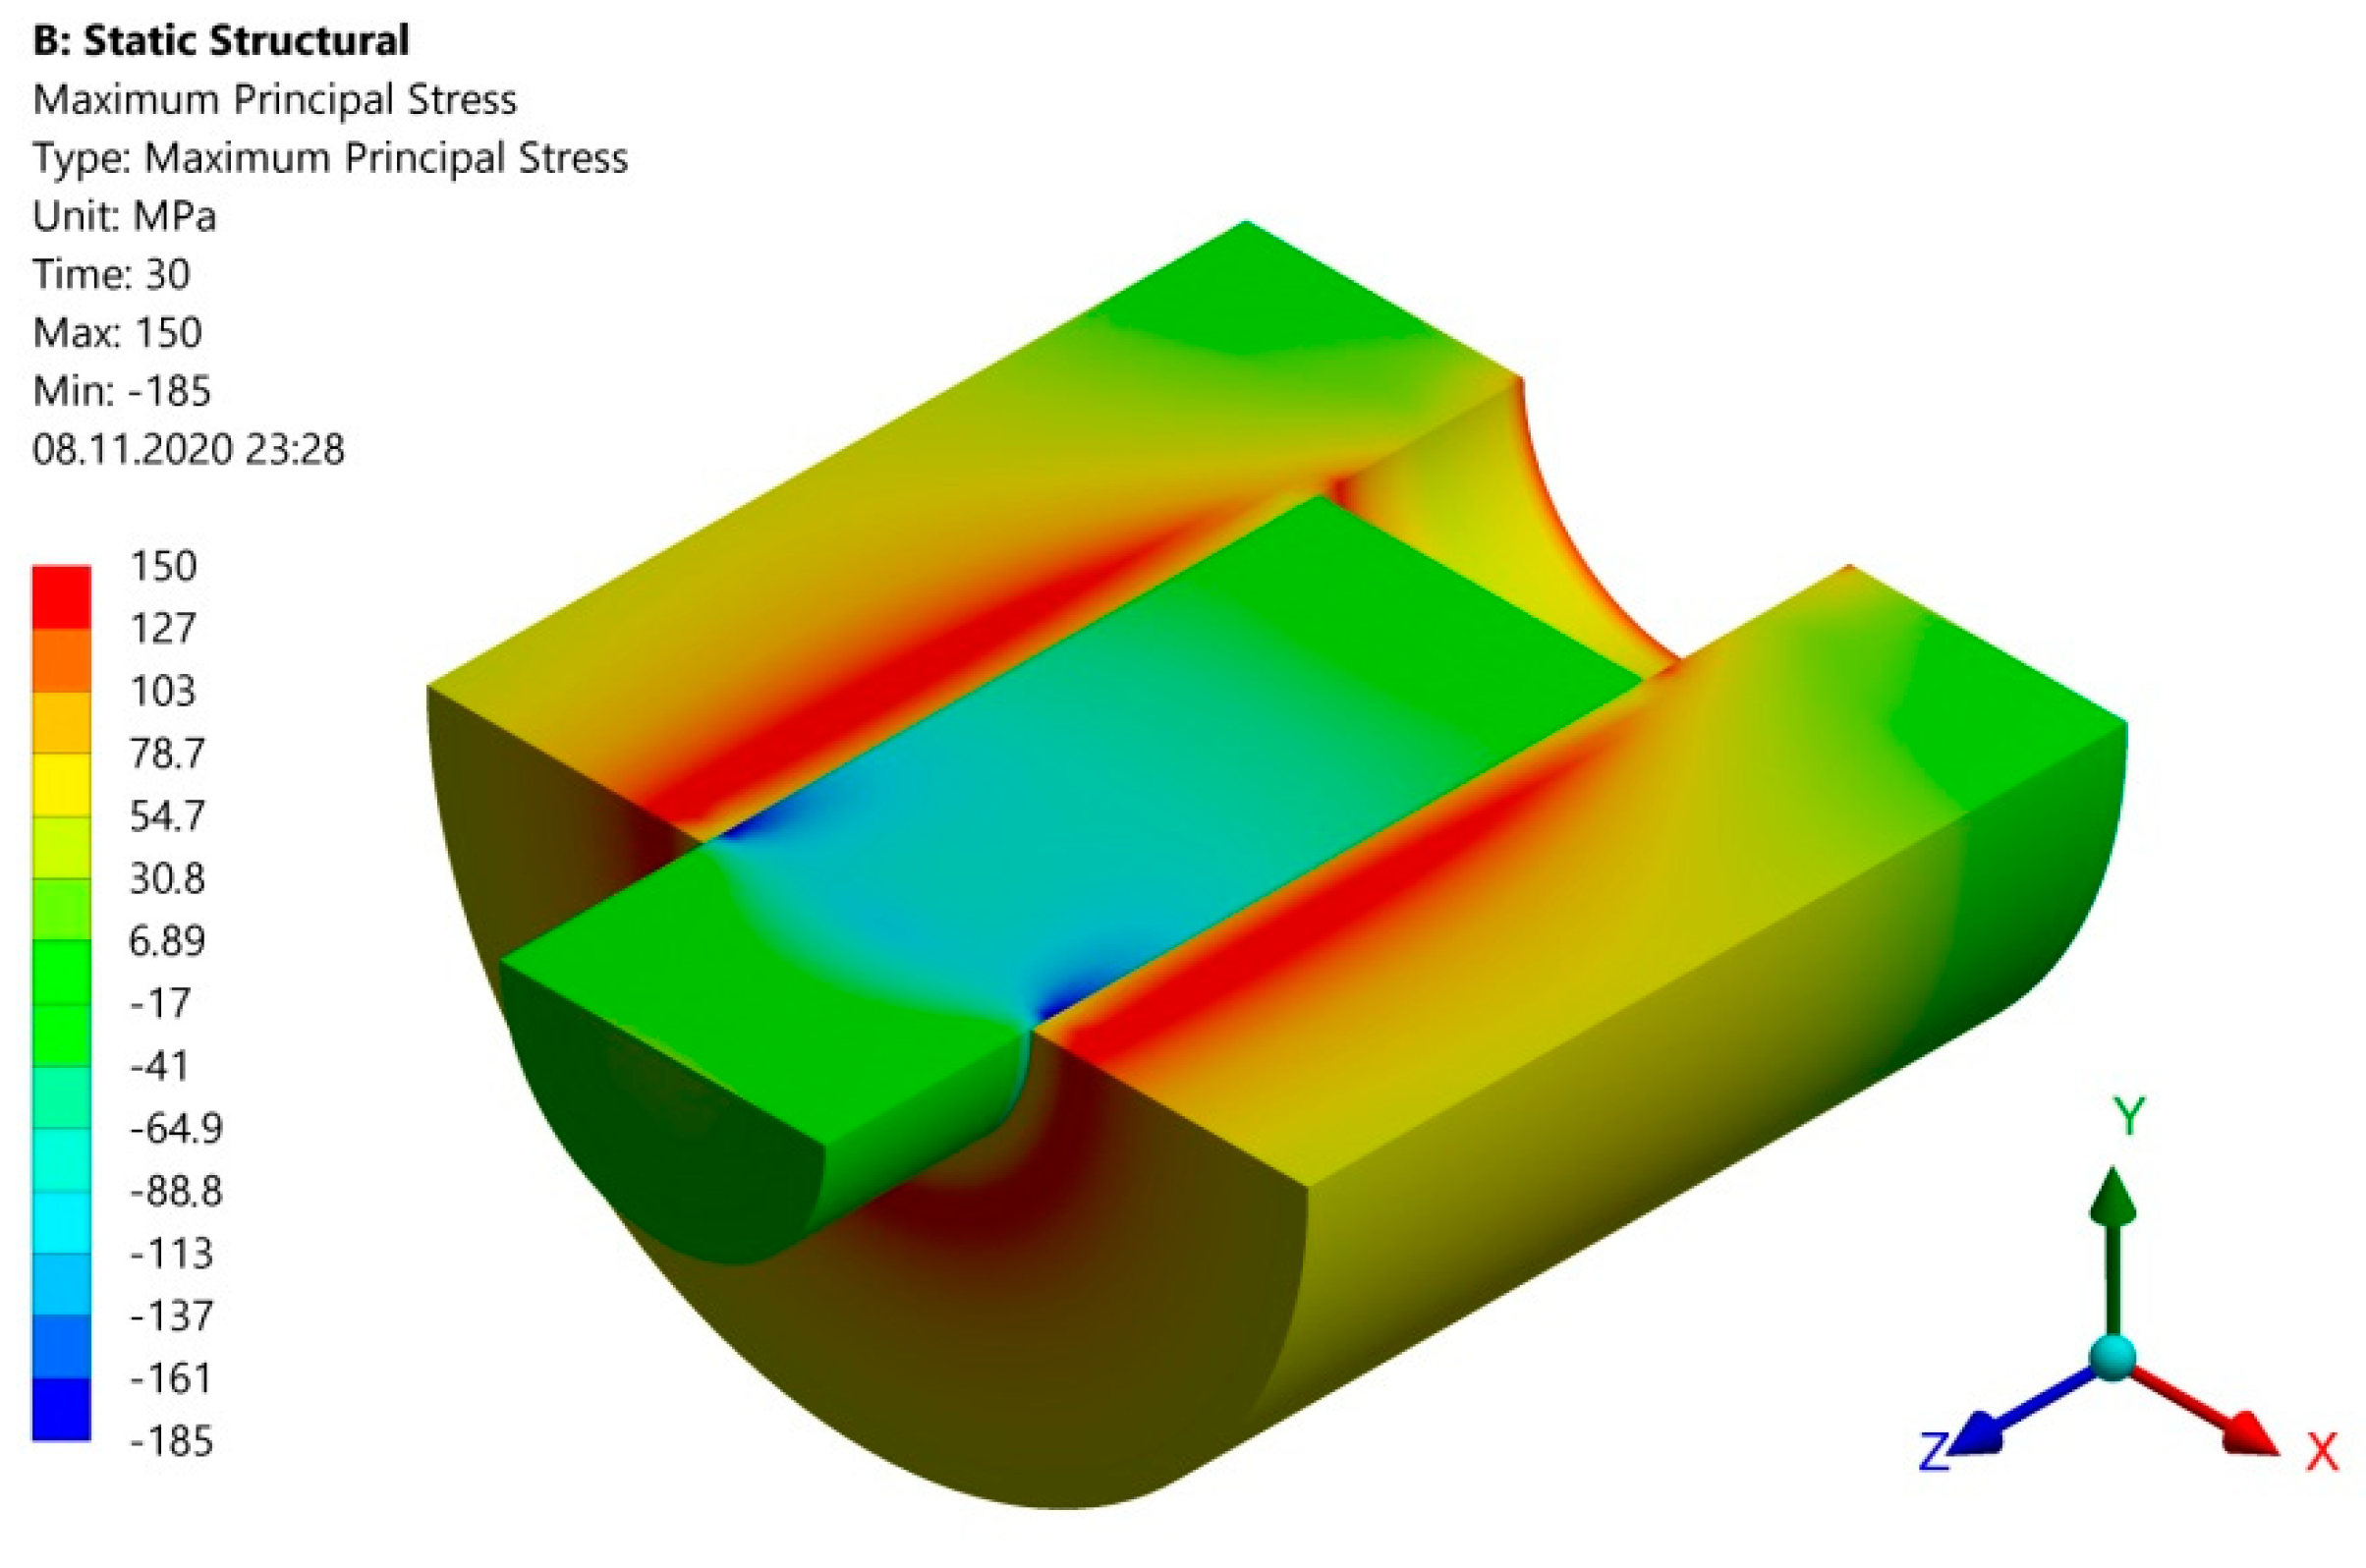
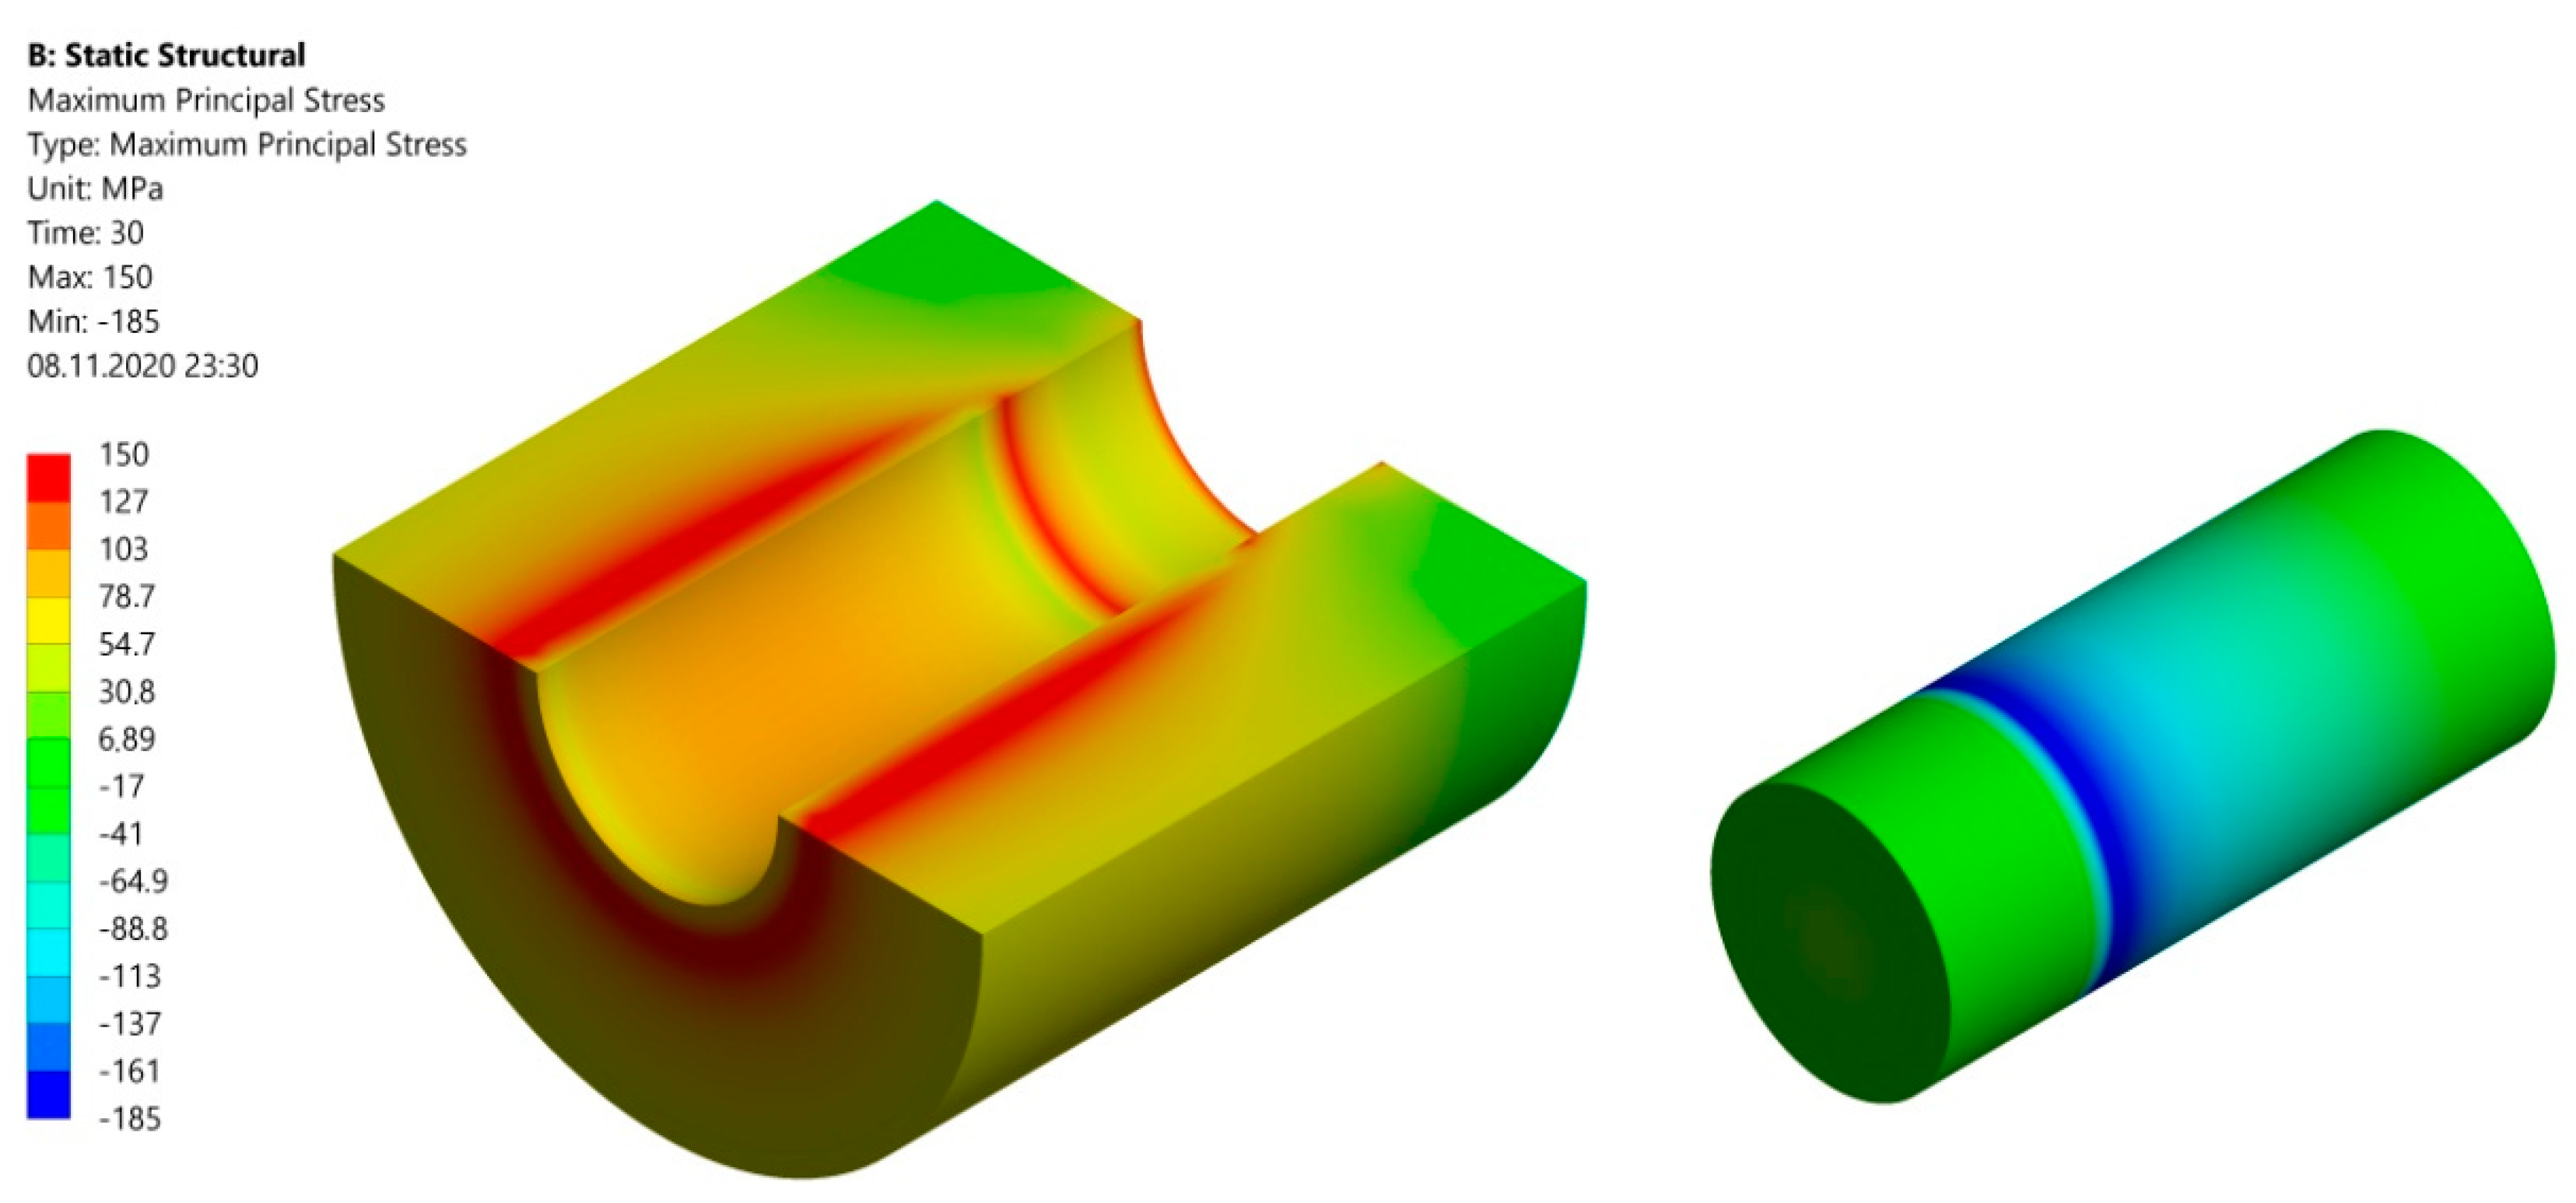
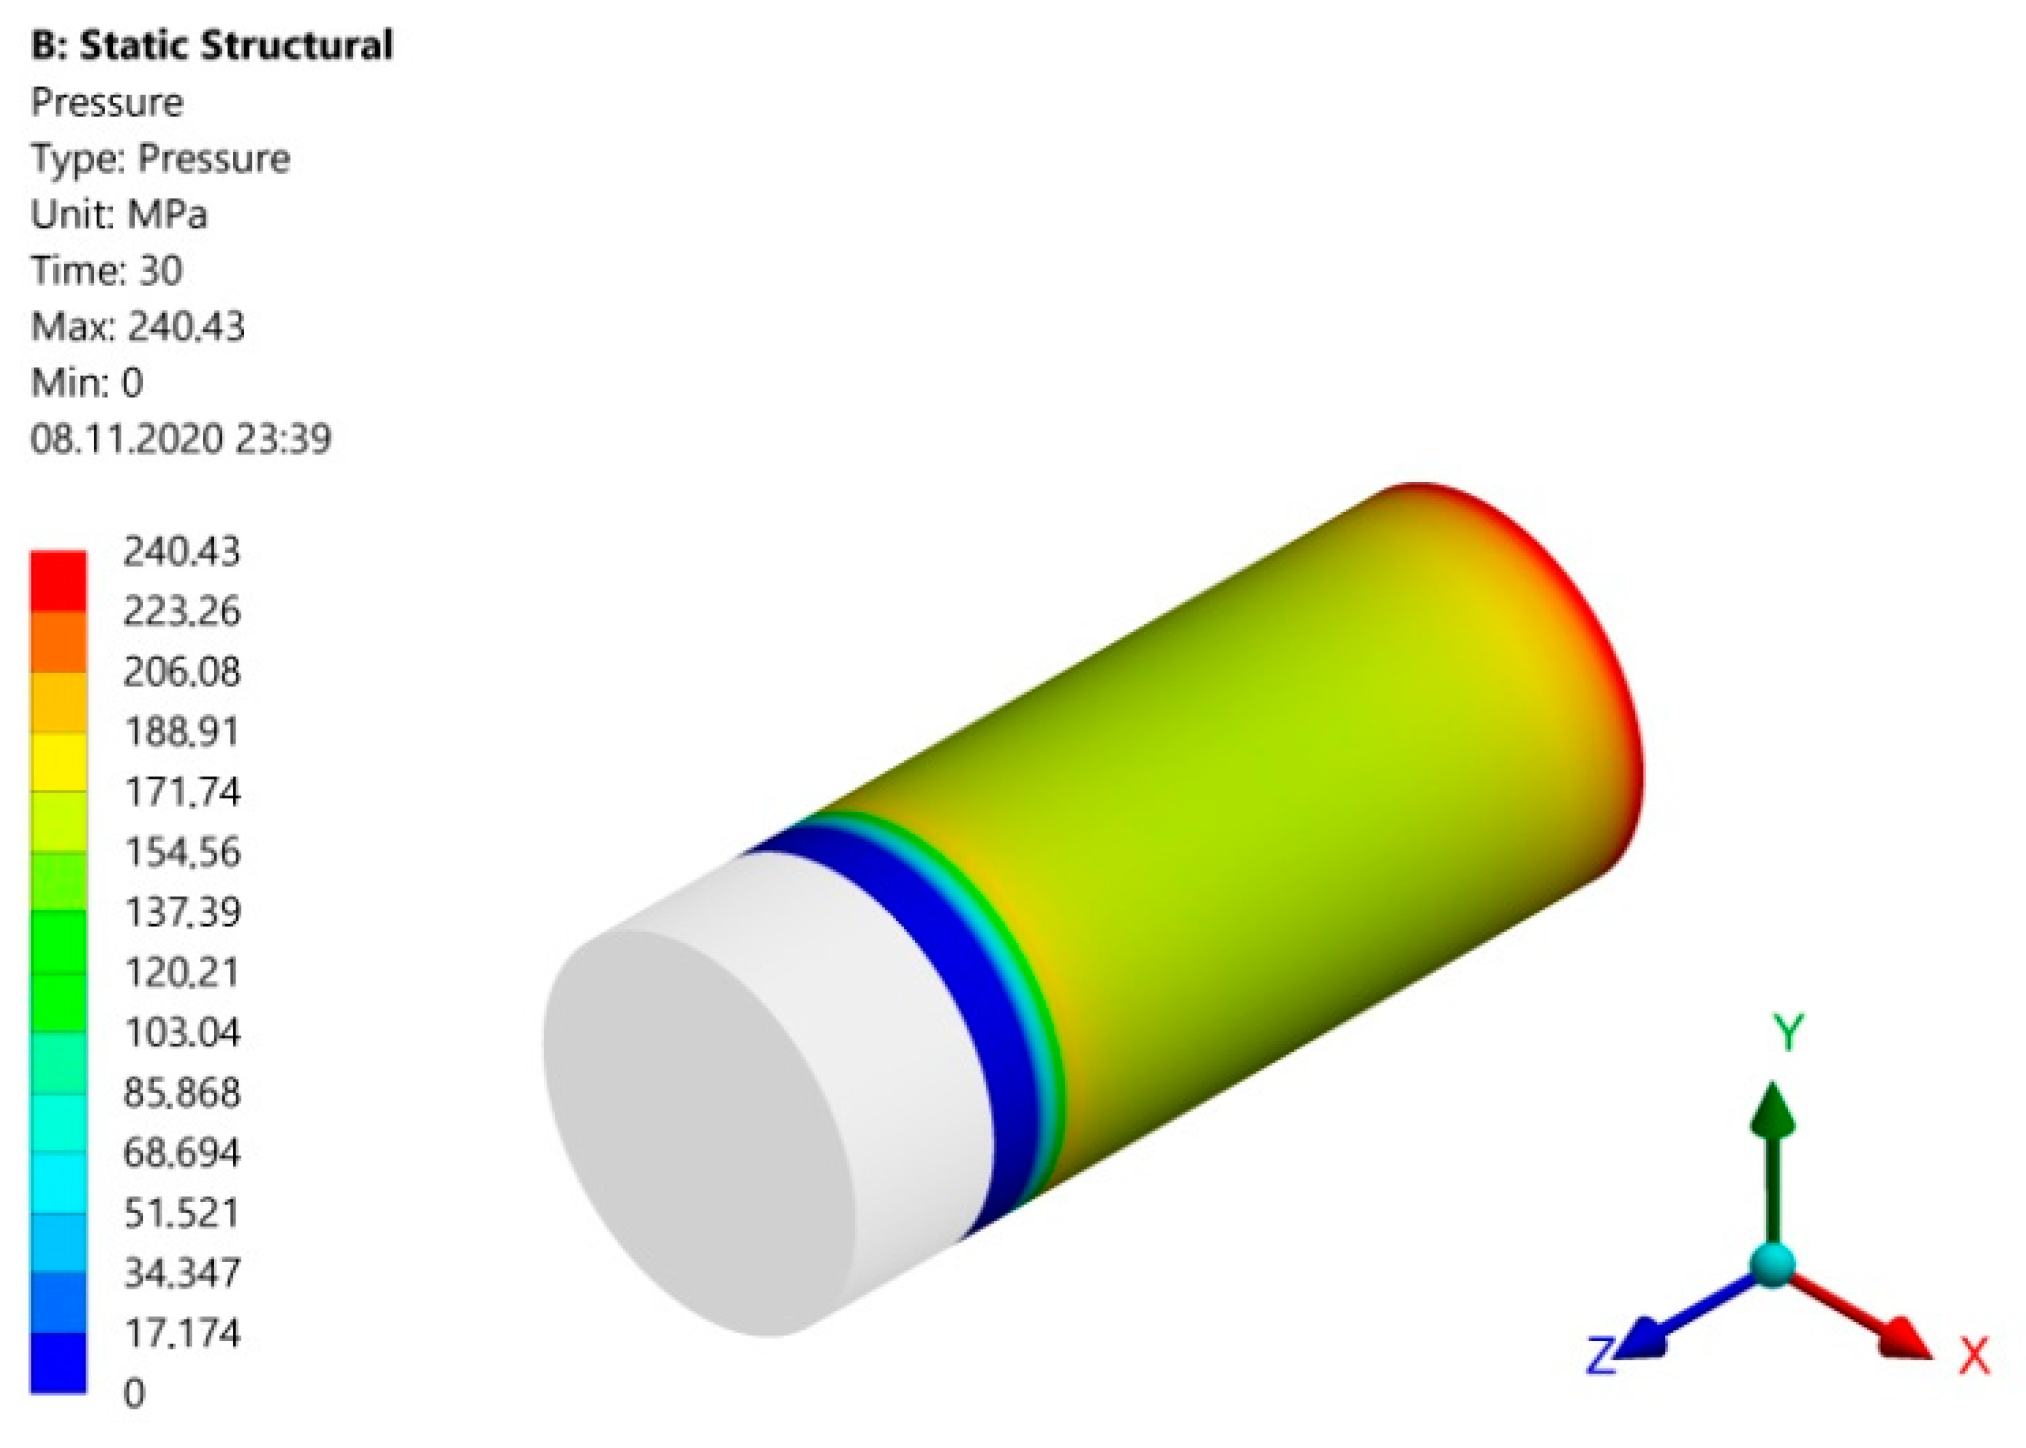
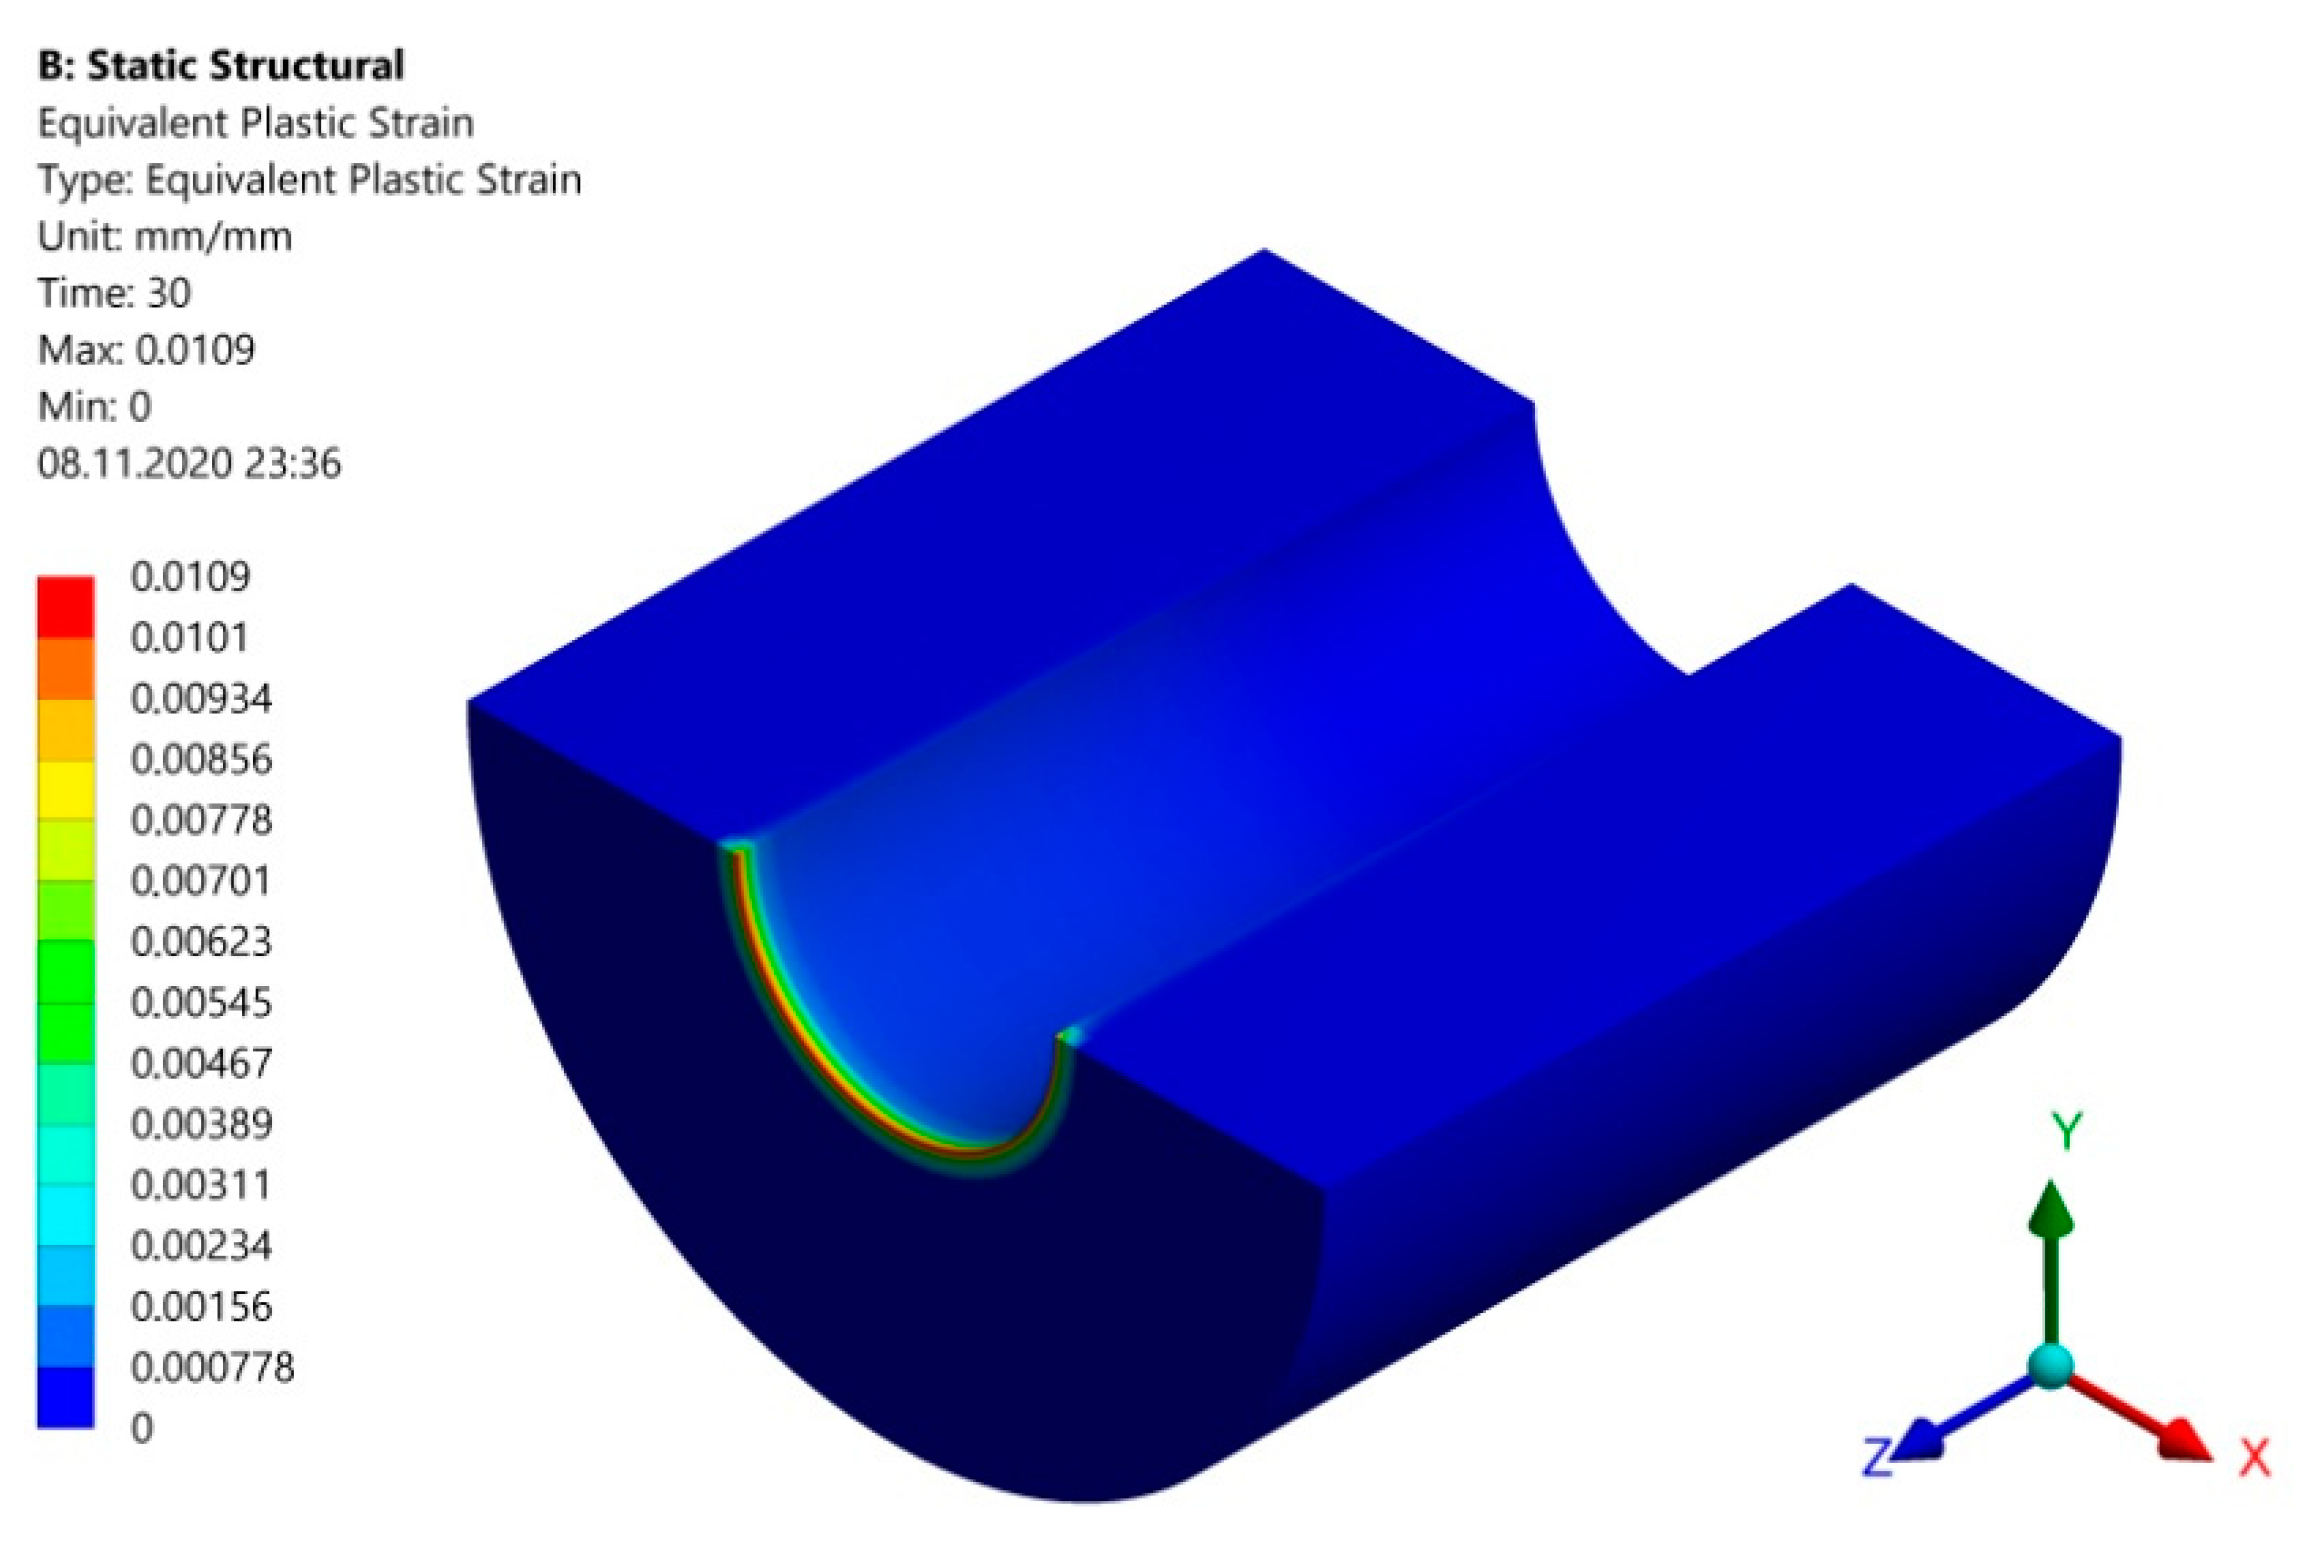
3.1. Numerical Simulation of the Pressing Process

For each of the above joints, the pressing process was modeled using the Finite Element Method (FEM) and the Ansys v. 19.1 calculation system. The discussed set has an axis of symmetry, therefore it seems advantageous to use an axisymmetric model in the analysis. Initially, the authors prepared such a model, however, it was found that ANSYS simulation of interference using axial-symmetry led to errors that prevented effective completion of the analysis. Therefore, an axisymmetric model was abandoned in the numerical analysis. Figure 3 shows the discrete model of the shaft and the hub in the initial configuration. The model was divided with the use of solid hexagonal finite elements SOLID 186 [18]. The mesh of nodes was densified towards the contact surface. The model has 61,440 elements and 262,161 nodes. The FEM model used a bi-linear material model, with a tangent modulus of 1450 MPa.
The outer surface of the shaft and the inner surface of the hub were assumed as contact surfaces. The contact was modeled with CONTA 174 and TARGE 170 elements [18]. The contact model is based on the Lagrange function with an exterior penalty function (augmented Lagrange formulation) described in [19]. It is worth noting here that the authors of this study also consider the use of another contact model for modeling interference, e.g., B-Spline surface for contact surface smoothing described in [20]. The front outer surface of the hub shown in Figure 4 was fixed.
Displacement of the shaft front face of 15 mm was assumed opposite to the Z-axis direction of the coordinate system. In the pressing process simulation, the shaft moves in the hub in 30 steps of 0.5 mm each. The maximum force determined in the pressing analysis corresponds to the force required to assemble the joint.
After pressing, a simulation of the shaft withdrawal was carried out. It was assumed that the force which causes the shaft to withdraw from the hub by the value of 0.1 mm is the force that destroys the joint.
Figure 5 shows the distribution of the maximum principal stresses in the hub and shaft after pressing, for the J5 joint.
Figure 6 shows the same stress distribution separately for the hub and the shaft.
Figure 7 shows the distribution of surface pressure on the shaft. The maximum value of the pressure is greater than the value corresponding to the material yield point, which causes plastic strain on the contact surface shown in Figure 8. A similar phenomenon is observed in the pressing analysis in joints no. 3 to 15, while joints no. 1 and 2 occur in the elastic range.
Table 3 summarizes the maximum values of surface pressure and plastic strain obtained for individual joints.
Figure 9 shows the distribution of total strains.
The diagram of assembly forces at each pressing step and the value of the force breaking the joint are shown in Figure 10.
Column 4 in Table 4 presents values of the joint breaking forces obtained as a result of numerical simulations, compared to the values of the breaking forces obtained from analytical formulas (columns 5 and 6).
To verify the correctness of the numerical model, experimental tests were carried out to determine the breaking force for the J5 joint. The results from Table 4 are presented in Figure 11.
Figure 11 shows graphs of the dependence of load-bearing force of the joint from the interference value for a constant diameter of the hub opening of ø 8 mm with a joint length of 15 mm. The results of the numerical simulation were approximated by the graph of a third-degree curve described by the following function: 0.575x3 − 41.21x2 + 946.1x − 906.8.
Analyzing results presented in Figure 10, obtained from the numerical analysis, it can be noted that with larger interferences between the shaft and the hub, which result in plasticization of contact surfaces in the pressing process, calculating the load capacity according to the formulas resulting from Lame’s elastic analogy is pointless. As can be seen from Figure 10, starting with an interference value of 16 μm, the value of the joint breaking force is set at a constant level and does not depend on the dimension of interference. For these joints, plasticization occurs along the entire length of the contact zone and progresses deeper into the joined elements with increasing dimensional interferences. Numerical analysis performed for the joints considered in the work showed that the breaking force value was inconsistent with the values obtained from Lame’s formulas, even in the range of interferences less than 16 µm. Therefore, it can be concluded that the joint load capacity determined according to these formulas leads to errors.

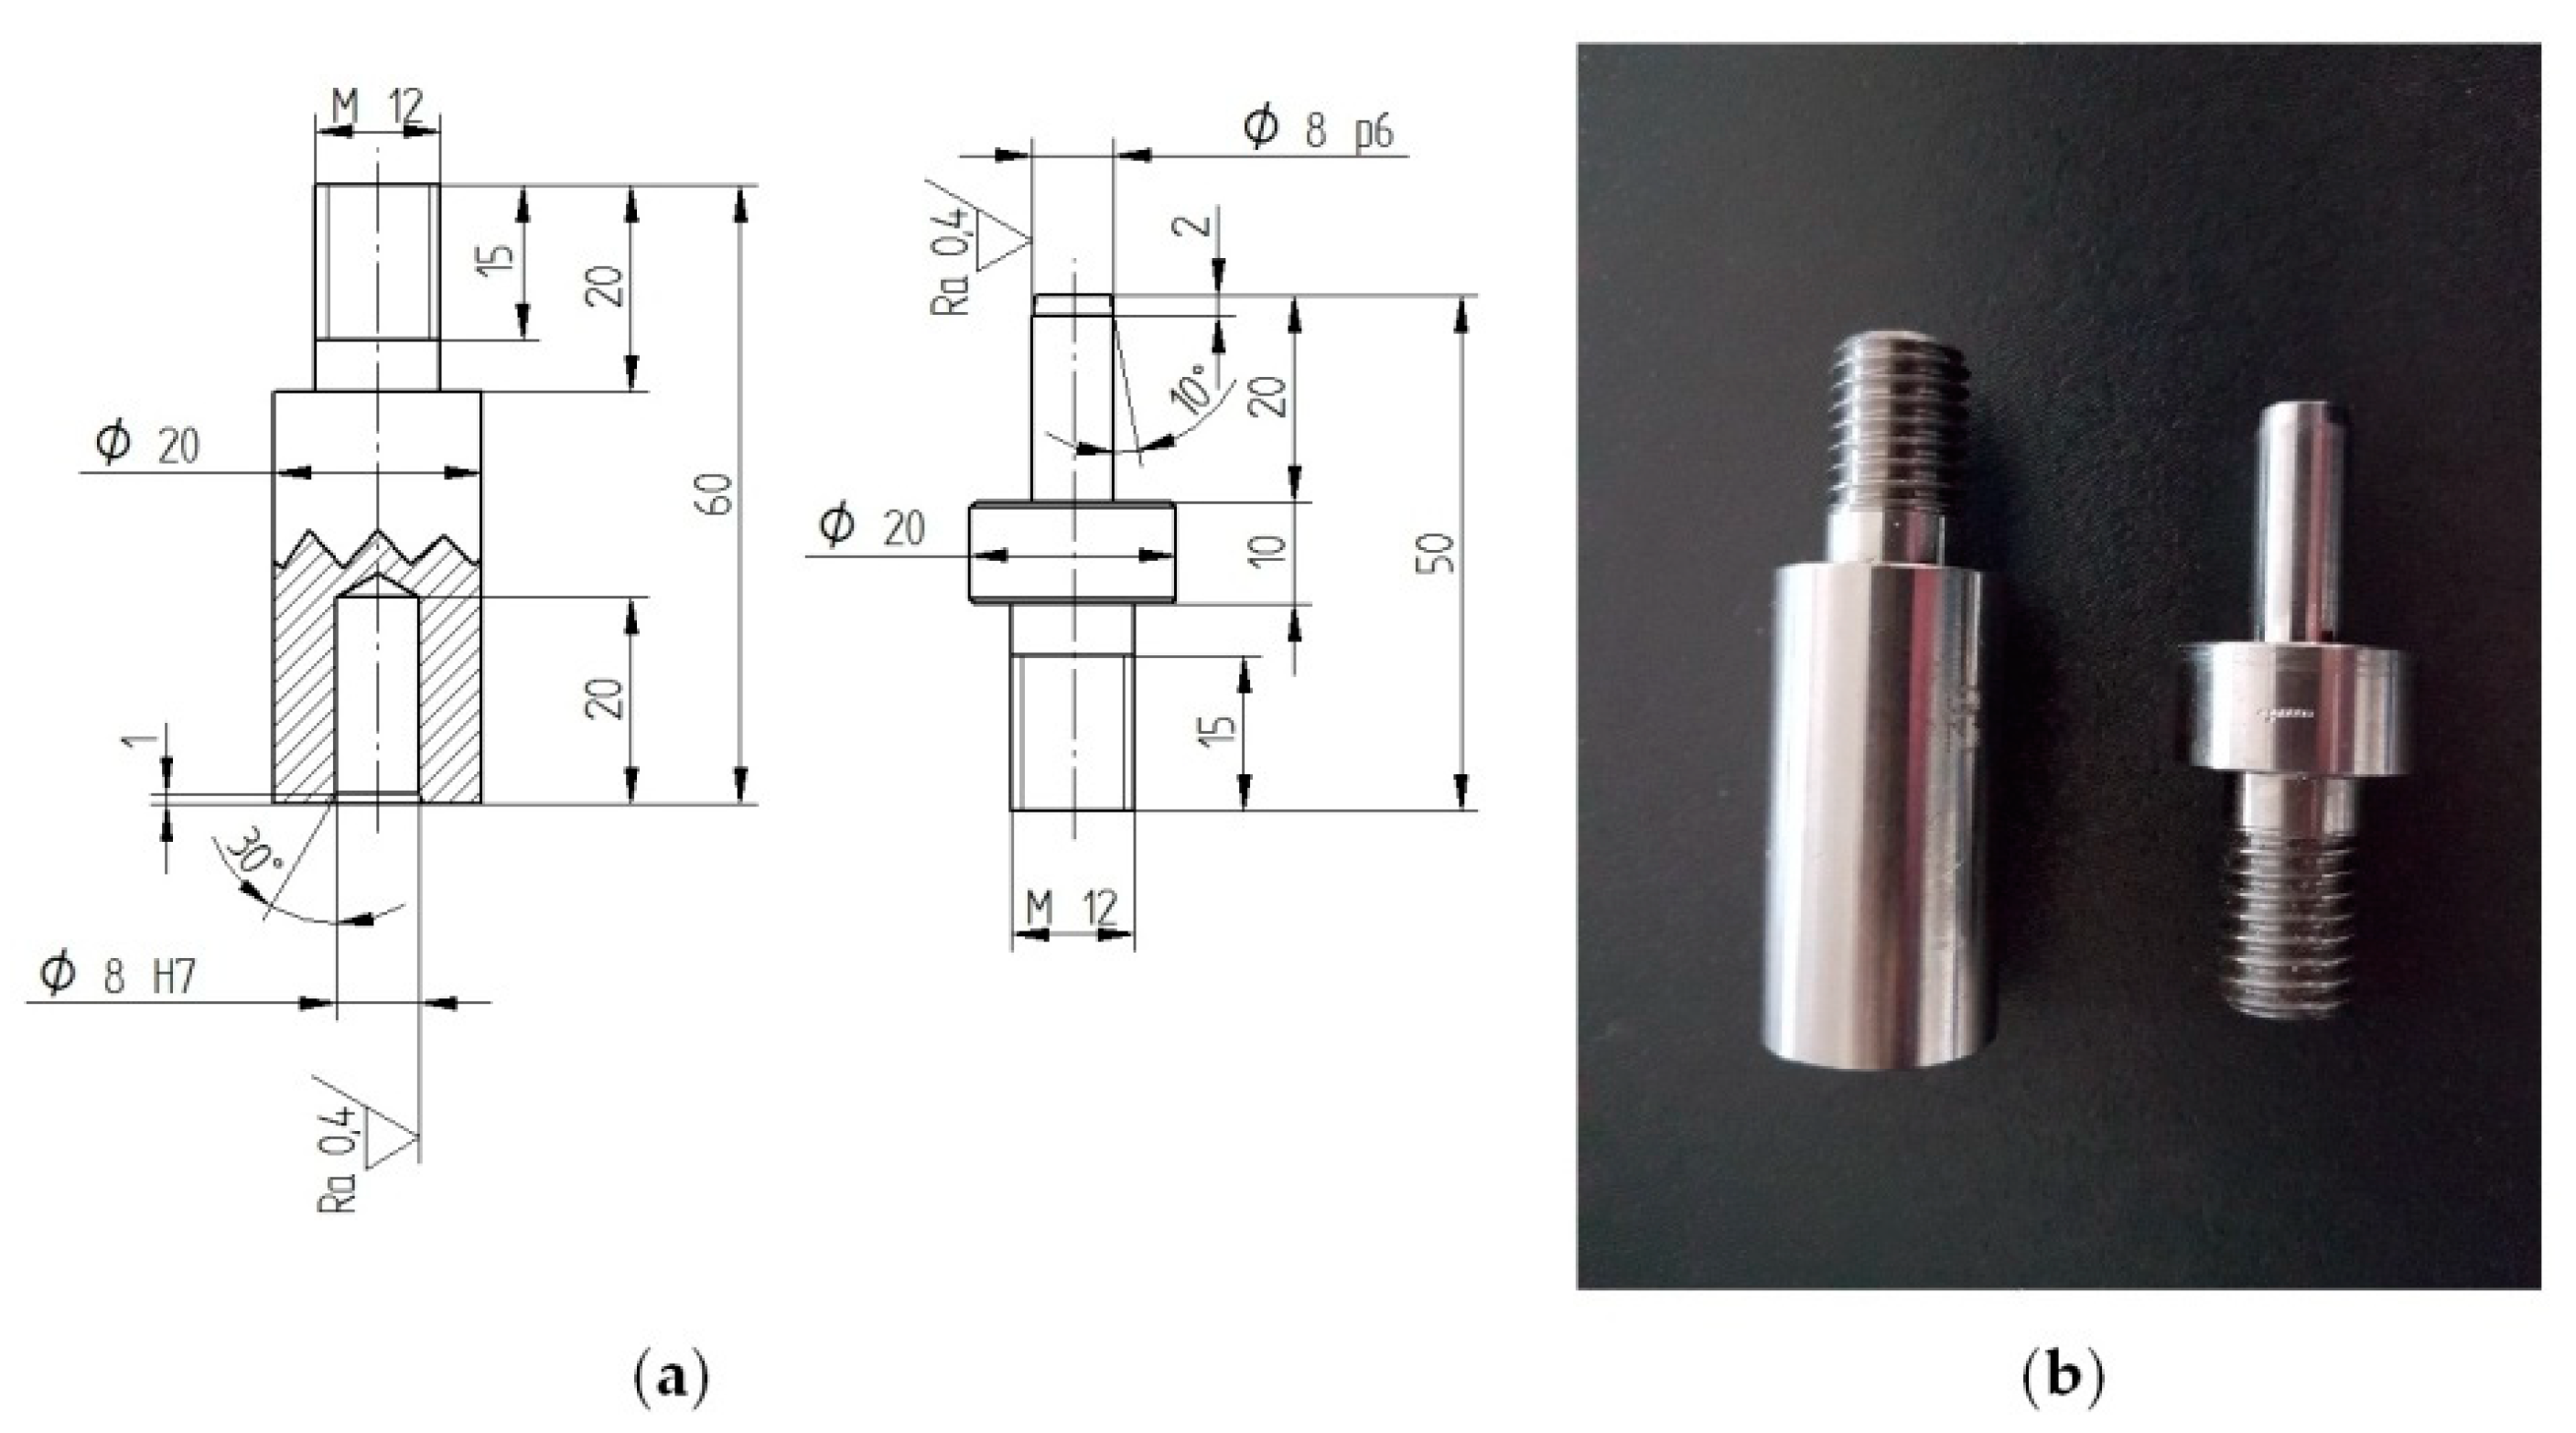
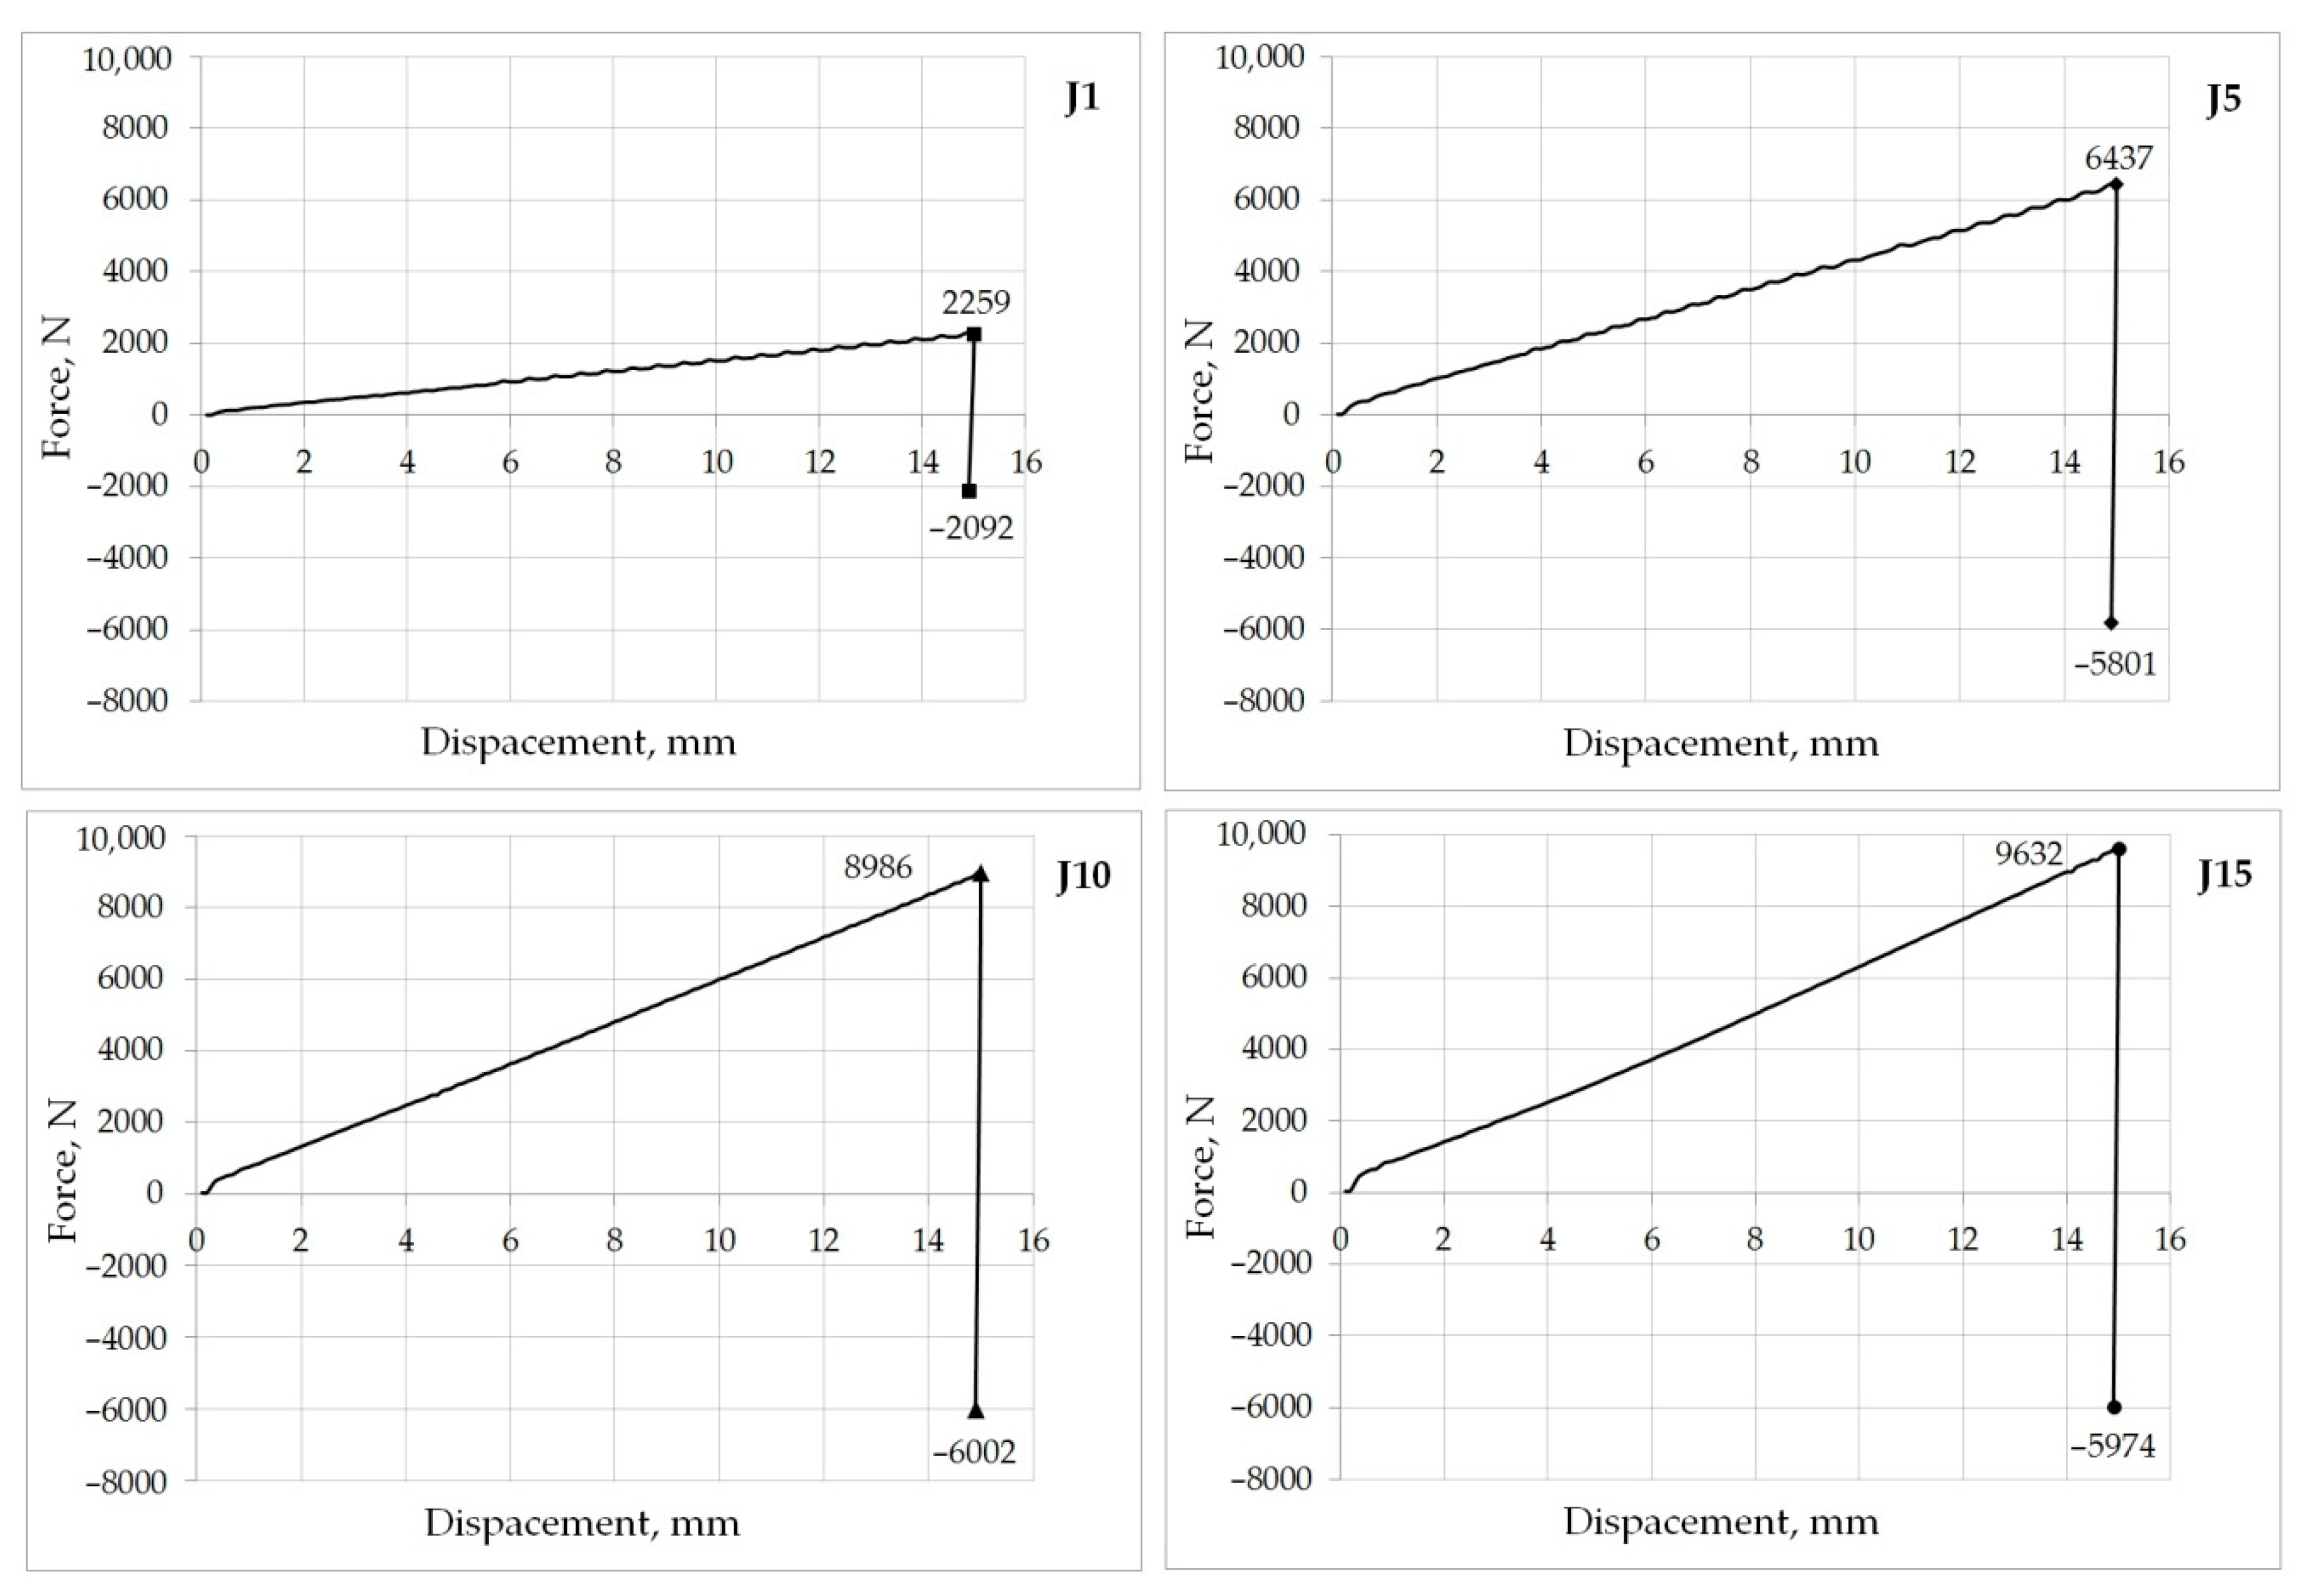
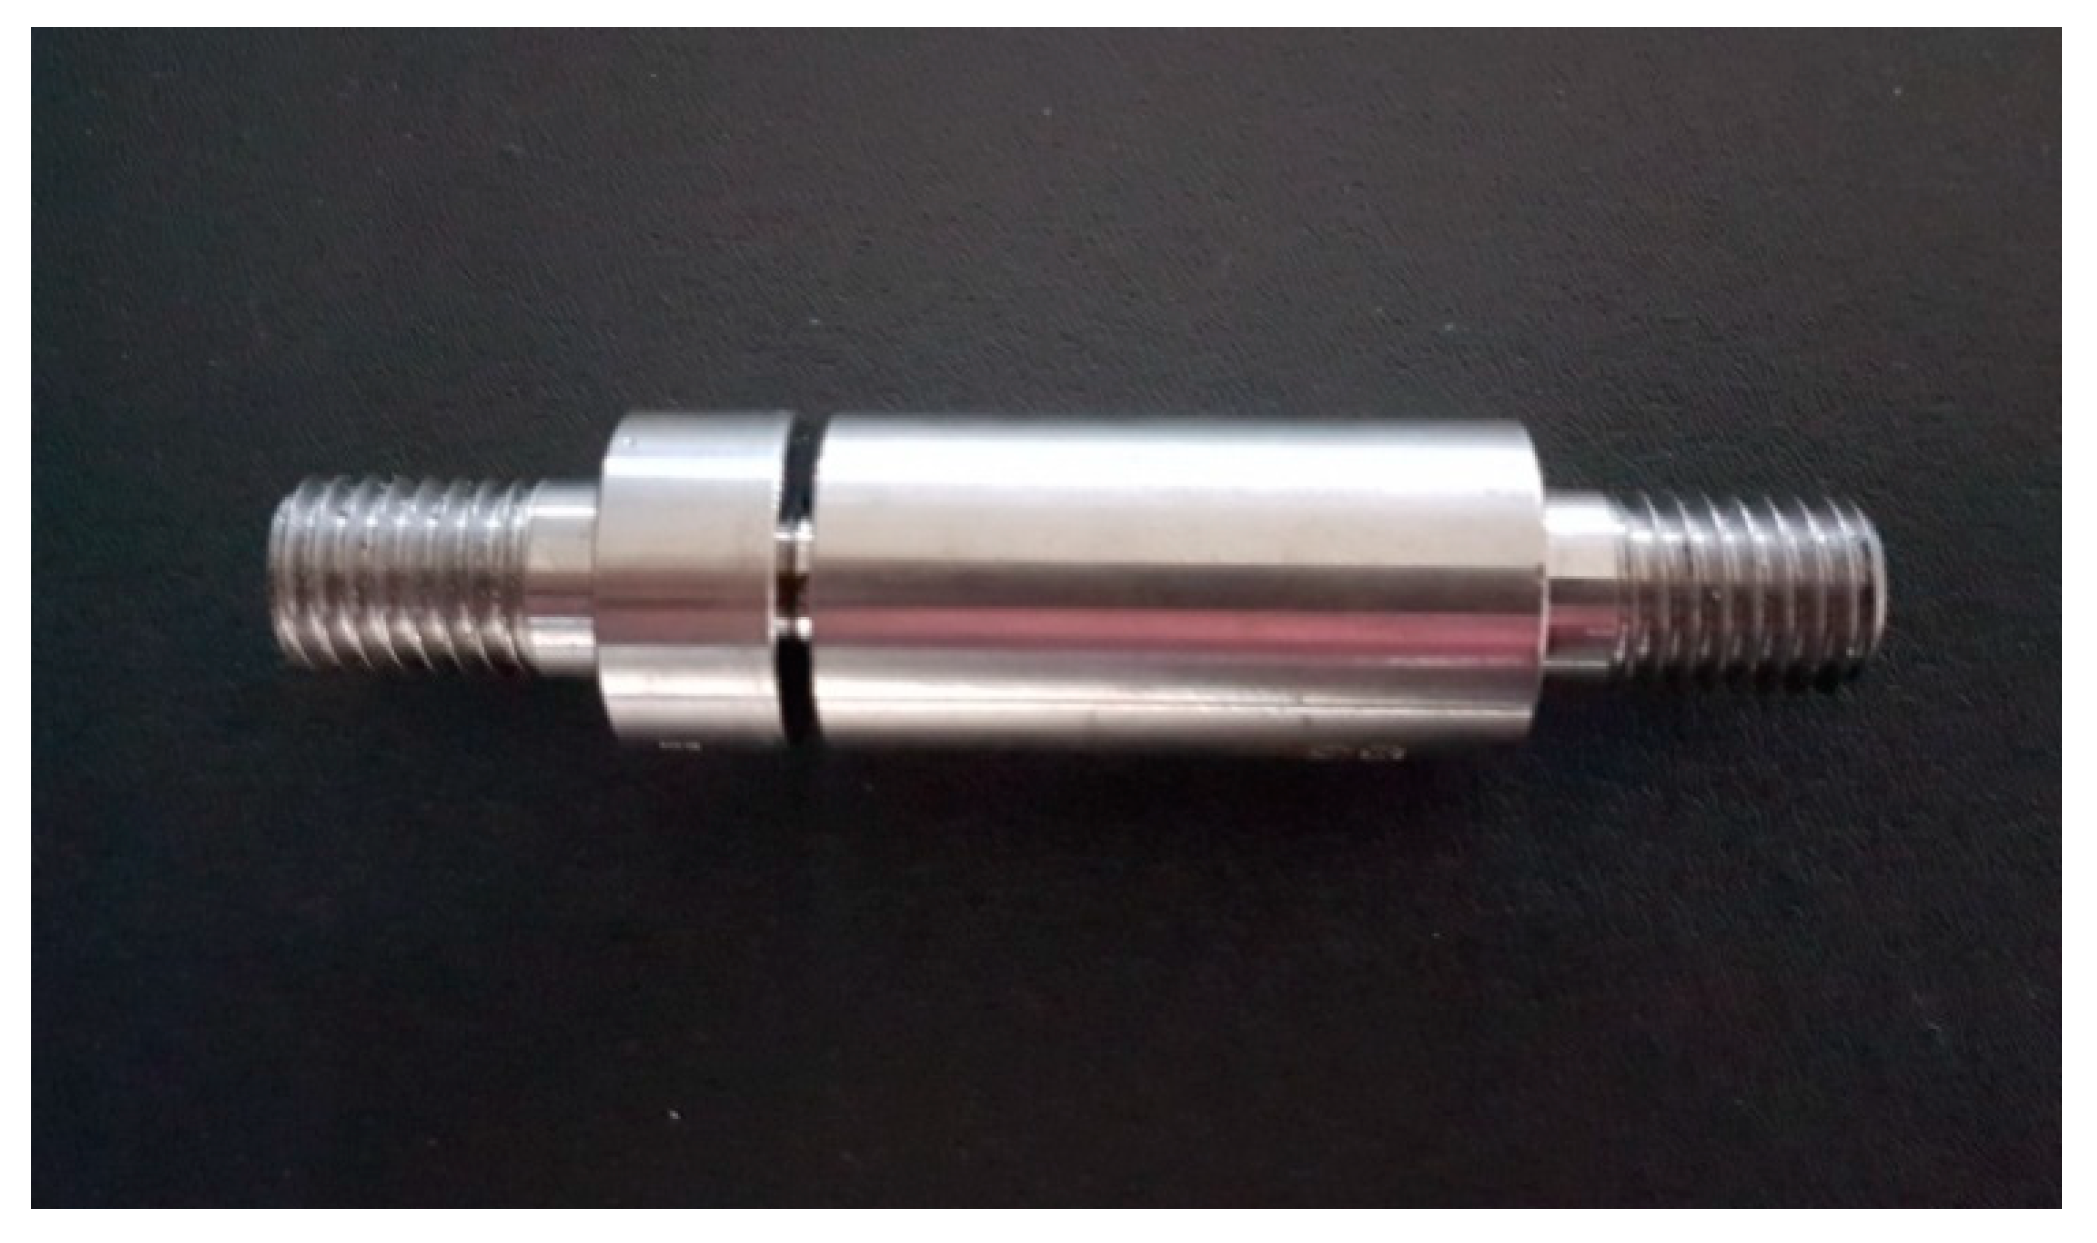
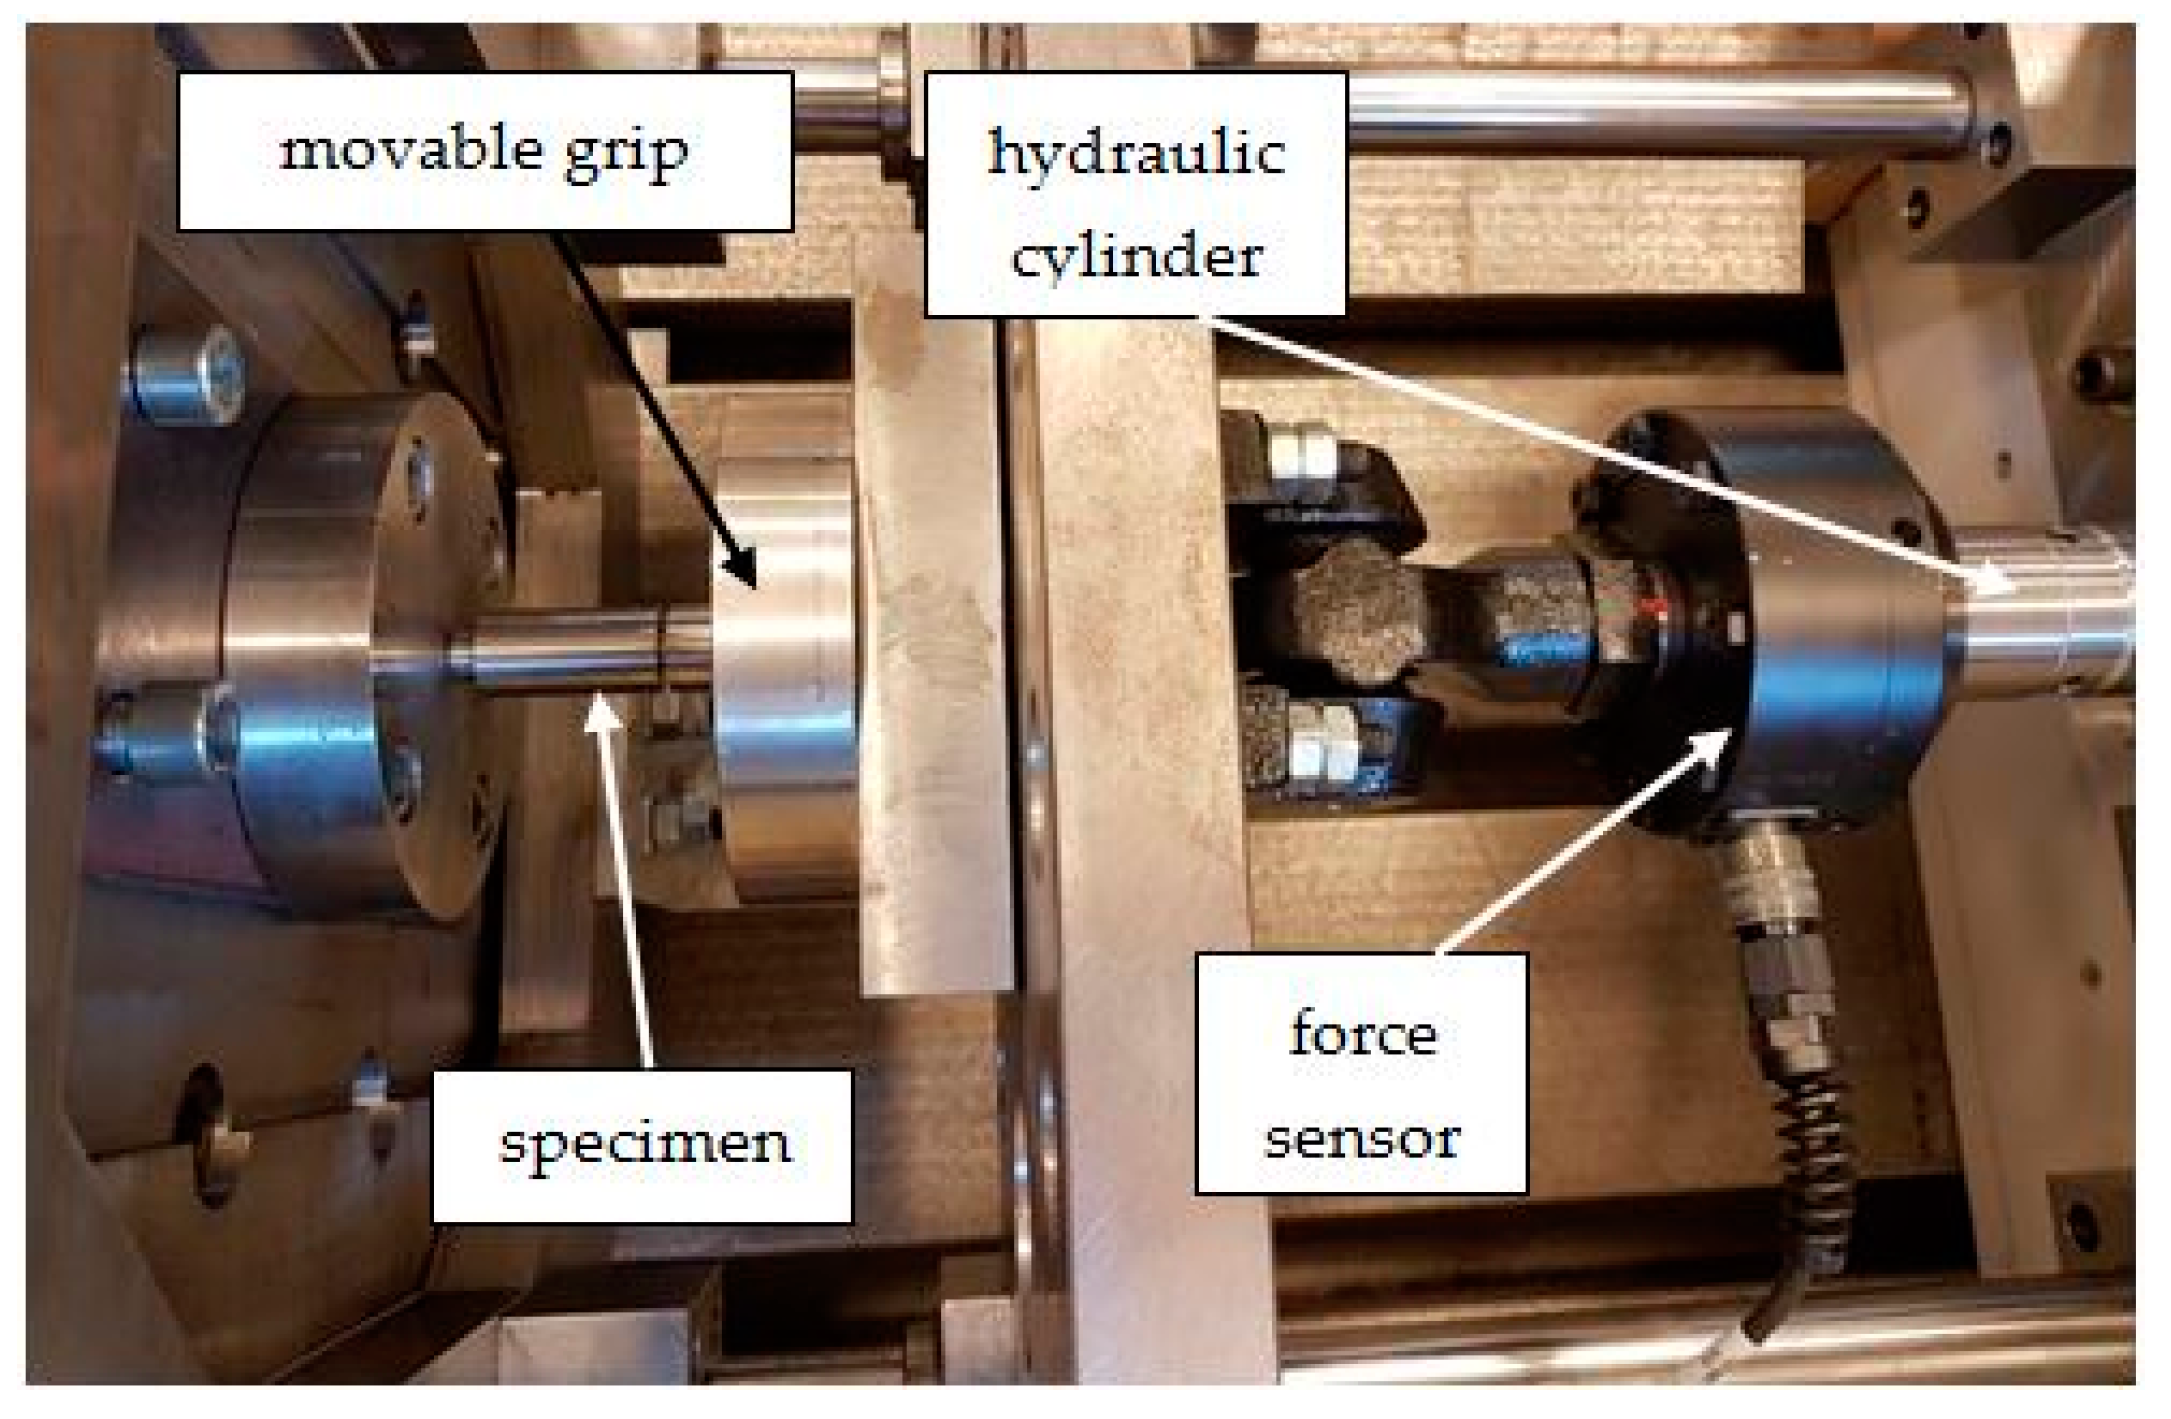
3.2. Experimental Verification

Five sets consisting of a shaft and a hub with dimensional parameters corresponding to the joint with symbol J5 were tested. The test set is shown after pressing to a depth of 15 mm (Figure 12).
Each set was subjected to a joint axial disassembly force test performed on a measuring device consisting of an MTS class 0.5 actuator equipped with a force sensor measuring the force range up to 25 kN and a displacement sensor with a range of up to 75 mm. The author′s procedure, developed in the TestSuit program controlling measuring system, was applied. An appropriate mounting adapter was used to fix the assembly, as shown in Figure 13.
Five breaking tests were carried out, recording the force and displacement values in each test until the shaft was completely withdrawn from the hub. An example of the graph obtained during one of the tests is shown in Figure 14.
The mean breaking force of the joint from the five tests carried out was 6014.0 ± 126.6 N with a standard deviation of 45.6 which, compared to the result obtained from the numerical simulation, shows a convergence with the calculations of 3.7%, confirming the correctness of the numerical model. The confidence range was determined based on the t-Student′s distribution with the confidence level of α = 0.95 [21].

4. Conclusions

Numerical simulations and experimental tests lead to the following conclusions:
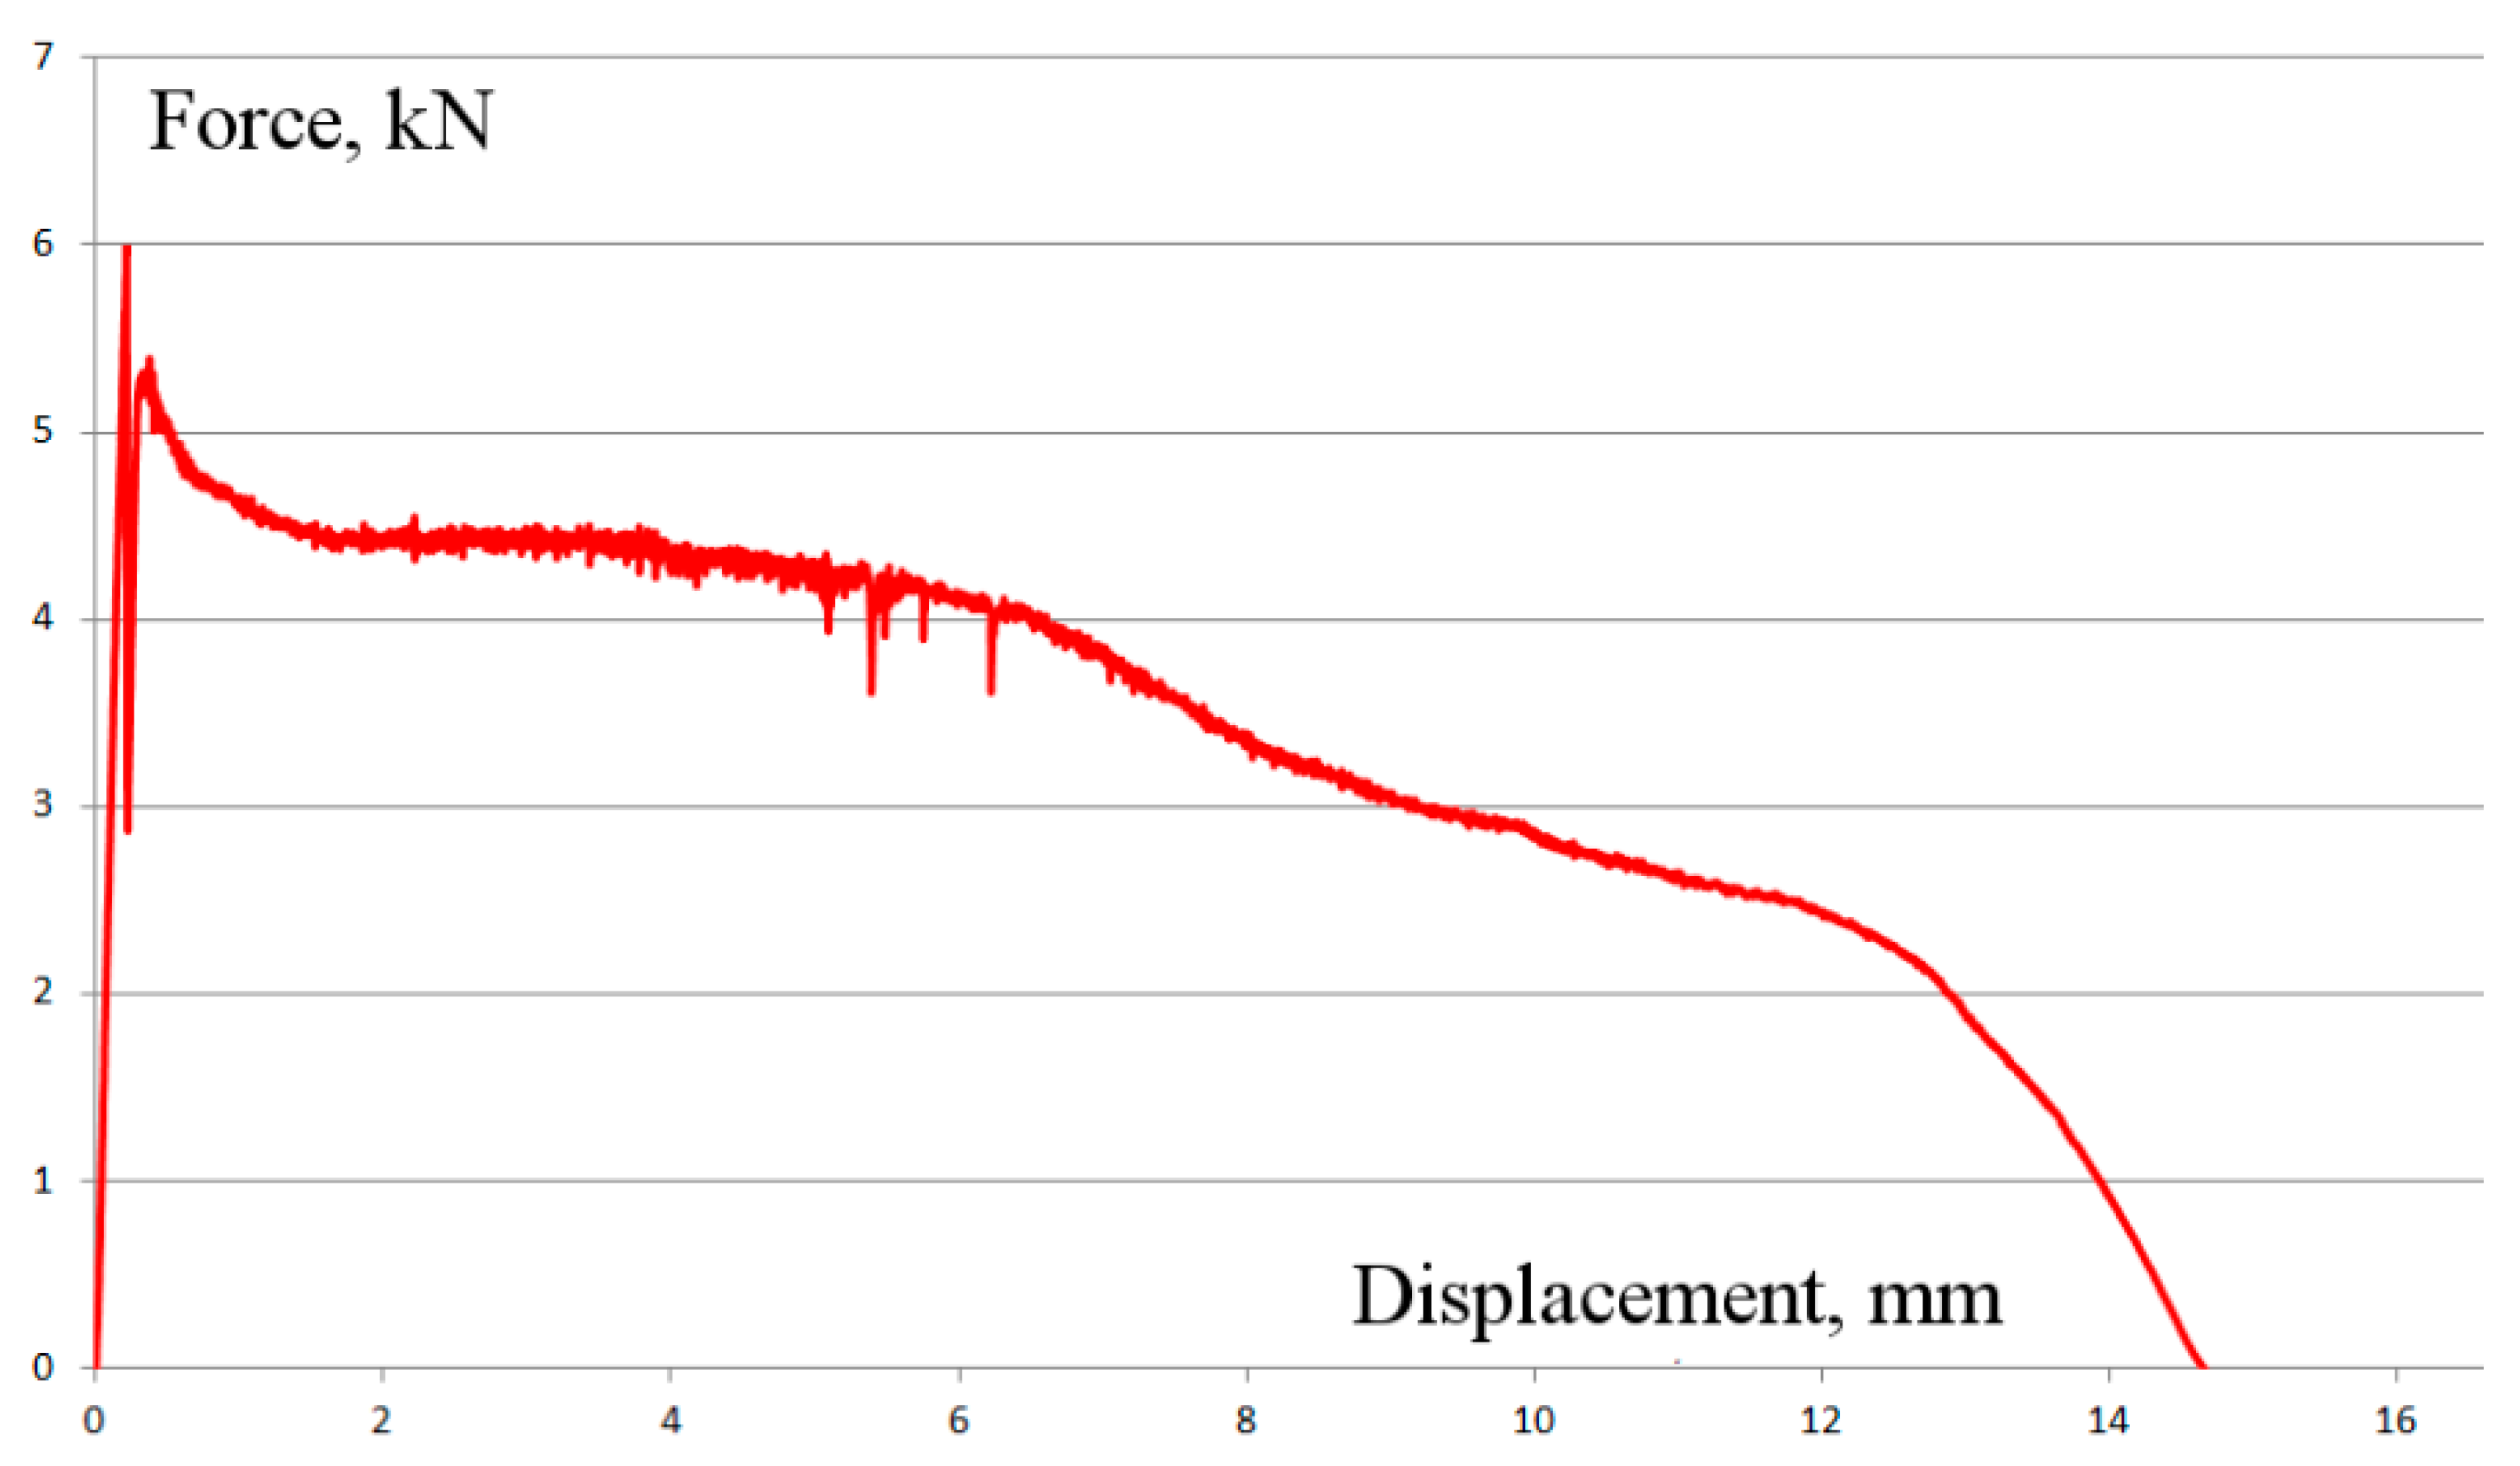
  • A large convergence of breaking force value obtained from the numerical simulation with the mean value of this force obtained from experimental tests confirmed the correctness of the numerical model.
  • Even though in J1 and J2 joint the pressures in the contact zone are in the elastic range (no plastic strain), the difference between the value of the force breaking the joint calculated from formulas (2 and 4) and the value of the force obtained from numerical simulations is 1707 N (for J2 3137−1430 = 1707 N), which gives a relative percentage error of 54%.
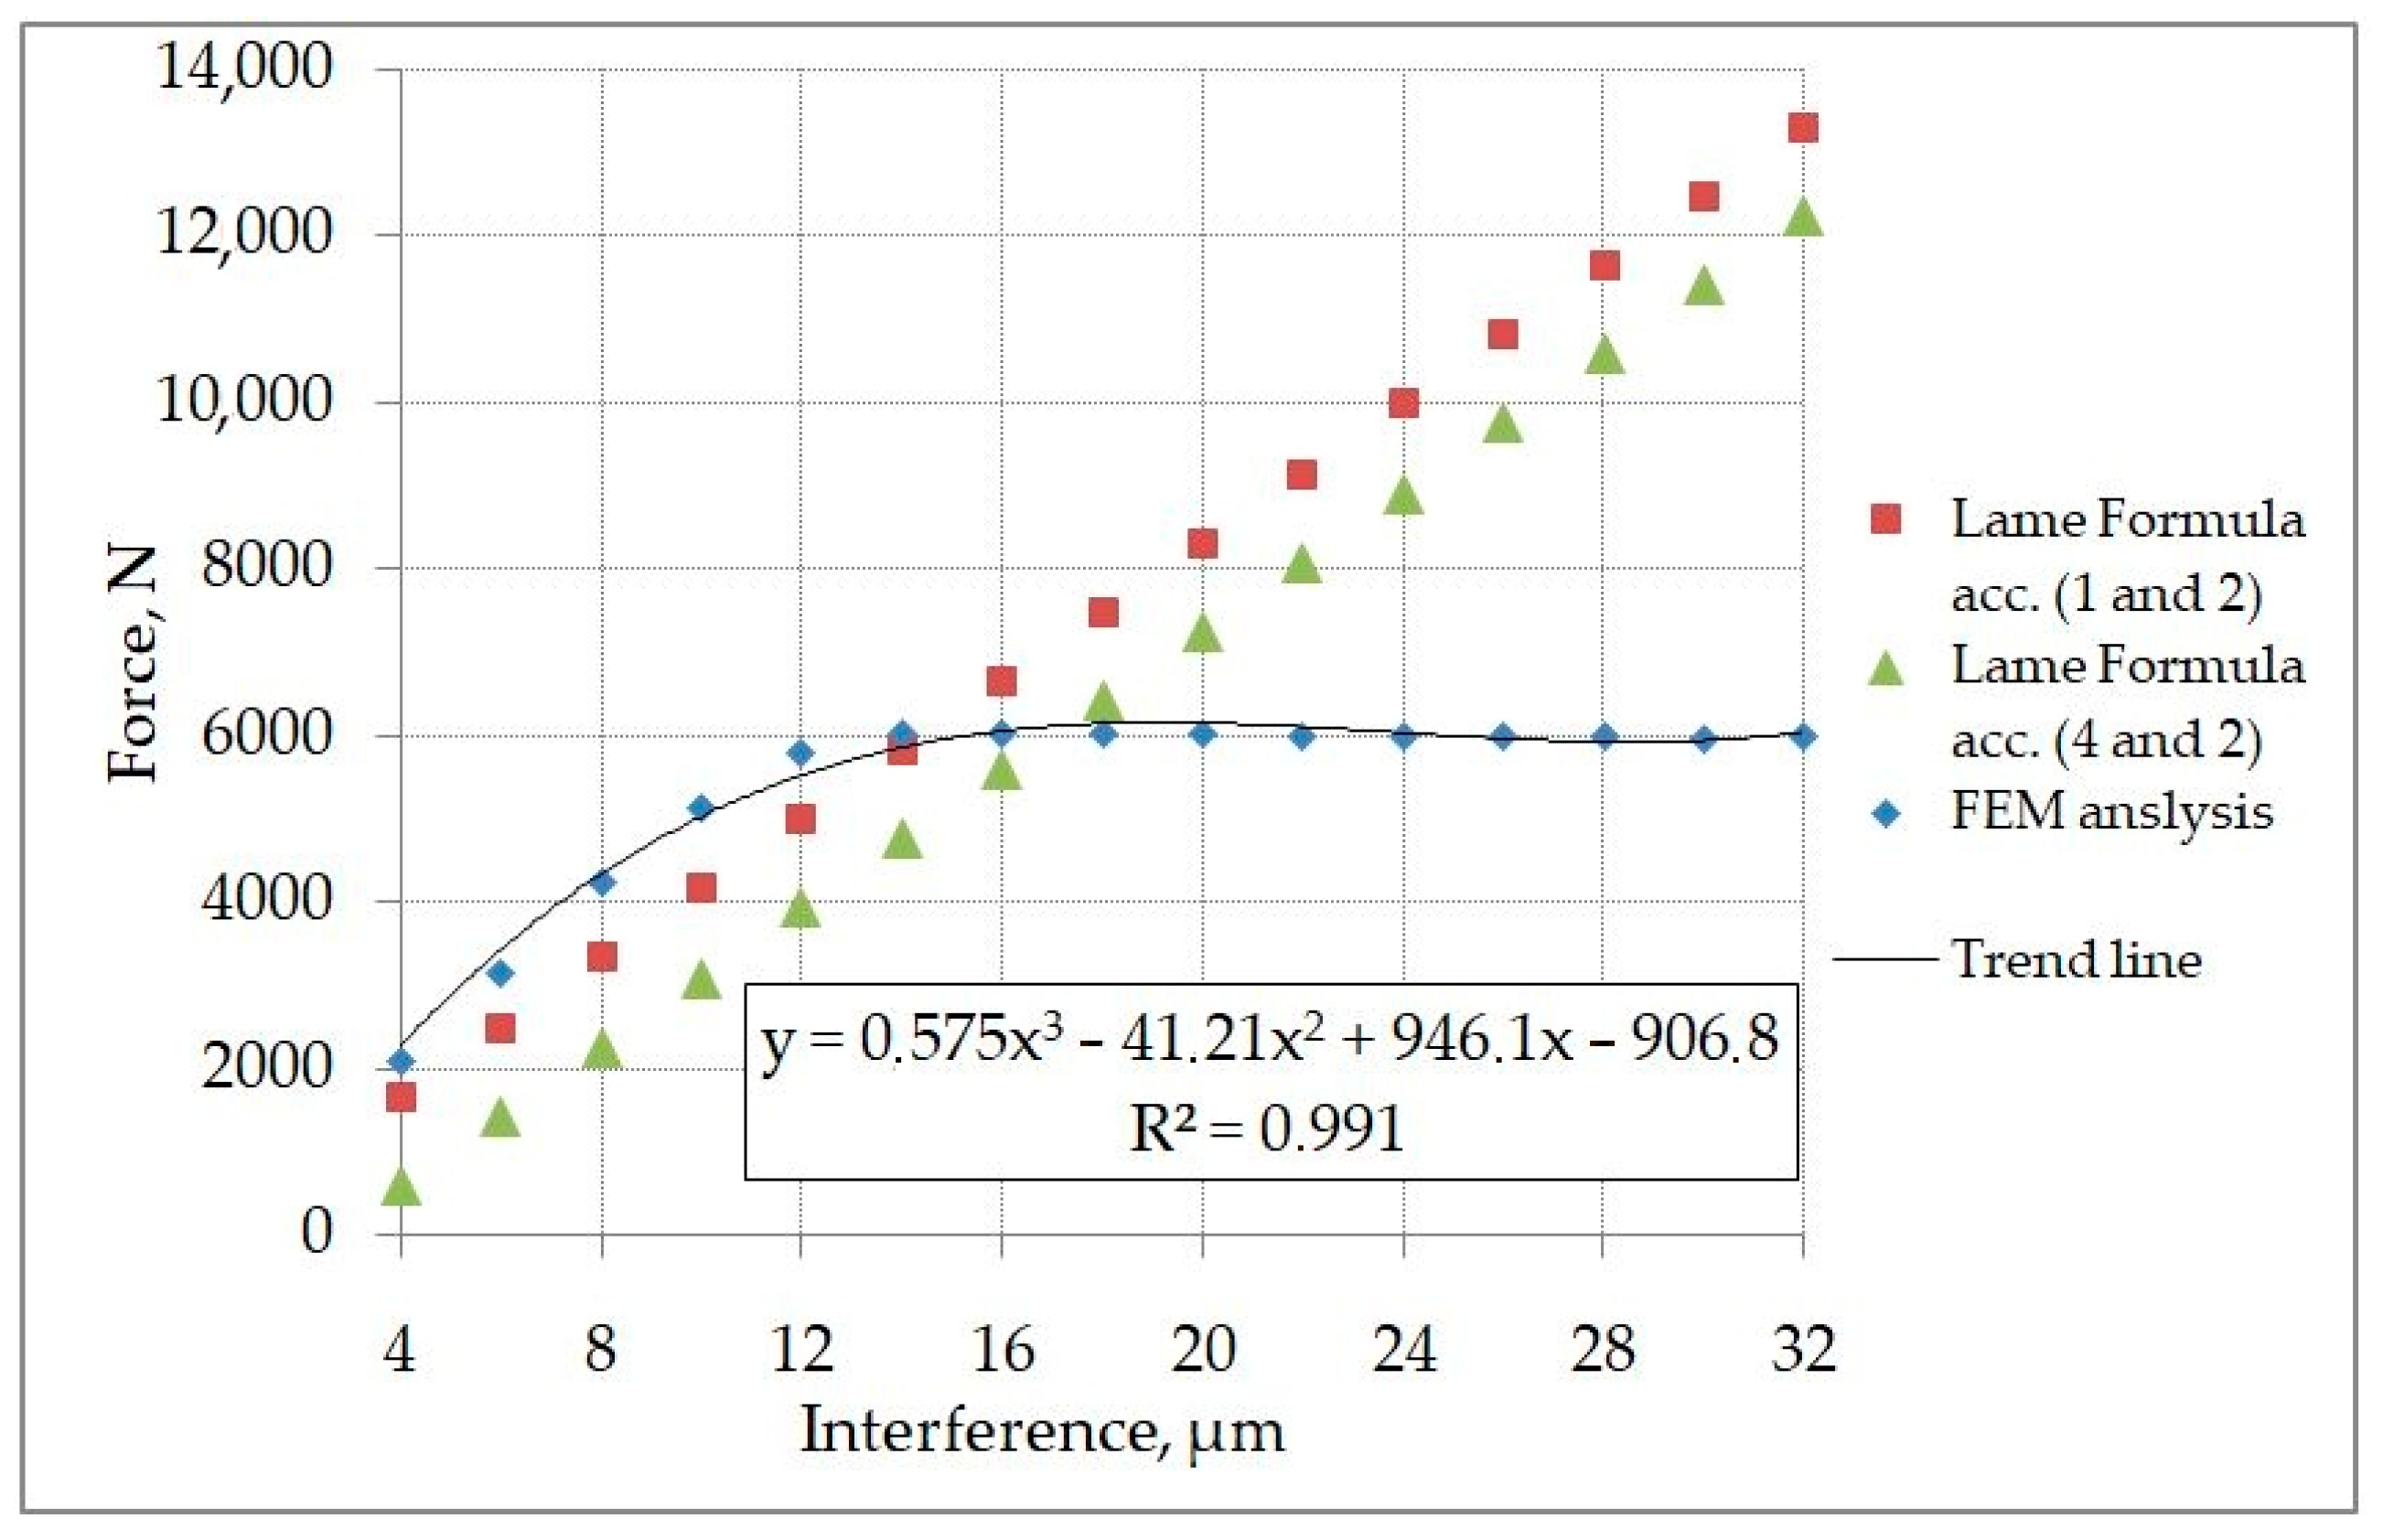
  • As shown by numerical simulations in J3-J15 joints, surface pressures exceeding the value of the yield point appear in contact zones. This is accompanied by the formation of plastic strains, which leads to the conclusion that the load capacity of the joint cannot be determined from Formula (2) based on the solution of the linear-elastic Lame’s problem.
  • As results from numerical simulations for J3–J15 joints, increasing interference increases the value of the assembly force of the joint, but does not significantly increase the value of the joint breaking force. The observation is in line with those in the paper [10]. This is due to the plasticization of the entire contact surface occurring along the entire length of the joint and continuing deeper into the joined elements.
Calculations conducted on the experimentally verified numerical model prove that even in the case of an elastic joint, the result of numerical analysis differs from the result based on the circular-symmetric task of the linear theory of elasticity. When selecting a specific type of fit, it is not possible to assess a priori whether the pressure level in the joint will be elastic or elastic-plastic. Therefore, the problem of determining the load capacity of press-fit joints generally remains an issue that requires further research and analysis.
The authors’ further works aim to build a mathematical model and an expert system that allows one to determine the load-bearing capacity of interference joints for different joint lengths and different diameters of joined elements. This system can be built based on numerical simulations based on artificial intelligence tools.

Author Contributions

Conceptualization, J.M.; Formal analysis, J.M. and M.Ś.; Investigation, J.M. and M.Ś.; Methodology, M.Ś.; Project administration, J.M.; Resources, M.Ś.; Software, M.Ś.; Supervision, J.M.; Validation, J.M. and M.Ś.; Visualization, J.M.; Writing—original draft, J.M.; Writing—review & editing, J.M. and M.Ś. All authors have read and agreed to the published version of the manuscript.

Funding

This research received no external funding.

Institutional Review Board Statement

Not applicable.

Informed Consent Statement

Not applicable.

Data Availability Statement

Data is contained within the article.

Acknowledgments

The authors would like to thank the Department of Mechanical Engineering Fundamentals of the University of Bielsko-Biala, Bielsko-Biała, Poland, for the laboratory infrastructure and technical support.

Conflicts of Interest

The authors declare no conflict of interest.

References

  1. Yang, G.M.; Coquille, J.C.; Fontaine, J.F.; Lambertin, M. Contact pressure between two rough surfaces of a cylindrical fit. J. Mater. Process. Technol. 2002, 123, 490–497. [Google Scholar] [CrossRef]
  2. Wang, X.; Lou, Z.; Wang, X.; Xua, C. A new analytical method for press-fit curve prediction of interference fitting parts. J. Mater. Process. Technol. 2017, 250, 16–24. [Google Scholar] [CrossRef]
  3. Lewis, R.; Marshall, M.B.; Dwyer-Joyce, R.S. Measurement of interface pressure in interference fits. J. Mech. Eng. Sci. 2005, 219, 127–139. [Google Scholar] [CrossRef] [Green Version]
  4. Shigley, J.E.; Mischke, C.R. Standard Handbook of Machine Design, 2nd ed.; McGraw-Hill: New York, NY, USA, 1996; pp. 607–619. ISBN 0-07-056958-4. [Google Scholar]
  5. Lanoue, F.; Vadean, A.; Sanschagrin, B. Finite element analysis and contact modeling considerations of interference fits for fretting fatigue strength calculations. Simul. Model. Pract. Theory 2009, 17, 1587–1602. [Google Scholar] [CrossRef]
  6. Meerkamm, H. Schaeffler Technical Pocket Guide, 1st ed.; Schaeffler Technologies GmbH & Co. KG: Herzogenaurach, Germany, 2014; pp. 432–433. [Google Scholar]
  7. Cajuhi, A.J.; Pepe, I.M.; Moreno, D.M. Using finite element analysis and strain gauge experimental data to evaluate stress concentration factor on press-fit assembly. In Proceedings of the 20th International Congress of Mechanical Engineering, Gramado, Brazil, 15–20 November 2009; pp. 15–20. [Google Scholar]
  8. Croccolo, D.; Vincenzi, N. Stress concentration factors in compression–fit couplings. J. Mech. Eng. Sci. 2010, 224, 1143–1152. [Google Scholar] [CrossRef]
  9. Gallio, G.; Marcuccio, G.; Bonisoli, E.; Tornincasa, S.; Pezzini, D.; Ugues, D.; Lombardi, M.; Rovarino, D.; Fino, P.; Montanaro, L. Study of the interference contribution on the performance of an adhesive bonded press-fitted cylindrical joint. Int. J. Adhes. Adhes. 2014, 53, 89–96. [Google Scholar] [CrossRef]
  10. Hüyük, H.; Music, O.; Koç, A.; Karadogan, C.; Bayram, Ç. Analysis of elastic-plastic interference-fit joints. In Proceedings of the 11th International Conference on Technology of Plasticity, Nagoya, Japan, 19–24 October 2014; pp. 2030–2035. [Google Scholar]
  11. Sinitsyna, V.; Sinitsyn, A. Finite-Element Analysis of Parts Stress State of Tight Joint Assembled by Press Fitting. Mod. Mech. Eng. 2014, 4, 198–206. [Google Scholar] [CrossRef] [Green Version]
  12. McMillan, M.; Booker, J.; Smith, D. Simulation of interference fitted joint strength as used in hot rolling work rolls. In Experimental and Applied Mechanics; Ventura, C.E., Crone, W.C., Furlong, C., Eds.; Springer: New York, NY, USA, 2013; pp. 319–326. ISBN 978-1-4614-4225-7. [Google Scholar]
  13. Croccolo, D.; De Agostinis, M.; Olmi, G. Fatigue Life Characterisation of Interference Fitted Joints. In Proceedings of the ASME 2013 International Mechanical Engineering Congress and Exposition. Volume 2B: Advanced Manufacturing, San Diego, CA, USA, 15–21 November 2013. [Google Scholar] [CrossRef]
  14. Strozzi, A.; Bertocchi, E.; Baldini, A.; Mantovani, S. Normalization of the stress concentrations at the rounded edges of an interference fit between a solid shaft subjected to bending and a hub. Mech. Based Des. Struct. Mach. 2015, 44, 405–425. [Google Scholar] [CrossRef]
  15. Croccolo, D.; De Agostinis, M.; Fini, S.; Olmi, G.; Paiardini, L.; Robusto, F. Influence of the interference level and of the assembly process on the shear strength of loctite 648 anaerobic adhesive. J. Adhes. 2020, 96, 90–112. [Google Scholar] [CrossRef]
  16. Jakubiec, W.; Płowucha, W.; Rosner, P. Uncertainty of measurement for design engineers. Procedia CIRP 2016, 43, 309–314. [Google Scholar] [CrossRef] [Green Version]
  17. European Standard: ISO 286-1: 2011—Geometrical Product Specifications (GPS)—ISO Linear Tolerance System—Part 1: Fundamentals of Tolerances, Deviations and Fits. Available online: https://www.iso.org/obp/ui/#iso:std:iso:286:-1:en (accessed on 15 August 2020).
  18. ANSYS Inc. PDF Documentation for Release 2020 R1. Available online: https://d.shikey.com/down/Ansys.Products.2020.R1.x64/install_docs/Ansys.Products.PDF.Docs.2020R1/readme.html (accessed on 15 August 2020).
  19. Hirmand, M.; Vahab, M.; Khoei, A.R. An augmented Lagrangian contact formulation for frictional discontinuities with the extended finite element method. Finite Elem. Anal. Des. 2015, 107, 28–43. [Google Scholar] [CrossRef]
  20. Santos, D.B.V.; Bandeira, A.A. Numerical modeling of contact problems with the finite element method utilizing a B-Spline surface for contact surface smoothing. Lat. Am. J. Solids Struct. 2018, 15, 1–23. [Google Scholar] [CrossRef]
  21. Gardoń, A. Rozkład statystyki t-Studenta przy danej wariancji z próby o rozkładzie normalnym. Didact. Math. 2011, 12, 17–30. [Google Scholar]
Figure 1. The idea of the interference-fit joint.
Applsci 11 11428 g001
Figure 2. (a) Technical drawing of the joint, (b) Set before pressing.
Applsci 11 11428 g002
Figure 3. A discrete model.
Applsci 11 11428 g003
Figure 4. Fixed area.
Applsci 11 11428 g004
Figure 5. Principal stresses contour-assembly view.
Applsci 11 11428 g005
Figure 6. The contour of principal stresses in the hub and the shaft.
Applsci 11 11428 g006
Figure 7. Surface pressures.
Applsci 11 11428 g007
Figure 8. Plastic strain contour.
Applsci 11 11428 g008
Figure 9. Values of total strains.
Applsci 11 11428 g009
Figure 10. Graphs of assembly forces with marked breaking forces of the J1, J5, J10, and J15 joint.
Applsci 11 11428 g010
Figure 11. A graph of joint breaking forces, determined by means of formulas and numerical simulation.
Applsci 11 11428 g011
Figure 12. Set after pressing.
Applsci 11 11428 g012
Figure 13. Measuring stand.
Applsci 11 11428 g013
Figure 14. Force-displacement graph for J5 joint obtained during the test.
Applsci 11 11428 g014
Table 1. A list of joints.
Joint
Symbol
Nominal
Diameter of
the Joint
FitInterference
Δ, mm
Type of Fit
J1ø 8H7/k60.004Locational transition fit
J20.006
J3 0.008
J4 0.010
J5H7/p60.012Locational interference fit
J6 0.014
J7 0.016
J8 0.018
J9 0.020
J10H7/s60.022Medium drive fit
J11 0.024
J12 0.026
J13 0.028
J14H7/u60.030Force fit
J15 0.032
Table 2. Results of calculations of surface pressures and breaking forces based on classic and modified Lame’s formulas.
Joint
Symbol
Surface Pressure
acc. (1), MPa
Breaking Force acc. (2), NSurface Pressure
acc. (4), MPa
Breaking Force acc. (2), N
J144.10166315.88599
J266.15249437.931430
J388.20332559.982261
J4110.25415682.033092
J5132.304988104.083924
J6154.355819126.134755
J7176.406650148.185586
J8198.457481170.236417
J9220.508313192.287249
J10242.559144214.338080
J11264.609975236.388911
J12286.6510,806258.439742
J13308.7011,638280.4810,574
J14330.7512,469302.5311,405
J15352.8013,300324.5812,236
Table 3. Surface pressures and plastic strains were obtained from the FEM analysis.
Joint
Symbol
Surface Pressure,
MPa
Maximum Plastic Strain, mm/mm
J1810
J21220
J31629.05 × 10–4
J42024.95 × 10–3
J52401.09 × 10–2
J62361.71 × 10–2
J72532.34 × 10–2
J82632.97 × 10–2
J92723.62 × 10–2
J102774.22 × 10–2
J112774.91 × 10–2
J122705.26 × 10–2
J132745.77 × 10–2
J142836.05 × 10–2
J152936.39 × 10–2
Table 4. Summary of assembly forces and breaking forces for each joint.
Joint
Symbol
Interference
Δ, mm
FEM AnalysisLame’s Formula
Assembly Force,
N
Breaking Force,
N
Breaking Force acc. (1 and 2), NBreaking Force acc. (4 and 2), N
J10.004229320921663599
J20.0063438313724941430
J30.0084516422033252261
J40.0105549512541563092
J50.0126437580149883924
J60.0147174600658194755
J70.0167784600466505586
J80.0188285601074816417
J90.0208682601083137249
J100.0228986600291448080
J110.0249209599999758911
J120.0269373600110,8069742
J130.0289474599911,63810,574
J140.0309560596012,46911,405
J150.0329632597413,30012,236
Publisher’s Note: MDPI stays neutral with regard to jurisdictional claims in published maps and institutional affiliations.

