Abstract
Every year in Italy, there are about 20,000 road accidents involving pedestrians, with a significant number of injuries and deaths. Out of these, about 30% occur at pedestrian crossings, where pedestrians should be protected the most. Here, we propose a new accident prediction model to improve pedestrian safety assessments that allows us to accurately identify the sites with the largest potential safety improvements and define the best treatments to be applied. The accident prediction model was developed using the ISTAT dataset, including information about the fatal and injurious crashes that occurred in Italy in a 5-year period. The model allowed us to estimate the risk level of a road section through a machine-learning approach. Gradient Boosting seems to be an appropriate tool to fit classification models for its flexibility that allows us to capture non-linear relationships that would be difficult to detect via a classical approach. The results show the ability of the model to perform an accurate analysis of the sites included in the dataset. The locations analyzed have been classified based on the potential risk in the following three classes: High, medium, and low. The proposed model represents a solid and reliable tool for practitioners to perform accident analysis with pedestrian involvement.
1. Introduction
Pedestrian injuries and fatalities represent one of the major road safety problems worldwide. Due to the vulnerability of these road users, the consequences of accidents involving pedestrians show higher severity when compared with other kinds of accidents, and lead to a significant rate of morbidity, disability, and death. Estimates suggest that approximately 12 million road accidents involving pedestrians occur every year and cause the deaths of about 270,000 people worldwide (around 23% of all traffic fatalities globally [1]). This burden, in addition to inflicting pain and suffering on injured pedestrians and their families, also has a significant economic impact on society, costing approximately 0.5% of the total world Gross National Product and USD 130 billion globally [2].
In 2018, 4763 pedestrians’ fatalities were reported in Europe, accounting for 20% of total traffic deaths [3]. Although the absolute number of pedestrian fatalities fell from 5952 to 4763 fatalities between 2010 and 2018 (−20%), the total number of road fatalities decreased to the same extent (−21%); therefore, the proportion of pedestrians in the total number of road fatalities is the same. Therefore, the proportion of pedestrians in the overall number of road fatalities has remained almost constant in recent years [3].
In Italy, the situation is even more serious, with about 20,000 road accidents with at least one pedestrian occurring every year. According to the Italian data published by ACI-ISTAT [4], in 2019, 534 pedestrians were killed and more than 21,000 were injured in traffic-related crashes. Out of these, about 30% occurred at pedestrian crossings, which is the location where pedestrians should be the most protected while crossing the street.
The safety of pedestrians, especially in urban areas where there is a higher density of pedestrians present, should be a priority to improve people’s quality of life and to support pedestrians’ mobility, and in general, the mobility of vulnerable road users.
The European Commission highlighted the need to define criteria to improve the safety and mobility of vulnerable road users. This also requires a framework that takes the various needs of vulnerable road users into account. Concepts such as Sustainably Safe Traffic and Zero Vision provide the framework for infrastructure planning to drastically reduce the probability of crashes. However, effective infrastructural countermeasures to make walking safer and protect pedestrians require an understanding of the risk factors affecting pedestrians’ safety and the causes of accidents involving pedestrians [5], especially in areas where roadside and pedestrian activities, traffic volume, and traffic speed variations are significantly higher than in other road environments [6].
In this context, the roadway safety management process plays an important role in improving traffic safety. Within this topic, Accident Prediction Models (APMs) represent one of the best available tools for performing a quantitative safety assessment. APMs are mathematical equations that allow road engineers and/or National Road Authorities (RAs) to relate the number of crashes expected on a site to its specific geometric and environmental characteristics. Nowadays, APMs are widely used by road authorities, designers, and road safety practitioners to investigate safety issues and estimate the potential safety effects of these improvements [7,8]. APMs also allow locations that may benefit the most from a safety treatment to be identified, and therefore, for strategies and priorities to be better defined [9].
The Highway Safety Manual (HSM) is currently the most widely recognized method in accident prediction research [10]. It provides a predictive method for estimating the expected average crash frequency (divided by crash severity and collision types) within the road network. It also provides the user with analytical tools to identify locations with a higher risk of accidents and to quantify the potential factors contributing to traffic accidents and countermeasures to improve safety. However, the HSM, given its simplicity, represents only a reference point. To achieve more accurate predictions, it is usually suggested to have models calibrated on local data instead of general models. However, even with the appropriate calibration, applying the HSM model to Italian roads is not sufficient to guarantee good results. Indeed, the general level of crash frequencies may vary substantially from one jurisdiction to another for a variety of reasons, including environmental factors and crash reporting thresholds or crash reporting system procedures.
Given the importance of the pedestrian safety issue highlighted above, the development of APMs that make it possible to understand which factors significantly affect pedestrians’ safety and support the implementation of countermeasures to reduce the risk of accidents seem to be of critical importance. However, not many APMs for pedestrians have been developed. Some of these entail modelling methodologies that include both statistical models and Artificial Intelligence (AI) techniques aimed at identifying the factors responsible for pedestrian crashes [11]. Specifically, these studies showed that some variables have a considerable influence on pedestrian safety such as traffic exposures (e.g., vehicle and pedestrian volume, speed) [12], geometric design (e.g., road width or the number of lanes) [13,14], and road infrastructures. In particular, the impact of speed [15,16,17,18] is significantly associated with a higher risk of pedestrian–vehicle crashes, as well as greater injury severity. Recently [6], the use of generalized regression models has allowed the number of bus stoppings per unit of time, the position of parking slots, pedestrian crossings and the volume of violations, the traffic speed variation, and the number of intersecting side roads, in addition to the through and intersecting traffic volume, to be identified as some of the significant variables linked to the risk of a pedestrian crash.
Models have also been fitted to predict the number of accidents per year. However, only one study has been published that adopts this approach for the analysis of pedestrian accidents. Olszewski et al. [19] developed negative binomial models for un-signalized pedestrian crossings, each one positioned across two lanes of traffic in the same direction, using a limited database (52 locations in Warsaw). The results showed that the statistically significant risk factors affecting pedestrian safety at marked intersections are a higher proportion of heavy vehicles, location in mixed lane use, and the absence of a traffic signal. The results also showed that the model can be used with the Empirical Bayes method to obtain an unbiased identification of high-risk locations.
In sum, the research activity implemented to reduce pedestrian incidents until now has provided only exploratory results; therefore, further efforts are needed to fill this gap. To this aim, tree-based machine learning models and other non-parametric methodology could represent promising alternative approaches in this research field. These have been used within transportation safety research [20] in order to model crash frequency on a rural road [21], study the potential factors affecting crashes [22], and classify intersection crashes [23].
Here, we presented the preliminary activity of the SWALK (Safe crossWALKs in urban areas: Assessment of countermeasures to improve pedestrian safety) research project. This project was conducted by the Department of Civil and Environmental Engineering (DICeA) and the Department of Neurosciences, Psychology, Drug Research, and Child Health (NEUROFARBA) of the University of Florence (Italy) and aimed to assess the effectiveness of different safety treatments on reducing pedestrian crashes and severity and improving the compatibility between users’ behavior and road infrastructures.
The main purpose of this study was to present a methodology to fit a new APM that could be used to assess the level of risk of a specific road section for road accidents involving pedestrians. This model could be used to direct the attention to specific road sections where the safety level needs to be improved. The methodology proposed is based on an already existing machine learning algorithm: Gradient Boosting, which leverages the approach of evaluating the relationship between pedestrian crashes and the contributing factors. The algorithm, compared with the others used in accident analysis, is extremely powerful in understanding the structure of complex datasets and exploring the potential relationship between different dependent/independent variables. It is also independent of statistical assumptions and immediately usable [20].
The methodology proposed was applied to a dataset derived from the ISTAT (Italian National Institute of Statistics) database. Therefore, the model was calibrated on data related to the Italian road network, traffic, and driving habits. However, the methodology could be replicated and extended to other countries with the use of targeted datasets.
2. Data and Methods
2.1. Data
2.1.1. Data Overview
The ISTAT database provides data related to 874,847 road accidents during a 5-year period (2014–2018) according to the HSM approach [24]. Out of these, 652,367 road accidents happened in an urban area and 101,030 involved at least one pedestrian (on average more than 20,000 per year), thus representing 11.5% of the total number of serious and fatal road accidents.
Here, only this category was taken into account. Between the last year of the analysis (2018) and the first (2014), a 3.80% decrease in road accidents with at least one pedestrian involved was observed.
The dataset was analyzed in terms of gender, age, and road environment characteristics. The results showed that male drivers represent about 75% of the drivers involved. On the other hand, more female pedestrians obtained injured than males. The age class range with the highest number of pedestrians injured and killed is 65+, probably due to the pedestrians’ fragility.
The road characteristics were grouped by road type, road section type, signs type, road pavement type, and surface condition. Urban roads represent the road type with the highest number of accidents. Within this category, crashes represent about 88% of the total accidents. The most common type of road section with a high rate of pedestrian accidents is the straightaway (about 63% of the total), where vehicles pass by at a high speed, followed by roads including crossings (14% of the total). Concerning the location of the road accidents, the presence of both vertical and horizontal signs is prevalent, and the vast majority of the accidents occurred on paved roads (as urban roads in urban areas are usually paved in Italy) on conditions of dry or wet surface (82%). These data can be interpreted as the result of reduced pedestrians’ presence in cases of adverse weather conditions, and this should be considered in light of the overall mild climate of Italy.
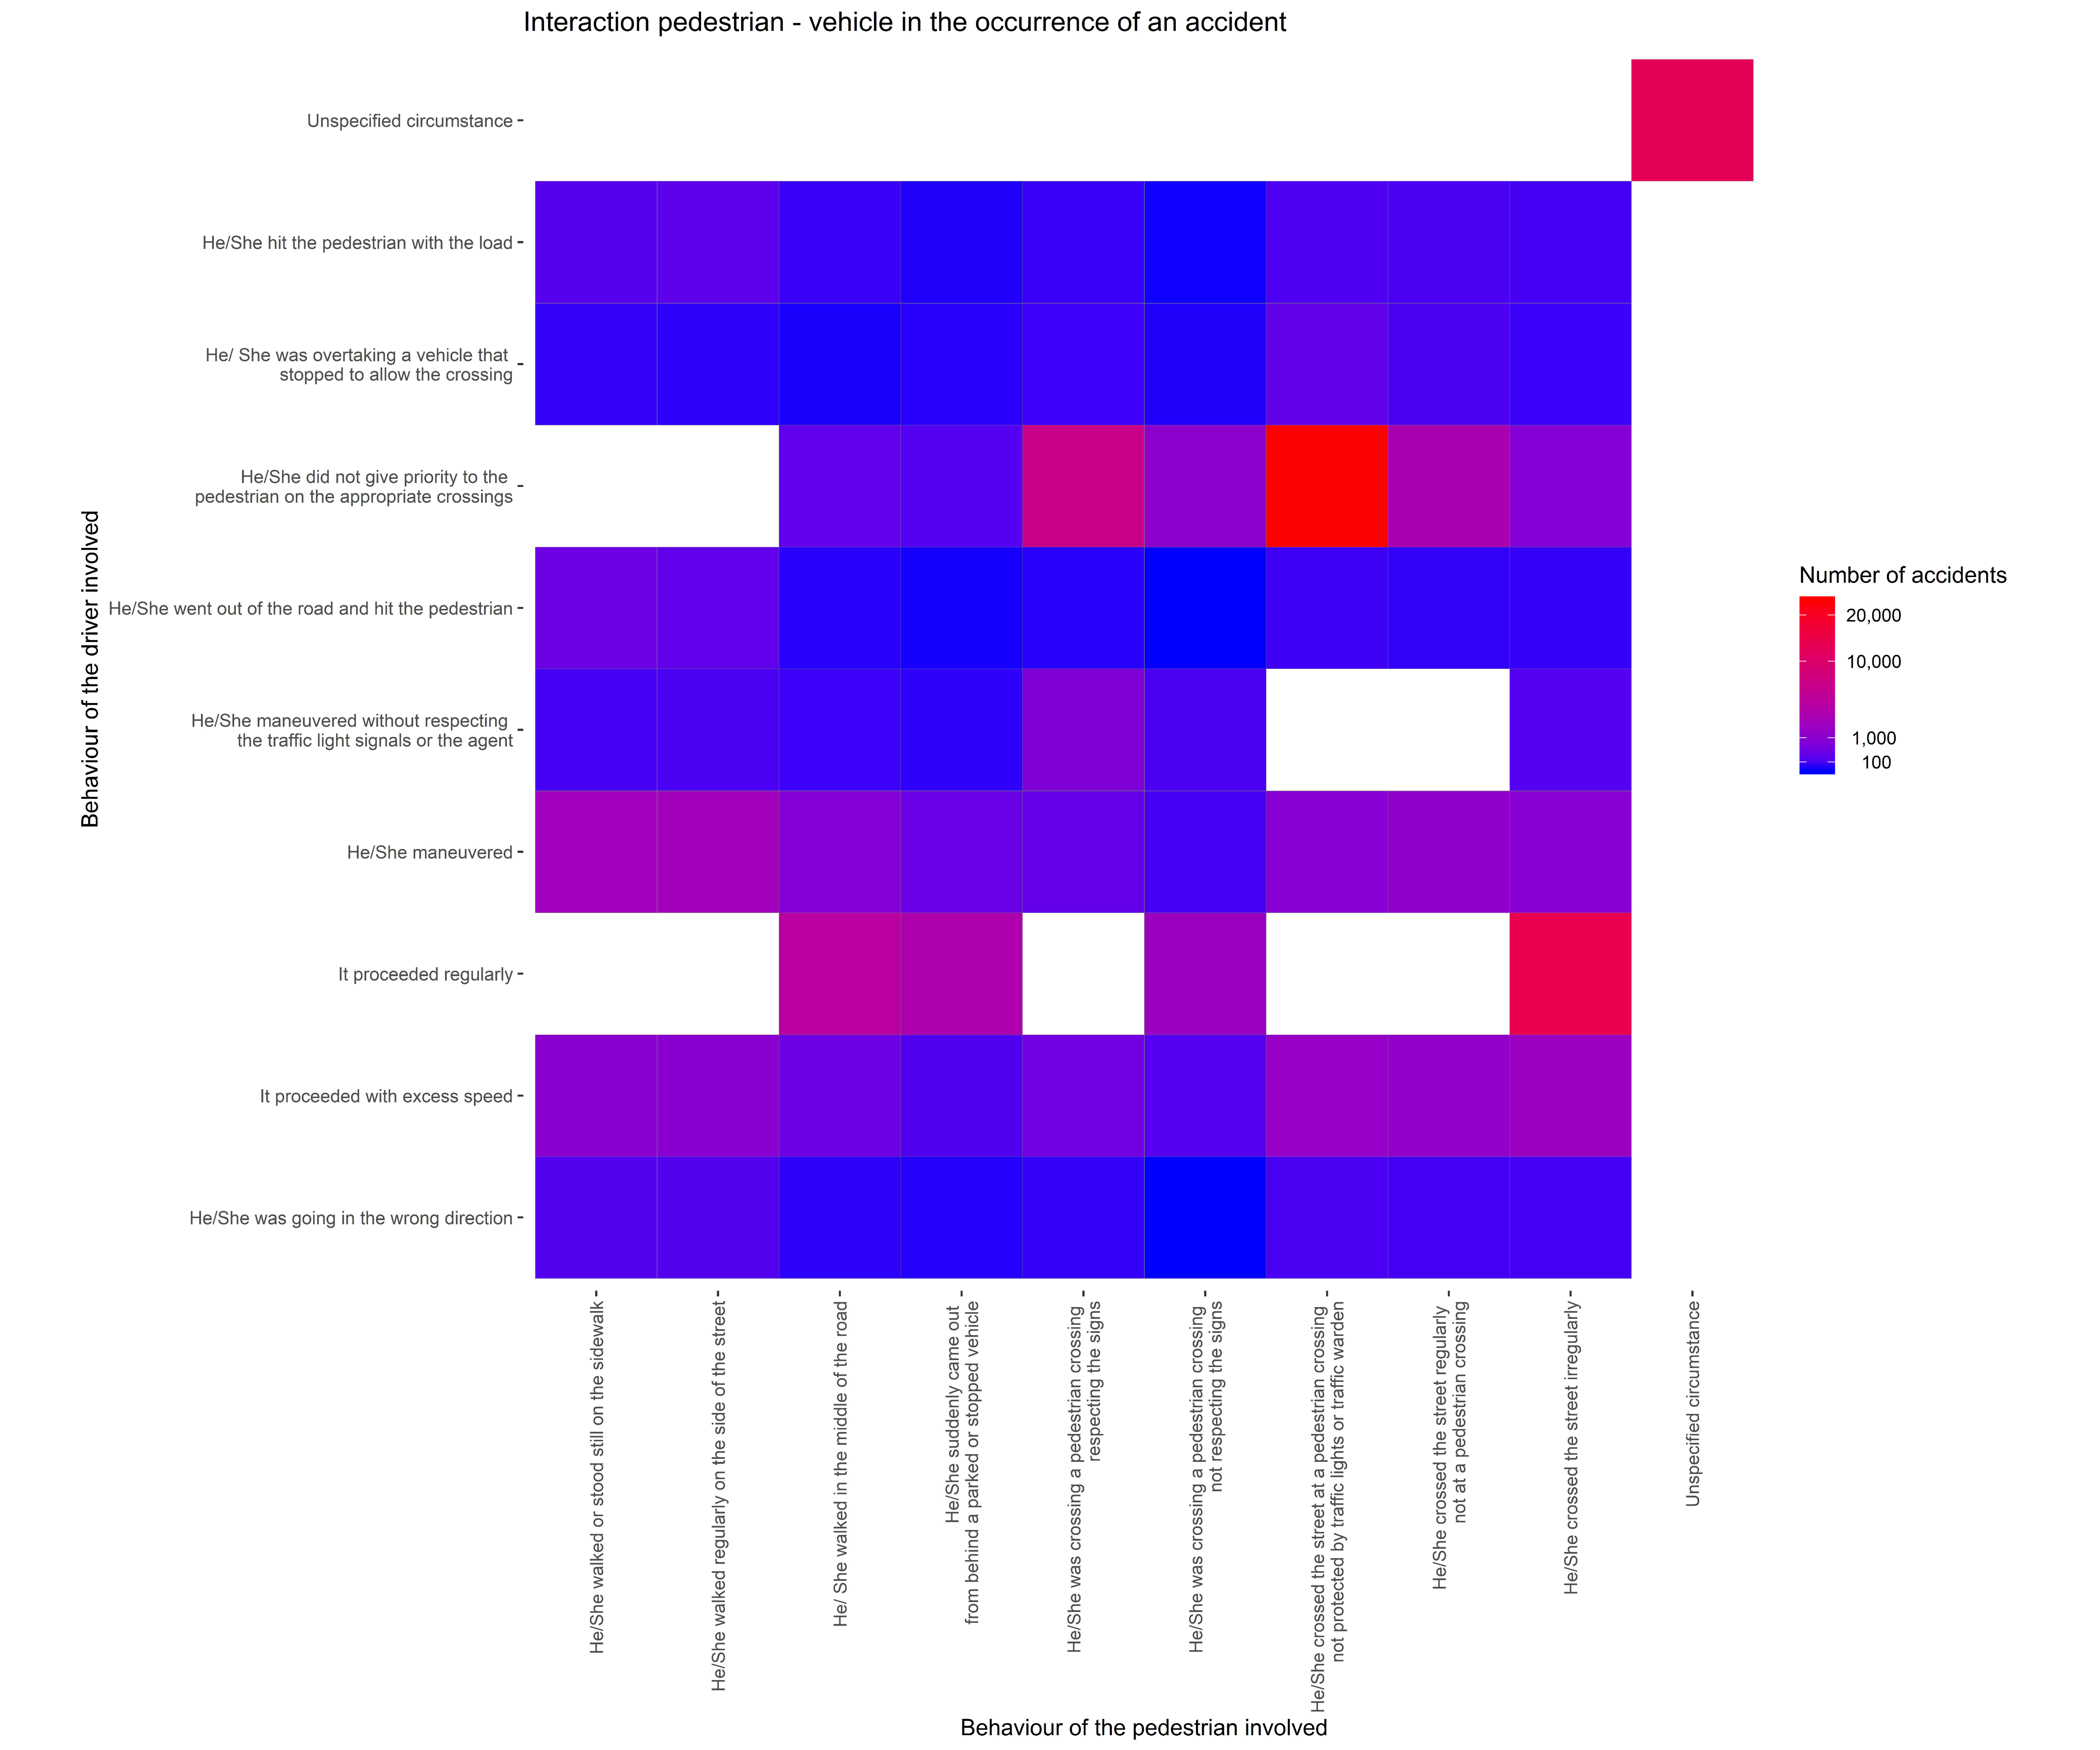
From the ISTAT dataset, it is also possible to retrieve the kind of accident and the behavior of both the drivers and pedestrians. Figure 1 shows the interaction between driver and pedestrian behavior. The ten most common behaviors for drivers and pedestrians are considered and a ten-by-ten grid is displayed. Each tile represents the interaction between one driver’s and one pedestrian’s behavior. The color of the tile is proportional to the number of accidents for a specific interaction. The closer the color is to red, the higher the number of accidents that occurred is.

Figure 1.
Number of accidents for each pedestrian–driver interaction.
The top five driver–pedestrian interactions for several accidents are shown in Table 1.

Table 1.
Top five driver–pedestrian interactions.
It is worrying to note that 29.3% of the road accidents with at least one pedestrian involved occurred when the pedestrians crossed the street at a pedestrian crossing without the protection of traffic lights or a traffic warden. It is of the utmost importance to outline this because the type of crossing (the so-called “zebra crossing”) where the accidents happen is the default crossing type in Italy. Additionally, the pedestrian crossing is the location where the pedestrian should be protected the most.
Table 2 summarizes the main findings of the data analysis of road accidents with at least one pedestrian involved.
Table 2.
List of most frequently occurring data.
Given these findings, it is likely that speeding represents a key factor in causing accidents, although the relationship between speed and crashes remains one of the most debated topics in traffic safety [25,26,27,28,29,30,31].
2.1.2. Data Manipulation
Starting from the ISTAT dataset [32], the location of the road accidents was extracted and only the accidents in which at least one pedestrian was involved were considered.
To fit the Gradient Boosting algorithm, time-consuming data preparation was performed because the ISTAT dataset includes the following different types of information about accident locations:
- Full address (e.g., street name and number of intersections);
- Incomplete address (e.g., street name without street number);
- Proximity to a point of interest (e.g., in front of a shop/church/school/cinema/supermarket, etc.);
- Proximity to a traffic light or light pole (e.g., distance from a traffic light/light pole #);
- No information about the location.
Using Google API [33], the addresses of the various accidents were localized to add the corresponding latitude and longitude coordinates to each observation. From the original dataset, many of the accidents’ locations could not be geo-localized due to a poor description made by the officer; therefore, only accidents included in the first three points of the above bullet point were considered.
For this reason, the count of accidents that occurred in each location may not describe all the accidents that occurred in the location analyzed.
Among all the addresses available, a sample of 180 locations was selected.
The 180 road sections were classified by visual inspection using the satellite view and the “Street View” tool of Google Maps.
The information collected concerned the following:
- Section type (intersection or not);
- Presence of a traffic light (yes or no);
- Presence of a road bump (yes or no);
- Presence of a pedestrian crossing (yes or no);
- Presence of parking lots (yes or no);
- If the road is a one-way road (yes or no);
- Total number of lanes;
- Proximity to a bus stop (yes or no).
It is worth noting that the dataset shows some issues, which should be considered when inspecting the modelling results, including the following:
- The count of accidents per road section might not be the total number of accidents that occurred in the location analyzed due to the presence of poor address descriptions in the ISAT database. Consequently, more than 60% of the addresses related to pedestrian accidents could not be accurately localized;
- The characterization of the road stretches was performed in December 2020 and cannot consider any previous configuration. For example, bus stops could have been in different locations in the period of data collection.
2.2. Methodology
2.2.1. The CatBoost Algorithm
Gradient boosting is a decision-tree based algorithm that was developed in 1990 by Robert Schapire [34] to obtain a strong learner as a combination of weak learners in an iterative way. Gradient boosting belongs to a family of powerful machine-learning techniques that have shown considerable success in a wide range of practical applications in terms of a non-parametric regression or classification model from the data [35].
Here, we adopted an open-sourced algorithm named CatBoost, which was developed by Yandex [36] within the Gradient Boosting algorithm family.
CatBoost’s name comes from the two words Category and Boosting. Specifically, CatBoost was selected because of its proficiency in working with data containing categorical variables [37,38], such as those contained in the ISTAT dataset. CatBoost aims to reduce the prediction shift that occurs during training by dividing training and test instances to obtain the solution [37,39].
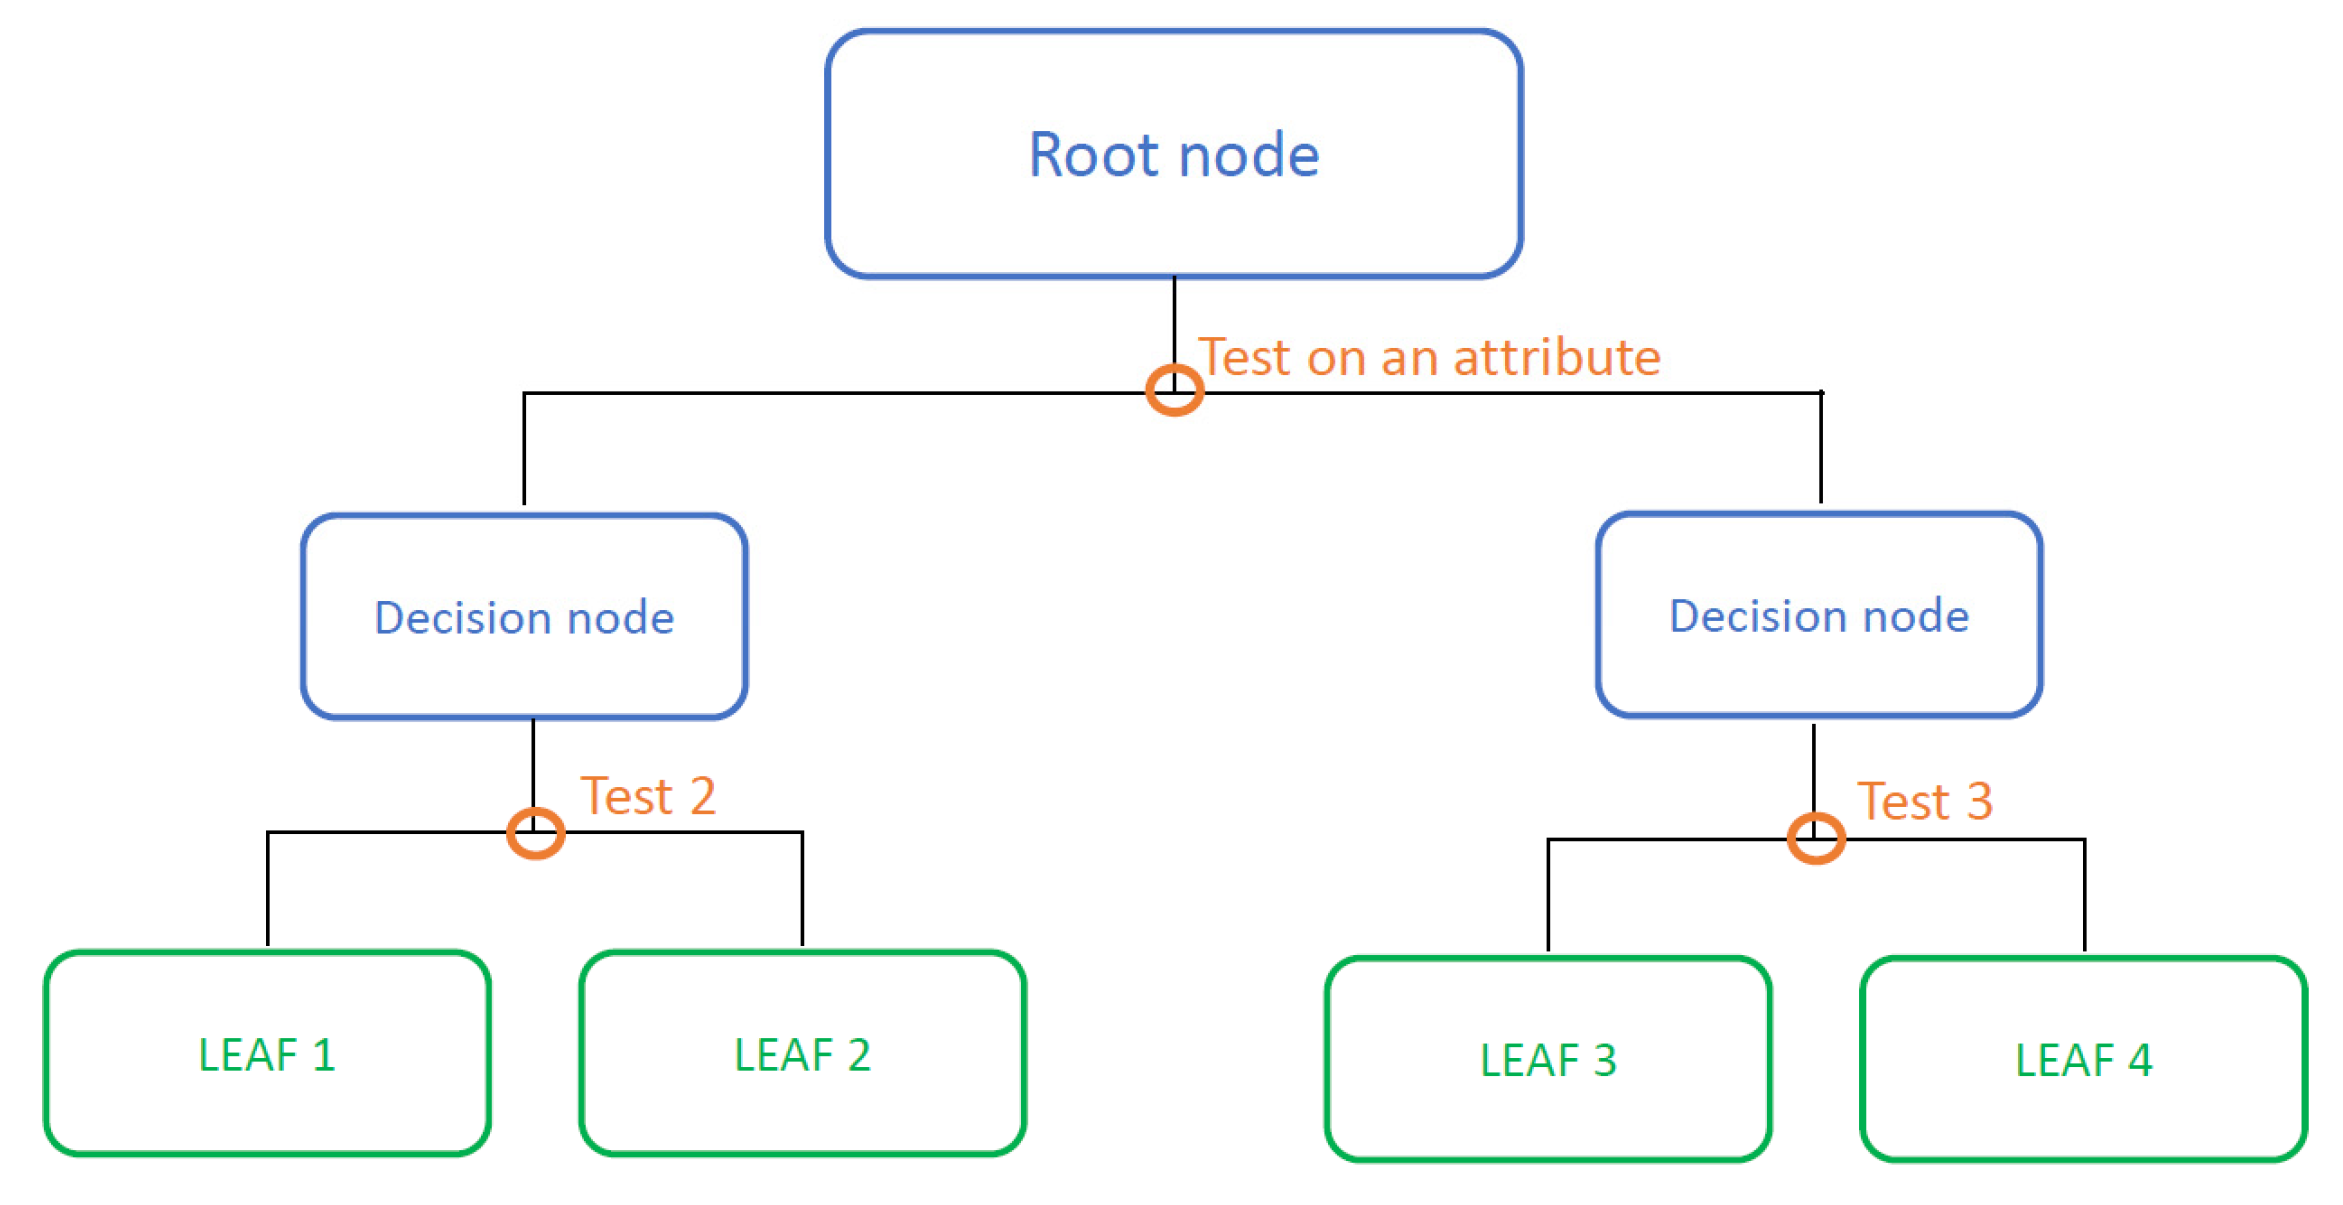
The ith model of the mth iteration is trained on the first instances of the permutation and it is used to estimate the gradient of the (i + 1)th instance for the (m + 1)th boosting iteration. In order to be independent, the process starts with the use of s-different random permutations. The response variable is predicted via a recursive partitioning of the dataset (root node of the tree). After the first partition of the input space into sub-regions, the splitting continues. Each time the sub-regions are split, a decision node (or internal node) is created in the tree. When a sub-region is not further partitioned, it represents a final node of the tree (commonly called the leaf of the tree). A response variable value or a function corresponds to each leaf. In this application, only decision trees with constant values at the final nodes were used. An example of a “binary and symmetrical” decision tree of depth 2 is shown in Figure 2.
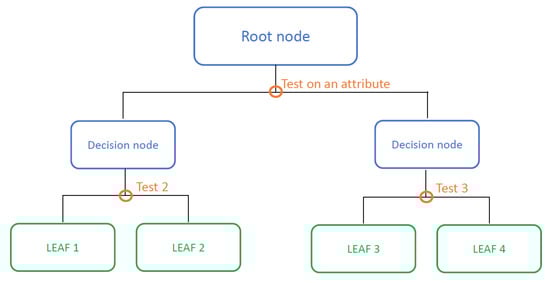
Figure 2.
Representation of a general binary decision tree.
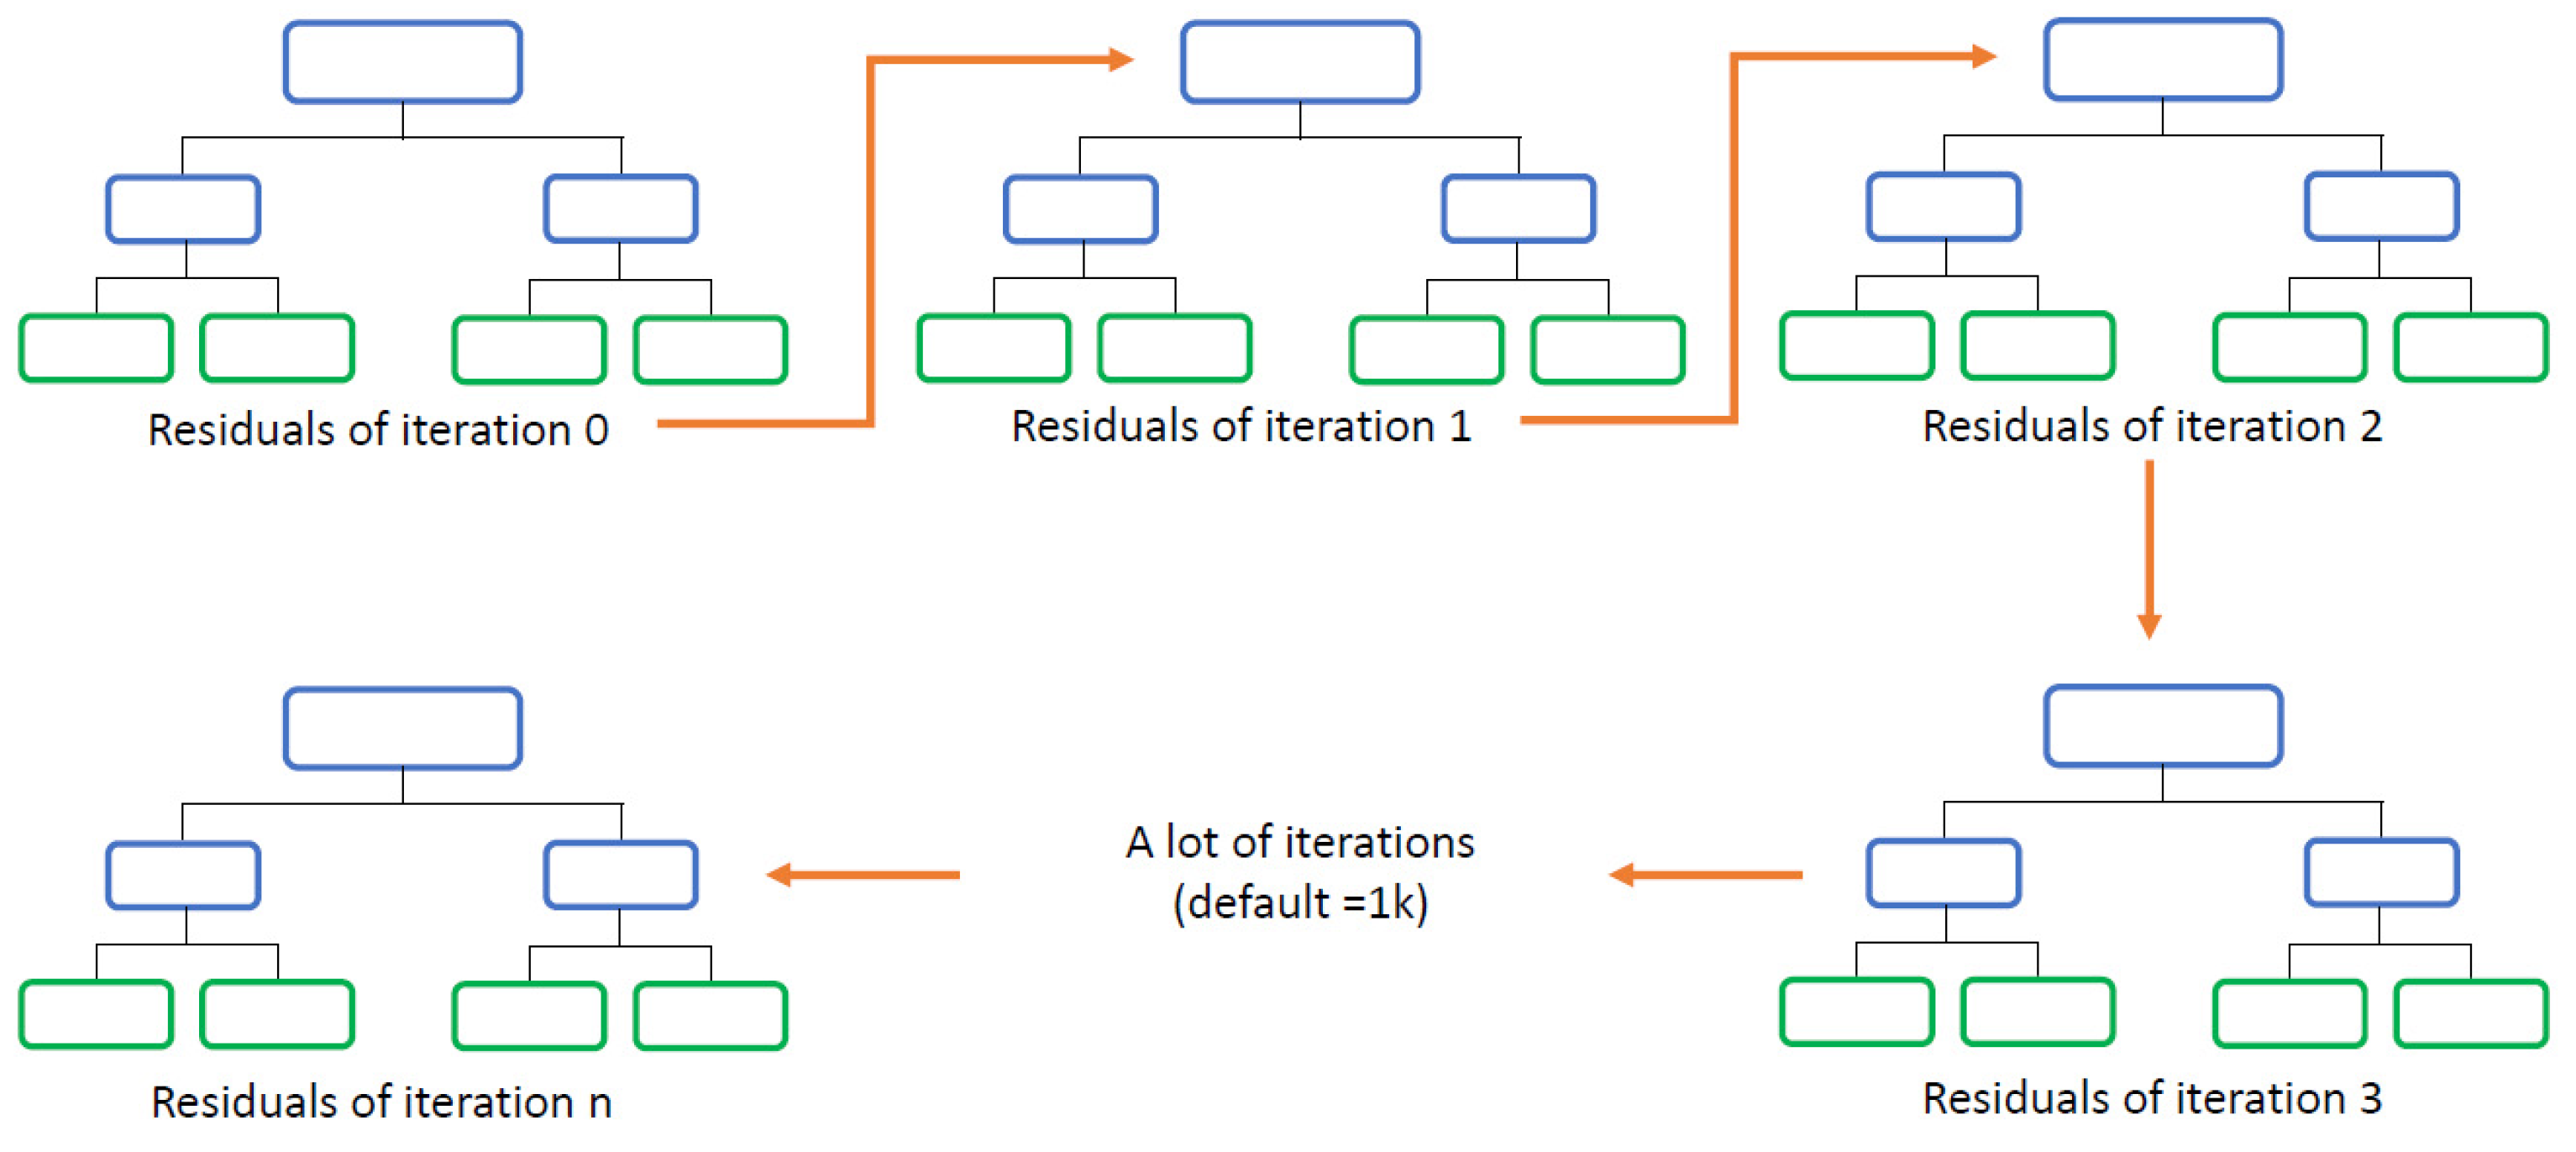
A weak learner has a predictive power just slightly better than chance. Decision trees can be considered weak learners and are widely used in the field of computer science. For classification tasks, the response variable can be interpreted as the probability of belonging to a certain class. To overcome this weakness, in gradient boosting, multiple decisions trees are fitted in series. After the first tree is fitted, the residuals between the target variables and the predicted values are computed and a new tree is fitted using the residuals as a target. This procedure continues until the stopping criterion is met. The stopping criterion used in this research was the number of trees to be fitted (1000). A visual representation of the process is shown in Figure 3.
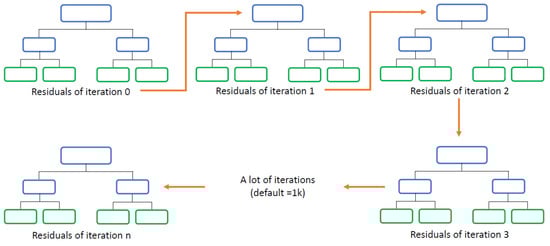
Figure 3.
Series of decision trees.
In CatBoost, categorical variables are automatically substituted by a numeric feature that assigns a “default” value to each category (without any data pre-processing). In order to avoid over-fitting the training data, these values would ideally need to be computed using a different dataset. The procedure proposed in the CatBoost model for each permutation is similar to the one followed for building the models. Therefore, for each random permutation, the information of instances < i is used to compute the value assigned at step i. Then, after several permutations, the process allows the final average value to be obtained.
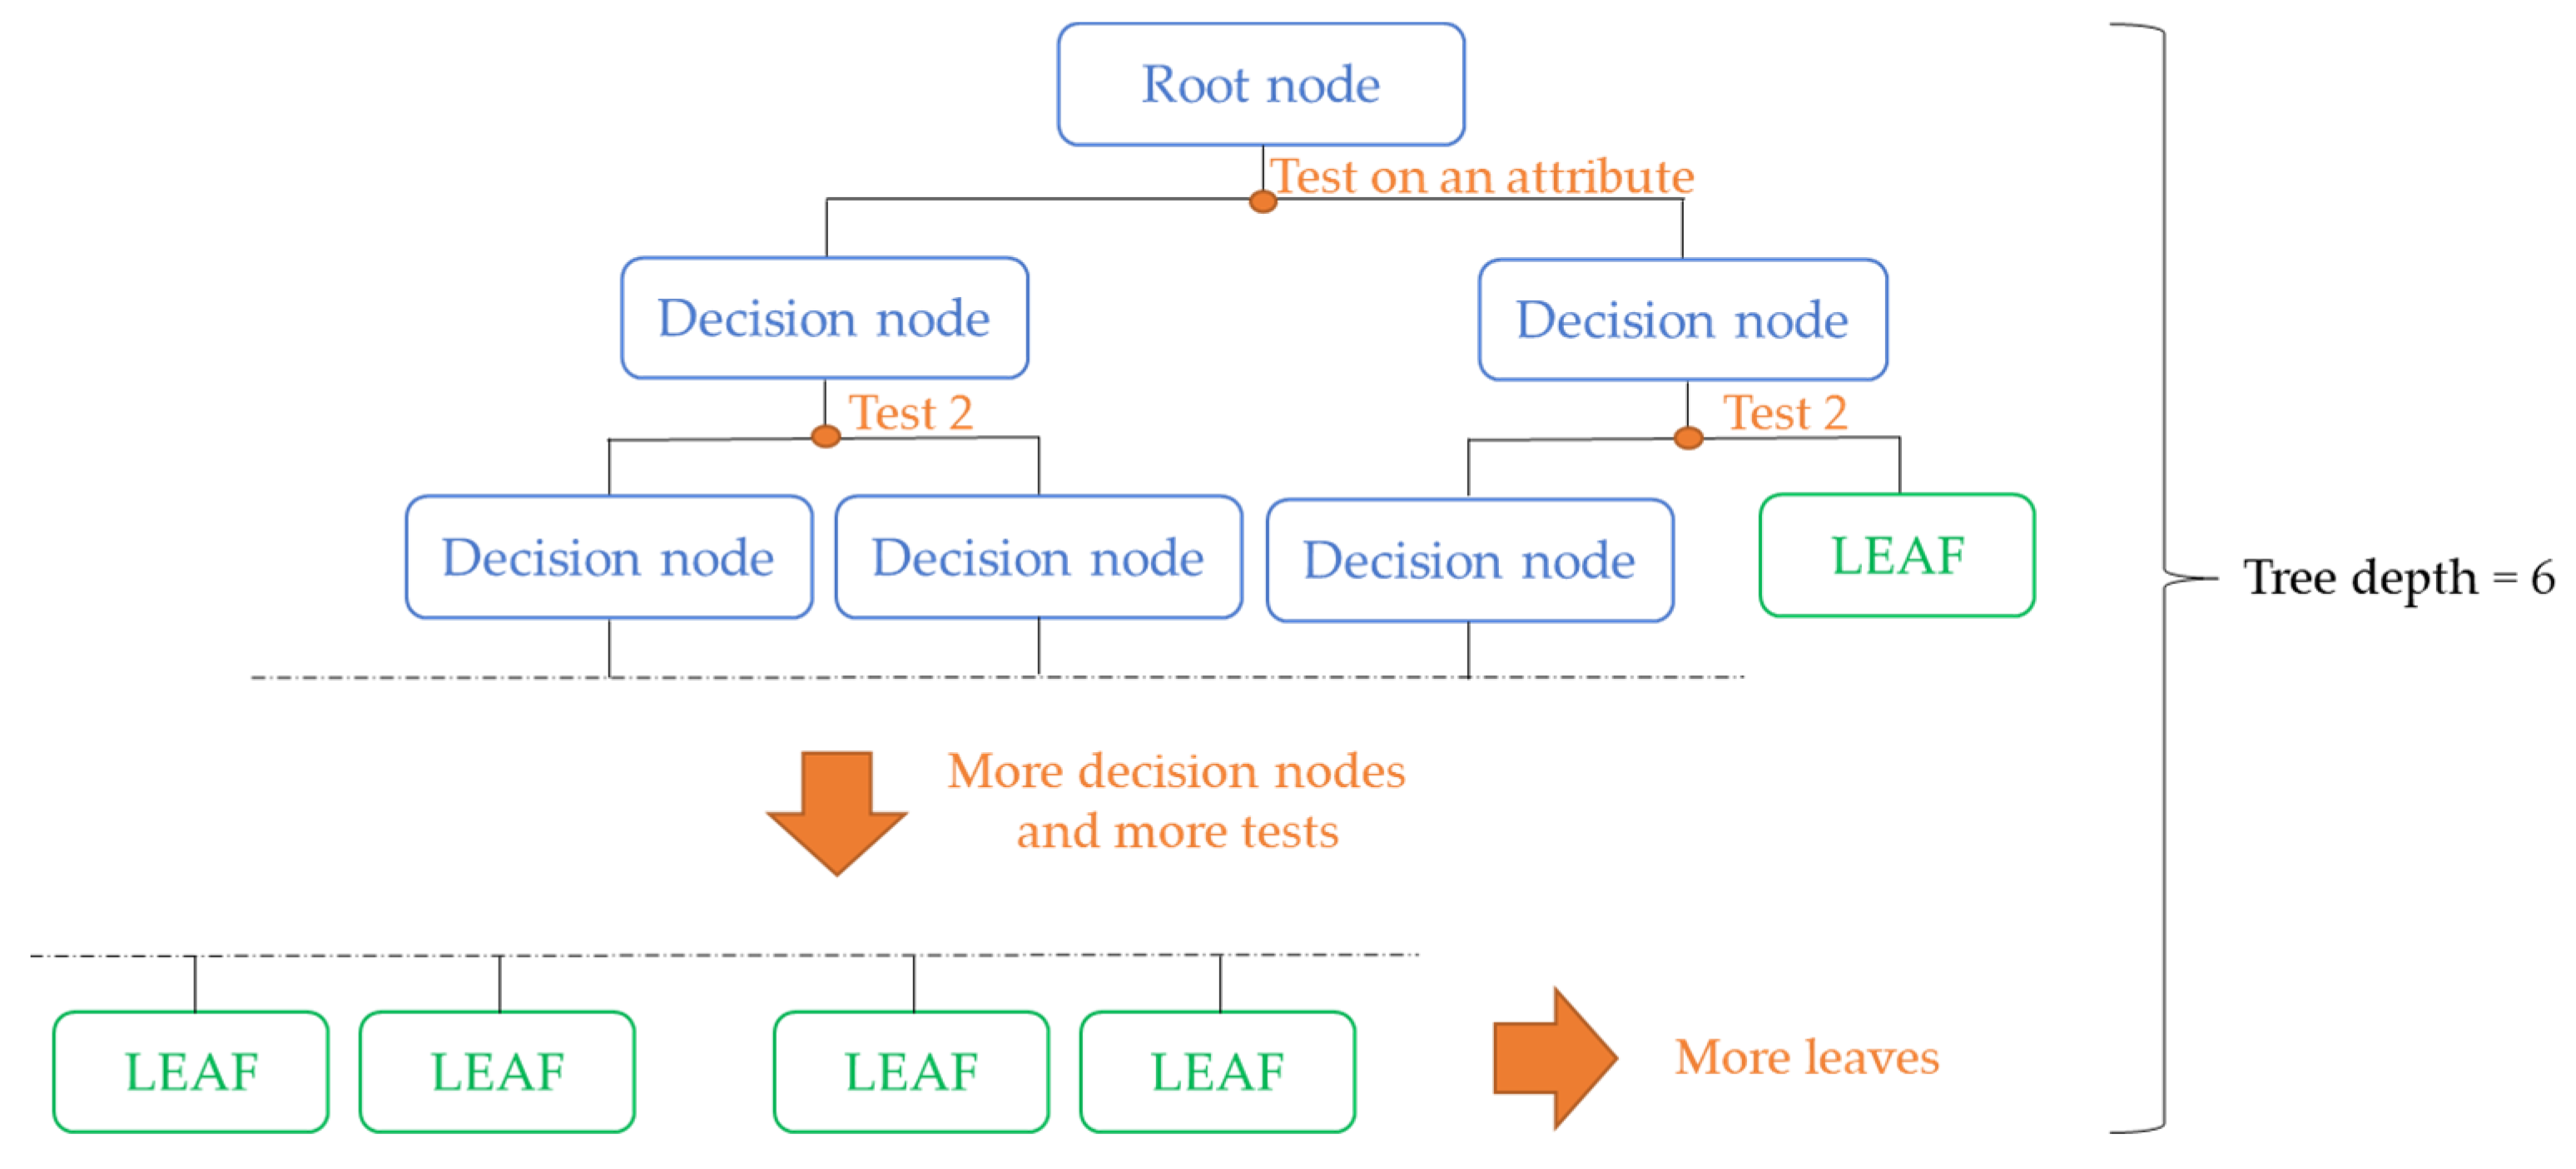
Some characteristics of the model were usually adjusted by the modeler, for example, the number of learning trees, the depth of each tree, and the number of samples in each leaf. These take the name of hyper-parameters. The tuning of the hyper-parameters strongly influences the performance of the model, and it is essential to guarantee an optimal fit. The tuning of the hyper-parameters can be performed manually by the modeler through a grid search or using an algorithm that performs a random search. In this research, the manual tuning of three hyper-parameters was performed on the learning rate, the tree depth, and the number of trees. The selected learning rate is 0.01, the tree depth is 6, and the number of trees is 1000. This value of learning rate reduces the overfitting of the training data while the selected values for the tree depth and the number of trees allow for the high complexity of the model. A schematic representation of a decision tree with depth 6 is shown in Figure 4.
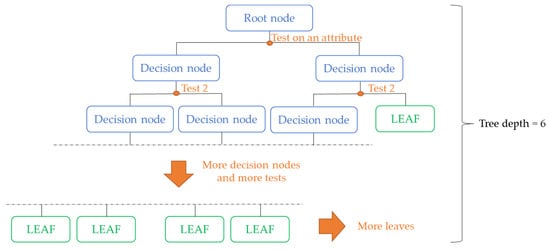
Figure 4.
Schematic representation of decision tree of depth 6.
Usually, the model is fitted on a subset of data (training sample) and tested on another one (test sample). The train–test split is performed randomly, as previously described, and the test set is about 20% of the total database.
To ensure the reliability of the model, the cross-validation process was used. In five-fold cross-validation, the dataset was split into 5 subsets and at each iteration, one of the five folds was used as a test sample and the other four as a training sample.
For each iteration, the metrics recall, precision, and accuracy were computed according to Equations (1)–(3), respectively.
Recall or sensitivity is defined as the ratio between true positives and the number of real positive cases in the data. Precision is the ratio between true positives and the total number of cases predicted to be positive, while accuracy is the percentage of observations predicted correctly, corresponding to the ratio between the sum of true positives and true negatives and the sum of false positives and false negatives. When the metrics were similar, the model was reliable. A model that works perfectly has precision, sensitivity, and accuracy equal to 1.
Once a model has been fitted, the importance of each explanatory variable can be extracted to determine the impact on the prediction.
2.2.2. Variables Used
The 180 locations identified were grouped into the following three risk classes:
- 60 observations of low risk (fewer than 5 accidents with no more than one fatal accident with pedestrians involved between 2014 and 2018);
- 95 observations of medium risk (between 5 and 9 accidents with no more than two fatal accidents with pedestrians involved between 2014 and 2018);
- 25 observations of high risk (more than 10 accidents without limitation for fatal accidents with pedestrians involved between 2014 and 2018).
The three classes were defined by the authors according to the classification procedure described in [40] concerning the accident rate.
The three risk classes represent the output of the Gradient Boosting predictive model (dependent variable).
Each location (or road section) is characterized by thirteen parameters, twelve of which were used as independent variables during the model fit and the last one was used as a target variable that is the output of the model (i.e., the level of risk).
The thirteen variables, their role (independent or target variable), and their type (categorical or numerical) are summarized in Table 3.
Table 3.
List of variables used on the model: Role and type.
None of the 180 sections had a road bump in its proximity and, therefore, in the dataset, there was no variability for this independent variable. For this reason, the use of this variable was irrelevant in the model.
However, the variable was kept anyway for propaedeutic purposes because road bumps represent one of the most effective countermeasures to minimize the risk of collision in a pedestrian crossing.
3. Results and Discussion
The results obtained on the test set in the five-fold iterations are presented in Table 4 in terms of recall (Equation (1)) and precision (Equation (2)) for the low-, medium-, and high-risk classes. In the same table, the model accuracy (Equation (3)) is displayed for the five-fold iterations.
Table 4.
Results of the 5-fold iterations.
The average value, the minimum, and the maximum recall and precision (per class), and the accuracy among the five iterations are shown in Table 5.
Table 5.
Average, minimum, and maximum value of recall, precision, and accuracy.
Figure 5 can help us better interpret the results: The observations are labelled in three groups of risk (low, medium, and high) and can be predicted in one of these three classes. When this happens, the observation falls in one of the three green squares representing the observations of low risk predicted as low risk (OLPL), the observations of medium risk predicted as medium risk (OMPM), and the ones of high risk predicted as high risk (OHPH). On average, the model has an accuracy of 0.7, which means that 70% of the observations are correctly classified and, therefore, fall in the three green squares of Figure 5.
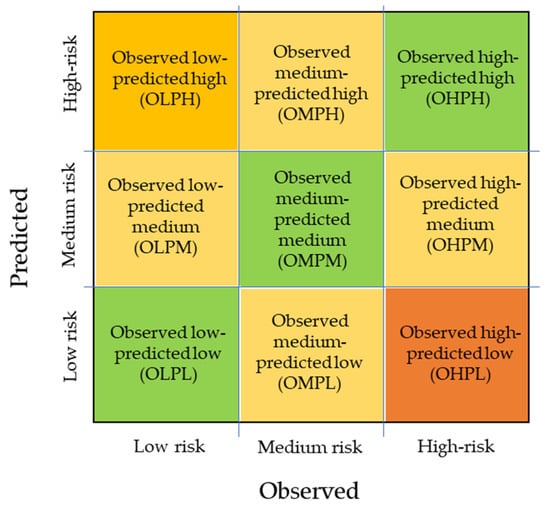
Figure 5.
Representation of possible outcomes of the fitted model.
As shown in Table 5, the low standard deviation (0.04) indicates the good stability of the model across iterations.
The remaining 30% of observations fall in the other squares of Figure 5, for the observations of low risk misclassified by an over-estimation of the risk occurred (OLPM and OLPH), while, for the high-risk observation, an underestimation occurred (OHPL and OHPM). For the medium risk observation, both underestimation and overestimation are possible (OMPL, OMPH). The OLPH and the OHPL misclassifications are the most concerning ones and special attention was dedicated to interpreting the results. Considering the context of pedestrian safety, the OHPL error could put pedestrians at risk if this model was used to assess the risk level of a road section.
Checking the recall and precision average values, a very high precision value (0.98) for the high-risk class can be observed, while the recall value for the same class is lower (0.71). Considering the definition of recall (Equation (1)) and precision (Equation (2)), this means that the occurrence of high-risk class predictions is very low for observations of low and medium risk classes (very low rate of HLPH and HMPH). However, only 71% of the high-risk class observations are correctly predicted (29% of false negatives) showing a tendency to underestimate the risk level. Concerning the low-risk class observations, 88% of the low-risk observations are correctly predicted (12% of false negatives), showing a tendency to overestimate the risk level. These two tendencies are confirmed by the relatively low precision value for the medium-risk class: Only 61% of the observations predicted as to be in the medium-risk class are correctly classified, which also confirms that the observations misclassified are only rarely severely misclassified (OLPH and OHPL). These results might be due to the heterogeneous distributions of observations on the dataset (60 observations, low risk; 95, medium risk; and 25, high-risk class).
From the fit model, it is possible to retrieve information related to the importance of the independent variables. In Figure 6, the normalized importance (the importance of all the variables summed up to 100) of the independent variables used in the models is displayed.
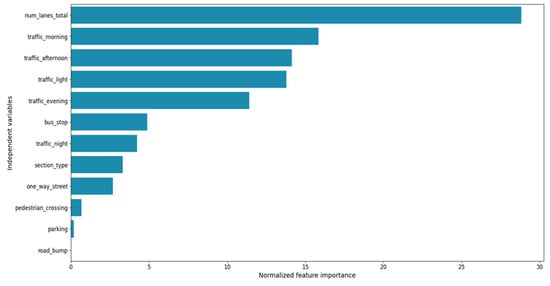
Figure 6.
Normalized importance for the independent variables of the model.
The variable with the highest importance (importance = 29%) is the total number of lanes in the section, showing a strong correlation between the complexity of a road section and the risk level. This result confirms the finding of the Abojaradeh studies conducted in Jordan on pedestrian bridges [41], where it is shown that one of the main factors affecting pedestrian safety was the width of the crossway.
According to the results described in the international literature [42,43], the other most important variables are those related to the traffic level during the morning, the afternoon, and the evening and the presence of a traffic light (importance equals 16%, 14%, 11%, and 14%, respectively).
The findings previously mentioned also showed that a 5% decrease in traffic volume during peak hours, measured in terms of Passenger Car Units (PCUs), will result in an 11% decrease in total pedestrian accidents [43]. In a recent USA study, bus stop presence has an importance value near 5%, confirming that there is a significant spatio-statistical correlation between a bus stop location and pedestrian-involved crashes [44].
The main findings of our research showed that the variables mentioned (the number of lanes, traffic conditions, traffic lights, and bus stops) together already account for 89% of the total importance. Each of the other variables has an importance value of less than 5%.
As said above, Figure 6 shows that the variable related to the presence of road bumps has an importance value equal to 0, but this value is due to the fact that all of the locations in the ISTAT database do not have road bumps to slow down the vehicles’ speed.
From these results, it seems that the complexity of a section and its traffic is the most important component in determining the accident risk level of a section for pedestrians. To reduce the risk of road accidents involving pedestrians, particular attention should be paid to the number of lanes in a road section and the traffic level of the section. Both factors should be taken into consideration in the design phase of the road section. In the case of an existing road section, changing the number of lanes or modifying its traffic level requires a big intervention on the entire traffic network and the effect of the operation on other road sections should be considered.
The results obtained in the modelling phase can be considered satisfactory given the relatively small dataset (180 observations) and the limitations previously mentioned. However, multiple improvements could be implemented to achieve higher precision and recall scores and to ensure the higher reliability and robustness of the model. First, the number of data points in the dataset should be increased. This will allow a grid search on k-folds cross-validation and then a test on a small subset of data to be performed. Moreover, algorithms as gradient boosts perform better on bigger sample sizes.
To improve the methodology used and the reliability of the model proposed, a higher number of variables should be explored, such as the pedestrians’ and drivers’ behavior, the population density of the neighborhood, or the proximity to a point of interest (e.g., school, church, supermarkets, cinema, etc.). To increase the number of variables within the model, improvements should be made to the dataset according to the information evaluated in recent research [45] in which the infrastructural environment correlated with cycling injury risk in Britain.
Moreover, when counting the number of accidents for each address, a grouping of addresses close to each other should be created. For example, locations can be grouped considering a ten-meter segment on straight stretches of road. This operation is more complex when considering intersections or roundabouts. For this reason, no grouping was performed in this modelling phase, but such a solution should be taken into consideration in future research.
It is necessary to outline the quality of the primary data is of the utmost importance for this application and until some improvements are achieved regarding the location of accidents, the validity of the model itself cannot be granted.
Moreover, it should also be clear that events such as road constructions or any other event that temporarily/permanently modifies the configuration or the traffic level of a stretch of road are hard to include in the model, despite the fact these events are likely to have a strong impact on the number of accidents.
4. Conclusions
This study described an accident prediction model developed to provide the Italian RAs with a tool that allows the potential pedestrian safety level of road sections to be assessed, the sites with the largest potential safety improvements to be identified, and the identification of the best countermeasure to be applied to increase pedestrian safety to be supported.
The model was defined as a first step to reach the goals of the SWALK research project. The accident prediction model was developed using a dataset (ISTAT dataset) including information about fatal and injurious crashes that occurred in Italy in a 5-year period (2014–2018). The model allowed us to estimate and forecast the risk level of a road section with certain characteristics. Therefore, the tool can be used, coupled with other more expensive and time-consuming methodologies, to investigate the risk level of multiple scenarios.
The machine-learning approach using gradient boosting seems to be an appropriate tool to fit classification models for characterizing the risk level of a road section. Its flexibility allows non-linear relationships to be captured, which would be much more difficult to grasp with a classical statistical model. The goodness of the model strongly depends on the quality of the data used as a training set. Here, the quality of the data used was sufficient but less than ideal due to the lack of accurate traffic data and the issues previously presented related to the aggregation.
It is important to highlight that the road bumps are not present in the sections considered within the ISTAT database despite it being one of the most common measures along Italian urban roads. More appropriate analysis should be conducted to include road bumps within the factors affecting the occurrence and severity of pedestrian crashes.
In conclusion, the results show the good potentiality of the model to describe the used dataset (about 70%). The tool developed could identify potential high-risk level road sections for the three categories indicated (low, medium, and high-risk sections). The model proposed thus represents a solid and reliable tool for practitioners to perform accident analysis with pedestrian involvement.
Author Contributions
Conceptualization, M.M., V.B. and G.M.; Data curation, G.M.; Funding acquisition, M.M.; Methodology, M.M. and G.M.; Project administration, M.M. and R.A.; Supervision, R.A.; Writing – original draft, M.M., V.B. and I.P.; Writing – review & editing, R.A. and I.P. All authors have read and agreed to the published version of the manuscript.
Funding
The SWALK “Safe CrossWALKs in urban areas: assessment of countermeasures to improve pedestrian safety” research project was funded by Università degli Studi di Firenze, Finanziamento di progetti competitivi per Ricercatori a Tempo Determinato (RTD) dell’Università di Firenze—Bando 2020–2021.
Institutional Review Board Statement
Not applicable.
Informed Consent Statement
Not applicable.
Data Availability Statement
The datasets used in this study are provided by ISTAT under the Agreement “File di metadati per la ricercar—MFR (Microdata for Research)”. The data are not publicly available due to a Non-Disclosure Agreement.
Conflicts of Interest
The authors declare no conflict of interest.
References
- WHO—World Health Organization. Global Status Report on Road Safety; World Health Organization: Geneva, Switzerland, 2018. [Google Scholar]
- Khan, M.A.B.; Grivna, M.; Nauman, J.; Soteriades, E.S.; Cevik, A.A.; Hashim, M.J.; Govender, R.; Al Azeezi, S.R. Global Incidence and Mortality Patterns of Pedestrian Road Traffic Injuries by Sociodemographic Index, with Forecasting: Findings from the Global Burden of Diseases, Injuries, and Risk Factors 2017 Study. Int. J. Environ. Res. Public Health 2020, 17, 2135. [Google Scholar] [CrossRef] [Green Version]
- European Commission. Facts and figures pedestrians. In European Road Safety Observatory; Directorate General for Transport, European Commission: Brussels, Belgium, 2020. [Google Scholar]
- ACI-ISTAT. Incidenti stradali in Italia. In Report of ACI-ISTAT—Anno 2019; ACI: Roma, Italy, 2020. (In Italian) [Google Scholar]
- WHO—World Health Organization. Global Status Report on Road Safety: Supporting a Decade of Action; World Health Organization: Geneva, Switzerland, 2013. [Google Scholar]
- Kraidi, R.; Evdorides, H. Pedestrian safety models for urban environments with high roadside activities. Saf. Sci. 2020, 130, 104847. [Google Scholar] [CrossRef]
- Yannis, G.; Dragomanovits, A.; Laiou, A.; Richter, T.; Ruhl, S.; La Torre, F.; Domenichini, L.; Graham, D.; Karathodorou, N.; Li, H. Use of Accident Prediction Models in Road Safety Management—An International Inquiry. Transp. Res. Procedia 2016, 14, 4257–4266. [Google Scholar] [CrossRef] [Green Version]
- La Torre, F.; Domenichini, L.; Meocci, M.; Graham, D.; Karathodorou, N.; Richter, T.; Ruhl, S.; Yannis, G.; Dragomanovits, A.; Laiou, A. Development of a transnational accident prediction model. Transp. Res. Procedia 2016, 14, 1772–1781. [Google Scholar] [CrossRef] [Green Version]
- Srinivasan, R.; Bauer, K. Safety Performance Function Development Guide: Developing Jurisdiction-Specific SPFs, Final Report; Report No. FSWA-SA-14-005; Federal Highway Administration: Washington, DC, USA, 2013.
- AASHTO. Highway Safety Manual, 1st ed.; American Association of State and Highway Transportation Officials: Washington, DC, USA, 2010. [Google Scholar]
- Chakraborty, A.; Mukherjee, D.; Mitra, S. Development of pedestrian crash prediction model for a developing country using artificial neural network. Int. J. Inj. Control Saf. Promot. 2019, 26, 283–293. [Google Scholar] [CrossRef]
- Brüde, U.; Larsson, J. Models for predicting accidents at junctions where pedestrians and cyclists are involved. How well do they fit? Accid. Anal. Prev. 1993, 25, 499–509. [Google Scholar] [CrossRef] [Green Version]
- Lee, C.; Abdel-Aty, M. Comprehensive analysis of vehicle-pedestrian crashes at intersections in Florida. Accid. Anal. Prev. 2005, 37, 775–786. [Google Scholar] [CrossRef]
- Rankavat, S.; Tiwari, G. Association between Built Environment and Pedestrian Fatal Crash Risk in Delhi, India. Transp. Res. Rec. 2015, 2519, 61–66. [Google Scholar] [CrossRef] [Green Version]
- Eluru, N.; Bhat, C.R.; Hensher, D.A. A mixed generalized ordered response model for examining pedestrian and bicyclist injury severity level in traffic crashes. Accid. Anal. Prev. 2008, 40, 1033–1054. [Google Scholar] [CrossRef] [Green Version]
- Ewing, R.; Dumbaugh, E. The Built Environment and Traffic Safety: A Review of Empirical Evidence. J. Plan. Lit. 2009, 23, 347–367. [Google Scholar] [CrossRef]
- Feng, C. Synthesis of Studies on Speed and Safety. Transp. Res. Rec. 2001, 1779, 86–92. [Google Scholar] [CrossRef]
- Gårder, P.E. The impact of speed and other variables on pedestrian safety in Maine. Accid. Anal. Prev. 2004, 36, 533–542. [Google Scholar] [CrossRef]
- Olszewski, P.; Osinska, B.; Szagała, P.; Włodarek, P. Development of accident prediction models for pedestrian crossings. MATEC Web Conf. 2018, 231, 3002. [Google Scholar] [CrossRef]
- Lu, P.; Zheng, Z.; Ren, Y.; Zhou, X.; Keramati, A.; Tolliver, D.; Huang, Y. A Gradient Boosting Crash Prediction Approach for Highway-Rail Grade Crossing Crash Analysis. J. Adv. Transp. 2020, 2020, 6751728. [Google Scholar] [CrossRef]
- Mohamedshah, Y.M.; Paniati, J.F.; Hobeika, A.G. Truck accident models for interstates and two-lane rural roads. Transp. Res. Rec. J. Transp. Res. Board 1993, 1407, 35–41. [Google Scholar]
- Yan, X.; Radwan, E. Analyses of rear-end crashes based on classification tree models. Traffic Inj. Prev. 2006, 7, 276–282. [Google Scholar] [CrossRef]
- Qin, X.; Han, J. Variable selection issues in tree-based regression models. Transp. Res. Rec. J. Transp. Res. Board 2008, 2061, 30–38. [Google Scholar] [CrossRef] [Green Version]
- American Association of State Highway and Transportation Officials (AASHTO). Highway Safety Manual Supplement; Chapter 18; American Association of State Highway and Transportation Officials: Washington, DC, USA, 2014. [Google Scholar]
- Hauer, E. Speed and safety. Transp. Res. Rec. J. Transp. Res. Board 2009, 2103, 10–17. [Google Scholar] [CrossRef] [Green Version]
- Domenichini, L.; Branzi, V.; Meocci, M. Virtual testing of speed reduction schemes on urban collector roads. Accid. Anal. Prev. 2018, 110, 38–51. [Google Scholar] [CrossRef]
- Branzi, V.; Meocci, M.; Domenichini, L.; La Torre, F. Drivers’ performance in response to engineering treatments at pedestrian crossings. Adv. Transp. Stud. Int. J. 2018, 1, 55–70. [Google Scholar]
- Leaf, W.A.; Preusser, D.F. Literature Review on Vehicle Travel Speeds and Pedestrian Injuries; National Highway Traffic Safety Administration: Washinghtond, DC, USA, 1999.
- Tefft, B.C. Impact Speed and a Pedestrian’s Risk of Severe Injury or Death; AAA Foundation for Traffic Safatey: Washington, DC, USA, 2011. [Google Scholar]
- Ronsen, E.; Stigson, H.; Sander, U. Literature review of pedestrian fatality risk as a function of car impact speed. Accid. Anal. Prev. 2011, 43, 25–33. [Google Scholar] [CrossRef] [PubMed]
- Kroyer, H.R.G. Is 30 km/h a “safe” speed? Injury severity of pedestrian struck by a vehicle and the relation to travel speed and age. IATSS Res. 2015, 39, 42–50. [Google Scholar] [CrossRef] [Green Version]
- ISTAT. File di Microdati per la Ricerca—MFR, 2014–2018; Istat—Istituto Nazionale di Statistica: Roma, Italy, 2020. [Google Scholar]
- Google Cloud APIs. Available online: https://cloud.google.com/apis (accessed on 9 September 2021).
- Shapire, R.E. The strength of weak learnability. Mach. Learn. 1990, 5, 197–227. [Google Scholar] [CrossRef] [Green Version]
- Natekin, A.; Knoll, A. Gradient boosting machines, a tutorial. Front. Neurorobot. 2013, 7, 21. [Google Scholar] [CrossRef] [Green Version]
- Yandex, catBoost Fit. Available online: https://catboost.ai/docs/concepts/python-reference_catboostclassifier_fit.html (accessed on 8 October 2021).
- Prokhorenkova, L.; Gusev, G.; Vorobev, A.; Dorogush, A.V.; Gulin, A. Catboost: Unbiased boosting with categorical features. In Advances in Neural Information Processing Systems; Bengio, S., Wallach, H., Larochelle, H., Grauman, K., Cesa-Bianchi, N., Garnett, R., Eds.; Curran Associates Inc.: Montreal, QC, Canada, 2018; Volume 31, pp. 6638–6648. [Google Scholar]
- Hancock, J.T.; Khoshgoftaar, T.M. CatBoost for big data: An interdisciplinary review. J. Big Data 2020, 7, 94. [Google Scholar] [CrossRef]
- Bentejac, C.; Csorgo, A.; Martinez-Munoz, G. A comparative analysis of gradient boosting algorithms. Artif. Intell. Rev. 2021, 54, 1937–1967. [Google Scholar] [CrossRef]
- Consiglio Nazionale delle Ricerche, CNR. Criteri per la Classificazione Della Rete Delle Strade Esistenti ai Sensi Dell’art. 13, Comma 4 e 5 del Nuovo Codice Della Strada; CNR: Roma, Italy, 1998. (In Italian)
- Abojaradeh, M. Evaluation of Pedestrian Bridges and Pedestrian Safety in Jordan. Civ. Environ. Res. 2003, 3, 66–78. [Google Scholar]
- Karlaftis, M.G.; Golias, I. Effects of road geometry and traffic volumes on rural roadway accident rates. Accid. Anal. Prev. 2002, 34, 357–365. [Google Scholar] [CrossRef]
- Santhosh, A.; Sam, E.; Bindhu, B.K. Pedestrian Accident Prediction Modelling—A Case Study in Thiruvananthapuram City. In Transportation Research. Lecture Notes in Civil Engineering; Mathew, T., Joshi, G., Velaga, N., Arkatkar, S., Eds.; Springer: Singapore, 2020; Volume 45. [Google Scholar] [CrossRef]
- Ulak, M.B.; Kocatepe, A.; Yazici, A.; Ozguven, E.E.; Kumar, A. A stop safety index to address pedestrian safety around bus stops. Saf. Sci. 2021, 133, 105017. [Google Scholar] [CrossRef]
- Kapousizis, G.; Goodman, A.; Aldred, R. Cycling injury risk in Britain: A case-crossover study of infrastructural and route environment correlates. Accid. Anal. Prev. 2021, 154, 106063. [Google Scholar] [CrossRef]


Publisher’s Note: MDPI stays neutral with regard to jurisdictional claims in published maps and institutional affiliations. |
© 2021 by the authors. Licensee MDPI, Basel, Switzerland. This article is an open access article distributed under the terms and conditions of the Creative Commons Attribution (CC BY) license (https://creativecommons.org/licenses/by/4.0/).