Article

Behavior of Non-Shear-Strengthened UHPC Beams under Flexural Loading: Influence of Reinforcement Depth

Department of Civil Engineering, King Saud University, Riyadh 800-11421, Saudi Arabia
*
Author to whom correspondence should be addressed.
Appl. Sci. 2021, 11(23), 11168; https://doi.org/10.3390/app112311168
Submission received: 9 October 2021 / Revised: 17 November 2021 / Accepted: 19 November 2021 / Published: 25 November 2021
(This article belongs to the Special Issue Recent Advances in Concrete Technologies)

Abstract

:
This study was carried out in order to study the flexural behavior of fiber-reinforced ultra-high-performance concrete (UHPC) containing hybrid microsteel straight fibers and natural fine aggregates under four-point flexural loading. The experimental results revealed that the fiber pullout mechanism had a progressive pullout (collapse) mode. A highly flexural crack developed when the fiber pulling mechanism was explicitly triggered, leading to the failure of most beams. The maximum load in beams reinforced by 1.2, 1.6, and 2.0% exceeded that in beams without longitudinal reinforcement by 56, 73, and 94%, respectively. Further, bar reinforcements at 125, 115, 95, 85, and 75 mm depths led to increases of 56, 55, 73, 96, and 94% in beam load capacity, respectively. In addition, bar reinforcement at 115, 95, 85, and 75 mm depths reduced the beams’ ductility by 40, 23, 35, and 39% compared to those with 125 mm depth. All studied UHPC beams had an uncracked phase that extended to a curvature of about 7.5 × 10⁻⁶ rad, which occurred at about 10 kNm. The use of the design of experiments was exploited in this investigation to develop a prediction model for the ultimate moment capacity of UHPC beams. This prediction model took into account the sectional and material properties of UHPC beams. To carry out this analysis, a database of 25 beams, developed by other investigators, as well as the present authors, was utilized. With a mean prediction-to-test ratio of 0.92, this prediction model had a reasonable performance capacity. In turn, this model was used to generate isoresponsive surface contours that could be used for UHPC beam design.

1. Introduction

1.1. Background

As of today, concrete is one of the principal materials used in construction. Normal concrete, however, has some demerits (i.e., its poor ductility and tensile strength) that make it unsuited for use in advanced infrastructure [1]. The drawbacks of conventional concrete have been largely overcome through the development of steel-fiber-reinforced high-performance concrete (also known as ultra-high-performance concrete (UHPC). In the 1990s, the first class of UHPC (known as reactive powder concrete) emerged [2], and the properties of this concrete have been extensively investigated [3,4,5]. The structural performance of the ductility, bearing, and shear capacities of normal and high-strength concrete beams have been significantly enhanced by the inclusion of steel fibers [6,7,8,9,10]. The introduction of steel fibers in high-strength concrete (FRC) beams also enhanced their deformability, moment capacity, and flexural rigidity [11,12].
At the material level, abundant information is available on the special rank properties of UHPC compared to normal concrete. For instance, the development of cement-hydration indexes and their relationships with the strength characteristics of UHPC were previously studied [13]. There is, however, a gap in the literature regarding the preparation of UHPC mixes that contain ternary hybrids of microsteel fibers of various aspect ratios in the presence of a binary mixture of desert sands at ambient temperatures. These sands are found in the Arabian Peninsula, which is considered the global tank for desert sands. In the literature, a single type of desert sand available in Saudi Arabia has been proposed for use in manufacturing UHPC mixes with single types of steel fibers [14]. Further, a research team in Algeria developed a UHPC mix that incorporates dune sand to strengthen a multipurpose structure [15]. In another study [16], steel fibers, macro-polypropylene fibers, and dura fibers were combined to create high-performance concrete (HPC). Additionally, the flexural, self-healing, and sound-release properties of UHPC were reported [17]. The modified Andreasen and Andersen packing model, D-optimal design, and Artificial Neural Networks have recently been employed to optimize UHPC mixtures [18]. In the last decade, studies on the mechanical behavior of UHPC beams have gradually broadened at the structural level, and full-scale bar-reinforced UHPC beams with various fiber types and reinforcement percentages were experimentally investigated [19]. Additionally, the validity of current approaches to predict the loading capacity of UHPC beams was investigated by comparison with the experimental results of small-scale specimens [20].
In practical applications, the superiority of UHPC (e.g., its high strength-to-weight, ductility, and durability properties) has contributed to the emergence of new prospects for concrete. The use of UHPC, for example, can help reduce the weight of a structure by up to 70% [21]. The source for the superior ductility of UHPC is its discontinuous fibrous system, which controls cracks and can minimize the need for continuous bar reinforcement [1]. Moreover, the use of a low water-to-binder percentage and high content of fine-constituent materials has resulted in the higher durability to UHPC, allowing this concrete to tolerate harsh environmental conditions [22]. Due to these unique properties, UHPC has been effectively employed in infrastructure (e.g., pedestrian [23,24] and road [25,26] bridges), buildings (e.g., [27,28,29]), and the retrofitting of pre-existing structures [30,31]. Notably, encouraging findings were reported on the use of UHPC in coastal facilities [32,33], earthquake-prone areas [34], and composite piling systems [35]. More recently, the structural responses of UHPC beams with different bar areas and fiber dosages to four-point loading tests were reported [36]. In the present literature, there is no information on the behavior of hybrid-fiber-reinforced UHPC beams with various effective depths. Additionally, few practical methods are available to calculate the moment capacity of bar-reinforced UHPC beams incorporating hybrid fibers, although a few models are recommended by some engineering institutes to estimate the loading strength of UHPC beams containing steel fibrous systems [37,38,39]. To broaden the applicability of UHPC, additional research aiming at more accurate methods for calculating the moment capacity of reinforced UHPC beams is required.

1.2. Research Goal and Objectives

The current investigation aimed to investigate the structural behavior of hybrid-fiber reinforced UHPC beams containing steel bars. The basic variable used in the experimental investigations was the steel-bar depth. The corresponding bar-reinforcement percentages ranged between 1.2 and 2.0%. The developed UHPC contained about 2.5% hybrid microsteel straight fibers and natural desert aggregates. The findings based on the four-point loading test exhibited the mechanical features of the hybrid-fiber reinforced UHPC beams. These results include the modes of failure, load, deflection, ductility, strain, cracking, and moment–curvature properties. Moreover, a nonlinear analytical model to predict the ultimate moment capacity of the UHPC beam’s response surface considering the beam’s sectional and material properties was developed. Using the proposed model, the iso-response level plots of the normalized ultimate moments of reinforced UHPC beams with different concrete compressive strengths, reinforcements, and effective-to-overall depth ratios were plotted. These contour plots could be used to design fiber-reinforced UHPC beams.

2. Experimental Process/Program

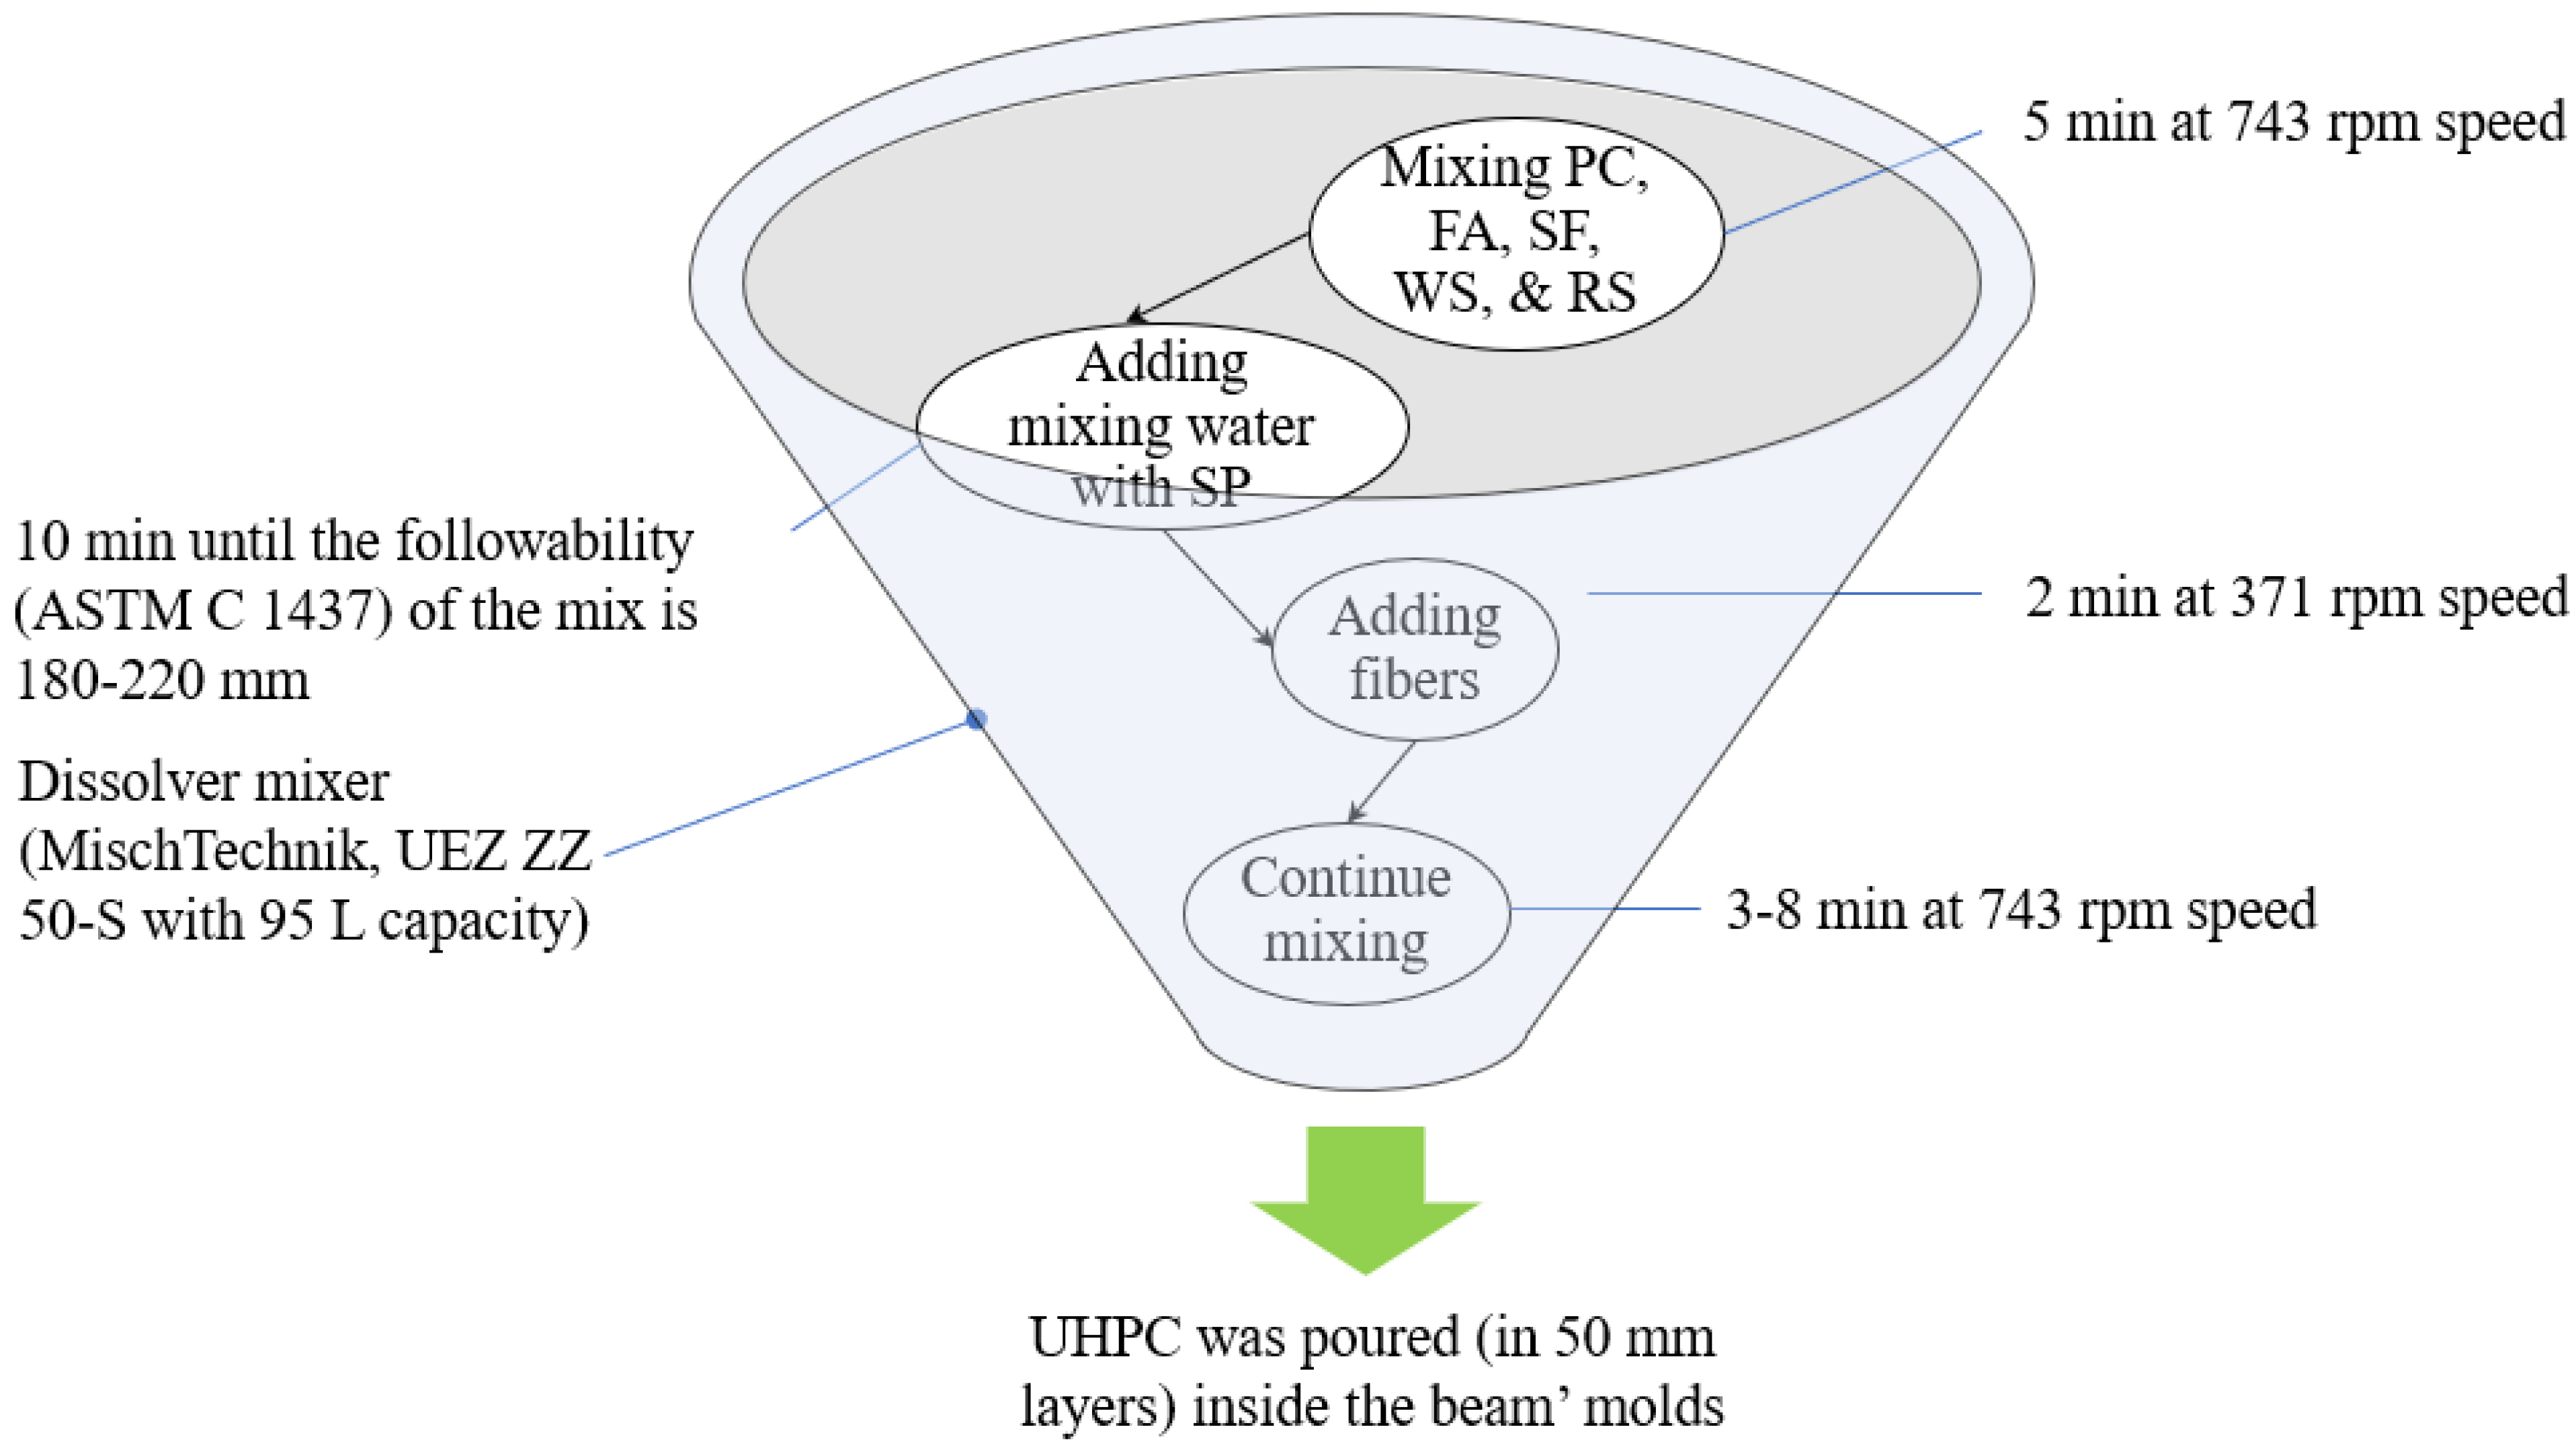
2.1. Development of UHPC

2.1.1. Materials

In the current research, ordinary Portland cement (PC) that satisfied the ASTM C 150 requirements was used to develop the UHPC, while silica fume (SF) and fly ash (FA, class F) were used as binders. The physicochemical properties of these types of cement are presented in Table 1. Moreover, two kinds of locally available natural desert sands identified as red sand (RS) and white sand (WS) were employed as the UHPC fine aggregates. Table 2 lists the physical characteristics of the RS and WS, and Figure 1 provides the particle size distribution of PC, SF, FA, RS, and WS.
Additionally, microstreel smooth fibers with three different lengths (F1, F2, and F3) were employed to reinforce the UHPC. Figure 2 and Table 3 present the geometrical and physicomechanical properties of these fibers, respectively. It is worth noting that the cementitious matrix is bonded strongly to the nonsmooth fibers. Their presence will, however, be limited as an increased amount normally hinders workability due to the snatching effect with the fresh matrix, which adversely affects rheology. As a consequence, the sharpness of the protrusion on the surface has a significant effect on the rheological properties of UHPC. A feasible alternative here would be to use smooth microsteel fibers.
In this investigation, UHPC was designed by applying an optimization process to the concrete’s packing constituents. This process was performed by applying the modified Andreassen model [Equation (1)] [40,41,42,43] along with experimental observations of the fresh and hardened properties of UHPC—namely, flowability, compressive, and flexural strength tests. In Equation (2), CPFT is the cumulative (volume) percentage finer than, d is the particle size, d o is the smaller particle size, D is the maximum particle size, and q is the modulus of distribution (an exponent that generally ranges from 0.21 to 0.37, depending upon the workability conditions [44]). Notably, the introduction of fibers could cause workability issues. Therefore, self-compacting UHPC was developed. For this purpose, a polycarboxylate ether-based superplasticizer (commercially known as Master Glenium 51, SP) was utilized. The unit weight and water content of the SP were 1080 kg/m3 and 65.19%, respectively. Table 4 presents the optimized constituent components of the UHPC. Moreover, the SP’s water content and aggregate absorption of water were taken into consideration when calculating the UHPC’s mixing water.
CPFT = 100 ( d d o D d o ) q

2.1.2. Experimental Program

Figure 3 illustrates the procedure for preparing the UHPC in a special concrete mixer. This concrete was developed in four phases over 10–18 min. These steps involved first mixing the dry constituents until achieving reasonable homogeneity and then adding mixing water that included SP. After obtaining the concrete mixture with practical flowability, hybrid fibers were added in the third phase. This fibrous mixture was then continuously mixed until a suitable fiber dispersion was attained. Finally, the developed UHPC was cast in 50 mm layers into the molds of the beams that were prepared with the designed continuous tensile reinforcement. Moreover, 50 mm cubic specimens and 40 × 40 × 160 mm prisms were collected to evaluate the compressive and flexural behaviors of the various UHPC batches. Notably, all concrete specimens were kept in water tanks (21 ± 2 °C temperature and 100% relative humidity) until the testing date (28 days after casting).

2.2. Mechanical Properties of the UHPC

Following ASTM C109, a 3000 kN universal testing machine was used to test the UHPC specimens under compression with a loading rate of 0.2 MPa/s. Additionally, the flexural strength of the fiber-reinforced UHPC was determined using a 30 kN universal testing machine (INSTRON, Model 3367 at 0.2 mm/min rate) according to ASTM C1609. Figure 4 shows the flexural test setup. As shown in this figure, two Linear Variable Differential Transformers (LVDTs, Tokyo Sokki, model FDP 50A, with 300 × 10−6 strain/mm sensitivity) were utilized to acquire the deflection at the specimen’s midspan. Moreover, the behavior of the beam’s reinforcing bar specimens (600 mm length) under uniaxial tension was investigated using a 3000 kN universal testing machine (at a rate of 1.12 mm/min), and the ASTM A370 guidelines were followed. The average mean yielding strength and elasticity modulus of the high-tensile-strength rebars were 520 MPa and 210 GPa, respectively. The previously mentioned material properties were evaluated as the average of three typical replicas. The concrete specimens were then taken in six different batches.
Table 5 summarizes the mechanical properties of the UHPC batches. The properties include the compressive, flexural, and tensile strengths ( f c , f b , and   f t , respectively) and the elasticity modulus ( E c ). In this investigation, f c and f b were directly measured; however, f t was calculated using Equation (2) (following the French code in [37]). In this equation, h (in mm) is the height of the flexural test prism (40 mm). However, to evaluate the E c   of fine-grained UHPC, the model proposed by Ma et al. in [45] was adopted, as given by Equation (3):
f t = ( 0.8 h 0.7 1 + 0.8 h 0.7 ) f b
E c = 8800 f c 1 / 3

2.3. Testing of UHPC Beams

2.3.1. Details of Specimens

In the current experimental program, 12 beams (two samples of six various sets) were investigated, and two typical beams were constructed for each set. The first set was the control set (i.e., without bar reinforcement); however, the remaining sets were reinforced by two 12 mm bars. The developed beams had the dimensions of 150 mm (width) × 150 mm (height) × 600 mm (length). The main variable in this study was the effective depth ( d ) of the tensile reinforcement bars while keeping the shear span-to-effective depth ratio at a constant a / d ratio (1.8) for all beams. Figure 5 outlines the dimensions and reinforcements of the investigated specimens, while Table 6 lists the properties of the UHPC beams.

2.3.2. Details of the Testing System

The structural responses of UHPC beams (Table 6) to four-point loading were studied in the current research. The pertinent test details are presented in Figure 6, and the test was conducted using a hydraulic universal testing machine (AMSLER, 2000 kN capacity with a 0.4 mm/min loading rate). The test instruments included five different sets. First, three 60 mm concrete-strain gauges (C-1, C-2, and C-3) were attached at various locations (Figure 6) to evaluate the concrete strains. Secondly, two 5 mm electrical-sensitive strain gauges were fixed on the B to F beams’ steel rebars (before casting) to obtain their strain responses. Thirdly, two vertically mounted LVDTs were attached beneath the beam’s midspan to achieve vertical displacement. Additionally, two horizontally located LVDTs were attached near the beam’s centerline to acquire the crack width response. Lastly, the applied loads were measured by load-cells bonded to the machine’s actuator. A data acquisition device (Tokyo Sokki, model TDS-630 with a speed of 1000 channels in 0.1 s) was employed to synchronize the data of the above-mentioned instruments. After testing each beam, high-quality photos were captured to assess the cracking patterns and modes of failure.

3. Results and Discussion

3.1. Modes of Failure and Crack Pattern

Figure 7 shows the cracking responses of the UHPC beams to flexural testing (0). In the elastic stage of this test (Figure 8), no cracks were detected. Microcracks were typically initiated at the beam’s soffit surface and propagated vertically toward its top surface. The pullout of fibers from the concrete caused these microcracks [20]. When the load on a single fiber is greater than the fiber-matrix bonding resistance, fiber pullout ensues, which increases the load that the other fibers must overcome [1]. This mechanism made the fibers undergo a progressive pullout (collapse) mode. Figure 7 presents the enhanced deformability of the bar-reinforced UHPC (B–F) beams compared to the control beam (A); however, all beams (except for E1) failed due to one major flexural crack formation. This cracked section developed when the fiber-pullout phenomenon explicitly occurred. This mechanism typically took place when the beam approached its ultimate load, followed by steel bar yielding.
In the E1 case, two major flexural cracks extending from the beam’s bottom surface to the loading points caused the failure. The best deformability was observed for E2, where tightly spread flexural cracks diffused along the beam’s pure flexural zone. However, no clear-cut relationship between the reinforcement depth and cracking intensity and distribution was observed. The observed discrepancy in the failure patterns of the beam replicas could be attributed to their variable fiber distribution (dispersion). Therefore, the combined mechanism of fiber pullout and bar yielding likely precipitated the failure of the UHPC beams.

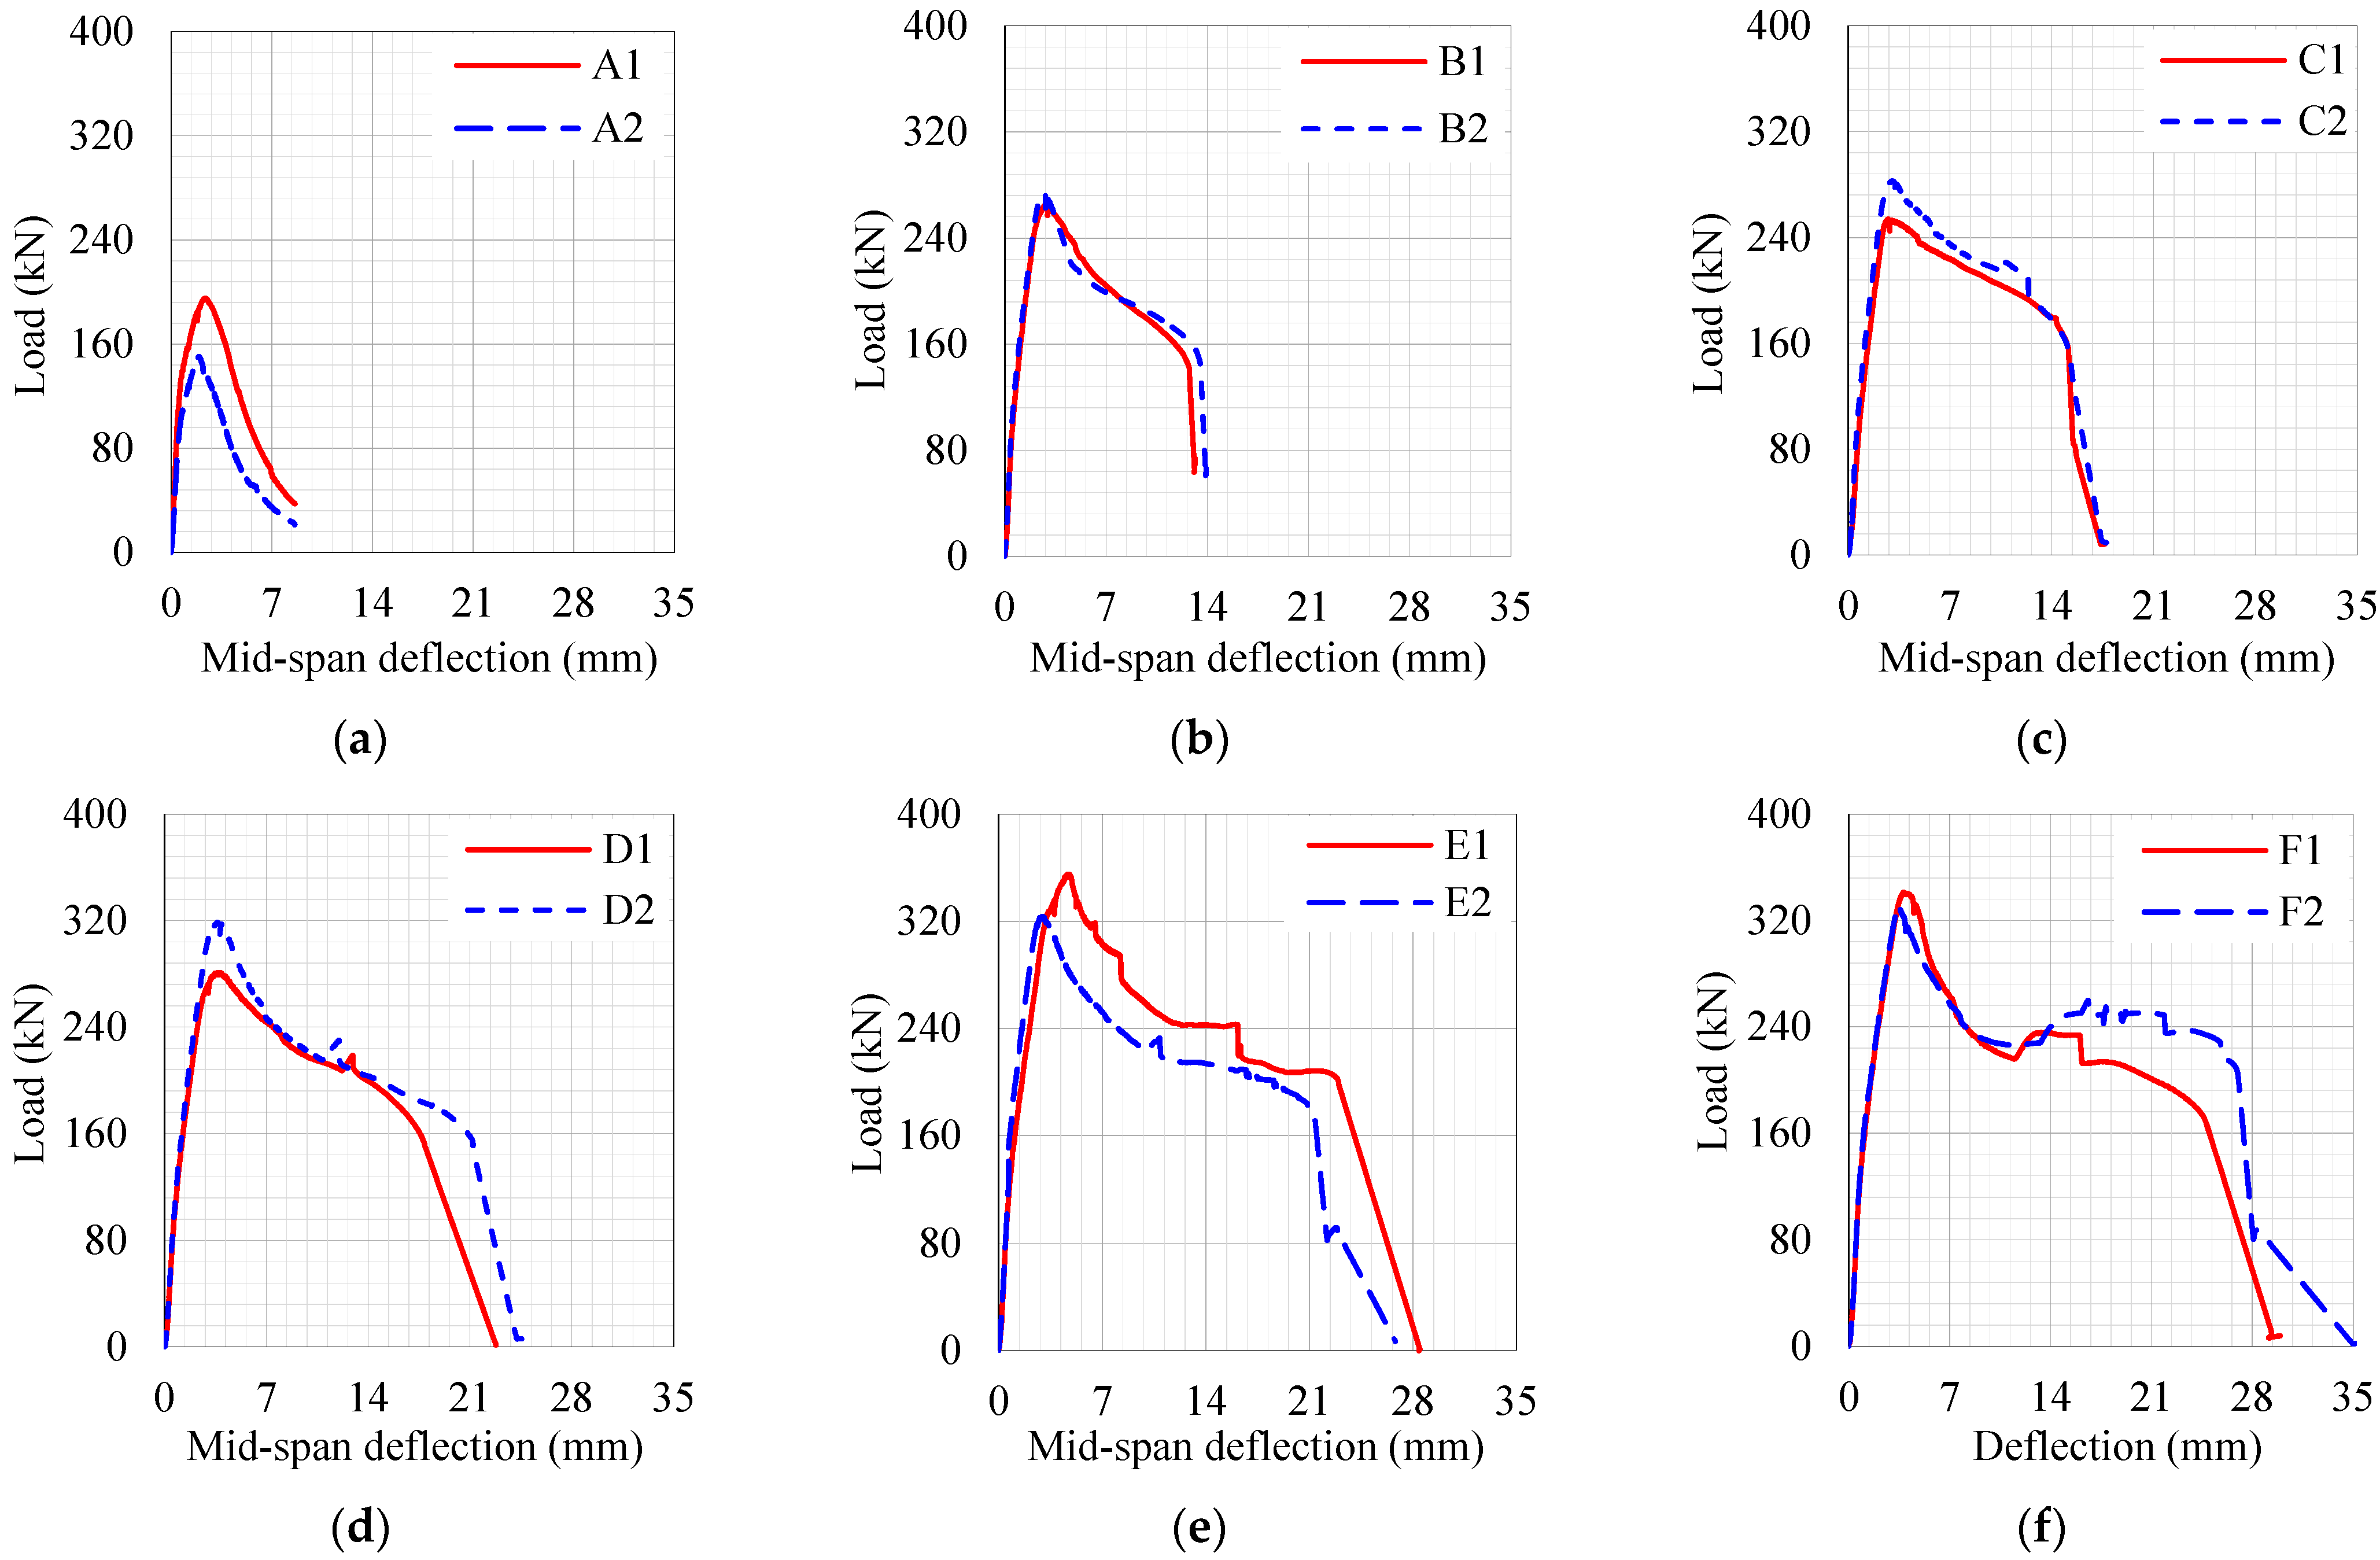
3.2. Load-Deflection Response

The measured load–deflection relations for the UHPC beams are presented in Figure 9, while the data related to these curves are summarized in Table 7. The basic data in this table are defined in Figure 8. These data include the elasticity limit ( P c r ), yield ( P y ), and ultimate ( P u ) loads, as well as their corresponding midspan displacements (i.e., Δ c r , Δ y , and Δ u ). Notably, P y was estimated based on the loads corresponding to the steel’s yielding strains (0.0025) measured at the steel bar surfaces. Additionally, Δ m (Table 7) was taken as the beam’s maximum deflection at total failure.
As shown in Figure 8, the typical load–deflection behavior of the bar-reinforced and unreinforced UHPC beams started with a linear relation and ended with the development of flexural cracks that decreased the flexural stiffness of the beams (decreasing the slope of the load–deflection curve). The end of this second linear stage of the load-deflection response was characterized by bar-reinforcement yielding. Afterward, the beam’s deflection increased nonlinearly up to the peak load.
As listed in Table 7, the plain UHPC beam A2 had the minimum P c r (85 kN), while the reinforced beam C2 (with 115 mm effective depth) had the maximum P c r (186 kN). The average P c r (a measure of the first cracking load for all beams induced by the UHPC matrix behavior) was 136.6 kN, with a standard deviation and coefficient of variation of 34.4 kN and 18.5%, respectively. Additionally, P u was dependent on the existence of bar reinforcements and their effective depths. As expected, the lowest average load-carrying capacity of beams was observed for the plain UHPC beams (172.8 kN). The maximum load of the UHPC beams was notably increased by the introduction of the bar reinforcement. Compared to the A-type beam, the use of bar reinforcements at 125, 115, 95, 85, and 75 mm enhanced P u by 56, 55, 73, 96, and 94%, respectively. However, the maximum P u (339.3 kN) was recorded for the bar-reinforced UHPC beam with an effective depth of 85 mm. The ductility analysis of UHPC beams is discussed in Section 3.3.
Based on the data given in Table 7, some robust correlations with a correlation coefficient ( R 2 ) greater than 70% were observed (Figure 10). As expected, linear relations with negative slopes were obtained for P y , P u , and Δ m with d . This finding indicates that the yielding and ultimate loads linearly decreased as the effective depth of bar reinforcement increased. This finding is consistent with that reported in [46] for high-performance concrete beams with overall depths of 610–900 mm. Moreover, the trendline of μ u   was found to be nonlinear for d (third-order polynomial). This result indicates that the UHPC beam’s ultimate ductility could be maximized effectively at various effective depths. Therefore, the typical design code recommendation that limits the zero-sectional stain depths of concrete beams to ensure satisfactory ductility is likely invalid for UHPC beams. This result contradicts the findings of Bernardo and Lopes [47] for high-strength concrete beams.

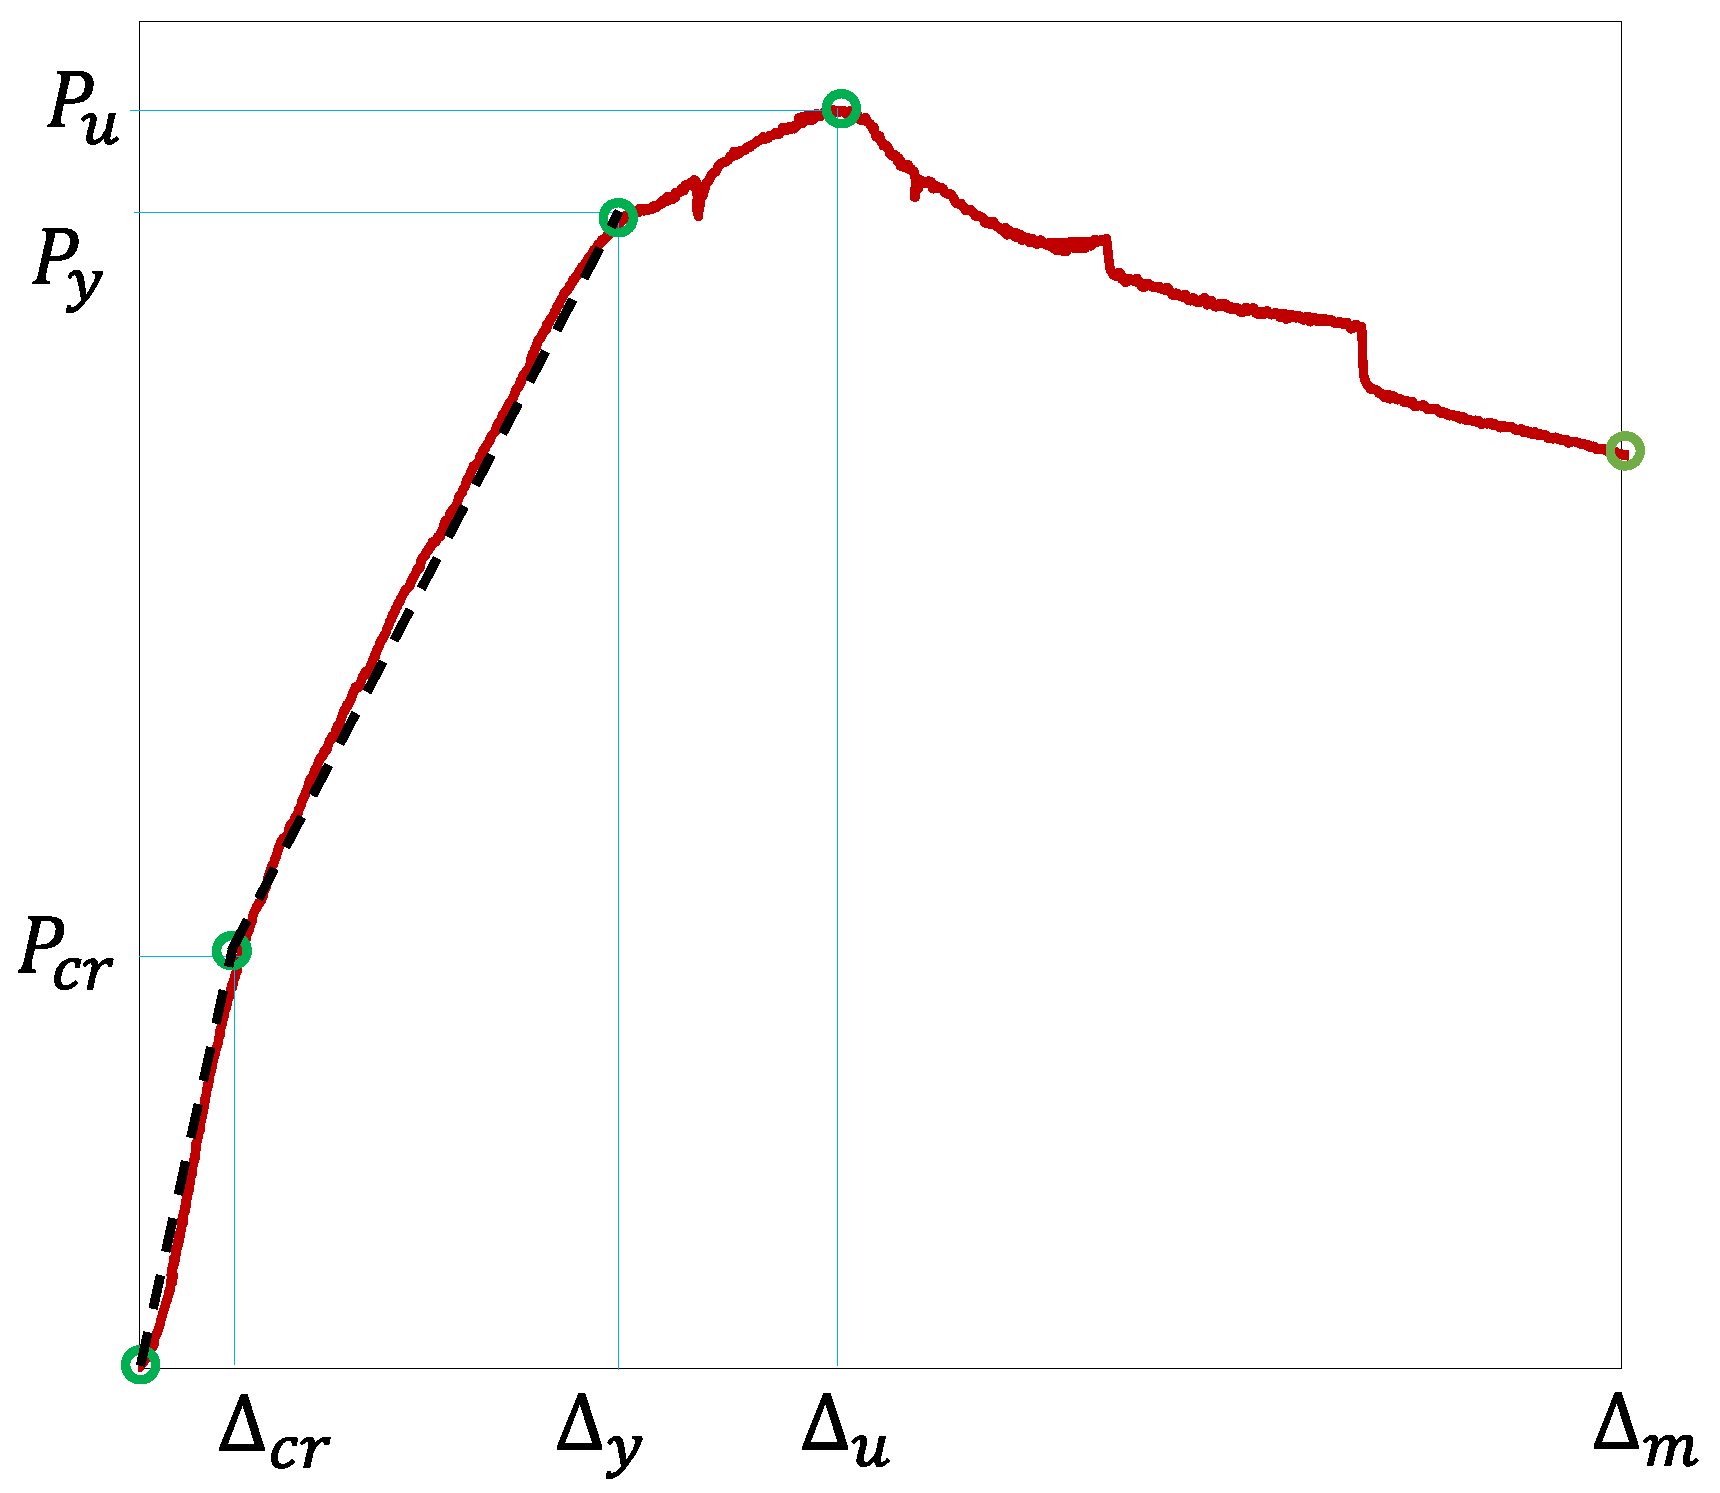
3.3. Ductility Analysis

The ductility of a structural system is a measure of its plasticity-to-elasticity deformations and can be used to describe a system’s toughness. This structural parameter is generally measured by the deflection ductility index ( μ ) [1,8,36,48]. The amount of the apparent mid-span deflection is, therefore, required for the evaluation of μ . In the current investigation, two deflection ductility indices (i.e., μ u and μ m ) were calculated to quantify the ductility properties of UHPC beams. Here, μ u and μ m were obtained by dividing the peak load and ultimate deflections by those corresponding to the bar-reinforcement yielding ( Δ y ), as given by Equations (4) and (5), respectively:
μ u = Δ u / Δ y
μ m = Δ m / Δ y
The results of the ductility indices are presented in Table 7. In this table, the B-type beam was taken as the control beam for comparing the ductility properties of the bar-reinforced UHPC beams, as the unreinforced beam clearly had inferior ductility. In Table 7, the percentage differences between the ductility parameters and the control ones are given in parentheses. From both calculated indices, it can be concluded that the ductility of the UHPC beam decreased as its effective depth decreased. Based on μ m , the ductility of the beam with a 75 mm effective depth (F-type) was surprisingly comparable to that of μ m with a 125 mm effective depth (B-type). Thus, μ u was found to be more practical for evaluating the ductility of UHPC beams. According to this property, the best tensile reinforcement effective depth after 125 mm was 105 mm. Based on this particular investigation, a 125 mm effective depth appears to provide the highest capability for fibers to control cracks.

3.4. Load–Strain Response

In the current research, the load–strain responses were directly measured by strain gauges attached to the concrete and steel bars, namely, C-1, C-2, C-3, and S strain gauges, as shown in Figure 6. As an example of these responses, the load–strain curves for beam B2 are presented in Figure 11. In this figure, all strain measurements were compressive (negative) up to 20 mm below the beam’s top surface, while the mean strains were tensile (positive) on the steel rebars (at 125 mm below the top surface). The concrete strain at C-1 progressively increased even after the peak load; however, strains on C-2 and C-3 were likely constant before reaching the beam’s end-of-elasticity moment and tended to decrease after the peak load. This reduction in concrete strains indicated the propagation of tensile cracks to the positions of the associated strain gauges. Notably, the ultimate concrete strains at failure were about 0.0038. Additionally, after the ultimate load, the strains of C-3 were close to zero, which indicated that the sectional neutral axis was touching the location of C-3.
The load–strain responses of steel bars were similar to the beams’ moment–curvatures (discussed in Section 3.6). This response was typically linear at various stages, with reduced slopes as the beam’s flexural stiffness decreased after achieving the beam’s elasticity limit and bar yielding. However, the tensile strains of steel were almost constant (about 0.0085) after reaching the beam’s ultimate load.

3.5. Load-Crack Width Response

Figure 12 shows the load-crack width responses for the UHPC beams. This figure illustrated that the introduction of tensile reinforcement bars in the beam notably increased the beam’s cracking capacity before failure, as the maximum crack widths of the bar-reinforced concrete beams (10.8–18.4 mm) were significantly less than those of the control beam (7.4–8.0 mm), as outlined in Table 7. As an established fact, the maximum crack width increased as the reinforcement effective depth decreased. After the beam reached its maximum load, as the effective depth increased, the rate of crack propagation decreased (shown in Figure 12). This preferable behavior indicated that the efficient design of bar reinforcements in UHPC beams could help control the development of cracking and thus play an important role in beam serviceability and durability.

3.6. Moment–Curvature Relations

In the current study, the moment–curvature responses of the UHPC beams were evaluated for the three characterized phases (uncracked, cracked, and nonlinear phases (Figure 13a)) using the loading and strain measurements. The readings of the strain gauges were employed to determine the sectional strain distribution over the effective depth under the assumption of plane sections remaining planar after bending. Thus, the linear distribution of these strains was applied to evaluate the beam’s curvature. Gauge measurements were employed as long as their values had reasonable consistency, while the values associated with crack propagation in concrete surfaces were ignored.
Therefore, a general evaluation of representative moment–curvature curves for the UHPC beams is shown in Figure 13b. These curves demonstrate that all beams had an uncracked phase that extended to a curvature of about 7.5 × 10⁻⁶ rad, which occurred at about 10 kNm (at the first cracking moment). Beyond this curvature, the moment–curvature behavior can be assumed as linear. In this linear cracked phase, the curvature quickly increased for the unreinforced beam (A-type); however, the bar reinforcement helped control the curvature deformations of the UHPC (B-F type) beams. The maximum observed curvatures (about 100 × 10−6 rad) were observed for the beams with bar-effective depths of 125 and 115 mm. These findings suggested that increasing the bar-effective depth of the UHPC beam would likely enhance its curvature capacity.

3.7. Prediction of the Ultimate Moment Capacity of UHPC Beams

In this research, the ultimate moment capacity of UHPC beams was predicted using the Minitab programming package [49,50]. Here, the prediction approach relied upon the design of an experimental model that correlates the biased impacts of individual independent variables to the nonlinear observed response surfaces. This numerical modeling approach can yield continuous formulas for measured responses, taking into consideration its input limitations. Additionally, the iso-responsive contours (surfaces) can be assessed in terms of the designed investigational properties by employing this method.
In this investigation, four input parameters were used to predict the normalized ultimate moment capacities of beams (i.e., M u / ( b d 2   f c   ) ), where b and d are the width and effective depth of the beam, respectively, and f c   is the compressive strength of the concrete. These parameters were x 1 , x 2 , x 3 , and x 4 , which represent f c (MPa), f t (the concrete’s tensile strength in MPa), ρ (the percentage of reinforcement, %), and d / h (the effective-to-overall depth ratio), respectively. The normalized ultimate-moment-model prediction equation and coefficients are given by Equation (6) and presented in Table 8 and Table 9, respectively.
A wide-ranging database (Table 10) based on the present experiments and independent data was prepared for the development of this model. The collected data points encompass 25 bar-reinforced UHPC concrete beams. Notably, the previous data were carefully selected to match the current data. The primary matching criteria included concrete’s comparable compressive strength and tensile-bar arrangement, a lack of transverse reinforcement, and a similar test setup under flexural loading. Accordingly, some of the test results from the four datasets [1,20,51,52] are included in Table 10.
M u b d 2 f c = α + β 1 x 1 + β 2 x 2 + β 3 x 3 + β 4 x 4 + β 11 x 1 2 + β 22 x 2 2 + β 33 x 3 2 + β 44 x 4 2 + β 12 x 1 x 2 + β 13 x 1 x 3 + β 14 x 1 x 4 + β 23 x 2 x 3 + β 24 x 2 x 4 + β 34 x 3 x 4 ( R 2 = 98.5 % )
The prediction capability of the ultimate moment capacity of the bar-reinforced UHPC beam model (Equation (6)) is summarized in Table 10 and Figure 14. Table 10 shows that the suggested prediction model offered reasonable performance for the majority of the investigated data points, as the ratio of predictions to test results generally approached unity. Exceptions were observed for only four data points: R13-1, R14-1 [1], U-B3, and U-B5 [52]. This discrepancy was likely attributable to the size effect, casting methods, and testing configurations of these beams. Excluding the outlier data points (R13-1, R14-1, U-B3, and U-B5), the mean ratio was 0.92, with a standard deviation of 0.09; however, the overall average was 0.83, and the associated standard deviation was 0.23 (Table 10).
Figure 14 indicates that the majority of the predicted M u / ( b d 2   f c   ) values using Equation (6) were close to the line of equality (LOE (prediction = test results)). However, few data points were underneath the LOE, while the majority of the data points were above this line. This finding indicates that the proposed model (Equation (6)) is likely to insignificantly overestimate the moment capacity of the UHPC beam. In conclusion, the proposed prediction model with a rational professional safety factor can be used to design UHPC beams in an adequate manner. Most of the predicted results occurred within an error band of ±10%, although a few data points were close to the ±20% model error band. This analysis demonstrated that the prediction formula (Equation (6)) can be efficiently employed to calculate the ultimate moment capacity of non-shear-strengthened and bar-reinforced UHPC beams under flexural loading conditions.
Figure 15 presents the predicted contours of M u / b d 2 f c for reinforced UHPC beams with different concrete compressive strengths ( f c ), reinforcement ratios ( ρ ), and effective-to-overall depth ( d / h ) ratios using the proposed model (Equation (6)). In Figure 15a, the concrete’s tensile strength ( f t ) and ρ were assumed to be 17 MPa and 1.5%, respectively. However, f t and d / h were assumed to be 30 Mpa and 0.55, respectively, as shown in Figure 15b. This figure could be used as a design aid for the UHPC beams. Notably, Figure 15a shows that at an f c of up to about 170 Mpa, the d / h had little influence on the beam’s moment capacity, as increasing the d / h at a constant f c did not significantly change the M u / ( b d 2   f c   ) .  Figure 15b instead illustrates that the moment capacity of the UHPC beam was almost constant when f c was in a range of 150–190 Mpa, and ρ was in a range of up to 2%. Additionally, this figure shows that increasing the ρ by more than 2% at a constant f c will likely decrease the beam’s moment capacity. This result is expected, as over-reinforcement in beams will lead to brittle failure, obviating the benefits of the increased reinforcement ratios to increase the beam’s loading capacity [53].

4. Conclusions

In the current research, the structural behavior of hybrid-fiber-reinforced UHPC beams containing steel bars under four-point flexural loading was studied. The basic variable in the experimental investigations was the steel bar depths. The corresponding bar reinforcement percentages ranged between 1.2 and 2.0%. The developed UHPC contained about 2.5% hybrid microsteel straight fibers and fine desert aggregates. The following conclusions were drawn based on this investigation.
The microcracks in the UHPC beams were typically initiated at the beam’s soffit surface and propagated vertically toward its top surface. The fiber’s pullout from the concrete caused these microcracks. When the load on a single fiber exceeded the fiber-matrix bonding resistance, the pullout of the fiber ensued, thereby increasing the load, which the other fibers had to overcome. This mechanism made the fiber undergo a progressive pullout (collapse) mode.
The enhanced deformability of the bar-reinforced UHPC beams was noted compared to the control beam; however, the majority of beams failed due to one major flexural crack. This cracked section developed when fiber pullout explicitly occurred. This phenomenon was typically caused when the beam approached its ultimate load, followed by bar yielding.
The typical load–deflection behaviors of the bar-reinforced and -unreinforced UHPC beams started with linear relations and ended with the development of flexural cracks that decreased the flexural stiffness of the beams (decreasing the slope of the load–deflection curve). The end of this second linear stage of the load–deflection response was characterized by bar-reinforcement yielding. Afterward, the beam’s deflection increased nonlinearly up to the peak load.
The plain UHPC beam experienced the minimum cracking load and the lowest average load-carrying capacity of the beams. The maximum load of UHPC beams was notably increased by the introduction of the bar reinforcement.
The ductility of the UHPC beam decreased as the beam’s effective depth decreased. Moreover, the deflection ductility parameter based on the ultimate defection was more practical in evaluating the ductility of UHPC beams, as it provided positive expected results for all the investigated beams.
The introduction of tensile reinforcement bars in the UHPC beam notably increased the beam’s cracking capacity before failure. Additionally, the maximum crack width increased as the reinforcement effective depth decreased. After reaching the maximum load, as the effective depth increased, the rate of crack propagation decreased. This favorable behavior indicated that the efficient design of the bar reinforcement in an UHPC beam can help control the development of cracks, which plays an important role in the serviceability and durability of beams.
All the studied UHPC beams had an uncracked phase that extended to a curvature of about 7.5 × 10⁻⁶ rad, which occurred at about 10 kNm during the first cracking moment. Beyond this curvature, the moment–curvature behavior was shown to be linear. In this linear cracked phase, the curvature quickly increased for the unreinforced beam; however, the bar reinforcement helped control the curvature deformations of the UHPC beams. The bar-effective depth of the UHPC beam will likely enhance the beam’s curvature capacity.
The design of the experimental numerical modeling approach was utilized to develop a prediction model for M u / ( b d 2   f c   ) in terms of f c , f t , ρ , and d / h and prepare a wide-ranging database based on the present experiments and independent data. The suggested prediction model offered reasonable performance for the majority of the investigated data points, with a mean prediction-to-test ratio of 0.92. The conclusions drawn here are perhaps limited to lab-sized beams; however, normalized (size-free) design formulas have been proposed. Prospective research would investigate a size-based model of UHPC beams.

Author Contributions

Conceptualization, M.I.K. and G.F.; methodology, M.I.K.; software, Y.M.A.; validation, M.I.K.; investigation, G.F.; resources, M.I.K.; data curation, G.F. and Y.M.A.; writing—original draft preparation, G.F. and Y.M.A.; writing—review and editing, M.I.K.; supervision, M.I.K.; project administration, M.I.K.; funding acquisition, M.I.K. All authors have read and agreed to the published version of the manuscript.

Funding

This research and the APC were funded by National Plan for Science, Technology and Innovation (MAARIFAH), King Abdulaziz City for Science and Technology, Kingdom of Saudi Arabia grant number 14-BUI2262-02.

Institutional Review Board Statement

Not applicable.

Informed Consent Statement

Not applicable.

Data Availability Statement

All research data are available and can be furnished upon request.

Acknowledgments

This project was funded by the National Plan for Science, Technology and Innovation (MAARIFAH), King Abdulaziz City for Science and Technology, Kingdom of Saudi Arabia, Award Number 14-BUI2262-02.

Conflicts of Interest

The authors declare no conflict of interest.

References

  1. Yang, I.H.; Joh, C.; Kim, B.-S. Structural behavior of ultra high performance concrete beams subjected to bending. Eng. Struct. 2010, 32, 3478–3487. [Google Scholar] [CrossRef]
  2. Aïtcin, P.-C. Cements of yesterday and today: Concrete of tomorrow. Cem. Concr. Res. 2000, 30, 1349–1359. [Google Scholar] [CrossRef]
  3. Cheyrezy, M.; Maret, V.; Frouin, L. Microstructural analysis of RPC (reactive powder concrete). Cem. Concr. Res. 1995, 25, 1491–1500. [Google Scholar] [CrossRef]
  4. Richard, P.; Cheyrezy, M. Composition of reactive powder concretes. Cem. Concr. Res. 1995, 25, 1501–1511. [Google Scholar] [CrossRef]
  5. Behloul, M.; Bernier, G.; Cheyrezy, M. Tensile behavior of reactive powder concrete (RPC). In Proceedings of the 4th International Symposium on Utilization of HSC/HPC, BHP, Paris, France, 29–31 May 1996; pp. 1375–1381. [Google Scholar]
  6. Oh, B.H. Flexural analysis of reinforced concrete beams containing steel fibers. J. Struct. Eng. 1992, 118, 2821–2835. [Google Scholar] [CrossRef]
  7. Oh, B.H. Flexural Analysis of Reinforced Concrete Beams Containing Steel Fibers. Discussion And Closure. J. Struct. Eng. 1994, 120, 1932–1934. [Google Scholar]
  8. Ashour, S.A.; Wafa, F.F. Flexural behavior of high-strength fiber reinforced concrete beams. Struct. J. 1993, 90, 279–287. [Google Scholar]
  9. Campione, G.; Mangiavillano, M.L. Fibrous reinforced concrete beams in flexure: Experimental investigation, analytical modelling and design considerations. Eng. Struct. 2008, 30, 2970–2980. [Google Scholar] [CrossRef]
  10. Lim, D.; Oh, B. Experimental and theoretical investigation on the shear of steel fibre reinforced concrete beams. Eng. Struct. 1999, 21, 937–944. [Google Scholar] [CrossRef]
  11. Chunxiang, Q.; Patnaikuni, I. Properties of high-strength steel fiber-reinforced concrete beams in bending. Cem. Concr. Compos. 1999, 21, 73–81. [Google Scholar] [CrossRef]
  12. Ashour, S.A.; Wafa, F.F.; Kamal, M.I. Effect of the concrete compressive strength and tensile reinforcement ratio on the flexural behavior of fibrous concrete beams. Eng. Struct. 2000, 22, 1145–1158. [Google Scholar] [CrossRef]
  13. Habel, K.; Viviani, M.; Denarié, E.; Brühwiler, E. Development of the mechanical properties of an ultra-high performance fiber reinforced concrete (UHPFRC). Cem. Concr. Res. 2006, 36, 1362–1370. [Google Scholar] [CrossRef]
  14. Ahmad, S.; Hakeem, I.; Maslehuddin, M. Development of UHPC mixtures utilizing natural and industrial waste materials as partial replacements of silica fume and sand. Sci. World J. 2014, 2014, 713531. [Google Scholar] [CrossRef] [PubMed] [Green Version]
  15. Trabelsi, A.; Kammoun, Z.; Beddey, A. Seismic retrofitting of a tower with shear wall in UHPC based dune sand. Earthq. Struct. 2017, 12, 591–601. [Google Scholar] [CrossRef]
  16. Zhu, Y.T.; Xia, D.T.; Zhou, B.R. Experimental study on axial tensile strength of low volume fraction of ternary hybrid fiber reinforced concrete. In Advanced Materials Research; Trans Tech Publ: Zurich, Switzerland, 2014; pp. 329–334. [Google Scholar]
  17. Granger, S.; Loukili, A.; Pijaudier-Cabot, G.; Chanvillard, G. Experimental characterization of the self-healing of cracks in an ultra high performance cementitious material: Mechanical tests and acoustic emission analysis. Cem. Concr. Res. 2007, 37, 519–527. [Google Scholar] [CrossRef] [Green Version]
  18. Dingqiang, F.; Yu, R.; Kangning, L.; Junhui, T.; Zhonghe, S.; Chunfeng, W.; Shuo, W.; Zhenfeng, G.; Zhengdong, H.; Qiqi, S. Optimized design of steel fibres reinforced ultra-high performance concrete (UHPC) composites: Towards to dense structure and efficient fibre application. Constr. Build. Mater. 2021, 273, 121698. [Google Scholar] [CrossRef]
  19. Yoo, D.-Y.; Yoon, Y.-S. Structural performance of ultra-high-performance concrete beams with different steel fibers. Eng. Struct. 2015, 102, 409–423. [Google Scholar] [CrossRef]
  20. Shafieifar, M.; Farzad, M.; Azizinamini, A. A comparison of existing analytical methods to predict the flexural capacity of Ultra High Performance Concrete (UHPC) beams. Constr. Build. Mater. 2018, 172, 10–18. [Google Scholar] [CrossRef]
  21. Azmee, N.M.; Shafiq, N. Ultra-high performance concrete: From fundamental to applications. Case Stud. Constr. Mater. 2018, 9, e00197. [Google Scholar] [CrossRef]
  22. Li, J.; Wu, Z.; Shi, C.; Yuan, Q.; Zhang, Z. Durability of ultra-high performance concrete–A review. Constr. Build. Mater. 2020, 255, 119296. [Google Scholar] [CrossRef]
  23. Blais, P.Y.; Couture, M. Precast, Prestressed Pedestrian Bridge-World’s First Reactive Powder Concrete Bridge. PCI J. 1999, 44, 60–71. [Google Scholar] [CrossRef] [Green Version]
  24. Behloul, M.; Lee, K. Ductal® seonyu footbridge. Struct. Concr. 2003, 4, 195–201. [Google Scholar] [CrossRef]
  25. Hajar, Z.; Lecointre, D.; Simon, A.; Petitjean, J. Design and construction of the world first ultra-high performance concrete road bridges. In Proceedings of the International Symposium on Ultra High Performance Concrete, Kassel, Germany, 13–15 September 2004; pp. 39–48. [Google Scholar]
  26. Kaptijn, N.; Blom, J. A new bridge deck for the Kaag Bridges the first CRC (Compact Reinforced Composite) application in civil infrastructure. Sci. Eng. Compos. Mater. 2002, 10, 397–402. [Google Scholar] [CrossRef]
  27. Muttoni, A.; Brauen, U.; Jaquier, J.-L.; Moullet, D. A new roof for the olympic museum at Lausanne, Switzerland. In Proceedings of the International Symposium on Ultra-High Performance Fiber-Reinforced Concrete, Marseille, France, 1–3 October 2013; pp. 69–76. [Google Scholar]
  28. Menétrey, P. UHPFRC cladding for the Qatar National Museum. In Proceedings of the International Symposium on Ultra-High Performance Fiber-Reinforced Concrete, Marseille, France, 1–3 October 2013. [Google Scholar]
  29. Fabbri, R.; Corvez, D. Rationalisation of complex UHPFRC facade shapes. In Proceedings of the International Symposium on Ultra-High Performance Fiber-Reinforced Concrete, Marseille, France, 1–3 October 2013; pp. 27–36. [Google Scholar]
  30. Hajar, Z.; Novarin, M.; Servant, C.; Généreux, G.; Przybyla, D.; Bitar, D. Innovative solution for strengthening orthotropic decks using UHPFRC: The Illzach bridge. In Proceedings of the International Symposium on Ultra-High Performance Fiber-Reinforced Concrete, Marseille, France, 1–3 October 2013; pp. 117–126. [Google Scholar]
  31. Moreillon, L.; Menétrey, P. Rehabilitation and strengthening of existing RC structures with UHPFRC: Various applications. In Proceedings of the RILEM-fib-AFGC International Symposium on Ultra-High Performance Fibre-Reinforced Concrete, Marseille, France, 1–3 October 2013; pp. 127–136. [Google Scholar]
  32. Denarié, E.; Jacomo, D.; Fady, N.; Corvez, D. Rejuvenation of Maritime Signalisation Structures with UHPFRC. In Proceedings of the RILEM-fib-AFGC International Symposium on Ultra-High Performance Fibre-Reinforced Concrete, UHPFRC 2013, Marseille, France, 1–3 October 2013. [Google Scholar]
  33. Mazzacane, P.; Ricciotti, R.; Teply, F.; Tollini, E.; Corvez, D. MUCEM: The builder’s perspective. Proc. UHPFRC 2013, 3–16. [Google Scholar]
  34. Long, G.; Wang, M.; Xie, Y.; Ma, K. Experimental investigation on dynamic mechanical characteristics and microstructure of steam-cured concrete. Sci. China Technol. Sci. 2014, 57, 1902–1908. [Google Scholar] [CrossRef]
  35. Leonhardt, S.; Lowke, D.; Gehlen, C. Effect of Fibres on Impact Resistance of Ultra High Perfomance Concrete. In Proceedings of the 3rd International Symposium on UHPC and Nanotechnology for High Performance Construction Material, Kassel, Germany, 7–9 March 2012; pp. 811–817. [Google Scholar]
  36. Yang, I.H.; Park, J.; Bui, T.Q.; Kim, K.C.; Joh, C.; Lee, H. An Experimental Study on the Ductility and Flexural Toughness of Ultrahigh-Performance Concrete Beams Subjected to Bending. Materials 2020, 13, 22. [Google Scholar] [CrossRef]
  37. AFGC. Bétons Fibrés à Ultra-hautes Performances; Association Française du Génil Civil (AFGC) Setra: Paris, France, 2002. [Google Scholar]
  38. JSCE. Recommendations for Design and Construction of Ultra High Strength Fiber Reinforced Concrete Structures (Draft); JSCE: Tokyo, Japan, 2004. [Google Scholar]
  39. Deutscher Ausschuss für Stahlbeton. State-of-the-Art Report on Ultra High Performance Concrete—Concrete Technology and Design; Deutscher Ausschuss für Stahlbeton/German. Association for Reinforced Concrete: Berlin, Germany, 2003; Volume 3. [Google Scholar]
  40. Johansen, V.; Andersen, P. Particle Packing and Concrete Properties: Materials Science of Concrete; The American Ceramic Society Inc.: Westerville, OH, USA, 1992. [Google Scholar]
  41. Stovall, T.; De Larrard, F.; Buil, M. Linear packing density model of grain mixtures. Powder Technol. 1986, 48, 1–12. [Google Scholar] [CrossRef]
  42. Goltermann, P.; Johansen, V.; Palbøl, L. Packing of aggregates: An alternative tool to determine the optimal aggregate mix. Mater. J. 1997, 94, 435–443. [Google Scholar]
  43. Hatem, M.; Pusch, R.; Al-Ansari, N.; Knutsson, S.; Emborg, M.; Nilsson, M.; Alireza, P. Talc-based concrete for sealing borehole optimized by using particle packing theory. J. Civ. Eng. Archit. 2013, 7, 440–455. [Google Scholar] [CrossRef] [Green Version]
  44. Kumar, S.; Santhanam, M. Particle packing theories and their application in concrete mixture proportioning: A review. Indian Concr. J. 2003, 77, 1324–1331. [Google Scholar]
  45. Ma, J.; Orgass, M.; Dehn, F.; Schmidt, D.; Tue, N. Comparative investigations on ultra-high performance concrete with and without coarse aggregates. In Proceedings of the International Symposium on Ultra High Performance Concrete, Kassel, Germany, 13–15 September 2004; pp. 205–212. [Google Scholar]
  46. Sneed, L.H.; Ramirez, J.A. Influence of Effective Depth on Shear Strength of Concrete Beams--Experimental Study. ACI Struct. J. 2010, 107. [Google Scholar]
  47. Bernardo, L.; Lopes, S. Neutral axis depth versus flexural ductility in high-strength concrete beams. J. Struct. Eng. 2004, 130, 452–459. [Google Scholar] [CrossRef]
  48. Bernardo, L.; Nepomuceno, M.; Pinto, H. Neutral axis depth versus ductility and plastic rotation capacity on bending in lightweight-aggregate concrete beams. Materials 2019, 12, 3479. [Google Scholar] [CrossRef] [PubMed] [Green Version]
  49. Alin, A. Minitab. In Wiley Interdisciplinary Reviews: Computational Statistics; Wiley: Hoboken, NJ, USA, 2010; Volume 2, pp. 723–727. [Google Scholar]
  50. Ryan, B.F.; Joiner, B.L.; Cryer, J.D. MINITAB Handbook: Update for Release; Cengage Learning: Boston, MA, USA, 2012. [Google Scholar]
  51. Pourbaba, M.; Sadaghian, H.; Mirmiran, A. Flexural Response of UHPFRC Beams Reinforced with Steel Rebars. Adv. Civ. Eng. Mater. 2019, 8, 411–430. [Google Scholar] [CrossRef]
  52. Solhmirzaei, R.; Kodur, V. Modeling the response of ultra high performance fiber reinforced concrete beams. Procedia Eng. 2017, 210, 211–219. [Google Scholar] [CrossRef]
  53. Carpinteri, A.; Accornero, F.; Cafarelli, R. Scale-dependent maximum reinforcement percentage in reinforced concrete beams. Struct. Concr. 2021, 22, 2155–2166. [Google Scholar] [CrossRef]
Figure 1. Grain size distribution of (a) types of cement and (b) aggregates.
Applsci 11 11168 g001
Figure 2. The microstreel fibers used in this study: (a) F1, (b) F2, and (c) F3.
Applsci 11 11168 g002
Figure 3. The process for producing the UHPC.
Applsci 11 11168 g003
Figure 4. Flexural test setup.
Applsci 11 11168 g004
Figure 5. (a) Set A and (b) set B-F (dimensions are in mm).
Applsci 11 11168 g005
Figure 6. The four-point loading test (dimensions are in mm).
Applsci 11 11168 g006
Figure 7. Modes of failure for the UHPC beams.
Applsci 11 11168 g007aApplsci 11 11168 g007b
Figure 8. Definition of elastic, yield, and ultimate phases.
Applsci 11 11168 g008
Figure 9. Load mid-span deflection responses for (a) A, (b) B, (c) C, (d) D, (e) E, and (f) F UHPC beams.
Applsci 11 11168 g009
Figure 10. Observed correlations: (a) P y d , (b) Δ m d , (c) P u d , and (d) μ u d .
Applsci 11 11168 g010aApplsci 11 11168 g010b
Figure 11. Load vs. strain responses of the B2 UHPC beam.
Applsci 11 11168 g011
Figure 12. Load crack width responses for UHPC beams: (a) A, (b) B, (c) C, (d) D, (e) E, and (f) F.
Applsci 11 11168 g012
Figure 13. The moment–curvature: (a) typical curve and (b) comparison between different UHPC beams.
Applsci 11 11168 g013
Figure 14. Predicted vs. observed M u / b d 2 f c [1,17,48,49].
Applsci 11 11168 g014
Figure 15. Iso-responses of UHPC beams: (a) d / h f c , (b) ρ f c .
Applsci 11 11168 g015
Table 1. Physicochemical properties of PC and SCMs.
Oxides (%)PCFASF
SiO220.4155.2386.20
Al2O35.3225.950.49
Fe2O34.1010.173.79
CaO64.141.322.19
MgO0.710.311.31
SO32.440.180.74
TiO20.30--
Na2Oeq0.100.862.80
L.O.I.2.185.002.48
Relative density3.152.702.20
Table 2. Physical properties of RS and WS.
PropertyRSWS
Bulk Specific Gravity (OD Basis)2.642.73
Specific Gravity (SSD Basis)2.652.74
Apparent Specific Gravity2.672.76
Absorption, %0.300.37
Fineness Modulus (range of 2.3–3.1)1.111.46
Table 3. Physicomechanical properties of the fibers.
TypeLength (mm)Diameter (µm)Unit Weight (kg/m3)Tensile Strength (MPa)
F11320078502600
F220
F330
Table 4. Constituent materials of the UHPC (in kg/m3).
PCSFFAWSRSWaterSPFiber
ABC
1123.1239.166.1481.2160.9212.739.7151.843.07.6
Table 5. Mechanical characteristics of UHPC.
Property (MPa)UHPC Batchμσ
B-1B-2B-3B-4B-5B-6
f c 186.7172.6185.8179.3186.7187.5183.16.0
f b 34.635.948.639.053.848.943.58.0
E c 50,29648,99650,21549,62250,29650,36749,965548
f t 17.718.424.920.027.625.122.34.1
μ = mean, σ = standard deviation.
Table 6. Reinforcement details for beam specimens.
SetUHPC BatchBeamDimensionsρ (%) L / d
b h a d
AB-1A1150150225---
A2 150150225---
BB-2B11501502251251.2064.00
B21501502251251.2064.00
CB-3C11501502071151.3114.35
C2 1501502071151.3114.35
DB-4D1150150171951.5875.26
D2 150150171951.5875.26
EB-5E1 150150153851.7745.88
E2 150150153851.7745.88
FB-6F1 150150135752.0116.67
F2 150150135752.0116.67
Table 7. Summary of the four-point testing of UHPC beams.
BeamElastic PhaseYield PhaseUltimate PhaseDuctility Indices
P c r
(kN)
Δ c r
(mm)
P y
(kN)
Δ y
(mm)
P u
(kN)
Mean
P u (kN)
Δ u
(mm)
Δ m
(mm)
M u
(kNm)
w u
(mm)
Mean w u
(mm)
μ u Mean
μ u
μ m Mean
μ m
A1103.60.46--195.2172.82.378.6221.967.47.7----
A285.00.51--150.41.938.6216.928.0--
B193.80.50207.31.60265.2269.72.9213.1729.8410.410.81.832.048.269.93
B2104.40.52179.61.20274.12.7013.9230.8311.22.2511.61
C1130.21.06245.02.40253.9268.42.7617.6626.2816.416.3
(+50.9%)
1.151.22
(−40.3%)
7.367.55
(−24.0%)
C2186.31.42265.12.35282.93.0218.1729.2816.21.297.75
D1139.51.06255.82.51280.8299.83.7717.8924.0012.412.6
(+16.67%)
1.501.58
(−22.5%)
7.148.27
(−16.7%)
D2128.80.90255.52.26318.73.7621.2627.2512.81.669.40
E1169.01.19321.13.18355.1339.34.6822.9927.1715.615.8
(+46.3%)
1.471.34
(−34.5%)
7.248.38
(−15.6%)
E2170.20.85309.82.44323.52.9323.1924.7516.01.209.52
F1170.41.21301.42.93341.2335.23.8324.7923.0316.818.4
(+70.4%)
1.311.24
(−39.1%)
8.479.07
(−8.7%)
F2158.41.03308.32.97329.13.4928.6522.2120.01.189.66
Table 8. Normalized-ultimate-moment model individual coefficients.
α β 1   β 2   β 3   β 4   β 11 β 22 β 33 β 44
1.23−0.02620.05160.4351.3166 × 10−6−676 × 10−6−0.01356−0.472
Table 9. Normalized-ultimate-moment model interaction coefficients.
β 12 β 13   β 14   β 23   β 24   β 34
77 × 10−6−12.49 × 10−40.00370.0035−0.044−0.161
Table 10. Normalized ultimate-moment-model database.
Beam f c (MPa) f t ( MPa ) ρ d h (1)(2)(1)/(2)
Test M u / ( b d 2 f c ) Predicted M u / ( b d 2 f c )
AuthorsB1172.618.41.2060.8330.07380.07840.94
B2172.618.41.2060.8330.07620.07840.97
C1185.824.91.3110.7670.07130.08390.85
C2185.824.91.3110.7670.07940.08390.95
D1179.320.01.5870.6330.09890.11430.87
D2179.320.01.5870.6330.11230.11430.98
E1186.727.61.7740.5670.13430.13391.00
E2186.727.61.7740.5670.12230.13390.91
F1187.525.12.0110.5000.14560.14361.01
F2187.525.12.0110.5000.14040.14360.98
[1]R12-1196.732.70.5990.8700.00350.00520.67
R13-1192.229.40.8990.8700.00400.01720.23
R14-1196.129.31.1980.8700.00470.00910.51
[20]S6 × 6-2.6-0.85145.09.62.6000.8500.15700.15830.99
S6 × 6-1.7-0.85145.09.61.7000.8500.12150.13580.89
S6 × 6-1.7-0.65145.09.61.7000.6500.13150.12831.02
S6 × 6-0.6-0.85145.09.60.6000.8500.06560.07840.84
S4 × 6-3.9-0.75145.09.63.9000.7500.18050.19120.94
S2 × 6-1.8-0.50145.09.61.8000.5000.08120.09300.87
[51]F1146.07.92.3010.8680.13240.13530.98
F2146.07.91.6900.8680.09360.11630.80
F3146.07.61.1740.8680.07300.08940.82
F4146.07.40.7510.8680.06160.06161.00
[52]U-B3193.07.10.9410.8700.00350.01240.28
U-B5193.07.11.2550.8700.00460.01220.38
Min170.017.01.5550.755 μ 0.83
Max196.732.73.9000.870 σ 0.23
Publisher’s Note: MDPI stays neutral with regard to jurisdictional claims in published maps and institutional affiliations.

