Article

Organization of Students and Total Task Time: External and Internal Load Recorded during Motor Activity

by
Juan M. García-Ceberino
1,2,
Sebastián Feu
1,3,*,
Antonio Antúnez
1,4 and
Sergio J. Ibáñez
1,4
1
Optimization of Training and Sports Performance Research Group (GOERD), University of Extremadura, 10003 Cáceres, Spain
2
Faculty of Humanities and Social Sciences, University of Isabel I, 09003 Burgos, Spain
3
Faculty of Education, University of Extremadura, 06006 Badajoz, Spain
4
Faculty of Sports Science, University of Extremadura, 10003 Cáceres, Spain
*
Author to whom correspondence should be addressed.
Appl. Sci. 2021, 11(22), 10940; https://doi.org/10.3390/app112210940
Submission received: 8 October 2021 / Revised: 16 November 2021 / Accepted: 17 November 2021 / Published: 19 November 2021

Abstract

:
The organization of the students and the time taken to execute the learning tasks determine the physical (external load) and physiological (internal load) demands the students support during physical education classes. The aim of this study was to determine which organizational and pedagogical elements used to design different learning tasks for soccer provoke greater external (Player Load (PL)) and internal (Heart Rate (HR)) load and thus help the students to fulfil the adequate physical activity recommendations (moderate to vigorous physical activity for ≥50% of class time). The organizational elements studied were (1) the participation type and (2) total task time, and the pedagogical element of (3) the game situation. A total of 40 students from the fifth year of primary education participated in the study distributed into two class groups. The basic analysis units were the data on physical activity recorded in each of the tasks carried out by the students during the practical sessions (1500 records), and they were recorded using WIMU ProTM inertial movement devices. A descriptive and inferential analysis was performed with the Mann–Whitney U and Kruskal–Wallis H statistical tests. The results recommend the following types of tasks with simultaneous participation: individual games, numerical inequality SSG, numerical equality SSG lasting less than 6 min, numerical equality SSG, and full games lasting between 6 and 10 min. This type of learning task makes the students move more (medium Player Load between 0.80 and 1.20) and at greater intensities (Heart Rate zone 4, between 161 and 181 bpm). Therefore, physical education teachers must take into account the pedagogical and organizational elements studied to make the sessions more intense and associated with health benefits.

1. Introduction

Health and educational authorities are concerned with the high levels of sedentariness and lack of physical activity that cause health problems in young people, like the appearance of being overweight and obesity [1]. Physical education (PE) provides a suitable framework for performing regulated and participatory physical activity, as well as maintaining a healthy life style [2]. This is because it is the only moment when students are obliged to carry out physical activity. In primary education, the educational system in Extremadura (Spain) stipulates between two and three PE classes per week with a one-hour duration for each (DOE, 114, 16 June 2014).
PE should pursue the integral development of the students, which is that they develop cognitively, socially, emotionally, and physically [3]. Focusing on the physical and physiological demands, these can be measured with workloads: the external load (eTL) and internal load (iTL) [4]. The eTL refers to the physical demands that the students are going to be exposed to (i.e., the observable part of their behavior). Moreover, the objective eTL is classified into kinematic loads, which analyze the locomotion and its intensity (distances, accelerations, speed ranges, etc.), and neuromuscular loads, which aim to analyze the forces exerted by the players as a consequence of their interaction with gravity and their opponents (Player Load (PL), impacts, etc.) [5,6]. This eTL can be measured with inertial movement devices, which permit the valid and reliable analysis of kinematic and neuromuscular efforts during sports practice [7,8,9]. The iTL, on the other hand, refers to the physiological demands that can be measured objectively using the Heart Rate (HR), which indicates the intensity of the exercise [10]. The HR can be obtained using inertial devices and synchronized HR monitors [11].
A sport is an important educational means to teach students sports habits and healthy life styles [2]. Invasion sports can help to attain suitable intensity levels associated with cardiovascular improvements and health [12]. In this vein, the American Heart Association [13] suggests an HR with the following values: moderate to vigorous physical activity (MVPA = 50–70% HRmax) and vigorous physical activity (VPA = 70–85% HRmax). MVPA refers to walking briskly, while VPA is approximately equivalent to jogging. Below these levels of physical activity are light-intensity activities performed while sitting or relaxing, like watching television or working on the computer. Equally, according to the type of intensity of the physical activity performed in PE classes, the students should spend at least 50% of the time recording MVPA values for adequate cardiovascular work in order to prevent being overweight and obesity [1]. Invasion sports are included in the Spanish study program, and they have great potential to maintain the students’ motivation while they perform a very demanding activity [14], providing greater opportunities for reaching MVPA [15]. In this sense, Kalajas-Tilga et al. [16] reported that intrinsic motivation of adolescent students toward physical education should be increased to improve MVPA, since there is a relationship between the two.
As well as the sports performed in PE classes, the contents and the type of session planned influence the intensity levels attained by the students and thus the percentage of time that they are working at MVPA levels [12]. Therefore, when designing practical sessions, the teacher should pay attention to the different elements or parameters to reach high levels of intensity, like the teaching methodology, the teaching means, the type of participation and grouping of the students, the spatial, temporal and material organization, as well as the sequencing of the learning tasks in the practical sessions [17,18,19]. The play element provokes greater participation in the students and is one of the most important elements when developing sports in school [2]. The game, more characteristic of the methodologies centered around the understanding of the game, can provide opportunities for MVPA (≥50% of the PE class time), while the traditional methodologies of direct instruction cause lower physical activity levels [20,21]. Thus, play and health are two sides of the same coin [15]. The aforementioned organizational and pedagogical elements also facilitate the teaching–learning process and the attainment of educational objectives.
Some of these elements have been studied to discover the intensity levels (iTL-HR) of PE classes both in primary and secondary education, in the former to compare the HRs after the implementation of two teaching programs, each based on a different technical and tactical methodology and directed toward the teaching of basketball [22] and soccer [23], to contrast the HRs and the percentage of time that the students were recording MVPA values, taking into account the type of participation—consecutive (rows) and simultaneous (circuits)—after practicing different motor abilities like locomotion, jumps, shooting, and receiving [24], or to understand the effects of formative soccer programs based on Small-Sided Games (SSGs) and strength training compared with SSGs on the HR [25]. In secondary education, we also analyze the differences between the HR and the percentage of time the adolescents recorded MVPA values after playing in two situations or play formats—SSGs and large-sided games or full games [14]—or determine the time spent in MVPA values according to the sport discipline: individual sports, team sports, traditional games, and dances [12].
The PL-eTL has not been studied a great deal in the specific context of PE. This may be due to the lack of material resources available to teachers, their high cost, or even to their lack of awareness of them. As far as we could discover, only three studies have analyzed this variable, with the aim of comparing the resulting PL after implementing different teaching programs for teaching the invasion sports of basketball [18,22] and soccer [23] in primary education. A review of the scientific literature shows that the study of the iTL (HR and percentage of time spent in MVPA values) is more common than the analysis of the PL-eTL in the educational context. The PL-eTL has attracted more interest in the out-of-school context or in sports training for juvenile players [11,26,27].

2. Objective and Hypotheses

The planning of the tasks that make up the PE class and their relations with students’ physical activity seek to guarantee healthier classes. Thus, the objective of this investigation was to identify what organizational and pedagogical elements used in the design of different soccer learning tasks provoke higher values of eTL-PL and iTL-HR and thus help to fulfil the recommendations of suitable physical education for health (MVPA). We hypothesized that (1) simultaneous participation will result in a higher PL and HR than consecutive participation, (2) learning tasks of less than 6 min will result in the highest PL and HR, (3) SSGs and full games are the game situations that will result in the most PL and HR, and (4) SSGs and full games with simultaneous participation and a duration between 6–10 min are the tasks that will provoke the highest PL and HR. Load values may differ when analyzing (only) the total task time (Hypothesis 2) or in interaction with other variables (Hypothesis 4).

3. Materials and Methods
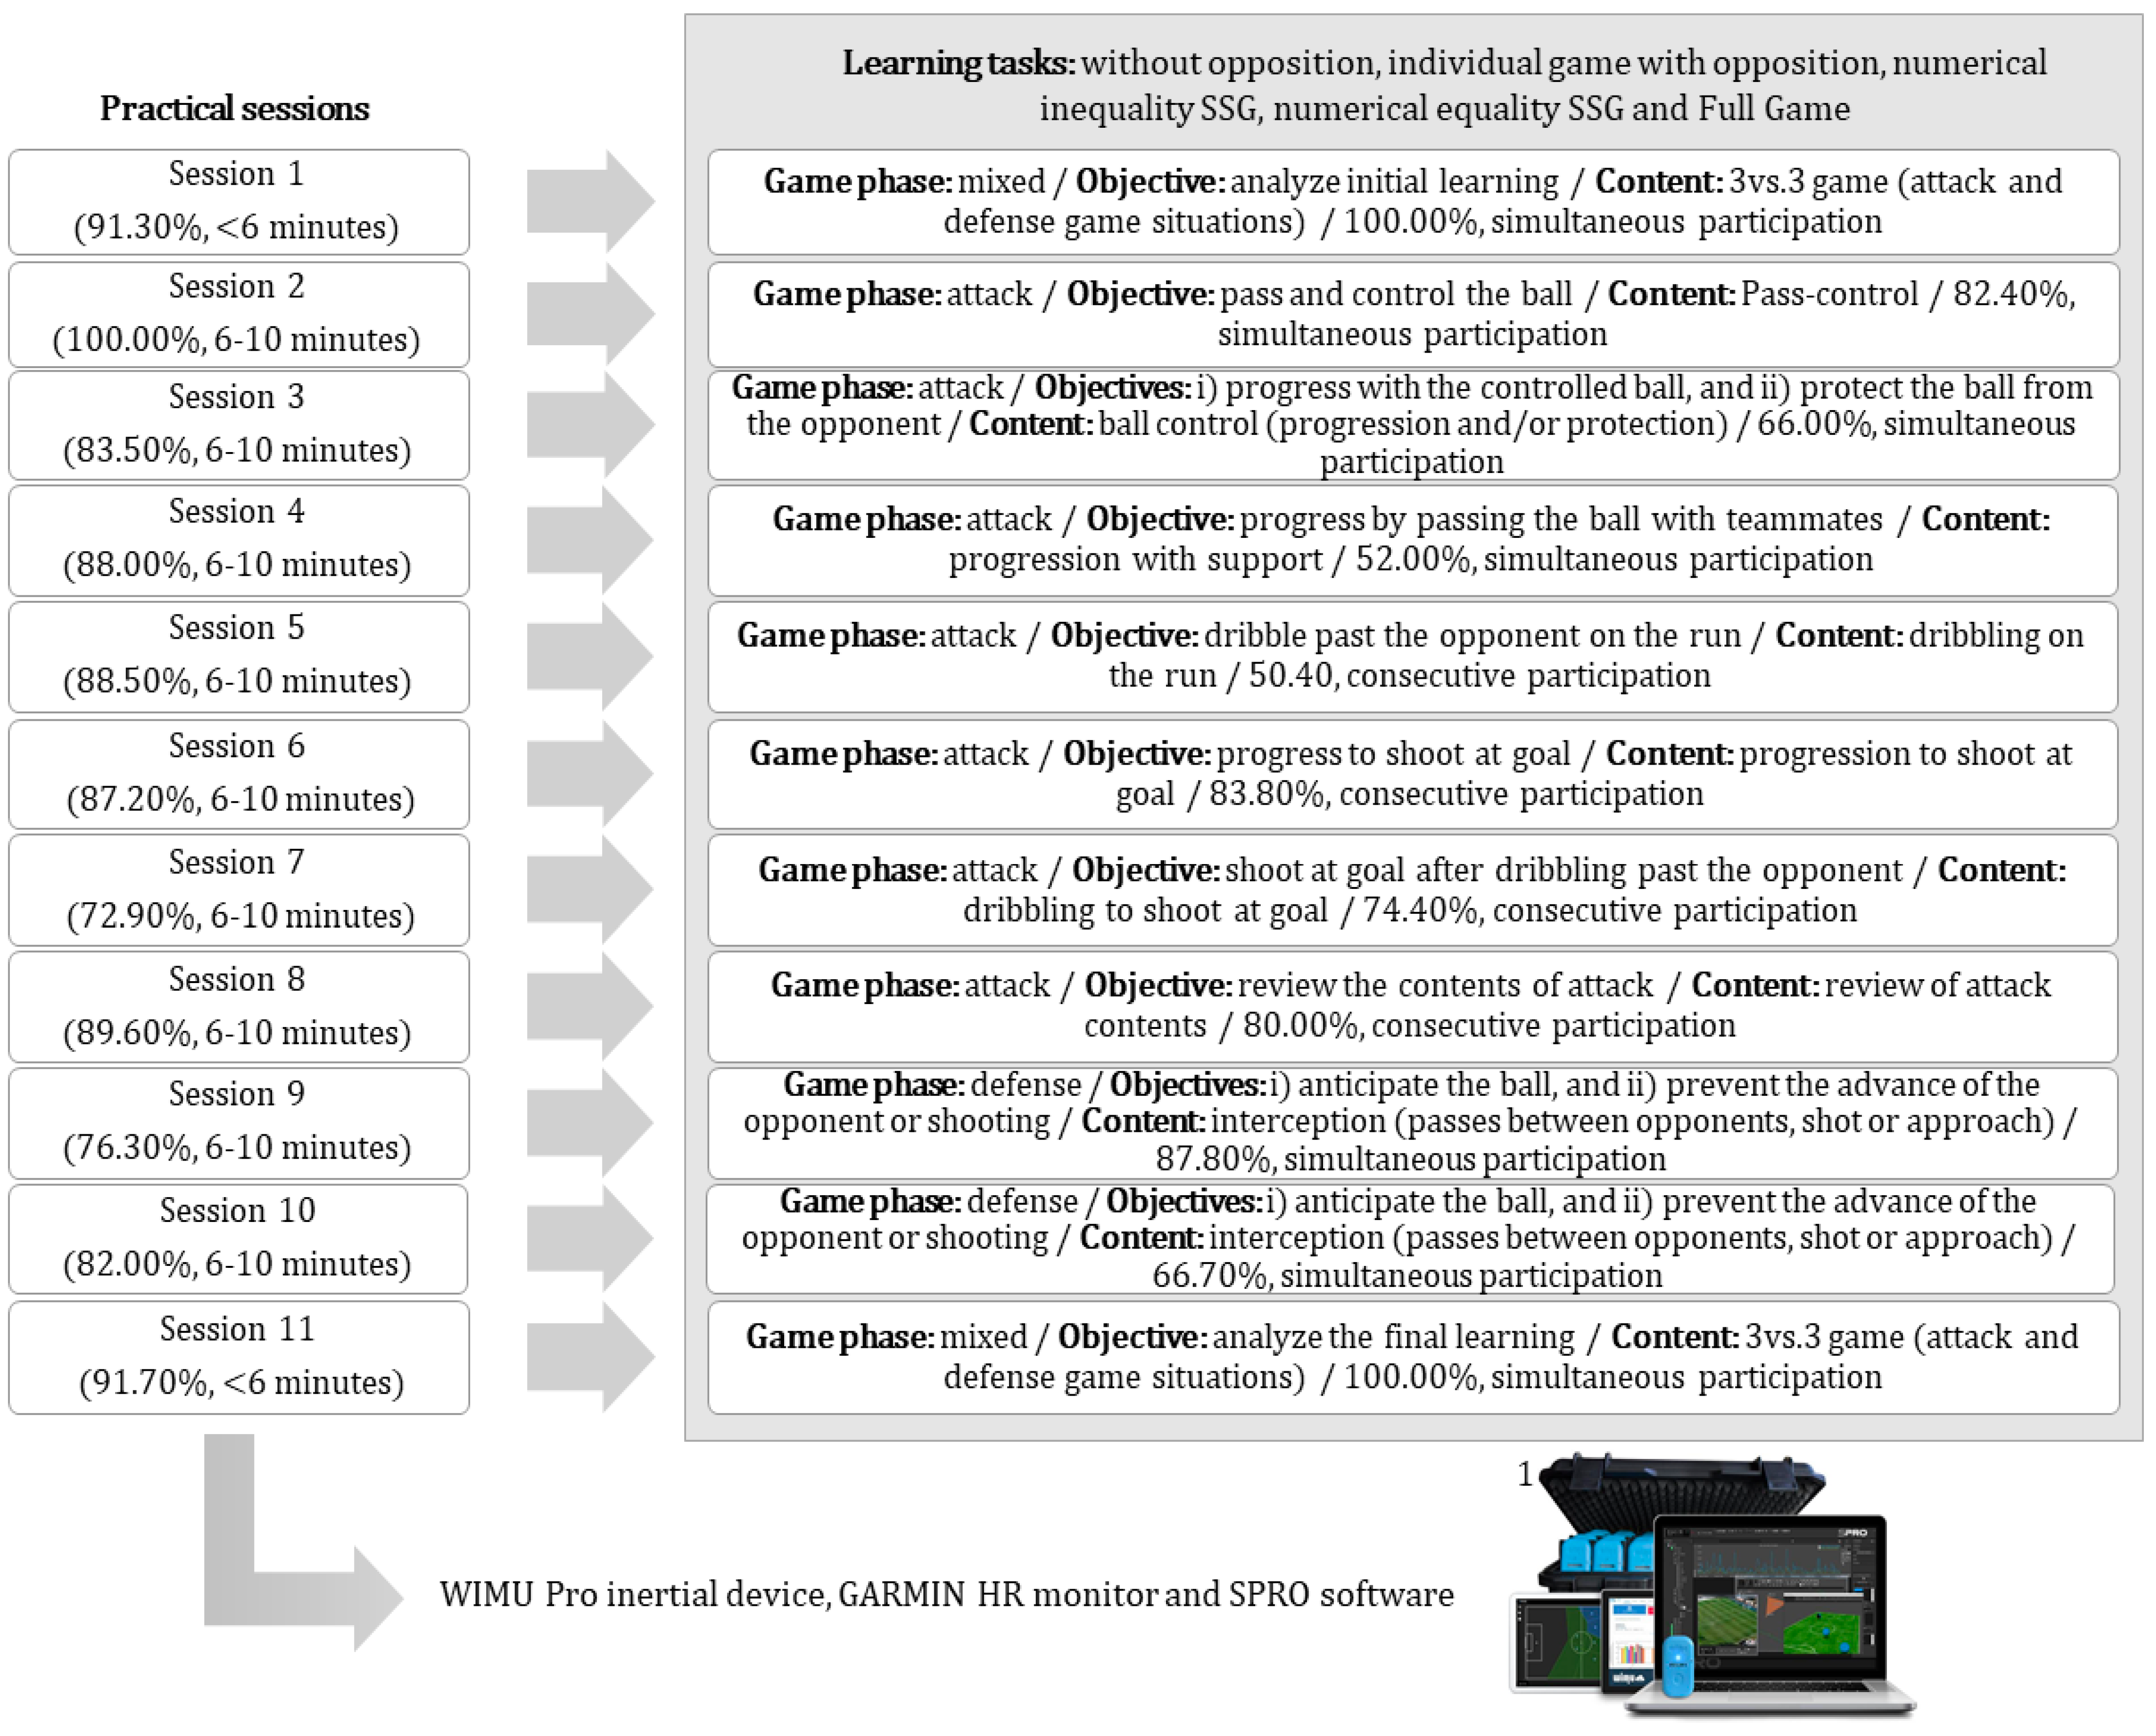
3.1. Study Design

A quasi-experimental, cross-sectional study was conducted [28] to analyze students’ eTL-PLs and iTL-HRs according to the elements of (1) participation type, (2) total task time, and (3) game situation after being taught school soccer. It is worthy of note that this study did not aim to analyze the time that the students spent in MVPA values (≥50%) in each of the practical sessions, but to determine what type of learning tasks were most appropriate so that students could attain higher levels of PL and HR and so students could increase their chances of achieving adequate MVPA values.

3.2. Participants, Sample, and Setting

Students. A total of 40 students (22 boys and 18 girls) of ages 10 and 11 (M ± SD, 10.65 ± 0.48 years) from the fifth year of primary education at a state school in the southwest of Spain participated in the study. The selection of the participants was intentional, as the school where the study was developed only had two class groups for the fifth year. To be able to be selected as part of the sample of the study, it was necessary for them to have participated in at least 80% of the practical sessions. In this case, there was no experimental mortality.
The students were distributed in two class groups: Group A from the fifth year (8 boys and 12 girls) and Group B from the fifth year (14 boys and 6 girls). The Spanish educational system establishes a mixed and heterogeneous distribution of students and forbids segregation by gender. Neither of the class groups were modified to maintain the ecological validity of the study. It was not intended to look for different intergroups.
The study was conducted according to the guidelines of the Declaration of Helsinki of 1975 and Organic Law 3/2018 of 5 December on the Protection of Personal Data and Guarantee of Digital Rights (BOE, 294, 6 December 2018) in order to guarantee the ethical considerations for scientific investigations with human beings.
Sample. The basic analysis unit was the recording of the students in each type of task carried out during the 11 sessions devoted to teaching soccer (Figure 1), totaling 1500 recordings. These were collected using inertial motion devices.
Setting. All the practical sessions of the intervention were given on an outdoor futsal court measuring 40 m × 20 m, a typical size for primary schools in Spain. In order for the students to be able to hydrate, the court had a drinking fountain. The mean temperature recorded during the practical sessions was 19 °C (minimum: 15 °C; maximum: 24 °C). The intervention lasted three months (from April to June) with one or two weekly practical sessions.

3.3. Variables

The independent variables of the study were the following: (1) participation type (i.e., consecutive (organization in rows and students participating one by one) and simultaneous (groups organization and all students participating at the same time)), where the type of participation was linked to the teaching style employed by the teacher. Thus, in the direct command teaching style, students would be grouped in rows, and with the assignment of tasks, the organization of students was more flexible (simultaneous) [29]. (2) The total task time was established in three categories: <6 min, 6–10 min, and >10 min. Finally, there was (3) the game situation, which was grouped into five categories: task without opposition (e.g., 1 vs. 0 or 2 vs. 0), individual game with opposition (i.e., 1 vs. 1), numerical inequality SSGs (e.g., 2 vs. 1 or 3 vs. 2), numerical equality SSGs (e.g., 2 vs. 2 or 3 vs. 3), and full games (i.e., 5 vs. 5) [30]. SSGs refer to Small-Sided Games, while full games refer to more realistic game situations [31].
A total of 18 dependent variables were recorded in this study, grouped into eTL and iTL variables. The kinematic variables of the eTL used were the (1) number of accelerations (Acc), (2) accelerations per minute (Acc/min), (3) maximum acceleration (Accmax), (4) average acceleration (Accavg), (5) number of decelerations (Dec), (6) decelerations per minute (Dec/min), (7) maximum deceleration (Decmax), and (8) average deceleration (Decavg). The neuromuscular variables of the eTL were the (1) integral PL (PL) (i.e., the total accelerations produced in the three planes of motion) and (2) integral PL per minute (PL/min).
The Acc/min and Dec/min variables quantified the velocity changes, both positive and negative, during sports practice. They were calculated using the following formula [32]:
a ¯ = v v 0 t
In addition, the PL variable was calculated from the accelerations through the following formula [9]:
P L n = ( x n x n 1 ) 2 + ( y n y n 1 ) 2 + ( z n z n 1 ) 2 100
The iTL variables recorded were the (1) maximum HR (HRmax), (2) average HR (HRavg), (3) percentage of time spent in the 50–60% HR range (50–60% HRmax), (4) percentage of time spent in the 60–70% HR range (60–70% HRmax), (5) percentage of time spent in the 70–80% HR range (70–80% HRmax), (6) percentage of time spent in the 80–90% HR range (80–90% HRmax), (7) percentage of time spent in the 90–95% HR range (90–95% HRmax), and (8) percentage of time spent in the 95–200% HR range (95–200% HRmax). Each of these ranges corresponded to a different HR zone (1–6, respectively). According to the age of the participants, the HRmax recorded by the HR monitors was 201 beats per minute (bpm), coinciding with the scientific literature indicating that the maximum HR in children can be higher than 200 bpm [13,33].
It was necessary to know the percentage of time that the students spent in the different HR zones. These zones depended on the intensity of the motor activity performed. The MVPA (50–70% HRmax; 100.50–140.70 bpm) and VPA (70–85% HRmax; 140.70–170.85 bpm) were also calculated using the HRmax variable. This variable could be used as an indicator for the determination and dosage of physical activity.

3.4. Instruments

The learning tasks performed during the intervention were previously designed and categorized [34], using the Integral Analysis System of Training Tasks in Invasion Sports [30]. Moreover, these learning tasks were validated by a panel of experts in the field of sport pedagogy, obtaining excellent values both for the content validity (V ≥ 0.69) and internal consistency (α = 0.97) [35].
WIMU ProTM (RealTrack System, Almería, Spain) inertial devices were used to record the eTL and iTL variables. These are recording devices that synchronize with a GARMINTM HR monitor, making it possible to monitor physical activity and movement in real time. They use different sensors (four accelerometers, a magnetometer, a gyroscope, GNSS, and UWB, among others) to record the data. These data are subsequently converted into quantitative variables using SPROTM (RealTrack System, Almería, Spain) software. These inertial movement devices were used previously in the school setting [18,22,23] and have been shown to be valid and reliable [36,37].

3.5. Procedure

First, it was necessary to acquire a series of authorizations: (1) the approval of the University Bioethics Committee (Ref. 09/2018), (2) authorizations from the school and the PE teachers, (3) the approval of the school council to include this investigation in the school curriculum project, and (5) the written informed consent of the students’ parents or legal guardians.
Subsequently, the data were collected in the intervention, which was implemented by two PE teachers with experience in the field of sport pedagogy, with one in each class group: teacher 1 (Ph.D. in physical activity and sport and a licensed sport instructor for soccer initiation) and teacher 2 (doctoral student in physical activity and sport). During the intervention, comprising 11 practical sessions, the students practiced different soccer learning tasks. Each session was composed of four tasks from the simplest (e.g., 1 vs. 0 or 1 vs. 1) to the most complex (e.g., 3 vs. 3 or 4 vs. 4) [34]. The students were always equipped with a WIMU ProTM inertial device fitted into an anatomical harness and an HR monitor.
At the end of the practical sessions, the recorded data were downloaded to the SPROTM software program for analysis. However, only the data recorded from the moment when the teacher began the task to when he or she indicated that it was finished were recorded (motor involvement time). This procedure made it possible to know the workloads involved in each type of learning task. Consequently, the data recorded between the different planned tasks in each practical session (e.g., management time (placing the equipment) and rest time) and which influenced the levels of physical activity of each PE session were not analyzed.
The contents of attack and defense worked on in the practical sessions are displayed in Figure 1.
Lastly, a descriptive and inferential analysis was made of the eTL and iTL variables according to the type of participation, total task time, and situation or game format. Similarly, using HRmax, the ranges were calculated to determine the values of MVPA or VPA and establish interconnections among the organizational and pedagogical study elements, with the aim of identifying the soccer learning tasks that were most suitable to promote high levels of intensity in PE.

3.6. Statistical Analysis

The tests for the assumption of criteria indicated the use of non-parametric mathematical models to confirm the hypothesis (p < 0.05) [38].
An inferential and descriptive analysis with means and standard deviations were subsequently performed on the study variables. The Mann–Whitney U test was used to compare these variables according to the type of participation (two categories), as well as the Kruskal–Wallis H statistical test to compare them according to the total time of the task (three categories) and the situation or format of the game (five categories) [38]. The effect size was analyzed with Rosenthal’s r (for the Mann–Whitney U test) and the epsilon squared coefficient (for the Kruskal–Wallis H test) [39,40].
The multiple pairwise comparisons [38] were only performed with the PL/min and HRavg variables, as they were the ones that most exactly represented the eTL and iTL, respectively. PL/min was used to normalize the data according to the time.
There are no studies in the scientific literature that show the ranges for considering a PL (low, medium, or high). Therefore, K-means clustering [38] was used with the PL/min variable to identify these ranges for teaching soccer in the specific context of PE, obtaining 5 ranges: very low PL (0.00–0.40), low PL (0.40–0.80), medium PL (0.80–1.20), high PL (1.20–1.60), and very high PL (>1.60). With regard to the HR, the learning task intensity was identified using the HRavg recorded in the different HR zones (Table 1), thus determining if the physical activity was light, MVPA, or VPA.
Statistical significance was set at p < 0.05. The statistical analysis was performed with SPSS 25.0 (IBM Corp, released 2017; IBM SPSS Statistics for Windows, Version 25; IBM Corp.; Armonk, NY, USA).

4. Results

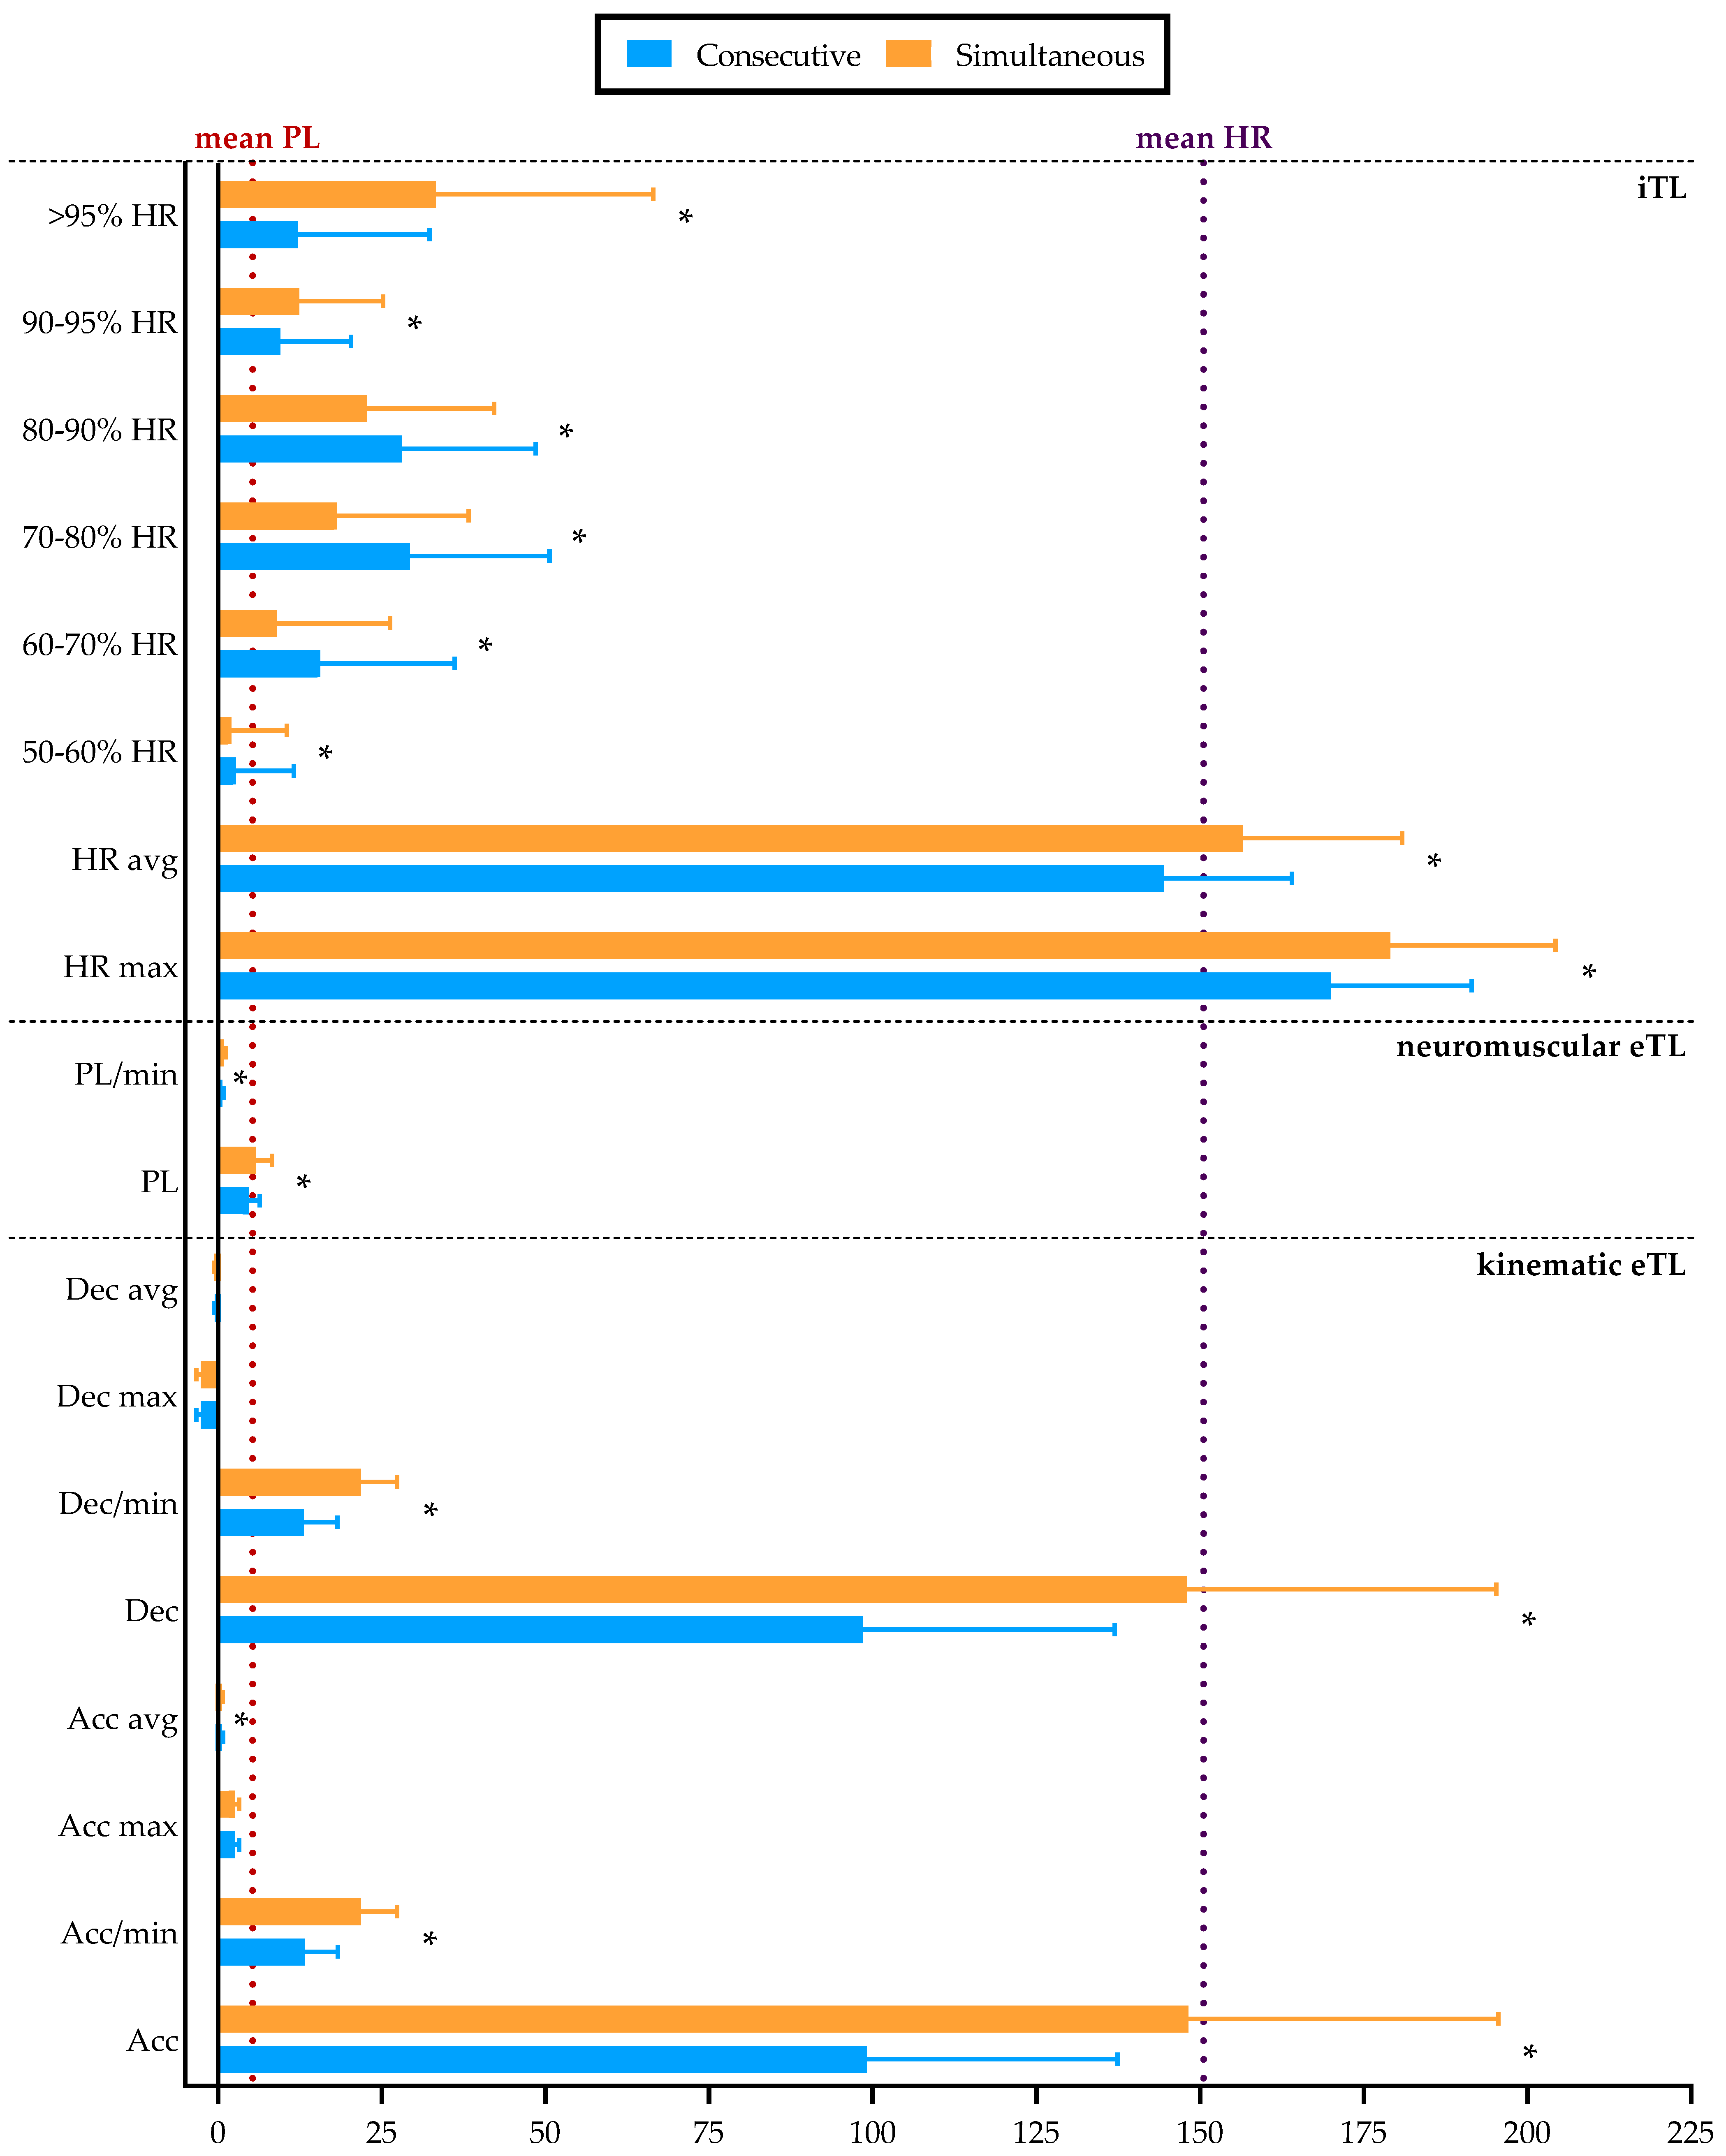
4.1. eTL and iTL Variables According to the Type of Participation

Figure 2 shows the descriptive results of the study variables. Simultaneous participation recorded a higher total number for Acc, Dec, Acc/min, and Dec/min, in turn causing PL and PL/min to be higher.
HRmax and HRavg were also higher with simultaneous participation, where students spent a greater percentage of time working with an HR > 191 bpm, Z6 (33.26%). In contrast, consecutive participation implied a larger percentage of time working at an HR between 141 and 161 bpm, Z3 (29.34%).
The inferential results (Table 2) show statistically significant differences in the PL/min (eTL) and HRavg (iTL) variables in favor of simultaneous participation.

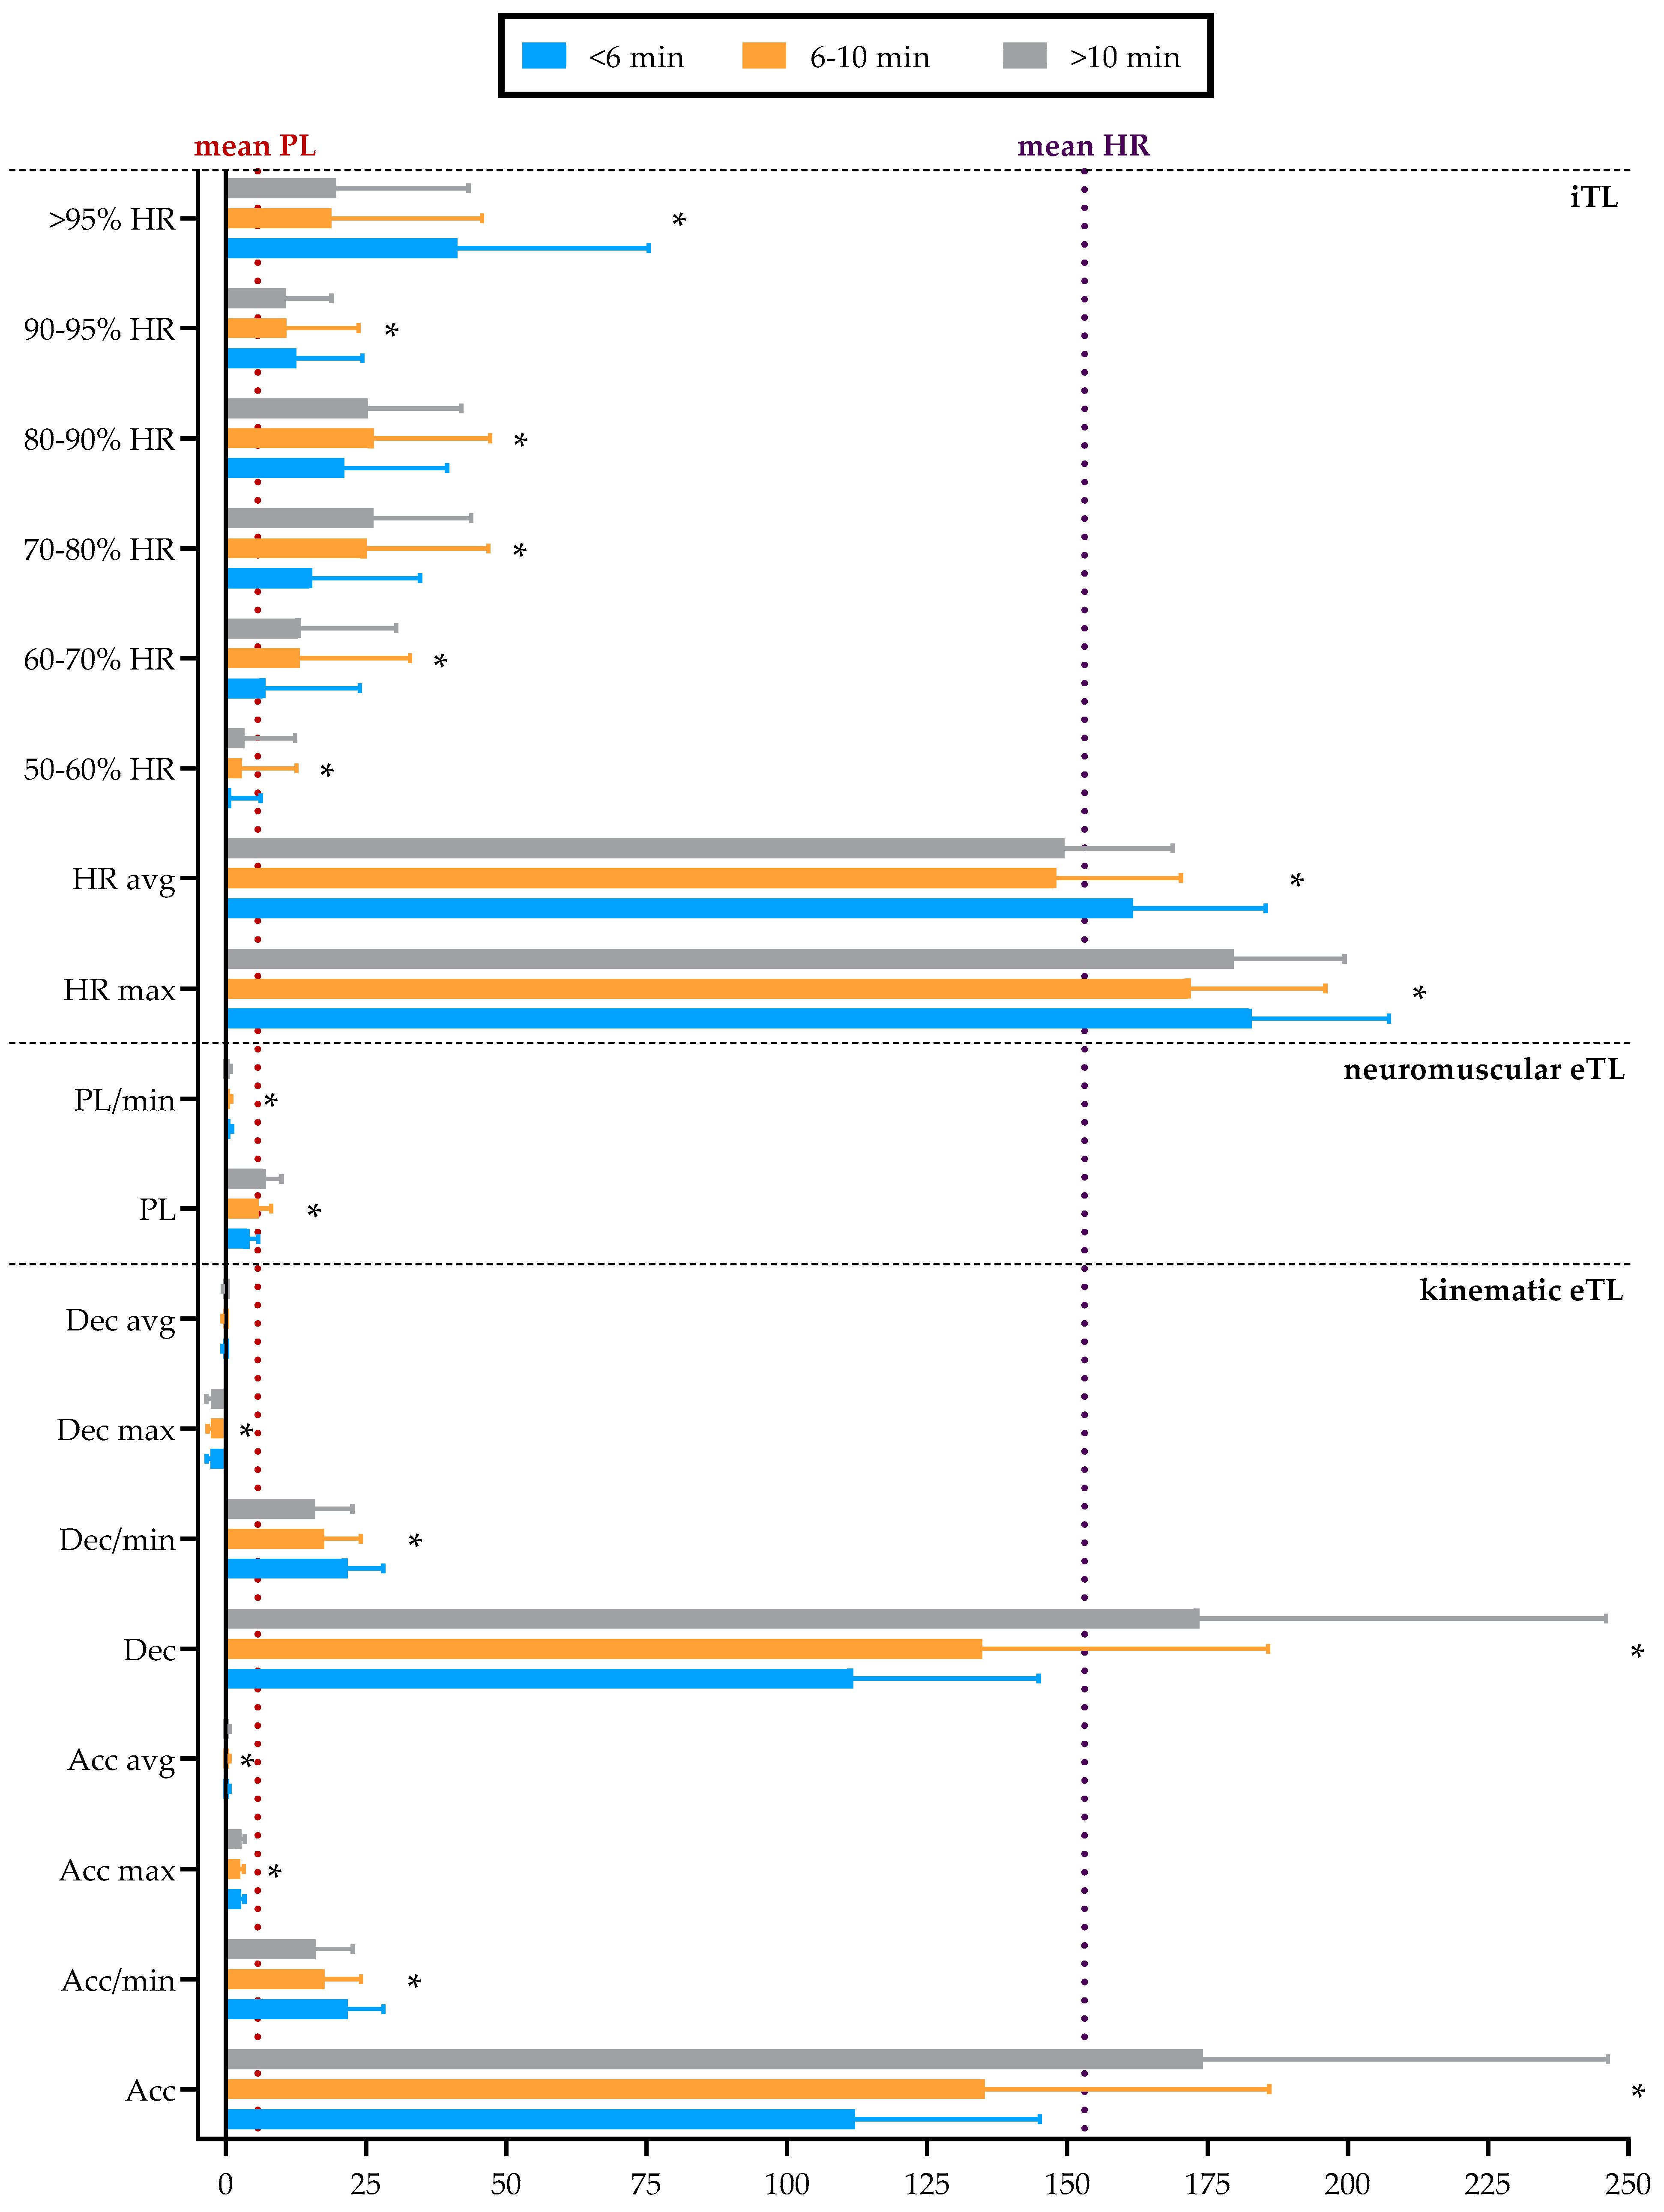
4.2. eTL and iTL Variables According to the Total Task Time

The descriptive results according to the total task time are presented in Figure 3. The learning tasks with a duration of longer than 10 min recorded a higher number of total Acc and Dec, causing the PL to also be higher. In contrast, the total number of the Acc/min, Dec/min, and PL/min was higher in the learning tasks, lasting less than 6 min.
HRmax and HRavg were higher in learning tasks less than 6 min in duration, in which the students spent a greater percentage of time with an HR > 191 bpm, Z6 (41.27%). In contrast, the learning tasks between 6 and 10 min in duration involved a larger percentage of time working with an HR between 161 and 181 bpm, Z4 (26.40%), and the tasks lasting longer than 10 min implied a greater percentage of time with an HR between 141 and 161 bpm, Z3 (26.35%).
The inferential results (Table 3) show statistically different differences in the PL/min (eTL) and HRavg (iTL) variables in favor of the learning tasks lasting less than 6 min, as reflected in the multiple pairwise comparisons (Figure 4). These are network distance plots representing pairwise comparisons in which the distances between network nodes (average ranges) correspond to the differences between the samples. Yellow lines indicate statistically significant differences, while black lines indicate non-significant differences [38].

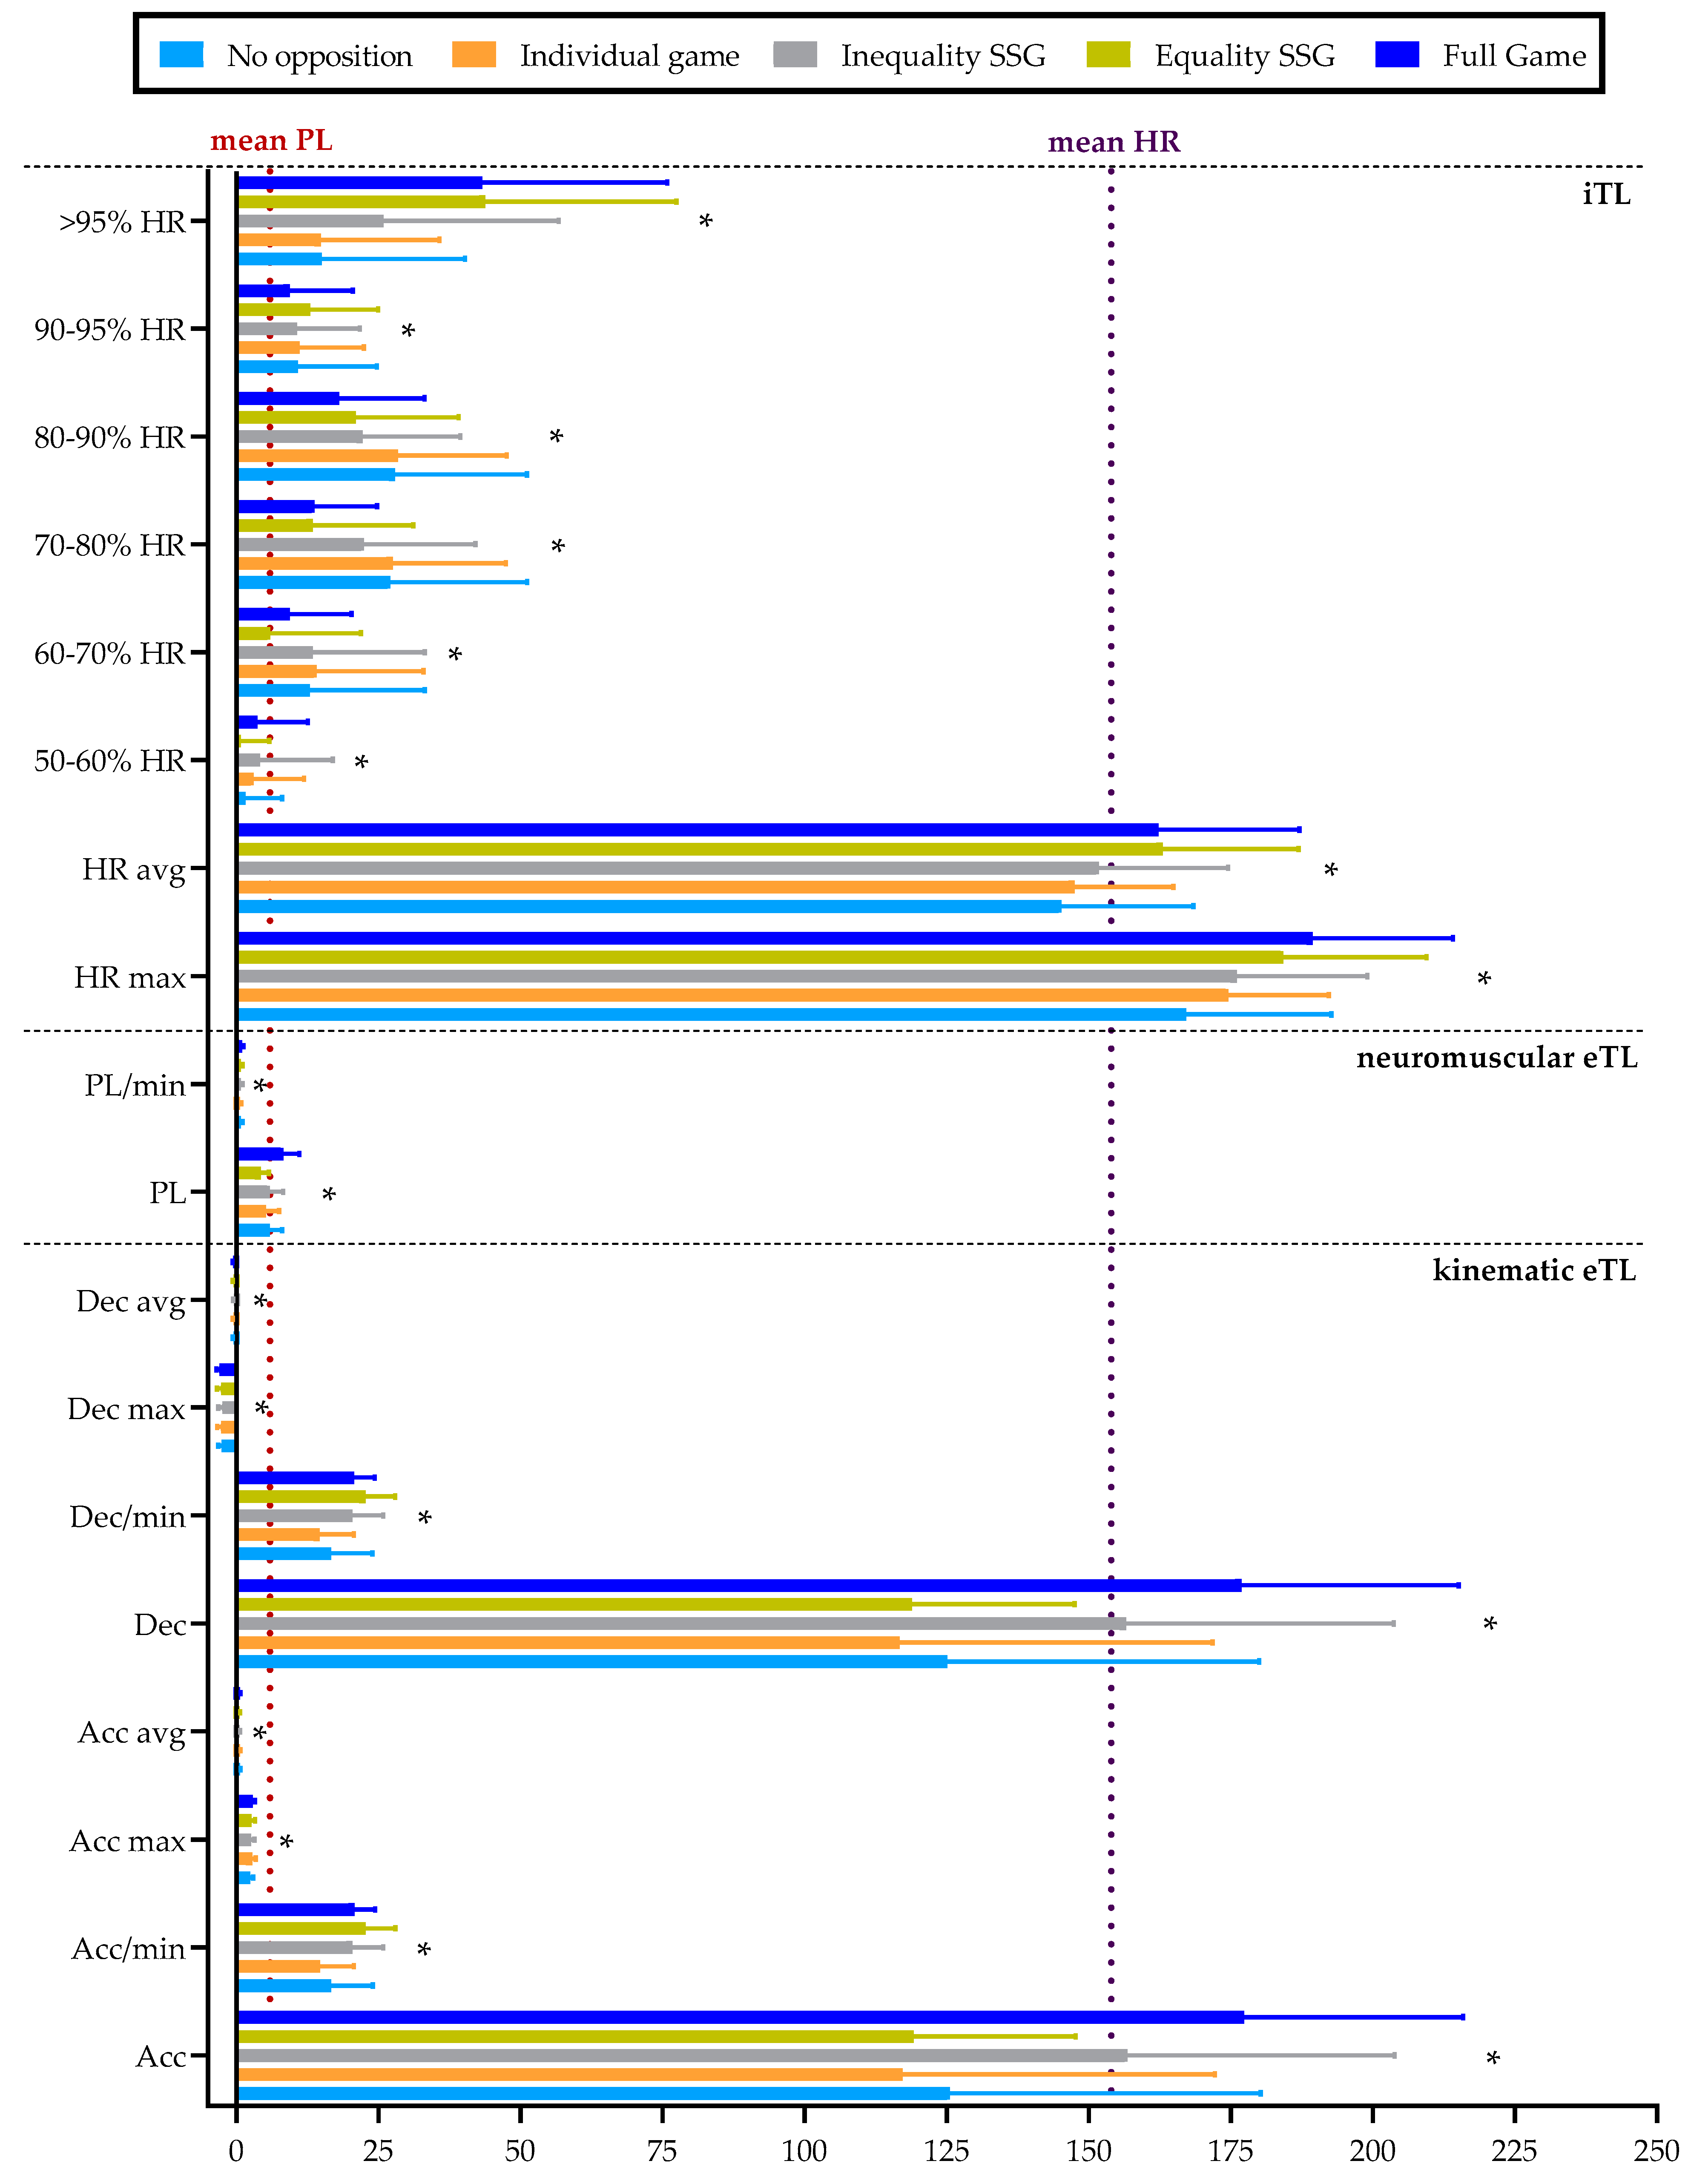
4.3. eTL and iTL Variables According to the Game Situation

Figure 5 shows the descriptive results according to the game situation. Full games imply a higher total number of Acc and Dec and, in turn, a higher PL. Equally, the numerical equality SSGs and full games recorded similar levels of Acc/min and Dec/min, as well as PL/min. These levels were higher than those of the rest of the game situations.
The numerical equality SSGs, together with full games, involved a higher HRmax and HRavg. The students spent a greater percentage of time at an HR > 191 bpm, Z6, when playing numerical inequality SSGs (25.91%), numerical equality SSGs (43.83%) and full games (43.31%). In contrast, they spent a greater percentage of time with an HR between 161 and 181 bpm, Z4 when they practiced tasks without opposition (27.95%) and individual games with opposition (28.39%).
The inferential results (Table 4) show statistically significant differences in the PL/min (eTL) and HRavg (iTL) variables in favor of numerical equality SSGs and full games.
The multiple pairwise comparisons are shown in Figure 6 as a continuation of the previous table.

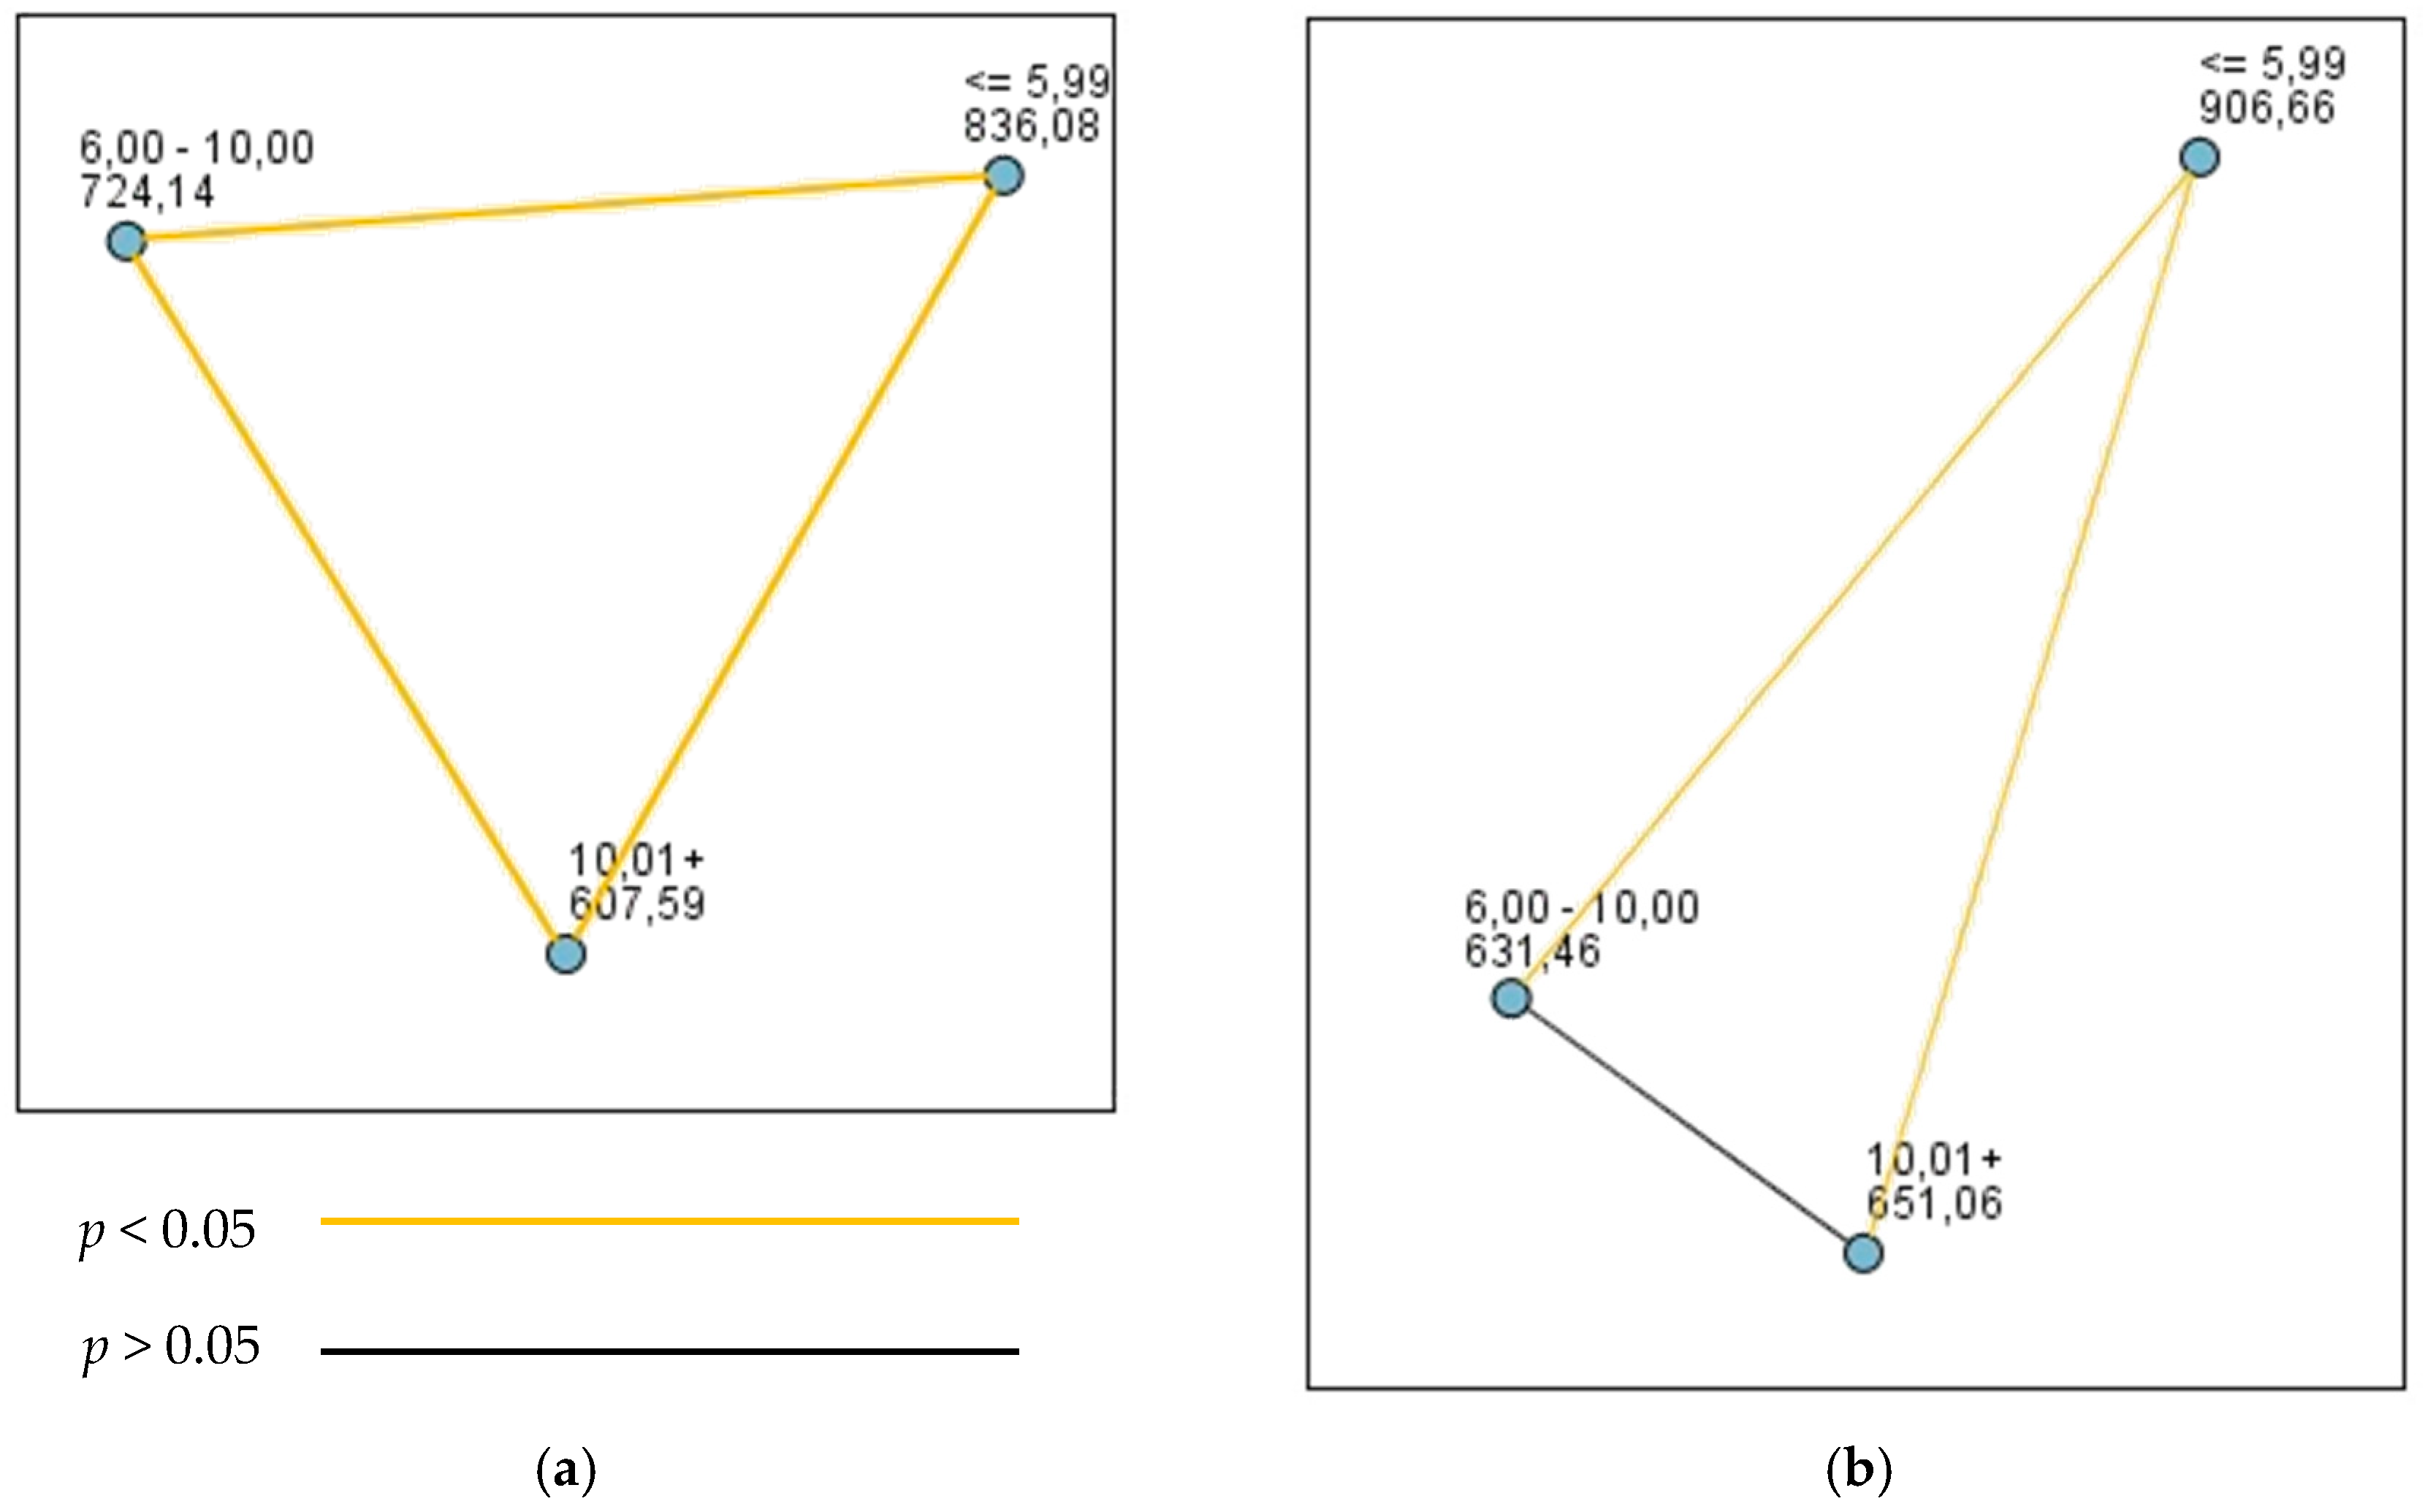
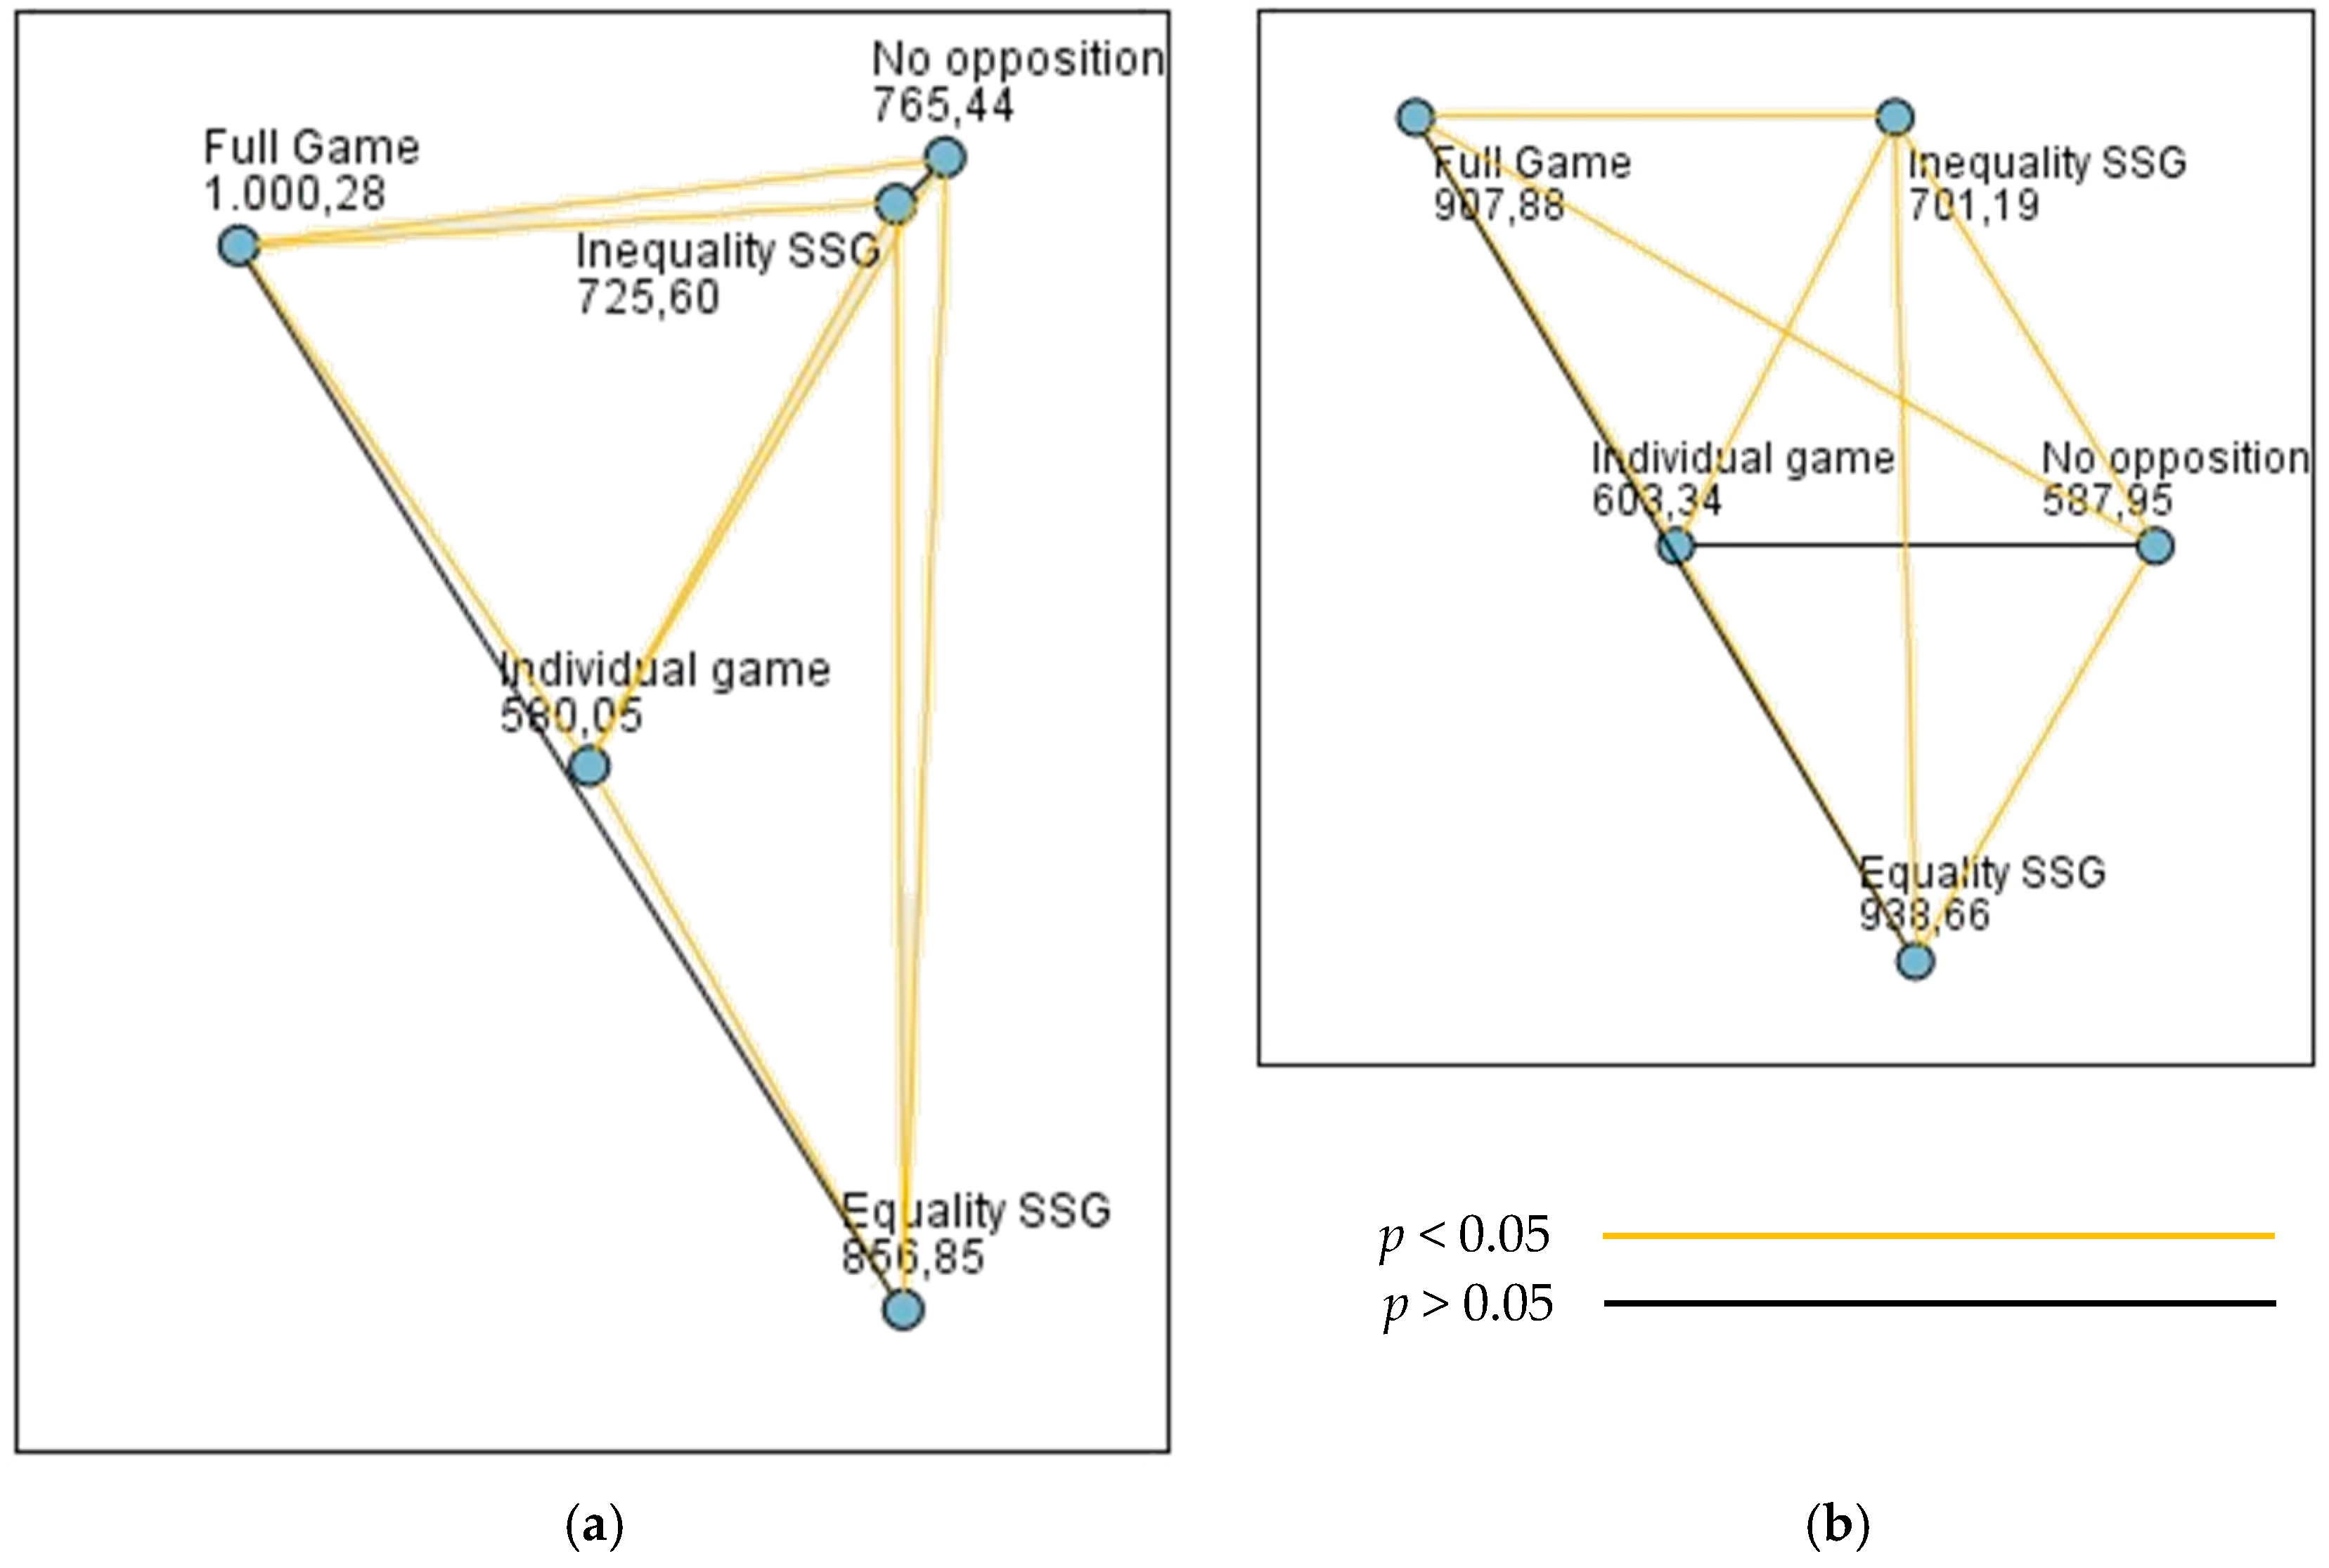
4.4. Reference Values for the PL/min-eTL and HRavg-iTL Variables according to the Interaction of the Independent Variables

By using different categories of these variables (Table 5) when designing soccer learning tasks, adequate levels of PL and HR (MVPA) can be obtained for suitable cardiovascular exercise [1].

5. Discussion

Adequate sport planning can contribute to the development of learning and students’ fitness during PE classes. The aim of the present study was to identify which organizational and pedagogical elements, when used in the design of soccer teaching tasks, provoked higher values of eTL-PL and iTL-HR and helped to fulfil the recommendations for suitable physical activity (MVPA). The most important finding showed that tasks should be used that involve simultaneous participation, specifically individual games, numerical inequality, and numerical equality SSGs when motor performance lasts less than 6 min and numerical equality SSGs and full games when lasting from 6 to 10 min. In general, numerical equality SSGs are those most recommended for school sport teaching. Thus, a greater use of the learning tasks which contain these characteristics by the teacher will provide more opportunities for the students to attain the recommended physical activity levels in the classes.
This study used monitoring with inertial movement devices to record the data, in contrast to previous studies which used direct observation techniques [15,20,41]. Regarding the HR, the American Heart Association [13] states that the maximum HR in children can be greater than 200 bpm, between 210 and 215 bpm, and varies from child to child, likely being genetically determined. Likewise, the maximum HR is higher in children than in adults and decreases progressively with age. Thus, it ranges between 195 and 215 bpm in children and the very young, and this is due to increased anaerobic demands to meet energy needs [33].

5.1. eTL and iTL Variables According to the Type of Participation

Simultaneous participation, characterized by collective organization of the students where they all take part during motor performance, provoked greater Acc, Dec, Acc/min, and Dec/min values compared with consecutive participation (rows). The load indices can be obtained from these accelerations [6]. Thus, the PL and PL/min were significantly higher with this type of participation. It has therefore been shown that when students performed the soccer learning tasks using simultaneous participation, they recorded more locomotion (i.e., they moved more), and they also spent more time working at a higher intensity (i.e., HR). Therefore, in their pedagogical action, teachers should orient the educational contents toward the design of learning tasks using this type of participation. In this way, the students will attain higher levels of physical and physiological demand.
In the specific context of primary education PE, Hellín-Martínez et al. [24] compared the effect that the type of student participation (in rows or in a circuit or simultaneous form) could have on the HR intensity of sessions working on the same content of basic motor abilities. These authors indicated that participation in circuit or simultaneous formats caused higher intensity levels in the percentage of MVPA and HRavg. In soccer teaching [23] and in basketball [22], it was shown that the type of participation also influenced students’ PL/min and HR during motor performance. After teaching soccer, participation in rows recorded a higher PL/min due to the performance of short duration sprints. However, the HR and the percentage of time spent performing high-intensity activity were higher with simultaneous participation. On the other hand, after teaching basketball, these variables were greater when simultaneous participation was used. Thus, the type of student participation in the session influenced the time for the motor performance and intensity levels [42]. In this vein, Ortega et al. [43] recommended group organization rather than rows for invasion sports.

5.2. eTL and iTL Variables According to the Total Task Time

Time organization and management in PE classes is one of the most important and complex aspects for guaranteeing efficient teaching [17]. The results show that tasks lasting less than 6 min recorded greater Acc/min and Dec/min values. and thus the PL/min value was significantly higher. Equally, the students spent a greater percentage of time working at a high intensity (i.e., HR) with this duration. As the time for the motor performance increased, the students tended to move about less, causing the task intensity to decrease as well. Thus, learning tasks that lasted less than 6 min were the most suitable for students to attain high levels of physical and physiological demand.
It is necessary to foment the optimization of PE class time, due to the influence that it has on physical activity levels and cardiovascular effort. In this same line of thought, Yuste et al. [12] found that the class time did not comply with the recommendations and was less than 50% MVPA when secondary education students practiced different sports disciplines (e.g., team sports, individual sports, traditional games, or dances). However, other previous studies [44,45] suggest that invasion sports (e.g., soccer), in contrast to individual sports, significantly influence students’ attainment of more than 50% of these recommended values, thus obtaining health benefits [1].
Positive correlations exist between the time devoted to playing and MVPA values [46]. Therefore, it is recommended that at least 70% of the session time be devoted to games [47], providing the students with more opportunities to reach suitable MVPA values [20,21].

5.3. eTL and iTL Variables According to the Game Situation

Game-based learning tasks provoke higher levels of physical activity and less sedentary behavior [15]. The results show that the students recorded greater Acc/min and Dec/min values and moved more when they played numerical equality SSGs and full games. This implied that the PL/min was significantly higher with both types of situations, and the percentage of time working at a high intensity (i.e., HR) was also greater. SSGs in sports like soccer increase the opportunity for vigorous activity, because the greater contact of the students with the ball raises their HRs [48]. This higher HR is due to the fact that, at the physiological level, there is more involvement of the large muscle groups for longer periods, so the heart beats faster to satisfy the oxygen demand [49]. Similarly, SSGs are very demanding, as HR responses are usually above 85% HRmax, thus improving aerobic performance [50]. This coincides with the results of the present study.
As well as numerical equality SSGs, the study findings recommend the use of full games, which also cause high levels of intensity during motor performance. The study developed by Póvoas et al. [14] followed this tendency, although they found that the HRavg was significantly greater in SSGs than during full games. In contrast to the present study (5 vs. 5 format), these authors referred to the 12 vs. 12 playing format as a full game. As such, the significant differences found could be due to the presence of more players, which reduced ball contact [25].
In the teaching of school soccer [23] and basketball [22], these authors determined that decontextualized tasks, isolated from the real game and without the presence of opponents (application exercises), presented less physiological demand than tasks with opposition that seek to teach an understanding of the game. This is due to the scant time for motor involvement. Therefore, it is important to emphasize again the use of play as a very important pedagogical element to attain high levels of physical activity in the students [15], always encouraging the more collaborative, recreational, and less competitive character of sports in general [2].

5.4. Reference Values for the PL/min-eTL and HRavg-iTL Variables According to the Interaction of the Independent Variables (Practical Applications)

Using the studied elements, a series of guidelines was established to help PE teachers design more intense PE classes and attain the recommended MVPA values: (1) set learning tasks with simultaneous participation so that the students are exercising at the same time; (2) increase the time of motor performance, which causes the students to move less (Acc, Dec, and PL per minute) and thus makes the learning tasks less intense; (3) use individual games, numerical inequality and equality SSGs lasting less than 6 min; and (4) use numerical equality SSGs and full games lasting from 6 to 10 min.
The setting of this type of learning task makes the students move more (physical demands (eTL)) and at a greater intensity (physiological demands (iTL)). It is also recommended that these play tasks represent at least 70% of the session [47] when applied to the practice of the invasion sport of soccer to increase the opportunities for MVPA.

5.5. Limitations and Future Perspectives

In this study, the number of participants is a limitation to be taken into account. In addition, the inertial devices recorded the time spent in motor activity (i.e., from the moment that the learning task began until it ended), and thus the teacher’s management time, rest between the learning tasks, etc. were not taken into account. These aspects also influence the levels of MVPA and should be considered when planning school sports teaching. In addition, each learning task was treated individually. When the load levels of several tasks in a session are considered all together, they may vary. However, the aim of this study was to establish guidelines for PE teachers, so it was necessary to analyze each type of task individually.
The intensity of the sessions at the educational stage should be studied, and from the PE area, there should be a contribution to increasing the levels of physical activity practice. For future studies, it is recommended to consider the gender of the students regarding the levels of physical and physiological demand, given that it has been shown that girls record lower PL/min [23] and HR [14] values when they play with boys. It would also be necessary to replicate this study with other invasion sports, continue with this sport, and include the learning tasks per practical session in the analysis.

6. Conclusions

In order to develop practical PE sessions that involve greater physical and physiological demands and attain adequate levels of physical activity (MVPA), it is recommended that the following organizational and pedagogical elements be considered: (1) simultaneous participation, as organizing the students to take part at the same time increases the intensity of the sessions; (2) regarding the total time of the task, the recommendation is less than 6 min, because as the duration of the task increases, the students move less and at a lower intensity; and (3) game situations associated with the time spent in motor performance, so that play tasks like individual games, numerical inequality SSGs, and numerical equality SSGs lasting less than 6 min, as well as numerical equality SSGs and full games lasting between 6 and 10 min, are recommended, with special attention paid to numerical equality SSGs. The interconnection of these elements provokes high levels of eTL and iTL, as they are the tasks that cause the students to move more and at a greater intensity. The sessions are thus more intense and associated with health benefits.

Author Contributions

Conceptualization, J.M.G.-C. and S.F.; methodology, J.M.G.-C., S.F. and S.J.I.; formal analysis, J.M.G.-C.; reviewers, S.F., A.A. and S.J.I.; writing—original draft preparation, J.M.G.-C.; writing—review and editing, S.F., A.A. and S.J.I.; visualization, J.M.G.-C.; supervision, S.F., A.A. and S.J.I. All authors have read and agreed to the published version of the manuscript.

Funding

This study has been partially subsidized by the Aid for Research Groups (GR18170) from the Regional Government of Extremadura (Department of Economy, Science and Digital Agenda), with a contribution from the European Union from the European Funds for Regional Development.

Institutional Review Board Statement

This study was conducted according to the guidelines of the Declaration of Helsinki and approved by the ethics committee of the University of Extremadura (protocol code 09/2018; 6 March 2018).

Informed Consent Statement

Informed consent has been obtained from all subjects involved in the study.

Data Availability Statement

Data will be available upon reasonable request to the corresponding author.

Acknowledgments

The authors thank the Rodeo school, the physical education teachers, and the students for participating in the research.

Conflicts of Interest

The authors declare no conflict of interest.

References

  1. Aznar, S.; Webster, T. Actividad Física y Salud en la Infancia y la Adolescencia. Guía para Todas las Personas que Participan en su Educación; Ministerio de Educacion y Cultura, Centro de Investigación y Documentación Educativa: Madrid, Spain, 2009. [Google Scholar]
  2. Gallardo, A.M.; Conde, E.; Martínez, A.J.; García, M. Organizational factors and their influence on participation in the school-age sports program from the teachers’ perspective. J. Phys. Educ. Sport 2018, 18, 1265–1270. [Google Scholar] [CrossRef]
  3. Castejón, F.J. Research on sports initiation valid for physical education teachers in-service. Retos-Nuevas Tend. Educ. Física Deporte Recreación 2015, 28, 263–269. [Google Scholar] [CrossRef]
  4. Joo, C.H.; Hwang-Bo, K.; Jee, H. Technical and physical activities of small-sided games in young korean soccer players. J. Strength Cond. Res. 2016, 30, 2164–2173. [Google Scholar] [CrossRef] [PubMed]
  5. Buchheit, M.; Lacome, M.; Cholley, Y.; Simpson, B. Neuromuscular Responses to Conditioned Soccer Sessions Assessed via GPS-Embedded Accelerometers: Insights into Tactical Periodization. Int. J. Sports Physiol. Perform. 2018, 13, 577–583. [Google Scholar] [CrossRef] [PubMed]
  6. Boyd, L.J.; Ball, K.; Aughey, R.J. Quantifying External Load in Australian Football Matches and Training Using Accelerometers. Int. J. Sports Physiol. Perform. 2013, 8, 44–51. [Google Scholar] [CrossRef] [PubMed] [Green Version]
  7. Reche-Soto, P.; Cardona, D.; Díaz, A.; Gómez-Carmona, C.D.; Pino-Ortega, J. ACELT y Player Load: Dos Variables para la Cuantificación de la Carga Neuromuscular/ACELT and Player Load: Two Variables to Quanty Neuromuscular Load. Rev. Int. Med. Cienc. Act. Física El Deporte 2020, 20, 167–183. [Google Scholar] [CrossRef]
  8. Inglés-Bolumar, P.; Pino-Ortega, J.; Bastida-Castillo, A.; Gómez-Carmona, C.D. Análisis Cinemático de las Exigencias en Futbolistas de Categoría Benjamín Mediante un Dispositivo Inercial (WIMU PROTM). Kronos 2018, 17, 1–11. [Google Scholar]
  9. Gómez-Carmona, C.D.; Bastida-Castillo, A.; Ibáñez, S.J.; Pino-Ortega, J. Accelerometry as a method for external workload monitoring in invasion team sports. A systematic review. PLoS ONE 2020, 15, e0236643. [Google Scholar] [CrossRef] [PubMed]
  10. Fox, J.L.; Stanton, R.; Sargent, C.; Wintour, S.A.; Scanlan, A.T. The Association between Training Load and Performance in Team Sports: A Systematic Review. Sports Med. 2018, 48, 2743–2774. [Google Scholar] [CrossRef] [PubMed]
  11. Gómez-Carmona, C.D.; Gamonales, J.M.; Feu, S.; Ibáñez, S.J. Estudio de la carga interna y externa a través de diferentes instrumentos. Un estudio de casos en fútbol formativo. Sport. Sci. J. 2019, 5, 444–468. [Google Scholar] [CrossRef] [Green Version]
  12. Yuste, J.L.; García-Jiménez, J.V.; García-Pellicer, J.J. Intensidad de las clases de educación física en adolescentes/Intensity of Physical Education Classes in Adolescents. Rev. Int. Med. Cienc. Act. Física El Deporte 2015, 15, 309–323. [Google Scholar] [CrossRef] [Green Version]
  13. American Heart Association. Target Heart Rates Chart. Available online: https://www.goredforwomen.org/en/healthy-living/fitness/fitness-basics/target-heart-rates (accessed on 11 November 2021).
  14. Póvoas, S.; Randers, M.B.; Krustrup, P.; Larsen, M.N.; Pereira, R.; Castagna, C. Heart Rate and Perceived Experience Differ Markedly for Children in Same- versus Mixed-Gender Soccer Played as Small- and Large-Sided Games. BioMed Res. Int. 2018, 2018, 7804642. [Google Scholar] [CrossRef] [PubMed] [Green Version]
  15. Harvey, S.; Song, Y.; Baek, J.H.; Van Der Mars, H. Two sides of the same coin: Student physical activity levels during a game-centred soccer unit. Eur. Phys. Educ. Rev. 2016, 22, 411–429. [Google Scholar] [CrossRef]
  16. Kalajas-Tilga, H.; Koka, A.; Hein, V.; Tilga, H.; Raudsepp, L. Procesos motivacionales en la educación física y la actividad física medida objetivamente entre los adolescentes. J. Sport Health Sci. 2020, 9, 462–471. [Google Scholar] [CrossRef]
  17. Rosa, A.; Carrillo, P.J.; García, E.; Moral, J.E. La organización y la gestión de la clase de Educación Física. Viref. Rev. Educ. Física 2020, 9, 81–96. [Google Scholar]
  18. González-Espinosa, S.; García-Rubio, J.; Feu, S.; Ibáñez, S. External load in basketball according to game situation and methodology. Rev. Int. Med. Cienc. Act. Física El Deporte 2020, 20, 395–417. [Google Scholar] [CrossRef]
  19. Martins, D.A.; Gonçalves, S.; Varanda, B.S.; Pereira, A.M.; da Eira, A.J.; Correia, N.M. Manipulating the number of players and targets in team sports. Small-Sided Games during Physical Education classes. Rev. Psicol. Del Deporte 2016, 25, 169–177. [Google Scholar]
  20. Smith, L.; Harvey, S.; Savory, L.; Fairclough, S.; Kozub, S.; Kerr, C. Physical activity levels and motivational responses of boys and girls: A comparison of direct instruction and Tactical Games Models of games teaching in physical education. Eur. Phys. Educ. Rev. 2015, 21, 93–113. [Google Scholar] [CrossRef]
  21. Rocamora, I.; González-Víllora, S.; Fernández-Río, J.; Arias-Palencia, N.M. Physical activity levels, game performance and friendship goals using two different pedagogical models: Sport Education and Direct Instruction. Phys. Educ. Sport Pedagog. 2019, 24, 87–102. [Google Scholar] [CrossRef]
  22. González-Espinosa, S.; Antúnez, A.; Feu, S.; Ibáñez, S.J. Monitoring the External and Internal Load Under 2 Teaching Methodologies. J. Strength Cond. Res. 2020, 34, 2920–2928. [Google Scholar] [CrossRef] [PubMed]
  23. García-Ceberino, J.M.; Antúnez, A.; Feu, S.; Ibáñez, S.J. Quantification of Internal and External Load in School Football According to Gender and Teaching Methodology. Int. J. Environ. Res. Public Health 2020, 17, 344. [Google Scholar] [CrossRef] [PubMed] [Green Version]
  24. Hellín-Martínez, M.; García-Jiménez, J.V.; García-Pellicer, J.J.; Alfonso-Asencio, M. Intensidad de las clases de educación física en función del tipo de organización: Hileras o circuito. TRANCES Rev. Transm. Del Conoc. Educ. Salud 2020, 12, 659–677. [Google Scholar]
  25. Sierra-Ríos, J.V.; Clemente, F.M.; Teoldo, I.; González-Víllora, S. Internal and External Load Variations in Young Students: Comparisons between Small-Sided Games and Small-Sided Games Combined with Strength Training during Physical Education Classes. Int. J. Environ. Res. Public Health 2021, 18, 1926. [Google Scholar] [CrossRef] [PubMed]
  26. Rojas-Inda, S. Análisis de carga interna y externa de futbolistas jóvenes en juegos reducidos / Analysis of Internal and External Load in Small Games in Young Football Players. Rev. Int. Med. Cienc. Act. Física El Deporte 2018, 18, 463–477. [Google Scholar] [CrossRef] [Green Version]
  27. Gómez-Carmona, C.D.; Gamonales, J.M.; Pino-Ortega, J.; Ibáñez, S.J. Comparative Analysis of Load Profile between Small-Sided Games and Official Matches in Youth Soccer Players. Sports 2018, 6, 173. [Google Scholar] [CrossRef] [PubMed] [Green Version]
  28. Ato, M.; López, J.J.; Benavente, A. Un sistema de clasificación de los diseños de investigación en psicología. An. Psicol. 2013, 29, 1039–1059. [Google Scholar] [CrossRef] [Green Version]
  29. Delgado, M.A. Los Estilos de Enseñanza en Educación Física. Propuesta para una Reforma de la Enseñanza; ICE Universidad de Granada: Granada, Spain, 1991. [Google Scholar]
  30. Ibáñez, S.J.; Feu, S.; Cañadas, M. Sistema integral para el análisis de las tareas de entrenamiento, SIATE, en deportes de invasión. E-Balonamo Com 2016, 12, 3–30. [Google Scholar]
  31. Reina, M.; Mancha, D.; Feu, S.; Ibáñez, S.J. ¿Se entrena cómo se compite? Análisis de la carga en baloncesto femenino? Rev. Psicol. Del Deporte 2017, 26, 9–13. [Google Scholar]
  32. Reina, M.; García-Rubio, J.; Esteves, P.T.; Ibáñez, S.J. How external load of youth basketball players varies according to playing position, game period and playing time. Int. J. Perform. Anal. Sport 2020, 20, 917–930. [Google Scholar] [CrossRef]
  33. López-Chicharo, J.; Fernández, A. Fisiología del Ejercicio; Panamericana: Madrid, Spain, 2006. [Google Scholar]
  34. García-Ceberino, J.M.; Feu, S.; Ibáñez, S.J. Comparative Study of Two Intervention Programmes for Teaching Soccer to School-Age Students. Sports 2019, 7, 74. [Google Scholar] [CrossRef] [PubMed] [Green Version]
  35. García-Ceberino, J.M.; Antúnez, A.; Feu, S.; Ibáñez, S.J. Validación de dos programas de intervención para la enseñanza del fútbol escolar/Validation of Two Intervention Programs for Teaching School Soccer. Rev. Int. Med. Cienc. Act. Física El Deporte 2020, 20, 257–274. [Google Scholar] [CrossRef]
  36. Bastida-Castillo, A.; Gómez-Carmona, C.D.; De la cruz Sánchez, E.; Pino-Ortega, J. Accuracy, intra- and inter-unit reliability, and comparison between GPS and UWB-based position-tracking systems used for time-motion analyses in soccer. Eur. J. Sport Sci. 2018, 18, 450–457. [Google Scholar] [CrossRef] [PubMed]
  37. Rico-González, M.; Los Arcos, A.; Rojas-Valverde, D.; Clemente, F.M.; Pino-Ortega, J. A Survey to Assess the Quality of the Data Obtained by Radio-Frequency Technologies and Microelectromechanical Systems to Measure External Workload and Collective Behavior Variables in Team Sports. Sensors 2020, 20, 2271. [Google Scholar] [CrossRef] [PubMed] [Green Version]
  38. Field, A. Discovering Statistics Using SPSS Statistics, 4th ed.; Sage Publications Ltd.: London, UK, 2013. [Google Scholar]
  39. Tomczak, M.; Tomczak, E. The need to report effect size estimates revisited. An overview of some recommended measures of effect size. TRENDS Sport Sci. 2014, 1, 19–25. [Google Scholar]
  40. Fritz, C.O.; Morris, P.E.; Richler, J.J. Effect Size Estimates: Current Use, Calculations, and Interpretation. J. Exp. Psychol. Gen. 2012, 141, 2–18. [Google Scholar] [CrossRef] [PubMed] [Green Version]
  41. Miller, A.; Christensen, E.; Eather, N.; Gray, S.; Sproule, J.; Keay, J.; Lubans, D. Can physical education and physical activity outcomes be developed simultaneously using a game-centered approach? Eur. Phys. Educ. Rev. 2015, 22, 113–133. [Google Scholar] [CrossRef] [Green Version]
  42. Wang, G.Y.; Pereira, B.; Mota, J. Indoor physical education measured by Heart Rate monitor. J. Sports Med. Phys. Fit. 2005, 45, 171–177. [Google Scholar]
  43. Ortega, E.; Palao, J.M.; Puigcerver, C. Frecuencia cardiaca, formas de organización y situaciones de juego en baloncesto. Rev. Iberoam. Cienc. Act. Física Del Deporte 2009, 9, 393–413. [Google Scholar]
  44. Gao, Z.; Hanno, J.C.; Carson, R.L. Middle schools students’ Heart Rates during different curricular activities in physical education. Int. Counc. Health Phys. Educ. Recreat. Sport Danc. J. Res. 2009, 4, 16–19. [Google Scholar]
  45. Sarradel, J.; Generelo, E.; Zaragoza, J.; Clemente, J.A.; Abarca-Sos, A.; Murillo, B.; Aibar, A. Gender differences in Heart Rate responses to different types of physical activity in physical education classes. Motricidad. Eur. J. Hum. Mov. 2011, 26, 65–76. [Google Scholar]
  46. Dudley, D.A.; Okely, A.D.; Cotton, W.G.; Pearson, P.; Caputi, P. Physical activity levels and movement skill instruction in secondary school physical education. J. Sci. Med. Sport 2012, 15, 231–237. [Google Scholar] [CrossRef] [PubMed]
  47. Institute of Medicine. Educating the Student Body: Taking Physical Activity and Physical Education to School; The National Academies Press: Washington, DC, USA, 2013. [Google Scholar]
  48. Gabbett, T.; Jenkins, D.; Abernethy, B. Game-based training for improving skill and physical fitness in team sport athletes. Int. J. Sports Sci. Coach. 2009, 4, 273–283. [Google Scholar] [CrossRef]
  49. Fairclough, S.; Stratton, G. Physical activity levels in middle and high school physical education: A review. Pediatric Exerc. Sci. 2005, 17, 217–236. [Google Scholar] [CrossRef]
  50. Clemente, F.M.; Wong, D.P.; Martins, F.M.L.; Mendes, R.S. Acute Effects of the Number of Players and Scoring Method on Physiological, Physical, and Technical Performance in Small-sided Soccer Games. Res. Sports Med. 2014, 22, 380–397. [Google Scholar] [CrossRef] [PubMed]
Figure 1. Attack and defense contents developed in practical sessions. Note: SSG = Small-Sided Games. 1 RealTrack System, Almería, Spain. The percentage on the left refers to the total time of the task, while the percentage on the right refers to the type of participation and indicates the most used category in each variable.
Applsci 11 10940 g001
Figure 2. Descriptive results of the variables studied independently according to the participation type. Note: eTL = external load; Acc = acceleration; Dec = deceleration; PL = Player Load; iTL = internal Load; HR = Heart Rate; min = minute; max = maximum; avg = average. * p < 0.05.
Applsci 11 10940 g002
Figure 3. Descriptive results of the variables studied independently according to total task time. Note: eTL = external load; Acc = acceleration; Dec = deceleration; PL = Player Load; iTL = internal load; HR = Heart Rate; min = minute; max = maximum; avg = average. * p < 0.05.
Applsci 11 10940 g003
Figure 4. Multiple pairwise comparisons of the PL/min and HRavg variables according to the total task time. Note: eTL = external load; PL = Player Load; iTL = internal load; HR = Heart Rate; min = minute; avg = average. (a) eTL (PL/min) and (b) iTL (HRavg).
Applsci 11 10940 g004
Figure 5. Descriptive results of the variables studied independently according to the game situation. Note: eTL = external load; Acc = acceleration; Dec = deceleration; PL = Player Load; iTL = internal load; HR = Heart Rate; min = minute; max = maximum; avg = average; SSG = Small-Sided Game. * p < 0.05.
Applsci 11 10940 g005
Figure 6. Multiple pairwise comparisons of the PL/min and HRavg variables according to the game situation. Note: eTL = external load; PL = Player Load; min = minute; iTL = internal load; HR = Heart Rate; SSG = Small-Sided Game. (a) eTL (PL/min) and (b) iTL (HRavg).
Applsci 11 10940 g006
Table 1. Reference ranges of the HRmax variable.
HR Zones% HR RangesBpm RangesPhysical Activity Intensity 1
Zone 150–60%101–121 bpmMVPA = 101–141 bpm
(50–70% HR)
Zone 260–70%121–141 bpm
Zone 370–80%141–161 bpmVPA = 141–171 bpm
(70–85% HR)
Zone 480–90%161–181 bpm
Zone 590–95%181–191 bpm-
Zone 6>95%>191 bpm
Note: HR = Heart Rate; HRmax = maximum HR; bpm = beats per minute; MVPA = Moderate to Vigorous Physical Activity; VPA = Vigorous Physical Activity. 1 Physical activity intensity according to the American Heart Association.
Table 2. Inferential results of the variables studied independently according to the participation type.
LoadVariableParticipation TypeMSDUpr
kinematic
eTL
AccConsecutive99.0838.32105,908.0000.00 *0.49
Simultaneous148.2147.33
Acc/minConsecutive13.235.0468,281.0000.00 *0.61
Simultaneous21.865.52
AccmaxConsecutive2.590.62249,493.0000.270.03
Simultaneous2.620.60
AccavgConsecutive0.610.14222,757.0000.00 *0.11
Simultaneous0.580.12
DecConsecutive98.5038.46105,442.0000.00 *0.49
Simultaneous147.9747.34
Dec/minConsecutive13.155.0768,118.0000.00 *0.61
Simultaneous21.825.52
DecmaxConsecutive−2.630.65256,895.0000.860.00
Simultaneous−2.640.68
DecavgConsecutive−0.480.12252,578.0000.470.02
Simultaneous−0.490.12
neuromus-cular eTLPLConsecutive4.721.66198,368.0000.00 *0.19
Simultaneous5.792.47
PL/minConsecutive0.630.21144,467.0000.00 *0.37
Simultaneous0.850.30
iTLHRmaxConsecutive169.9621.54166,851.0000.00 *0.24
Simultaneous179.0625.26
HRavgConsecutive144.5419.50151,934.5000.00 *0.30
Simultaneous156.5924.24
50–60% HRConsecutive2.758.82223,568.0000.01 *0.07
Simultaneous2.068.48
60–70% HRConsecutive15.6420.55181,574.5000.00 *0.20
Simultaneous8.9617.33
70–80% HRConsecutive29.3421.26158,344.0000.00 *0.27
Simultaneous18.1820.12
80–90% HRConsecutive28.0820.46198,504.5000.00 *0.13
Simultaneous22.8219.34
90–95% HRConsecutive9.5310.77203,333.5000.00 *0.12
Simultaneous12.3712.89
>95% HRConsecutive12.2520.03154,305.5000.00 *0.29
Simultaneous33.2633.23
Note: M = mean; SD = standard deviation; U = Mann–Whitney U test; r = r through the Rosenthal test; eTL = external load; Acc = acceleration; Dec = deceleration; PL = Player Load; iTL = internal load; HR = Heart Rate; min = minute; max = maximum; avg = average. * p < 0.05.
Table 3. Inferential results of the variables studied independently according to the total task time.
LoadVariableTotal Task TimeMSDX2pE2R
kinematic
eTL
Acc<6 min112.0932.9980.2610.00 *0.05
6–10 min135.2450.73
>10 min174.1072.24
Acc/min<6 min21.766.32144.9720.00 *0.10
6–10 min17.586.51
>10 min15.996.61
Accmax<6 min2.670.6219.5970.00 *0.01
6–10 min2.570.60
>10 min2.760.60
Accavg<6 min0.570.1214.0230.00 *0.01
6–10 min0.600.13
>10 min0.580.12
Dec<6 min111.8733.0778.7070.00 *0.05
6–10 min134.8450.90
>10 min173.4972.56
Dec/min<6 min21.716.34144.5050.00 *0.10
6–10 min17.536.53
>10 min15.936.63
Decmax<6 min−2.710.7110.0140.01 *0.01
6–10 min−2.600.64
>10 min−2.700.74
Decavg<6 min−0.490.122.6790.260.00
6–10 min−0.490.12
>10 min−0.460.11
neuromuscular
eTL
PL<6 min4.231.53204.6010.00 *0.14
6–10 min5.812.27
>10 min7.182.73
PL/min<6 min0.820.3030.9560.00 *0.02
6–10 min0.750.28
>10 min0.660.26
iTLHRmax<6 min182.8624.4597.8550.00 *0.07
6–10 min171.9823.96
>10 min179.6919.69
HRavg<6 min161.6823.65133.1560.00 *0.09
6–10 min147.9722.27
>10 min149.4819.32
50–60% HR<6 min0.955.2638.5500.00 *0.03
6–10 min2.869.74
>10 min3.378.98
60–70% HR<6 min7.0916.7784.5810.00 *0.06
6–10 min13.2219.60
>10 min13.4416.96
70–80% HR<6 min15.3619.2791.0700.00 *0.06
6–10 min25.0821.70
>10 min26.3517.38
80–90% HR<6 min21.0918.3522.2470.00 *0.02
6–10 min26.4020.70
>10 min25.3216.65
90–95% HR<6 min12.5111.8312.4390.00 *0.01
6–10 min10.8612.75
>10 min10.648.15
>95% HR<6 min41.2734.14130.3690.00 *0.09
6–10 min18.7826.87
>10 min19.6723.57
Note: M = mean; SD = standard deviation; X2 = Kruskal–Wallis H test; E2R = epsilon squared coefficient; eTL = external load; Acc = acceleration; Dec = deceleration; PL = Player Load; iTL = internal load; HR = Heart Rate; min = minute; max = maximum; avg = average. * p < 0.05.
Table 4. Inferential results of the variables studied independently according to the game situation.
LoadVariableGame SituationMSDX2pE2R
kinematic
eTL
AccNo opposition125.5454.72174.6280.00 *0.12
Individual game117.2254.96
Inequality SSG156.7947.04
Equality SSG119.1128.59
Full game177.3538.51
Acc/minNo opposition16.717.27311.5860.00 *0.21
Individual game14.725.97
Inequality SSG20.425.42
Equality SSG22.715.28
Full game20.793.66
AccmaxNo opposition2.430.5493.8980.00 *0.06
Individual game2.780.63
Inequality SSG2.560.63
Equality SSG2.670.60
Full game2.860.46
AccavgNo opposition0.620.1444.2450.00 *0.03
Individual game0.600.13
Inequality SSG0.570.12
Equality SSG0.560.12
Full game0.630.12
DecNo opposition125.1054.93174.8200.00 *0.12
Individual game116.6855.13
Inequality SSG156.5547.11
Equality SSG118.9228.61
Full game176.8738.22
Dec/mNo opposition16.657.30311.4560.00 *0.21
Individual game14.656.00
Inequality SSG20.395.44
Equality SSG22.675.29
Full game20.743.63
DecmaxNo opposition−2.590.5747.7370.00 *0.03
Individual game−2.680.70
Inequality SSG−2.490.70
Equality SSG−2.730.70
Full game−3.010.51
DecavgNo opposition−0.500.1226.5820.00 *0.02
Individual game−0.480.12
Inequality SSG−0.470.12
Equality SSG−0.480.12
Full game−0.560.12
neuromuscular
eTL
PLNo opposition5.852.21171.6430.00 *0.11
Individual game5.212.29
Inequality SSG5.852.38
Equality SSG4.341.40
Full game8.222.87
PL/minNo opposition0.780.2989.6730.00 *0.06
Individual game0.650.24
Inequality SSG0.770.31
Equality SSG0.830.27
Full game0.960.30
iTLHRmaxNo opposition167.1325.56168.5630.00 *0.12
Individual game174.5517.71
Inequality SSG176.0223.01
Equality SSG184.2525.22
Full game189.4024.71
HRavgNo opposition145.1723.21179.8380.00 *0.13
Individual game147.4917.38
Inequality SSG151.8222.70
Equality SSG162.9623.96
Full game162.2924.79
50–60% HRNo opposition1.656.4055.9180.00 *0.04
Individual game2.988.95
Inequality SSG4.1212.86
Equality SSG0.785.00
Full game3.748.87
60–70% HRNo opposition12.8820.31110.4660.00 *0.08
Individual game14.1418.81
Inequality SSG13.5019.68
Equality SSG5.9016.01
Full game9.3910.84
70–80% HRNo opposition27.0824.09133.1900.00 *0.09
Individual game27.5419.90
Inequality SSG22.4219.66
Equality SSG13.3917.77
Full game13.7411.05
80–90% HRNo opposition27.9523.1839.1140.00 *0.03
Individual game28.3919.18
Inequality SSG22.2217.21
Equality SSG21.0518.08
Full game18.0815.01
90–95% HRNo opposition10.7713.9320.7820.00 *0.01
Individual game11.1611.32
Inequality SSG10.6811.06
Equality SSG12.9911.96
Full game9.3511.15
>95% HRNo opposition15.0225.23198.5410.00 *0.14
Individual game14.8420.89
Inequality SSG25.9130.83
Equality SSG43.8333.60
Full game43.3132.50
Note: M = mean; SD = standard deviation; X2 = Kruskal–Wallis H test; E2R = epsilon squared coefficient; eTL = external load; Acc = acceleration; Dec = deceleration; PL = Player Load; iTL = internal load; HR = Heart Rate; min = minute; max = maximum; avg = average; SSG = Small-Sided Game. * p < 0.05.
Table 5. Reference values according to the interaction of the independent variables.
Participation TypeTotal TimeGame SituationeTL (PL/min)iTL (HRavg)
MSDVMSD1 PAIZ
Consecutive<6 minNo opposition0.77-L146.00-VPA3
Individual game0.570.22L148.1016.63VPA3
Inequality SSG-------
Equality SSG0.640.22L145.1024.79VPA3
Full game-------
6–10 minNo opposition0.690.20L143.7720.55VPA3
Individual game0.610.19L145.0918.12VPA3
Inequality SSG0.510.17L144.5715.40VPA3
Equality SSG-------
Full game-------
>10 minNo opposition-------
Individual game0.440.19L143.2719.75VPA3
Inequality SSG-------
Equality SSG-------
Full game-------
Simultaneous<6 minNo opposition-------
Individual game1.05-M169.00-VPA4
Inequality SSG1.100.33M169.4617.95VPA4
Equality SSG0.840.28M163.8823.95VPA4
Full game-------
6–10 minNo opposition0.990.33M148.0827.86VPA3
Individual game0.760.25L150.4415.79VPA3
Inequality SSG0.750.28L149.5323.13VPA3
Equality SSG0.850.16M166.0612.49VPA4
Full game0.940.32M162.2924.79VPA4
>10 minNo opposition-------
Individual game0.850.18M151.1015.99VPA3
Inequality SSG0.690.25L154.1721.01VPA3
Equality SSG-------
Full game-------
Note: M = mean; SD = standard deviation; eTL = external load; PL = Player Load; min = minute; iTL = internal load; HR = Heart Rate; V = PL/min value (ML = medium-low; L = Low; M = medium); VPA = vigorous physical activity; Z = HR zone; SSG = Small-Sided Game. 1 Physical activity intensity according to the American Heart Association.
Publisher’s Note: MDPI stays neutral with regard to jurisdictional claims in published maps and institutional affiliations.

