Abstract
Because of the significant environmental pollution produced by human activities, there is an ongoing need to develop transportable, simple, and reliable techniques for determining trace contaminants on the spot. This work reported a colorimetric detection method for aqueous Cr(VI) sensing by maleic acid-functionalized gold nanoparticles with high sensitivity and selectivity. The wine-red color of the probe solution can change to gray even in the presence of 1.0 µg L−1 of aqueous Cr(VI). Moreover, with the assistance of a smartphone installed with a commercially available color scan application software, its concentration of could be readily quantified on the spot without the help of UV-Vis spectrometer. The detection limit could reach as low as 0.1 µg L−1 with linear range from 0.2 to 2.0 µg L−1. Most importantly, the coefficient variation of the proposed smartphone-based method was equivalent to that of colorimetry, demonstrating the high accuracy of the proposed method for accurate detection of Cr(VI) in resource-constrained countries. Conclusively, with the help of the smartphone, this nanomaterials-based probe demonstrated the potential in the field of environment monitoring for on-site quantitative detection of any pollutants in resource-constrained countries.
1. Introduction
As an important metal resource in the industrial community, Chromium generally exists in the natural environment in two oxidation states, VI as in CrO42− and Cr2O72− [1,2,3,4,5,6,7]. While Cr(III) plays a vital role in maintaining normal life activities [2,3,4,5,7,8], Cr(VI) is widely recognized as a highly toxic pollutant [2,3,4,6,7,9,10] with carcinogenic [2,3,4,5,7,8,11] and mutagenic effects [4,5,7]. Cr(VI) can cause metabolic disorders and damage to the kidney and other organs [5,10,12,13,14,15,16]. Fortunately, the existing methods, including atomic absorption spectroscopy, [2,3,4,6,7,8,9,10,17,18,19,20], inductively coupled plasma-mass spectrometry [7,8,10,20,21] and inductively coupled plasma-optical emission spectrometry, [7,10,22,23], could provide an extremely sensitive, selective and reliable way for the detection of Cr(III) and Cr(VI) in real samples [7]. However, these methods usually involve tedious sample preparation, expensive equipment use, and lab-based tests [2,3,4,6,7,8,9,10,11]. Therefore, there is always an urgent demand for the development of mobile, simple and reliable methods for rapid determination of trace Cr(VI) [2,3,8,11] and other pollutants.
Analytical methods employing Gold nanoparticles (Au NPs) include colorimetry, [6,7,24,25,26,27,28,29,30,31,32], surface-enhanced Raman scattering (SERS) [33,34], and surface plasmonic resonance (SPR) [7,35] offer improved performance compared to traditional methods. Some of them have already been commercialized for practical application. For example, a portable device based on the SERS technique has been developed for on-site detection of pesticides on the surface of fruits with high selectivity and sensitivity [33]. Au NPs with rationally modified surfaces can be the base for colorimetric methods in which elaborate instrumentation is replaced by the naked eye [7,20,24,25,26,27,28,29,30,31,32]. Furthermore, due to their high extinction coefficient in the visible region, the Au NPs-based colorimetric method can be used to detect heavy metal ions selectively and sensitively [7,20,25,32,36,37,38,39,40,41,42]. For example, the Mirkin group has reported a highly selective probe for Hg2+ sensing, based on the strong coordination interaction between Hg2+ and thymine-rich DNA-functionalized Au NPs. [25] This method has a sensitivity of 20 ppb [25]. Recently, the Gao group developed a Pb2+ selective detection method using glutathione-modified Au NPs with a detection limit of about 10 nM [38]. However, a UV-Vis spectrometer is needed for quantitative colorimetric assays. The associated expense hampers practical use of the Au NPs-based visual detection method.
The smartphone, very portable and capable of high-resolution imaging, is a natural candidate for a powerful and convenient point-of-care analytical device. Specifically, smartphone-based colorimetric methods for environmental monitoring of heavy metal ions have been reported [2,11,43,44,45,46,47,48,49,50,51,52,53]. Herein, we describe an Au NPs-based colorimetric method for the detection of aqueous Cr(VI). Our assay involves an aggregation-induced color change of functionalized Au NPs in the presence of aqueous Cr(VI) (Figure 1). As we will show, with a color scan application, the smartphone can easily uncover nuances of color in solutions that the naked eye can not observe. Like the UV-Vis spectrophotometer a smartphone can quantify Cr(VI) in aqueous solution. Its detection limit can be as low as 0.1 μg L−1.
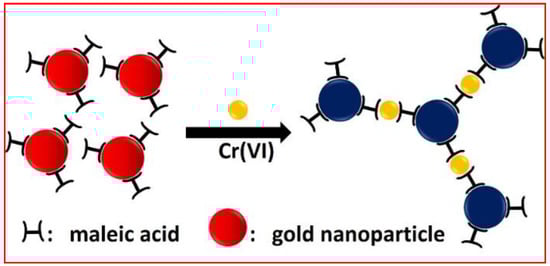
Figure 1.
Color change of maleic acid-capped gold nanoparticles induced by Cr(VI).
2. Materials and Methods
2.1. Chemicals
Chloroauric acid hydrate (HAuCl4∙4H2O) and sodium citrate were obtained from Shanghai Reagent (analytical grade). Maleic acid (MA), various metal salts (Ba2+, Ca2+, Cd2+, Co2+, Cu2+, Cr(III), Cr2O72−, Mg2+, Mn2+, Ni2+, Pb2+, Zn2+ and Al3+) were obtained from Sinopharm Chemical Reagent. All chemicals used in the experiment were used as received without further purification, and solutions were prepared using high purity water purified through a Millipore system with a resistance of 18 MΩ cm−1. All glassware was thoroughly cleaned with freshly prepared 3:1 HCl/HNO3 and rinsed with high purity water before use.
2.2. Preparation and Functionalization of Au NPs
Au NPs were synthesized according to the classic citrate-mediated reduction method [54]. Briefly, 50 mL of water containing 1 mM of HAuCl4 was heated to a boil under vigorous stirring, and 2 mL of 1% sodium citrate solution was then injected into boiling solution. After another 20 min of reaction, the boiling solution was allowed to cool down to room temperature under stirring. Finally, the obtained wine-red Au NPs colloid solution was stored at 4 °C for further use. For the functionalization, 1 mL of citrate-capped Au NPs was mixed with C maleic acid (MA) under stirring, and the mixture was allowed to stir for 2 h at room temperature under rotation. The MA-functionalized Au NPs were then purified by centrifugation and the purified and functionalized Au NPs were then dissolved in 1 mL of ultrapure water for storage as the probe solution. For storage more than 2 months, the probe should be dispersed in 1 mL of DI water containing 0.1 mM maleic acid at 4 °C. The concentration of obtained MA-capped Au NPs was determined by its absorption at 525 nm with an extinction coefficient of 2.7 × 10⁸ L·mol−1·cm−1.
2.3. Detection of Aqueous Cr(VI) by MA-Capped Au NPs
Briefly, 10 µL samples of Cr(VI) or other metal ion solutions including Ba2+, Ca2+, Cd2+, Co2+, Cu2+, Cr(III), Mg2+, Mn2+, Ni2+, Pb2+, Zn2+, and Al3+ stock solution prepared in water were added into 1 mL of MA-capped Au NPs and mixed thoroughly for 2 min by a pipette. A UV-Vis spectrophotometer was then used to collect the absorption spectrum of the solution. A smartphone equipped with color scan application software (ColorAssist Ver. 2.4, 2020 from Apple Store) was used to take the MA-capped Au NPs solution photo at room temperature. Typically, for photograph acquiring, the vial should be placed on a white paper together with white background, and glare should be avoided by changing the photographing direction. The camera should be parallel to the vial, and the distance can be adjusted according to the square pattern displayed by the app software; one need not adjust amount. The square pattern should just cover the whole transverse part of the vial. For real sample detection by the smartphone-based colorimetric method, aqueous samples collected from three local lakes (South Lake, Tangxun Lake, and Yezi Lake) were first filtered by a 0.22 µm Super filter. Atomic Absorption Spectroscopy method was then used to measure the absolute concentration of Cr(VI) in the three samples. As for smartphone sensing, 10 µL of the sample was added to 1 mL of MA-capped Au NPs, and the mixture was allowed to react for 2 min before photographing. Each measurement was done three times, and the average was presented with its standard deviation.
2.4. Characterization
The aggregation response of Au NPs after interaction with Cr(VI) was obtained by transmission electron microscopy (TEM, JEOL 2010, Tokyo, Japan) at an accelerating voltage of 200 kV. The absorption spectra of the colloid before and after interaction with metal ions were collected using a Shimadzu UV-2550 spectrometer (Shimadzu, Kyoto, Japan). A Canon-350D digital camera (Canon, Tokyo, Japan) takes optical photographs.
3. Results
3.1. Selectivity and Sensitivity Investigation of MA-Capped Au NPs to Aqueous Cr(VI)
The molecules used for Au NPs modification to effect colorimetric assays for heavy metal ions [7,32,55,56,57] all have carboxylic acid groups. Examples include 5,5-dithiobis(2-nitrobenzoic acid), [55] 1,4-dithiothreitol [56] and 5-thio-(2-nitrobenzoic acid) [57] can be used as the capping reagent for Cr(III) or Cr(VI) sensing. We used maleic acid (MA), another organic acid containing two carboxylic groups, was then used as the capping reagent for the functionalization of Au NPs. By incubating MA with citrate-prepared Au NPs for 2 h under rotation, MA-capped Au NPs could be obtained; MA at high concentration displaces the citrate. We compared the absorption spectra and aggregation response for Au NPs before and after MA functionalization, in the presence of a range of metal ions. See Figure 2A–C. While the citrate-bearing Au NPs solution showed poor selectivity to the metal ions, MA-treated Au NPs exhibited a highly selective response to Cr(VI) over other metal ions tested. As can be seen in Figure 2C, Ba2+, Ca2+, Cd2+, Co2+, Cu2+, Cr(III), Mg2+, Mn2+, Ni2+, Pb2+, Zn2+, and Al3+ can not cause a significant effect on the color of MA-capped Au NPs solution, while an obvious color change could occur in the presence of Cr(VI) at a concentration of 1.0 µg L−1. We further recorded the UV-Vis spectra response of MA-capped Au NPs in the presence of different metal ions, which could further display the excellent selectivity of our probe for aqueous Cr(VI) (Figure 2D,E). Our probe selectivity was found to be working well as well as the methods described by Kim et al., Xue et al., and Mao et al. [6,7,10]. Moreover, TEM images of MA-capped Au NPs in the presence and absence of Cr(VI) further confirmed their aggregation phenomenon induced by Cr(VI) (Figure 2F,G).
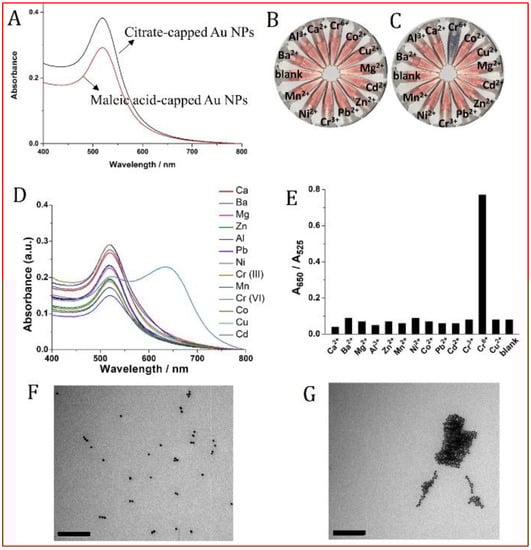
Figure 2.
UV-Vis absorption spectra of citrate- and maleic acid-capped Au NPs (A). Optical responses of citrate-capped (B) and MA-capped (C) Au NPs to various metal ions, all the concentrations of metal ions are 1.0 µg L−1. (D) UV-Vis spectra of MA-capped Au NPs in the presence of various metal ions and the corresponding A 650/A525 responses for those metal ions (E). (F,G) are the TEM images of MA-capped Au NPs in the absence and presence of 10 µg L−1 Cr(VI), respectively. Both of the two-scale bars are 200 nm.
The selectivity of our probe to Cr(VI) could be ascribed to the hypothesis that Cr(VI), existing in the form of Cr2O72−, could coordinate with the carboxyl group from maleic acid through hydrogen bond in an energetically favorable manner. In addition, this discrimination between Cr(VI) and Cr(III) could be ascribed to surface oxidation reaction between maleic acid and Cr2O72− because of the strong oxidization ability of Cr2O72−. Figure 3A,B show the evolution of color and absorbance spectra after adding 10 µL of different concentrations of aqueous Cr(VI) into MA-capped Au NPs. A change in color already discernable by the naked eye is evident already at a concentration as low as 0.4 µg L−1 by the naked eye. According to Figure 3B, the absorption intensity at 520 nm declines and the intensity at 650 nm grows as the concentration of Cr(VI) increases. Figure 3C shows plots of the absorption intensity ratio A650/A520 against the concentration of aqueous Cr(VI). Below about 2 μg L−1, the limit beyond which the response reaches saturation, the plot is linear, described by the regression line (y = 0.40089 + 0.31557x) with a 0.94045 correlation coefficient (inset).
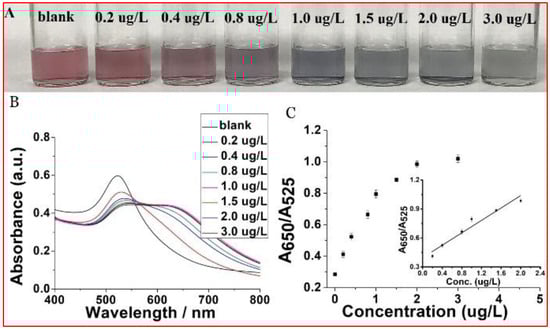
Figure 3.
(A) Optical response of MA-capped Au NPs in the presence of different concentrations of Cr(VI) and their corresponding UV-Vis spectra (B). (C) The dose-response curve for Cr(VI) detection and the insert within is the linear calibration plot for Cr(VI) in the range of 0.2 to 2.0 µg L−1.
3.2. Smartphone-Based Colorimetric Assay
The expensive, delicate, and costly UV-Vis spectrometer is not appropriate for on-site application. The portable, inexpensive, and sturdy smartphone is more suitable for point-of-care sensors [2,11], especially in resource-constrained countries. Therefore, we carried out the experiment assay with the help of a smartphone equipped with a color scan application software (ColorAssist), specially designed for photo analysis instead of a UV-Vis spectrometer. After taking, The software can analyze a photo of the MA-capped Au NPs solution producing a color card and RGB (red, green, and blue) values. As we know, colorimetry is a method that is used to determine the concentration of colored compound in solution by the application of the Beer-Lambert law, which is highly dependent on the use of UV-Vis spectrometer. Unlike colorimetry, RGB, as three primary of light, has been widely used in the field of image display since any color could be decoded by RGB value. The RGB components of light can represent any color, as shown in Figure 4. Small differences in the color of solutions of MA-capped Au NPs with different concentration of target could also be reflected by the ratio of green to red values displayed on the screen. Figure 5 shows that the ratio of green to red can be used to establish a correlation with Cr(VI) concentration. A linear calibration curve (y = 0.48297 + 0.49794x) was obtained and showed good linearity with a correlation coefficient of 0.99036 in the concentration range of 0.2 µg L−1 to 1 µg L−1. The detection limit could reach as low as 0.1 µg L−1 based on the definition of three times the deviation of the blank signal (3 σ). Our detection limit was found to be very near to the limitations which were reported by Yingying Qi et al. (0.52 μg L−1), Xiaolan Chen et al. (0.26 μg L−1), and Kim et al. (0.4 μM) [2,7,32]. However, our detection limit was found to be more reliable than the method reported by Sushant D. Bamane et al. (1.3–11.6 μg L−1) [11].
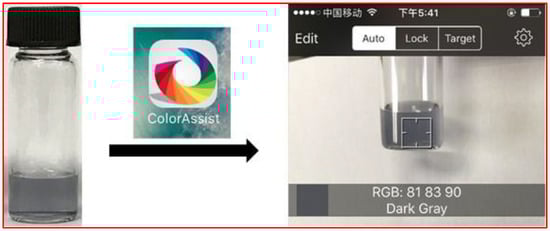
Figure 4.
Photography showing the whole detection procedure by a smartphone pre-installed with the color scan application software ColorAssist. The color card and color values of RGB can be displayed on the screen simultaneously once the solution is placed in the scope that the smartphone’s camera can photograph.
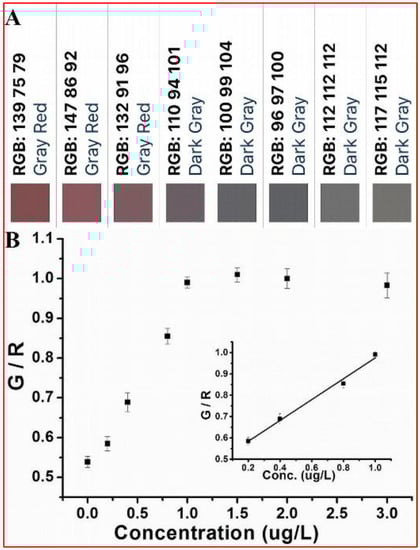
Figure 5.
(A) Color cards of the solutions shown in Figure 2A obtained by a smartphone installed with a color scan application software. (B) Dose-response curve for Cr(VI) detection (G/R ratio vs. Cr(VI)) and the insert within is the linear calibration plot for Cr(VI) in the range of 0.2 to 1.0 µg L−1.
3.3. Real Sample Detection Based on Smartphone Sensor
Samples collected from three local lakes were used to investigate the performance of our smartphone-based colorimetric method. The absolute concentrations of Cr(VI) in the three samples were measured by the traditional Atomic Absorption Spectroscopy (AAS) method. The samples were filtered through a 0.22 µm Super filter to remove any particulate suspension before the Cr(VI) determination. As revealed by the results in Table 1, one can find that the concentrations of Cr(VI) in all the three lakes were in the detection range of our MA-capped Au NPs sensor, suggesting the samples could be used directly to interrogate the performance of our probe. As expected, the results obtained by the smartphone were consistent with the data obtained by AAS, suggesting the impurities within the samples did not cause serious interference for Cr(VI) detection in real samples collected. Compared to the AAS results, the recovery rate of our smartphone-based method for Cr(VI) detection was in the range of 84.9% to 115.8%. In addition, analytical precision was compared by analyzing the coefficient variations for UV-Vis and the proposed method, which revealed that the precision of smartphone-based assay was equivalent to that of colorimetry, demonstrating the potential of the proposed method for accurate detection of analyte in real world.

Table 1.
Recovery test of Cr(VI) in a real water sample collected from three local lakes by the smartphone-based method and its coefficient variation comparison with conventional UV-Vis spectrometer a.
4. Conclusions
In this work, an MA-capped Au NPs based colorimetric method was developed for the rapid detection of aqueous Cr(VI) with high sensitivity and selectivity. The response of our probe to aqueous Cr(VI) could be simply observed with a color change from wine-red to gray, and the limit of detection could reach as low as 0.4 µg L−1 by the naked eye. Moreover, with the help of a smartphone equipped with a color scan application software, Cr(VI) could be quantified on-site in a simple, portable, reliable, and rapid manner and detection liner range from 0.2 to 1.0 µg L−1 with a detection limit as low as 0.1 µg L−1. The coefficient variations obtained by the proposed method is comparable to that of conventional UV-Vis spectrometer, demonstrating the potential of the proposed method in heavy metal ion detection on site in resource-constrained countries. In the future, it is believed that assays in decentralized studies could be dramatically improved if smartphone were to be integrated with more powerful software for data collection. In addition, the proposed method reported here could potentially be adapted for the detection of any environmental pollutants as long as coordination reagents against it were available, therefore making smartphone-based method a versatile tool for environmental monitoring. Furthermore, this methodology is not confined to colorimetric assay, fluorescence-based assay combined with smartphone seems to be more suitable for on-site detection in real world from the perspective of detection sensitivity, which has been already intensely reported with high accuracy and sensitivity in the past decade.
Author Contributions
Conceptualization, A.M. and C.Y.; methodology, A.M., X.L. (Xuemeng Li) and C.L.; software, C.Y. and X.L. (Xuegang Li); validation, A.M., C.Y. and H.B.; formal analysis, A.M., X.L. (Xuemeng Li) and C.L.; investigation, A.M., X.L. (Xuemeng Li), C.L., C.Y., X.L. (Xuegang Li) and H.B.; data curation, A.M., X.L. (Xuemeng Li), C.L. and C.Y.; writing—original draft preparation, A.M. and C.Y.; writing—review and editing, A.M. and H.B.; visualization, A.M. and C.Y.; supervision, C.Y.; project administration, C.Y. and H.B.; funding acquisition, C.Y. and H.B. All authors have read and agreed to the published version of the manuscript.
Funding
This research received no external funding.
Institutional Review Board Statement
Not applicable.
Informed Consent Statement
Not applicable.
Data Availability Statement
The data presented in this study are available on request from the corresponding author.
Acknowledgments
Thanks to Carl Trindle of the University of Virginia for revising the English language for our paper.
Conflicts of Interest
The authors declare no conflict of interest.
References
- Barceloux, D.G. Chromium. Clin. Toxicol. 1999, 37, 173–194. [Google Scholar] [CrossRef] [PubMed]
- Chen, X.; Ma, C.; Kang, Q.; Chen, Y.; Shen, D. Field analysis of Cr(vi) in water samples by using a smartphone-based ultralong absorption path reflection colorimetric device. New J. Chem. 2021, 45, 2529–2535. [Google Scholar] [CrossRef]
- Kumar, N.; Madhwal, D.; Jain, V.K.; Suman, A. POC device for on-the-spot detection of hexavalent chromium in wastewater. J. Environ. Chem. Eng. 2020, 8, 104342. [Google Scholar] [CrossRef]
- Alula, M.T.; Madingwane, M.L. Colorimetric quantification of chromium(VI) ions based on oxidoreductase-like activity of Fe3O4. Sens. Actuators B Chem. 2020, 324, 128726. [Google Scholar] [CrossRef]
- Zhai, H.M.; Zhou, T.; Fang, F.; Wu, Z.Y. Colorimetric speciation of Cr on paper-based analytical devices based on field amplified stacking. Talanta 2020, 210, 120635. [Google Scholar] [CrossRef]
- Xue, Q.; Li, X.; Peng, Y.; Liu, P.; Peng, H.; Niu, X. Polyethylenimine-stabilized silver nanoclusters act as an oxidoreductase mimic for colorimetric determination of chromium(VI). Mikrochim. Acta 2020, 187, 263. [Google Scholar] [CrossRef] [PubMed]
- Kim, D.; Choi, E.; Lee, C.; Choi, Y.; Kim, H.; Yu, T.; Piao, Y. Highly sensitive and selective visual detection of Cr(VI) ions based on etching of silver-coated gold nanorods. Nano Converg. 2019, 6, 34. [Google Scholar] [CrossRef] [Green Version]
- Nghia, N.N.; Huy, B.T.; Lee, Y.I. Colorimetric detection of chromium(VI) using graphene oxide nanoparticles acting as a peroxidase mimetic catalyst and 8-hydroxyquinoline as an inhibitor. Mikrochim. Acta 2018, 186, 36. [Google Scholar] [CrossRef]
- Ghayyem, S.; Swaidan, A.; Barras, A.; Dolci, M.; Faridbod, F.; Szunerits, S.; Boukherroub, R. Colorimetric detection of chromium(VI) ion using poly(N-phenylglycine) nanoparticles acting as a peroxidase mimetic catalyst. Talanta 2021, 226, 122082. [Google Scholar] [CrossRef]
- Mao, Y.; Gao, S.; Yao, L.; Wang, L.; Qu, H.; Wu, Y.; Chen, Y.; Zheng, L. Single-atom nanozyme enabled fast and highly sensitive colorimetric detection of Cr(VI). J. Hazard. Mater. 2021, 408, 124898. [Google Scholar] [CrossRef]
- Bamane, S.D.; Bhojwani, V.; Balkunde, P.L.; Bhattacharya, M.; Gupta, I.; Mohapatra, A.K.; Shekhar, A.; Singh, A. Smartphone-enabled field monitoring tool for rapid hexavalent chromium detection in water. Anal. Bioanal. Chem. 2021, 413, 3455–3469. [Google Scholar] [CrossRef] [PubMed]
- Bagchi, D.; Stohs, J.S.; Downs, B.W.; Bagchi, M.; Preuss, H.G. Cytotoxicity and oxidative mechanisms of different forms of chromium. Toxicology 2002, 180, 5–22. [Google Scholar] [CrossRef]
- Zhitkovich, A. Importance of Chromium-DNA Adducts in Mutagenicity and Toxicity of Chromium(VI). Chem. Res. Toxicol. 2005, 18, 3–11. [Google Scholar] [CrossRef] [PubMed]
- Holmes, A.L.; Wise, S.S.; Wise, J.R. Carcinogenicity of hexavalent chromium. Indian J. Med. Res. 2008, 128, 353–372. [Google Scholar] [PubMed]
- Costa, M.; Klein, C.B. Toxicity and Carcinogenicity of Chromium Compounds in Humans. Crit. Rev. Toxicol. 2008, 36, 155–163. [Google Scholar] [CrossRef] [PubMed]
- Patlolla, A.K.; Barnes, C.; Yedjou, C.; Velma, V.R.; Tchounwou, P.B. Oxidative stress, DNA damage, and antioxidant enzyme activity induced by hexavalent chromium in Sprague-Dawley rats. Environ. Toxicol. 2009, 24, 66–73. [Google Scholar] [CrossRef] [PubMed] [Green Version]
- Kiran, K.; Kumar, K.S.; Prasad, B.; Suvardhan, K.; Lekkala, R.B.; Janardhanam, K. Speciation determination of chromium(III) and (VI) using preconcentration cloud point extraction with flame atomic absorption spectrometry (FAAS). J. Hazard Mater. 2008, 150, 582–586. [Google Scholar] [CrossRef]
- Wang, J.; Hansen, E.H. Coupling on-line preconcentration by ion-exchange with ETAAS A novel flow injection approach based on the use of a renewable microcolumn as demonstrated for the determination of nickel in environmental and biological samples. Anal. Chim. Acta 2000, 424, 223–232. [Google Scholar] [CrossRef]
- Cordero, M.T.S.; Alonso, E.I.V.; de Torres, A.G.; Pavón, J.M.C. Development of a new system for the speciation of chromium in natural waters and human urine samples by combining ion exchange and ETA-AAS. J. Anal. At. Spectrom. 2004, 19, 398–403. [Google Scholar] [CrossRef]
- Ejeta, S.Y.; Imae, T. Selective colorimetric and electrochemical detections of Cr(III) pollutant in water on 3-mercaptopropionic acid-functionalized gold plasmon nanoparticles. Anal. Chim. Acta 2021, 1152, 338272. [Google Scholar] [CrossRef]
- Wen, B.; Shan, X.Q.; Lian, J. Separation of Cr(III) and Cr(VI) in river and reservoir water with 8-hydroxyquinoline immobilized polyacrylonitrile fiber for determination by inductively coupled plasma mass spectrometry. Talanta 2002, 56, 681–687. [Google Scholar] [CrossRef]
- Menegário, A.A.; Smichowski, P.; Polla, G. On-line preconcentration and speciation analysis of Cr(III) and Cr(VI) using baker′s yeast cells immobilised on controlled pore glass. Anal. Chim. Acta 2005, 546, 244–250. [Google Scholar] [CrossRef]
- Manzoori, J.L.; Shemirani, F. Determination of chromium(vi) and total chromium by inductively coupled plasma atomic emission spectrometry after preconcentration using solvent extraction and back-extraction. J. Anal. At. Spectrom. 1995, 10, 881–883. [Google Scholar] [CrossRef]
- Rosi, N.L.; Mirkin, C.A. Nanostructures in biodiagnostics. Chem. Rev. 2005, 105, 1547–1562. [Google Scholar] [CrossRef] [PubMed]
- Lee, J.S.; Han, M.S.; Mirkin, C.A. Colorimetric detection of mercuric ion (Hg2+) in aqueous media using DNA-functionalized gold nanoparticles. Angew. Chem. 2007, 46, 4093–4096. [Google Scholar] [CrossRef] [PubMed]
- Jiang, Y.; Zhao, H.; Lin, Y.; Zhu, N.; Ma, Y.; Mao, L. Colorimetric detection of glucose in rat brain using gold nanoparticles. Angew. Chem. 2010, 49, 4800–4804. [Google Scholar] [CrossRef]
- Xu, X.; Han, M.S.; Mirkin, C.A. A gold-nanoparticle-based real-time colorimetric screening method for endonuclease activity and inhibition. Angew. Chem. 2007, 46, 3468–3470. [Google Scholar] [CrossRef]
- Xu, S.; Ouyang, W.; Xie, P.; Lin, Y.; Qiu, B.; Lin, Z.; Chen, G.; Guo, L. Highly uniform gold nanobipyramids for ultrasensitive colorimetric detection of influenza virus. Anal. Chem. 2017, 89, 1617–1623. [Google Scholar] [CrossRef] [PubMed]
- Zhang, Y.; Shen, H.Y.; Hai, X.; Chen, X.W.; Wang, J.H. Polyhedral oligomeric silsesquioxane polymer-caged silver nanoparticle as a smart colorimetric probe for the detection of hydrogen sulfide. Anal. Chem. 2017, 89, 1346–1352. [Google Scholar] [CrossRef]
- Du, B.; Su, X.; Yang, K.; Pan, L.; Liu, Q.; Gong, L.; Wang, P.; Yang, J.; He, Y. Antibody-Free Colorimetric Detection of Total Aflatoxins in Rice Based on a Simple Two-Step Chromogenic Reaction. Anal. Chem 2016, 88, 3775–3780. [Google Scholar] [CrossRef]
- Li, L.; Zhang, Y.; Zhang, L.; Ge, S.; Liu, H.; Ren, N.; Yan, M.; Yu, J. Paper-based device for colorimetric and photoelectrochemical quantification of the flux of H2O2 releasing from MCF-7 cancer cells. Anal. Chem. 2016, 88, 5369–5377. [Google Scholar] [CrossRef] [PubMed]
- Qi, Y.; Ma, J.; Xiu, F.R.; Gao, X. Determination of Cr(VI) based on the peroxidase mimetic catalytic activity of citrate-capped gold nanoparticles. Mikrochim. Acta 2021, 188, 273. [Google Scholar] [CrossRef] [PubMed]
- Li, J.F.; Huang, Y.F.; Ding, Y.; Yang, Z.L.; Li, S.B.; Zhou, X.S.; Fan, F.R.; Zhang, W.; Zhou, Z.Y.; Wu, D.Y.; et al. Shell-isolated nanoparticle-enhanced Raman spectroscopy. Nature 2010, 464, 392–395. [Google Scholar] [CrossRef]
- Bodelon, G.; Montes-Garcia, V.; Lopez-Puente, V.; Hill, E.H.; Hamon, C.; Sanz-Ortiz, M.N.; Rodal-Cedeira, S.; Costas, C.; Celiksoy, S.; Perez-Juste, I.; et al. Detection and imaging of quorum sensing in Pseudomonas aeruginosa biofilm communities by surface-enhanced resonance Raman scattering. Nat. Mater. 2016, 15, 1203–1211. [Google Scholar] [CrossRef] [PubMed] [Green Version]
- Mayer, K.M.; Hafner, J.H. Localized surface plasmon resonance sensors. Chem. Rev. 2011, 111, 3828–3857. [Google Scholar] [CrossRef] [PubMed]
- Cao, G.; Xu, F.; Wang, S.; Xu, K.; Hou, X.; Wu, P. Gold nanoparticle-based colorimetric assay for selenium detection via hydride generation. Anal. Chem. 2017, 89, 4695–4700. [Google Scholar] [CrossRef]
- Gao, Z.; Liu, G.G.; Ye, H.; Rauschendorfer, R.; Tang, D.; Xia, X. Facile colorimetric detection of silver ions with picomolar sensitivity. Anal. Chem. 2017, 89, 3622–3629. [Google Scholar] [CrossRef] [PubMed]
- Yu, Y.; Hong, Y.; Gao, P.; Nazeeruddin, M.K. Glutathione modified gold nanoparticles for sensitive colorimetric detection of pb(2+) ions in rainwater polluted by leaking perovskite solar cells. Anal. Chem. 2016, 88, 12316–12322. [Google Scholar] [CrossRef]
- Chai, F.; Wang, C.; Wang, T.; Li, L.; Su, Z. Colorimetric detection of Pb2+ using glutathione functionalized gold nanoparticles. ACS Appl. Mater. Interfaces 2010, 2, 1466–1470. [Google Scholar] [CrossRef]
- Durgadas, C.V.; Lakshmi, V.N.; Sharma, C.P.; Sreenivasan, K. Sensing of lead ions using glutathione mediated end to end assembled gold nanorod chains. Sens. Actuators B Chem. 2011, 156, 791–797. [Google Scholar] [CrossRef]
- Zhang, H.; Liu, Q.; Wang, T.; Yun, Z.; Li, G.; Liu, J.; Jiang, G. Facile preparation of glutathione-stabilized gold nanoclusters for selective determination of chromium (III) and chromium(VI) in environmental water samples. Anal. Chim. Acta 2013, 770, 140–146. [Google Scholar] [CrossRef] [PubMed]
- Sung, H.K.; Oh, S.Y.; Park, C.; Kim, Y. Colorimetric detection of Co2+ ion using silver nanoparticles with spherical, plate, and rod shapes. Langmuir 2013, 29, 8978–8982. [Google Scholar] [CrossRef] [PubMed]
- Wang, X.; Chang, T.W.; Lin, G.; Gartia, M.R.; Liu, G.L. Self-referenced smartphone-based nanoplasmonic imaging platform for colorimetric biochemical sensing. Anal. Chem. 2017, 89, 611–615. [Google Scholar] [CrossRef]
- Wang, L.J.; Sun, R.; Vasile, T.; Chang, Y.C.; Li, L. high-throughput optical sensing immunoassays on smartphone. Anal. Chem. 2016, 88, 8302–8308. [Google Scholar] [CrossRef] [PubMed]
- Rico-Yuste, A.; Gonzalez-Vallejo, V.; Benito-Pena, E.; de Las Casas Engel, T.; Orellana, G.; Moreno-Bondi, M.C. Furfural determination with disposable polymer films and smartphone-based colorimetry for beer freshness assessment. Anal. Chem. 2016, 88, 3959–3966. [Google Scholar] [CrossRef]
- Zhang, L.; Yang, W.; Yang, Y.; Liu, H.; Gu, Z. Smartphone-based point-of-care testing of salivary alpha-amylase for personal psychological measurement. Analyst 2015, 140, 7399–7406. [Google Scholar] [CrossRef] [PubMed] [Green Version]
- Nie, H.; Wang, W.; Li, W.; Nie, Z.; Yao, S. A colorimetric and smartphone readable method for uracil-DNA glycosylase detection based on the target-triggered formation of G-quadruplex. Analyst 2015, 140, 2771–2777. [Google Scholar] [CrossRef]
- Abbas, M.; Hasan, B.; Sasan, A.; Nasim, F.; Abbas, A. New portable smartphone-based PDMS microfluidic kit for the simultaneous colorimetric detection of arsenic and mercury. RSC Adv. 2018, 8, 27091–27100. [Google Scholar] [CrossRef] [Green Version]
- Ying, G.; Tao, L.; Qiongwen, H.; Longjie, Z.; Xinyi, W.; Hao, W.; Ping, W. In-situ detection of cadmium with aptamer functionalized gold nanoparticles based on smartphone-based colorimetric system. Talanta 2020, 208, 120231. [Google Scholar]
- Mohd, F.S.; Soocheol, K.; Hyoil, J.; Taeho, K.; Chulmin, J.; Seungkyung, P. Miniaturized Sample Preparation and Rapid Detection of Arsenite in Contaminated Soil Using a Smartphone. Sensors 2018, 18, 777. [Google Scholar] [CrossRef] [Green Version]
- Supattra, M.; Siriwan, T. On-site detection of heavy metals in wastewater using a single paper strip integrated with a smartphone. Anal. Bioanal. Chem. 2020, 412, 1395–1405. [Google Scholar]
- Yuanyuan, C.; Yingnan, L.; Fan, L.; Shuwen, G.; Yuhang, S.; Hanyue, X.; Li, W. Portable colorimetric detection of copper ion in drinking water via red beet pigment and smartphone. Microchem. J. 2019, 150, 104176. [Google Scholar]
- Mohd, F.S.; Zeeshan, A.K.; Hyoil, J.; Seungkyung, P. SPE based soil processing and aptasensor integrated detection system for rapid on site screening of arsenic contamination in soil. Ecotoxicol. Environ. Saf. 2020, 196, 110559. [Google Scholar]
- Chen, W.; Cao, F.; Zheng, W.; Tian, Y.; Xianyu, Y.; Xu, P.; Zhang, W.; Wang, Z.; Deng, K.; Jiang, X. Detection of the nanomolar level of total Cr[(iii) and (vi)] by functionalized gold nanoparticles and a smartphone with the assistance of theoretical calculation models. Nanoscale 2015, 7, 2042–2049. [Google Scholar] [CrossRef]
- Dang, Y.Q.; Li, H.W.; Wang, B.; Li, L.; Wu, Y. Selective detection of trace Cr3+ in aqueous solution by using 5,5’-dithiobis (2-nitrobenzoic acid)-modified gold nanoparticles. ACS Appl. Mater. Interfaces 2009, 1, 1533–1538. [Google Scholar] [CrossRef]
- Tan, F.; Liu, X.; Quan, X.; Chen, J.; Li, X.; Zhao, H. Selective detection of nanomolar Cr(vi) in aqueous solution based on 1,4-dithiothreitol functionalized gold nanoparticles. Anal. Methods 2011, 3, 343–347. [Google Scholar] [CrossRef] [PubMed]
- Lai, Y.J.; Tseng, W.L. Role of 5-thio-(2-nitrobenzoic acid)-capped gold nanoparticles in the sensing of chromium(vi): Remover and sensor. Analyst 2011, 136, 2712–2717. [Google Scholar] [CrossRef] [PubMed]
Publisher’s Note: MDPI stays neutral with regard to jurisdictional claims in published maps and institutional affiliations. |
© 2021 by the authors. Licensee MDPI, Basel, Switzerland. This article is an open access article distributed under the terms and conditions of the Creative Commons Attribution (CC BY) license (https://creativecommons.org/licenses/by/4.0/).