1. Introduction
The flexibility of all steps of product development and design is always desirable. To achieve this, automation must be implemented in all possible steps of product development and design. Height level of automation can be achieved using different types of software for design, numerical analysis, optimization and manufacturing.
Today, software for computer aided design (CAD), numerical analysis, simulations and optimization are introduced in all steps of product development and design, with a goal to reduce development time, and to increase the quality of developed products. The integration of this software, together with skeleton-based generative modeling methods [
1] and algorithms for optimization, as well as systems for knowledge-based engineering (KBE), can be developed. KBE systems have integrated tools for parametric CAD modeling, numerical analysis using finite element modeling (FEM) and structural optimization of various designs [
2,
3].
Structural optimization is commonly used in various fields, such as: fiber composites [
4], printable structures [
5], car body [
6], adaptive structures [
7], and especially with integration with FEM [
8]. Structural optimization, in correlation with optimization variables, can be divided into topology optimization [
9], shape optimization [
10] and size optimization [
11]. Looking to the process of product development and design, it can be noticed that topology optimization accrues in the conceptual phase, shape optimization in the phase of choice of components, and size optimization in detailed design phase.
The parametric description of physical objects, using dimensional, geometrical, physical and functional parameters, is a basis for KBE system development. Knowledge of the KBE system can be represented as knowledge about functional principles of product, and how those principles effect the manufacturing process of that product. Elements of knowledge in KBE systems can be algorithms, parameters, functions and rules.
KBE systems and structural optimization are widely used for the development and optimization of fixation devices and implants [
12,
13,
14]. External fixation device is a medical device which is used to immobilize bone fraction using pins, which goes inside and through bone, and which is externally connected to external mounting. There are a lot of design, biomechanical and manufacturing constrains which must be fulfilled in the design of external fixation device. The most important constrains are the safety of usage and practical application to the bone. The external fixation device, which is analyzed in this paper, is a unilateral, biplanar external modular fixation device with half pins (Schanz screws) [
15,
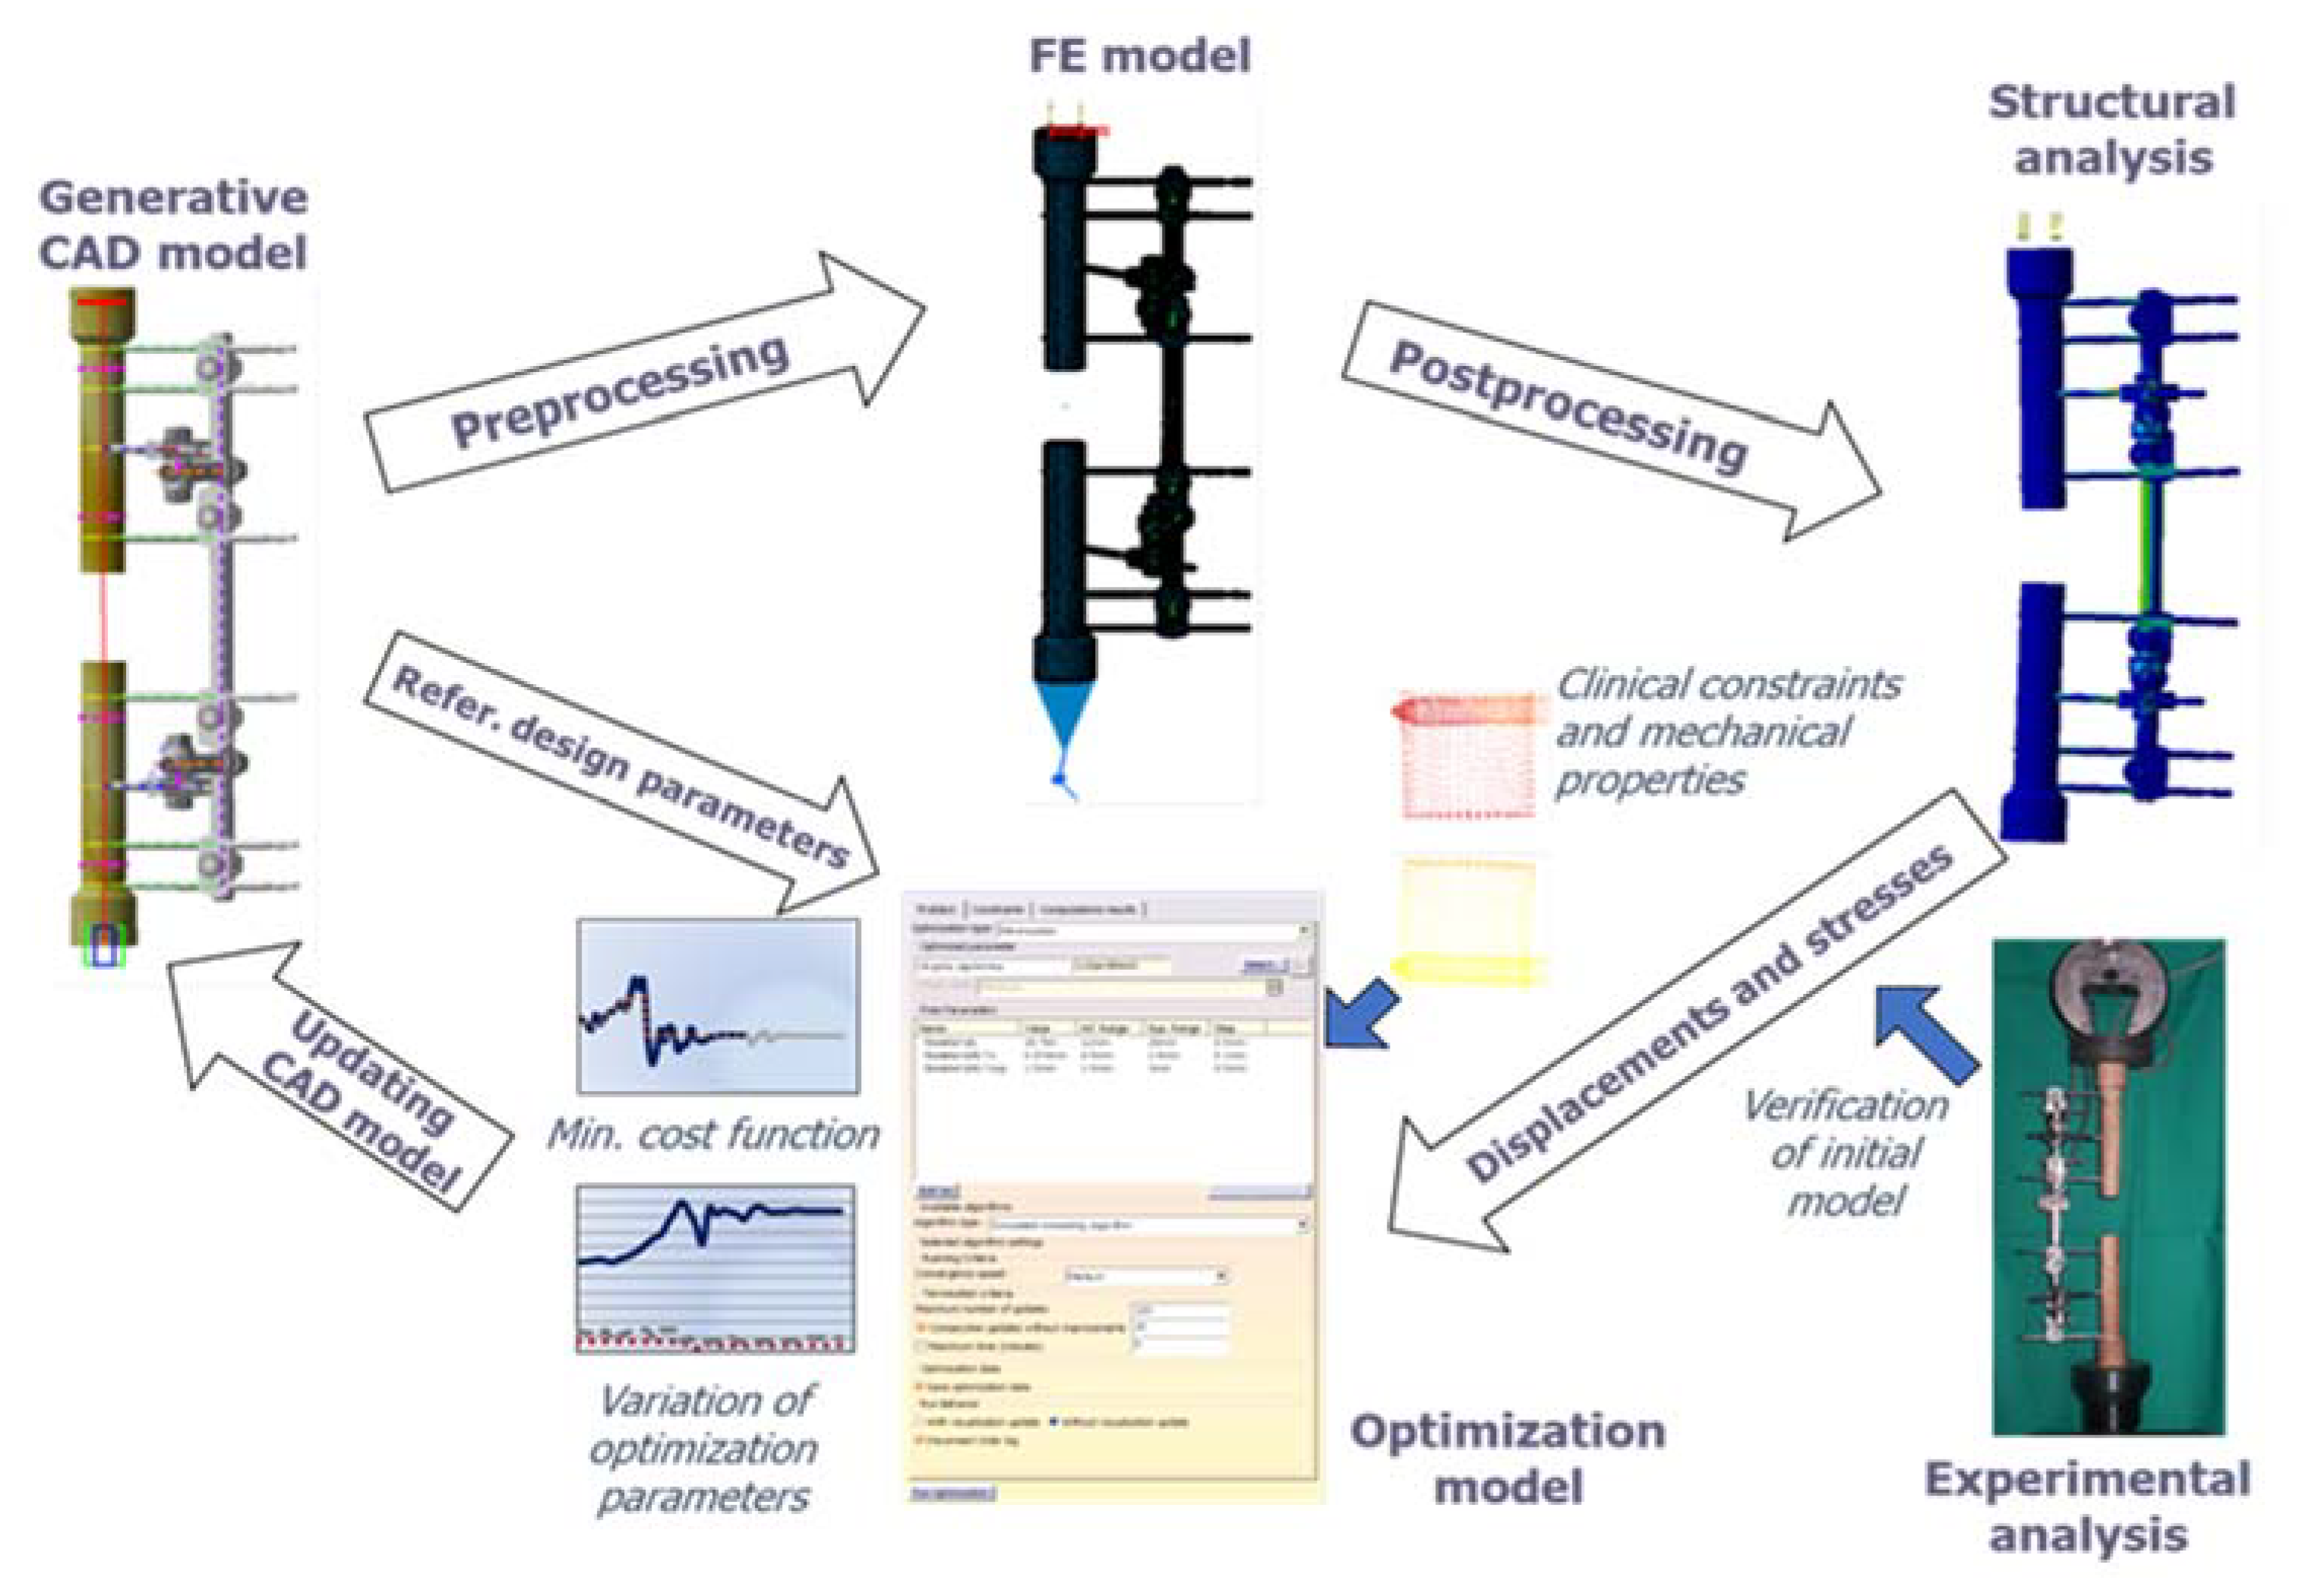
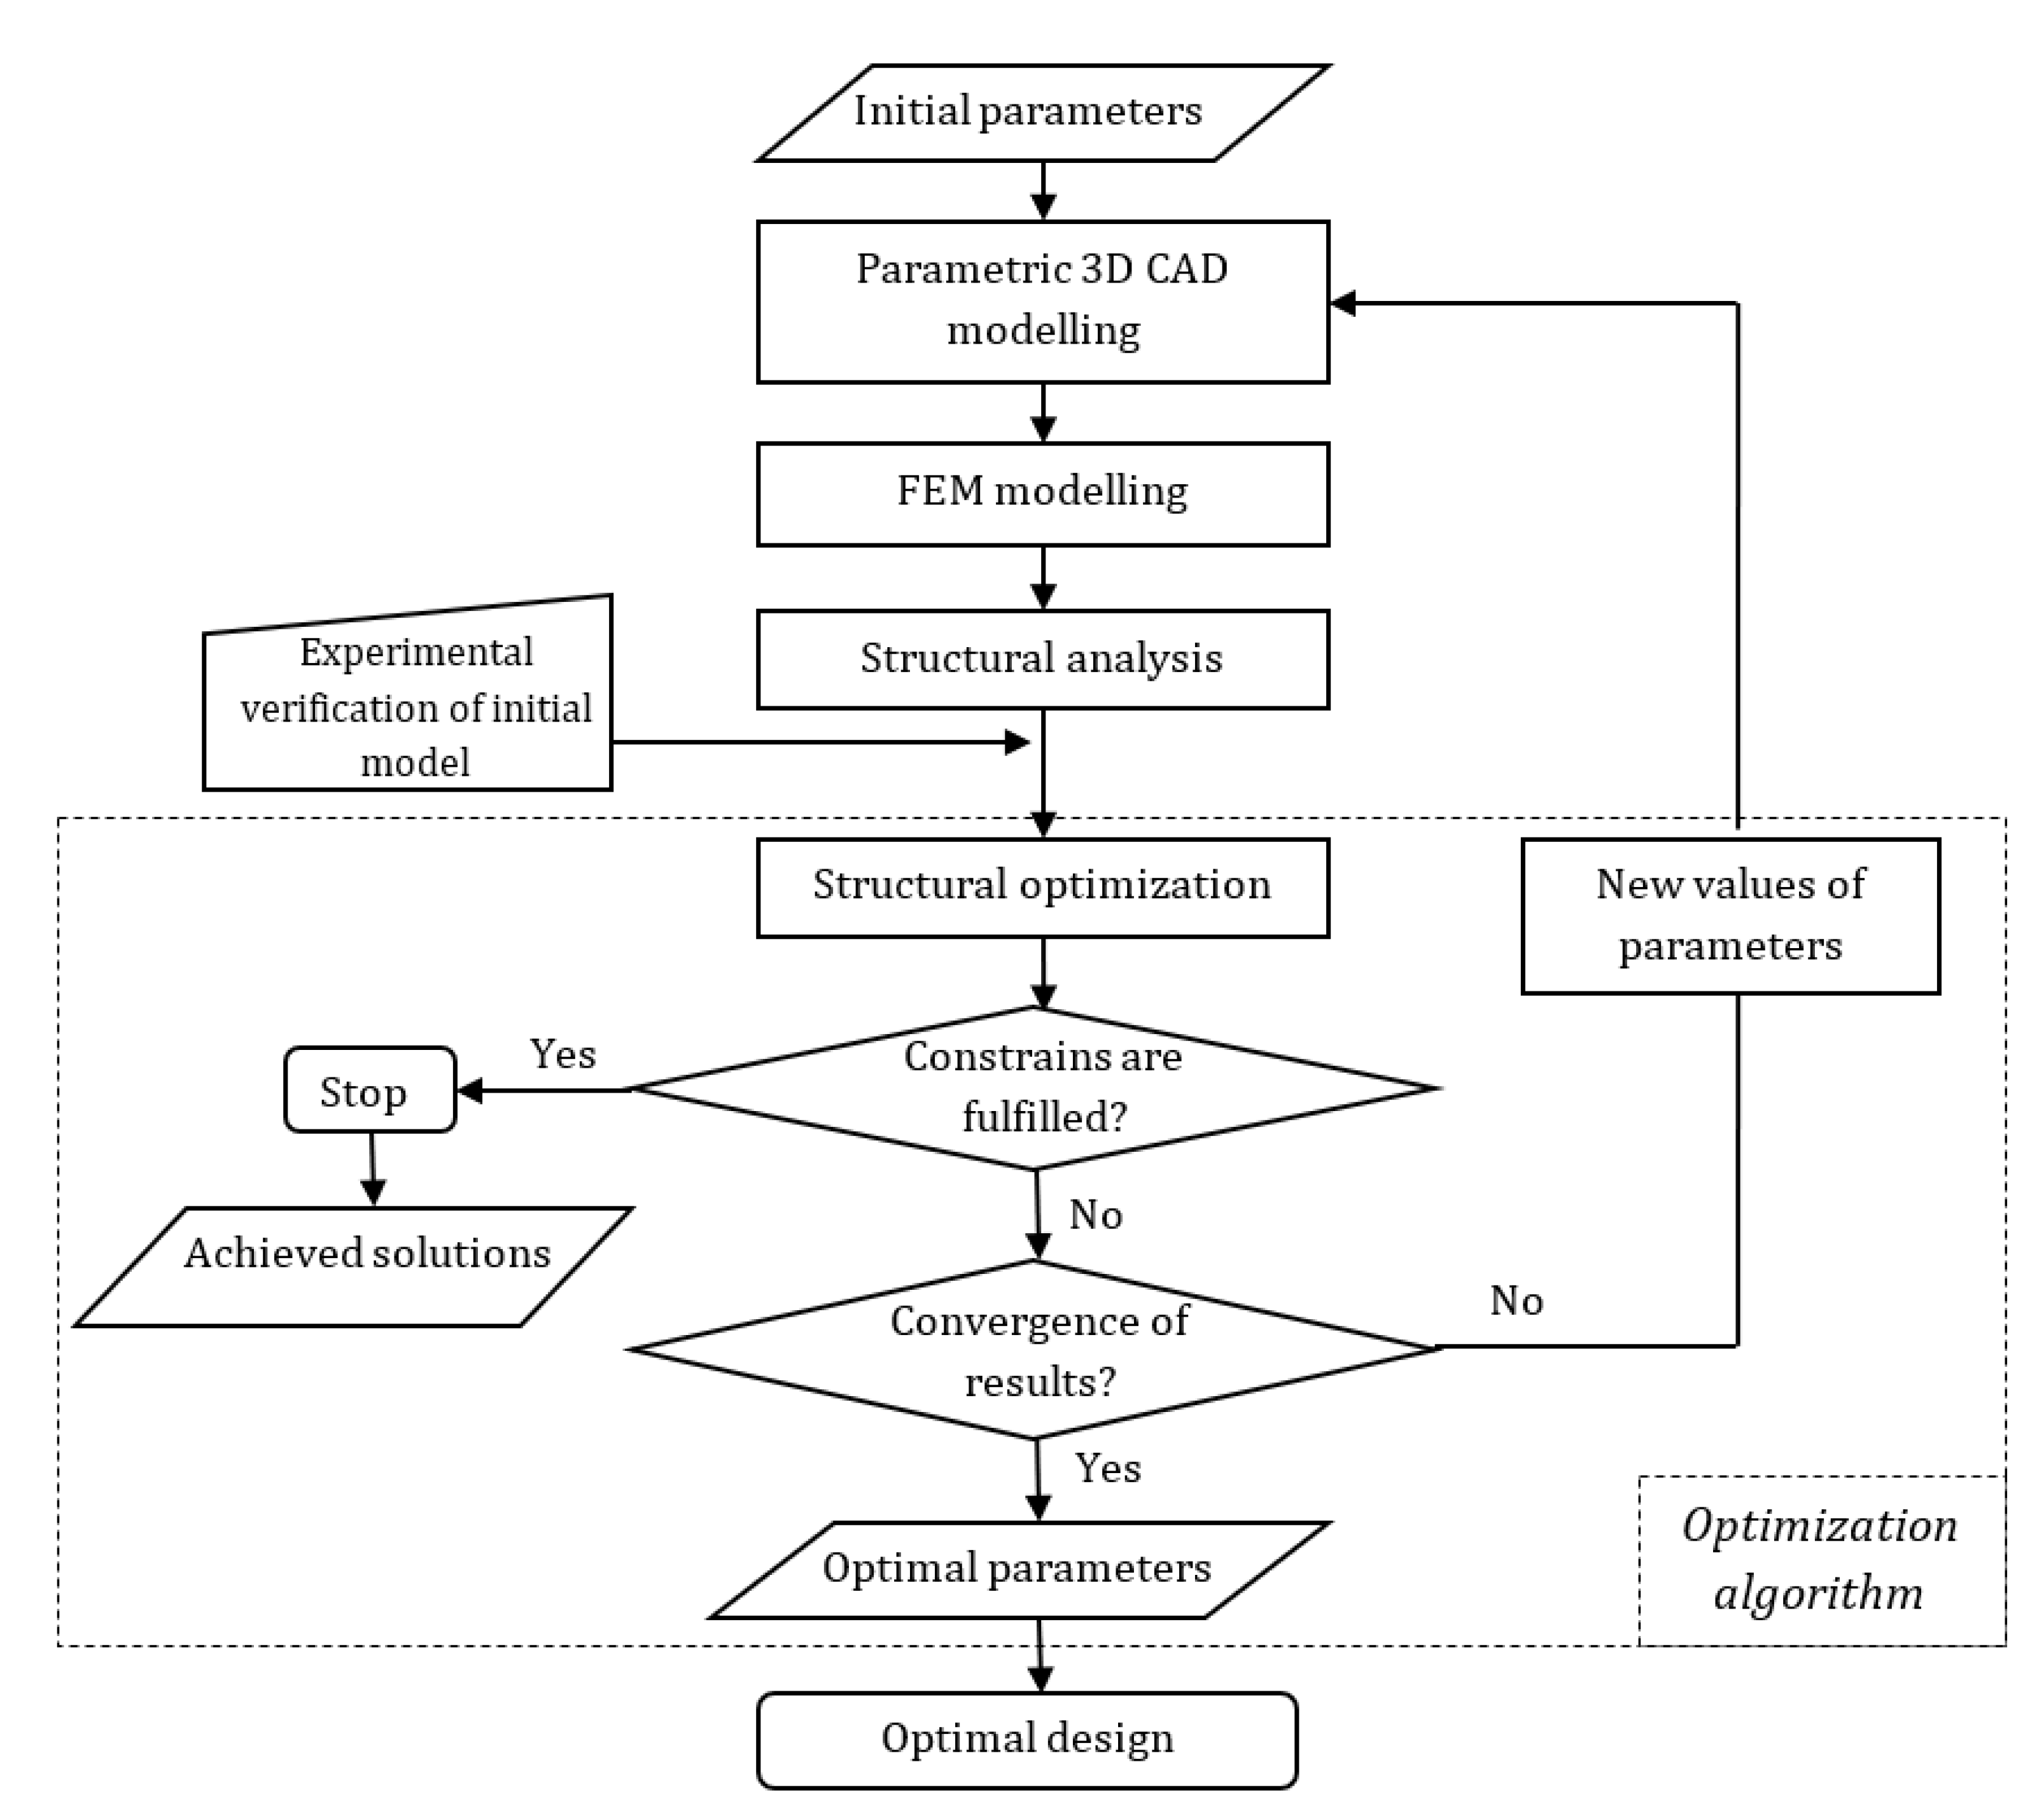
16]. The concept of developed KBE system for structural dimensional optimization of external fixation device is shown in
Figure 1.
Using sensors inside structural analysis, displacements are measured and imported into an optimization model as constrains. In this way, displacements and stress are controlled on important places on an external fixation device. The data of design parameters are imported into the CAD model after every iteration of the optimization process, and then forwarded to the optimization model. Moreover, the other design parameters that are needed to calculate the volume used material for external fixation device are imported into the optimization model. Using these parameters, volume (as cost function) can be calculated. The described process represents one iteration of the developed KBE system. The iteration process is repeated until one of the constrains is reached, and converges of results are obtained. The initial CAD/FEM model is verified using experimental verification on the real design of the external fixation device (
Figure 1).
2. Generative CAD Model
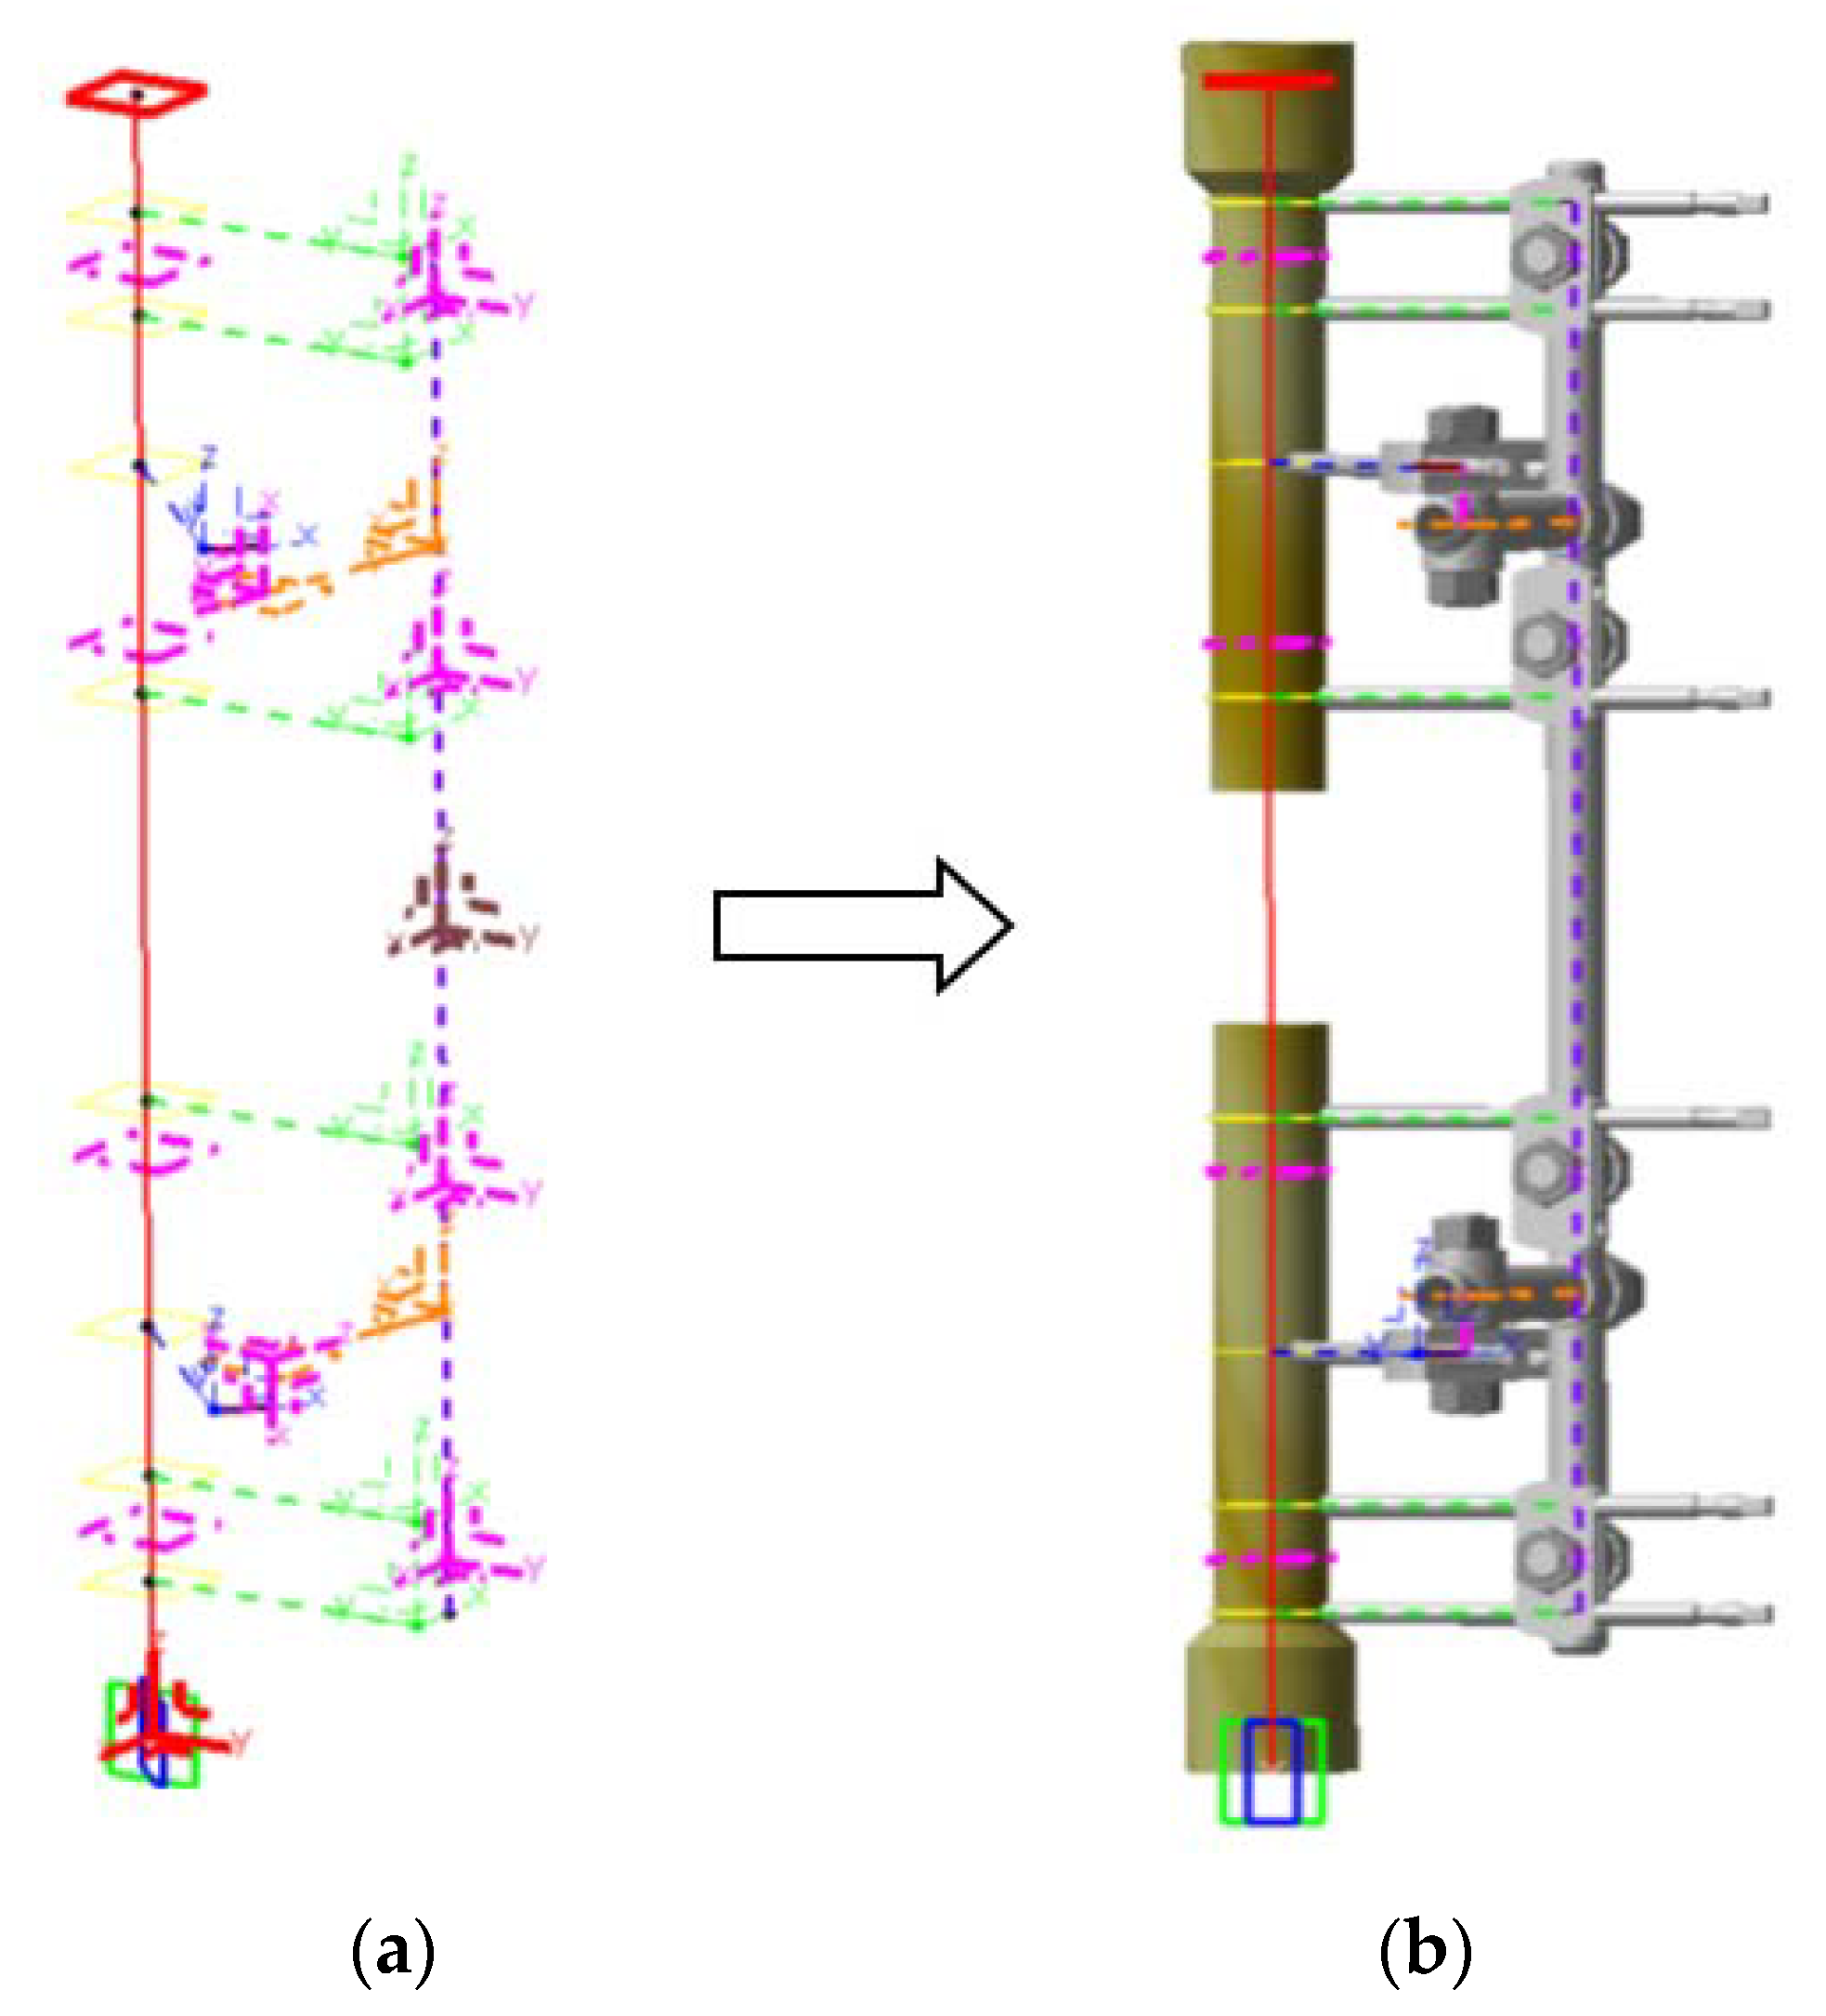
The so-called top-down method is used to develop the generative CAD model. This method means that parameters and relations are used to develop a generative model. In addition, this method implies that the so-called skeleton model of the external fixation device needs to be developed. The skeleton model represents the infrastructure of the external fixation device; also, it defines relations between the parameters of design (
Figure 2). Knowledge about the design of, and relationships between, design components is integrated into the skeleton model. This represents a basis of so-called generative modeling. The generative model is not the same as the parametric model; the generative model forms the knowledge base about different designs of external fixation device in a form of different CAD models. Moreover, the knowledge base can hold other information from other sources; for example, from the experimental testing of the real design of the external fixation device.
The skeleton model must be developed first in the process of the development of the generative CAD model; information about the design and relationships between the components of design must be known (
Figure 2). Moreover, all of the other parameters that are needed for the function of the external fixation device must be imported into the skeleton model [
17].
In the case of the external fixation device, the design parameters are: outer tree diameter ds, tree wall thickness δ, and clamping plate base thickness δ
op (
Figure 3 and
Table 1). These parameters are also optimization variables and they have a significant impact on mechanical stability and the mass of the external fixation device.
After the parameters are defined in the skeleton model, they are published and used as external parameters during the phase of the definition of the shape of external fixation device, and during the definition of position for some of the components of the external fixation device. Relationships inside the skeleton model give flexibility to the design to change the shape, place, and orientation of external fixation device components. Relationships reference design parameters and geometrical elements, which are used to place the components of the external fixation device with correlation to the main coordinate system of skeleton model. Except parameters and relationships, the skeleton model was inside all other referent elements, such as points, planes, and axes (
Figure 2). The places of all elements are defined in correlation to the main coordinate system of the skeleton model using point coordinates or other dimensions. The local coordinate system of all components correlates with the main coordinate system of the skeleton model. Because of this, the skeleton model gives full flexibility to the external fixation device design. It is easy to change the position or geometry of some components. This is a basic condition to carry out the structural optimization process.
After the development of the skeleton model of the external fixation device, it is necessary to develop the parametrized model of all components using developed sub algorithms. All components which change shape, dimensions or place in design must be parametrized. In the case of the external fixation device, the components are main tree, coupling, clamping ring, coupling mount, and clamping plates.
External parameters of the sub algorithm for the design of components of the external fixation device are shown in
Table 1. In the column “Type/CATIA module” type of the parameter and the CATIA module in which that parameter is formed, are given. The value of all dependent parameters is given with the following relationships.
Sub algorithms inside components take over values from external parameters from the skeleton model. In the next step, the design parameters of components are linked to external parameters from the skeleton model. The final step is the modeling of components using sub algorithms. During the process of optimization model development, it is necessary to ensure that all constrains are fulfilled during all iterations of design. Testing of flexibility and quality of developed CAD model of external fixation device must be done with the goal to check whether there is any interference between components.
3. Finite Element Model and Structural Analysis
The goal of KBE system development is to develop ideal simplified virtual design with all properties, like the real one, which can be used to test the behavior of design in different load conditions. If the CAD model has errors, it will affect all other aspects of the KBE system.
3.1. Development of Finite Element Model
The developed CAD model of external fixation device and bone is discretized using linear (TE4) and paraboloic (TE10) tetrahedron finite element. Linear tetrahedron has four nodes. It is also called constant strain tetrahedron (CST element). Paraboloic tetrahedron is curvilinear tetrahedron with ten nodes and linear change of deformation inside element (LST element—linear strain tetrahedron). FEM model of external fixation device is discretized with 133,315 TE4 (47.58%) finite elements, and with 118,632 TE10 (42.34%) finite elements. Both types of finite elements are 3D isoperimetric solid elements with six edges. For geometry approximation and the approximation of unknown variables of isoperimetric elements, the same nodes are used. All nodes of this types of elements have three degrees of freedom (displacements). Connections between parts of the external fixation device (fixed, contact and screw connection) and connection to supports (slider connection) are modeled with Spider type of elements (28,265 finite elements, or 10.08%). Total number of finite elements for external fixation device is 280,212 for 245,732 nodes, which results in 737,199 degrees of freedom (Number of D.O.F), (
Figure 4).
External fixation device is manufactured using stainless steel for medical devices. This material is modeled as an isotropic linear elastic material. Stress-deformation equations for isotropic materials have only two constants: modulus of elasticity and Poisson’s ratio, with the values of E = 215 × 109 Pa and ν = 0.29.
Bone models are manufactured using beech tree with known mechanical properties which are similar to the mechanical properties of cortical bones of the human tibia [
18]. Moreover, experimental testing for axial pressure, which is already done for human tibia and bone, showed small deviations of results [
19]. Tree is an anisotropic material, but because of cylindrical symmetry of its structure it can be considered as orthotropic material which mechanical properties are defined in three planes with transverse, tangential and radial cross-section. A small rectangular part from the tree can be taken as a sample, with three symmetry axes: longitudinal (L), radial (R) and tangential (T), which are approximately vertical to one another.
All parameters for orthotropic linear elastic material must be defined (
Table 2).
Defined properties of orthotropic linear elastic material must fulfill following conditions:
3.2. Structural Analysis of External Fixation Device
During exploration, external fixation device is loaded with complex stress, which can be considered as a combination of pressure, bending and torsion. In most of the studies of external fixation devices using FEM numerical methods or experimental methods, separated studies are done for: axial pressure testing, sagittal or anterior-posterior (AP) bending, and torsion [
20,
21,
22,
23]. The basic external load of external fixation device is axial pressure [
24].
FEM model for simulation of axial pressure is developed, taking into account the complex geometrical structure of the external fixation device, human bone, connections, loads, and constrains. During axial pressure experimental testing, bone models are supported using a spherical joint. Force load was applied in amount of F
p = 0–600 N with the speed of increase in amount of 5 N/s. Values of loads correspond to the physiological load of the fixator after its application to the patient, and it is defined according to the in vivo testing [
25,
26].
Structural analysis is carried out taking into consideration the following assumptions in correspondence to real working conditions: loads are quasi-static, supports are modeled using spherical joints without friction, connection between half pins and bone are modeled using fixed constrain, properties of bone material are chosen same as properties of beech tree. Open fracture is modeled with fracture gap of 50 mm, which represents serious injury, with serious bone damage.
FEM model of external fixation device before, and after applying loads for axial pressure are given on
Figure 5, together with interfragmentary displacements.
The directions of displacements have a big influence on the fracture heal process. Using FEM models, it is possible to track interfragmentary displacements inside the fracture gap. Better stiffness of fixation can help during the early stage of the healing process. The usage of external fixation device with height stiffness in the early stage of the healing process is an important factor in the reduction of stress and deformation in the complete fixator-bone system, and to create an optimal environment for fast healing and the minimal immobility of a patient. The main goal of usage of external fixation device is fast healing. From a literature review [
20,
27,
28], it can be concluded that optimal biomechanical environment, for optimal healing of a bone, among other things, is based on the following two points of view: limited periodical axial displacements of bone segment at the fracture gap stimulate its healing after inflammation. This process is called dynamization. Transverse displacements (craniocaudally and lateromedially) are harmful. To define maximal interfragmentary displacements at fracture gap
, displacements in x, y and z direction of neighboring points at last planes of proximal and distal segment at fracture gap need to be defined [
21,
23]. Relative craniocaudal and lateromedial displacements (x and y direction) and axial displacement (z direction) of selected points are calculated using the following equations:
where:
,
i
are relative displacements of bone segment model at fracture gap in x, y and z direction,
,
i
are absolute displacements of points of proximal bone end in x, y and z direction,
,
i
are absolute displacements of points of distal bone segment end in x, y and z direction.
Intensity of maximal interfragmentary displacement vector at the fracture gap R is defined as:
The values of displacements are shown in
Table 3.
The full numerical structural analysis of external fixation device, except the analysis of displacements at fracture gap, includes also the analysis of principal stress at characteristic places of design [
14,
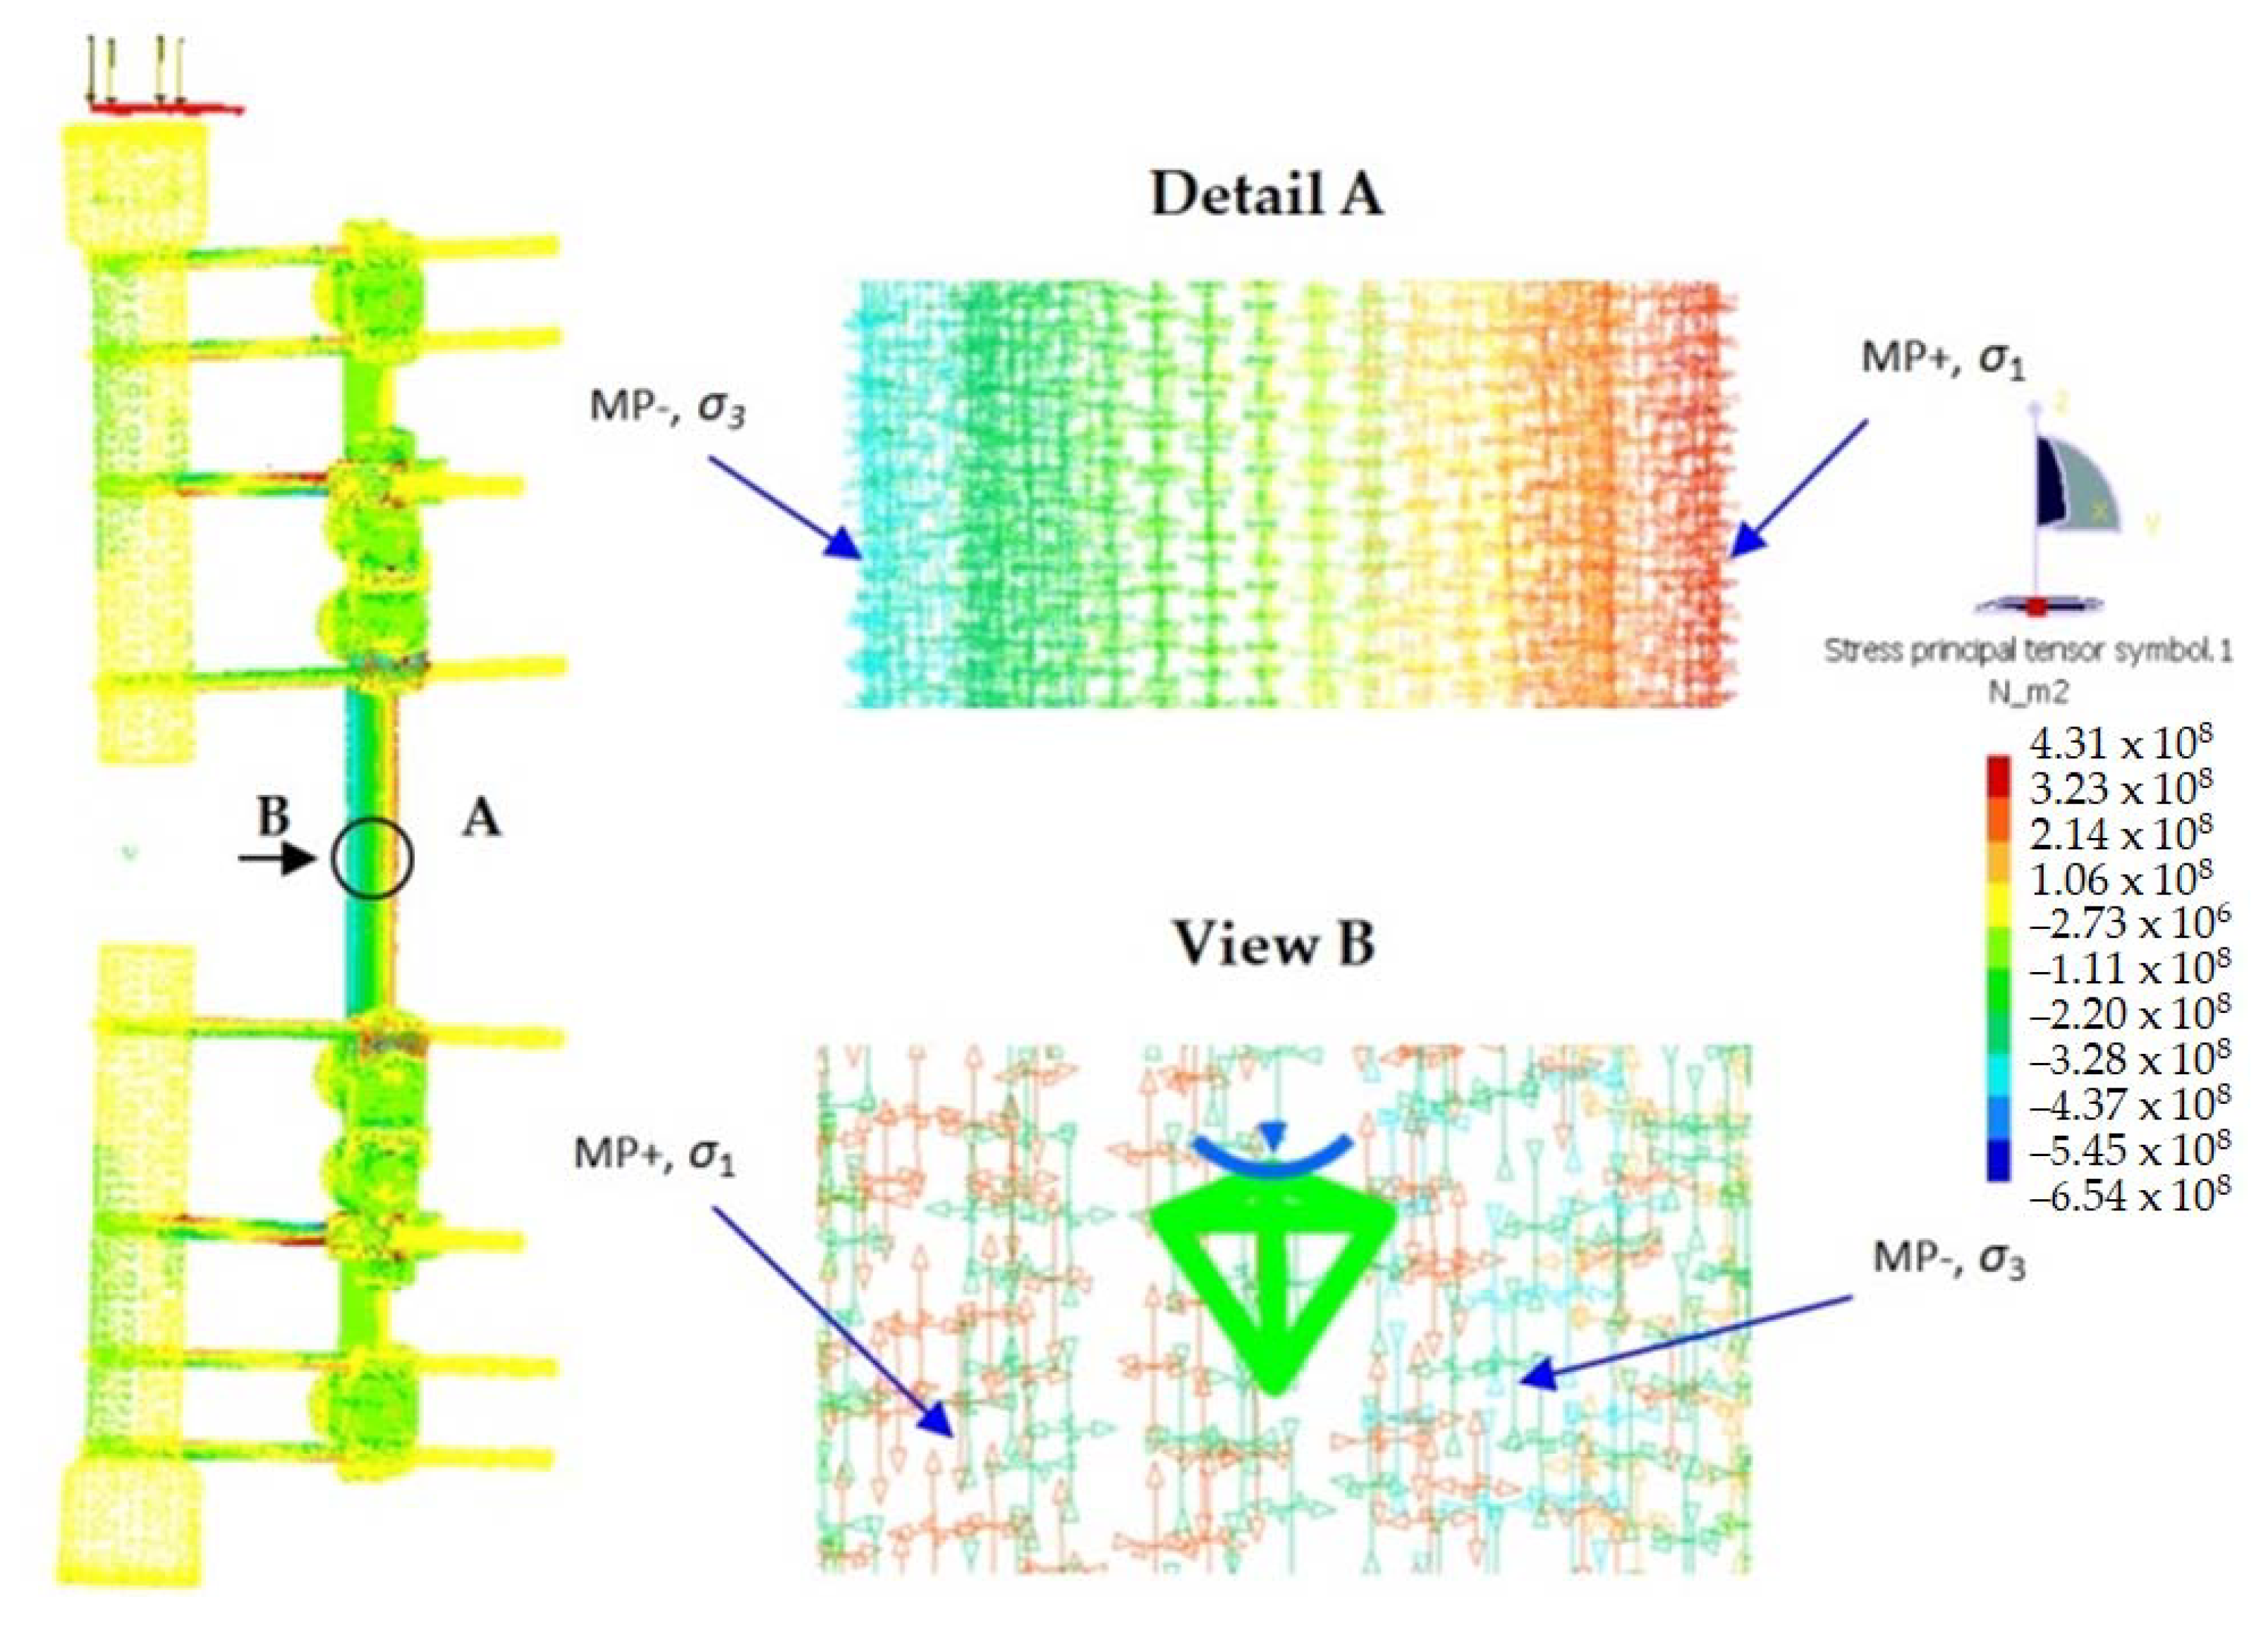
20]. During FEM and experimental analysis, values and directions of principal stress are calculated at two control places at the middle part of the fixator tree. The place which is closer to the bone segment model is marked with MP−, and the place on another side is marked with MP+ (
Figure 6, detail A).
Pressure stress is detected at MP− place, and they have bigger intensity in correspondence with tensile stress at MP+ place. This is because the pressure in the tree of external fixation device is eccentric. The direction of the biggest principal stress σ
1 at place MP+ is the same as the direction of the lowest principal stress σ
3 at place MP−, coinciding with the axis of symmetry of the tree of the external fixation device. Direction and intensity of principal stresses at measuring places are shown
Figure 6 (view B). It can be seen that, at place MP+, the biggest principal stress is tensile stress, and at place MP−, the smaller principal stress is pressure stress. In additional, it can be noticed that principal stresses (σ
1 and σ
3) are in the bending plane of the fixator. This plane does not match with the plane of half pins (
Figure 6, view B). This is because of eccentric pressure load and the geometry of the external fixation device. The intensities of three principal stresses are shown in
Table 4.
4. Experimental Analysis
Today, because of the height level of technology development, the aim is to achieve full utilization of the material for the manufacturing of the external fixation device, because of that, working loads are pushed to their maximum. The first step is to do an analysis about stress distribution using experimental analysis. The next step is to carry out the optimization process to achieve lower mass in correspondence to allowed interfragmentary displacement and stresses at defined places of design.
The verification of numerical structural analysis of external fixation device is done using experimental analysis on real design. Experimental testing is done in a laboratory for material testing, using tensometric analysis equipment from the laboratory for mechanical design testing. In real conditions, the external fixation device is loaded through the bone segment. In experimental analysis, the bone segment is replaced with, geometrically, the same segment manufactured from beech tree [
15,
16,
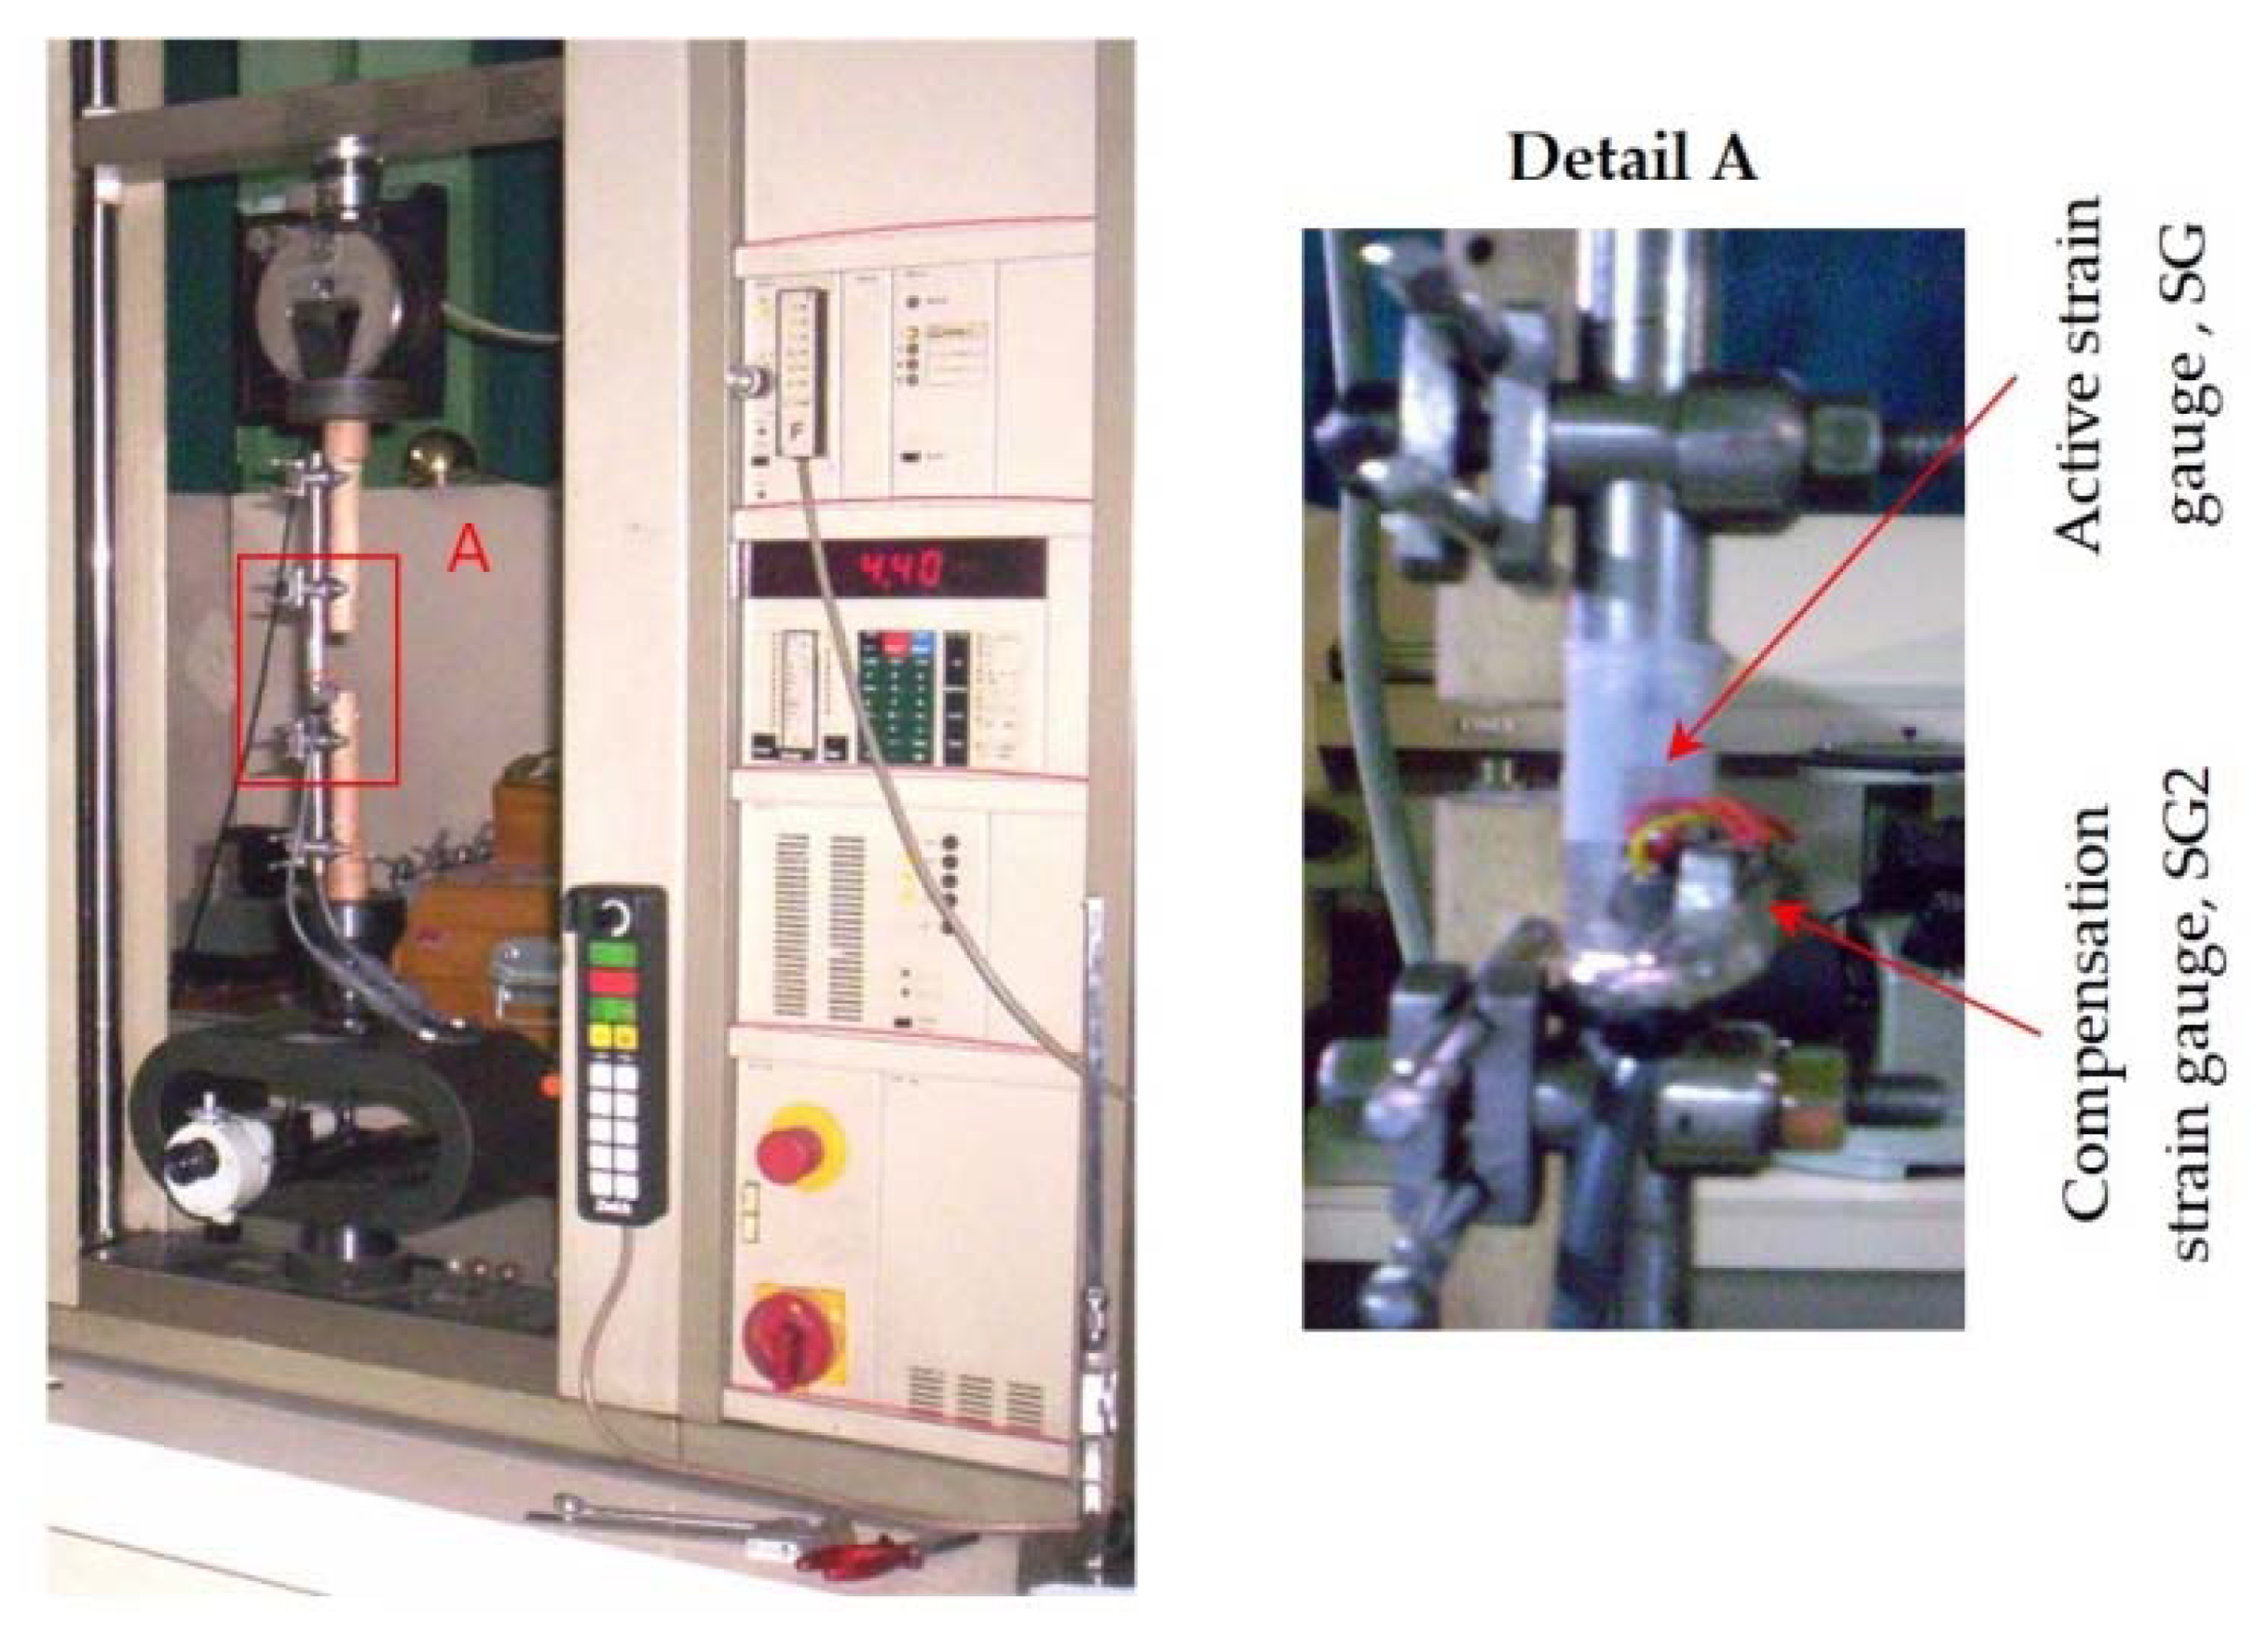
29]. In addition, supports of the lower and upper parts of the bone segment are supported using spherical joint to the testing machine. The end of the spherical joint is connected to the force sensor (
Figure 7).
The proximal bone segment displacements were monitored by a displacement transducer, while the loading was controlled by a force transducer (type U2A from HBM-Hottinger Baldwin Messtechnik GmbH, Darmstadt, Germany). Testing machine was a machine for material testing (Zwick GmbH & Co., Ulm, Germany, model 143501). Stress analysis was carried out using tensometric analysis equipment using data acquisition (DAQ) system QuantumX MX840B (HBM) and strain gauge 3/120LY11 (HBM), (
Figure 7).
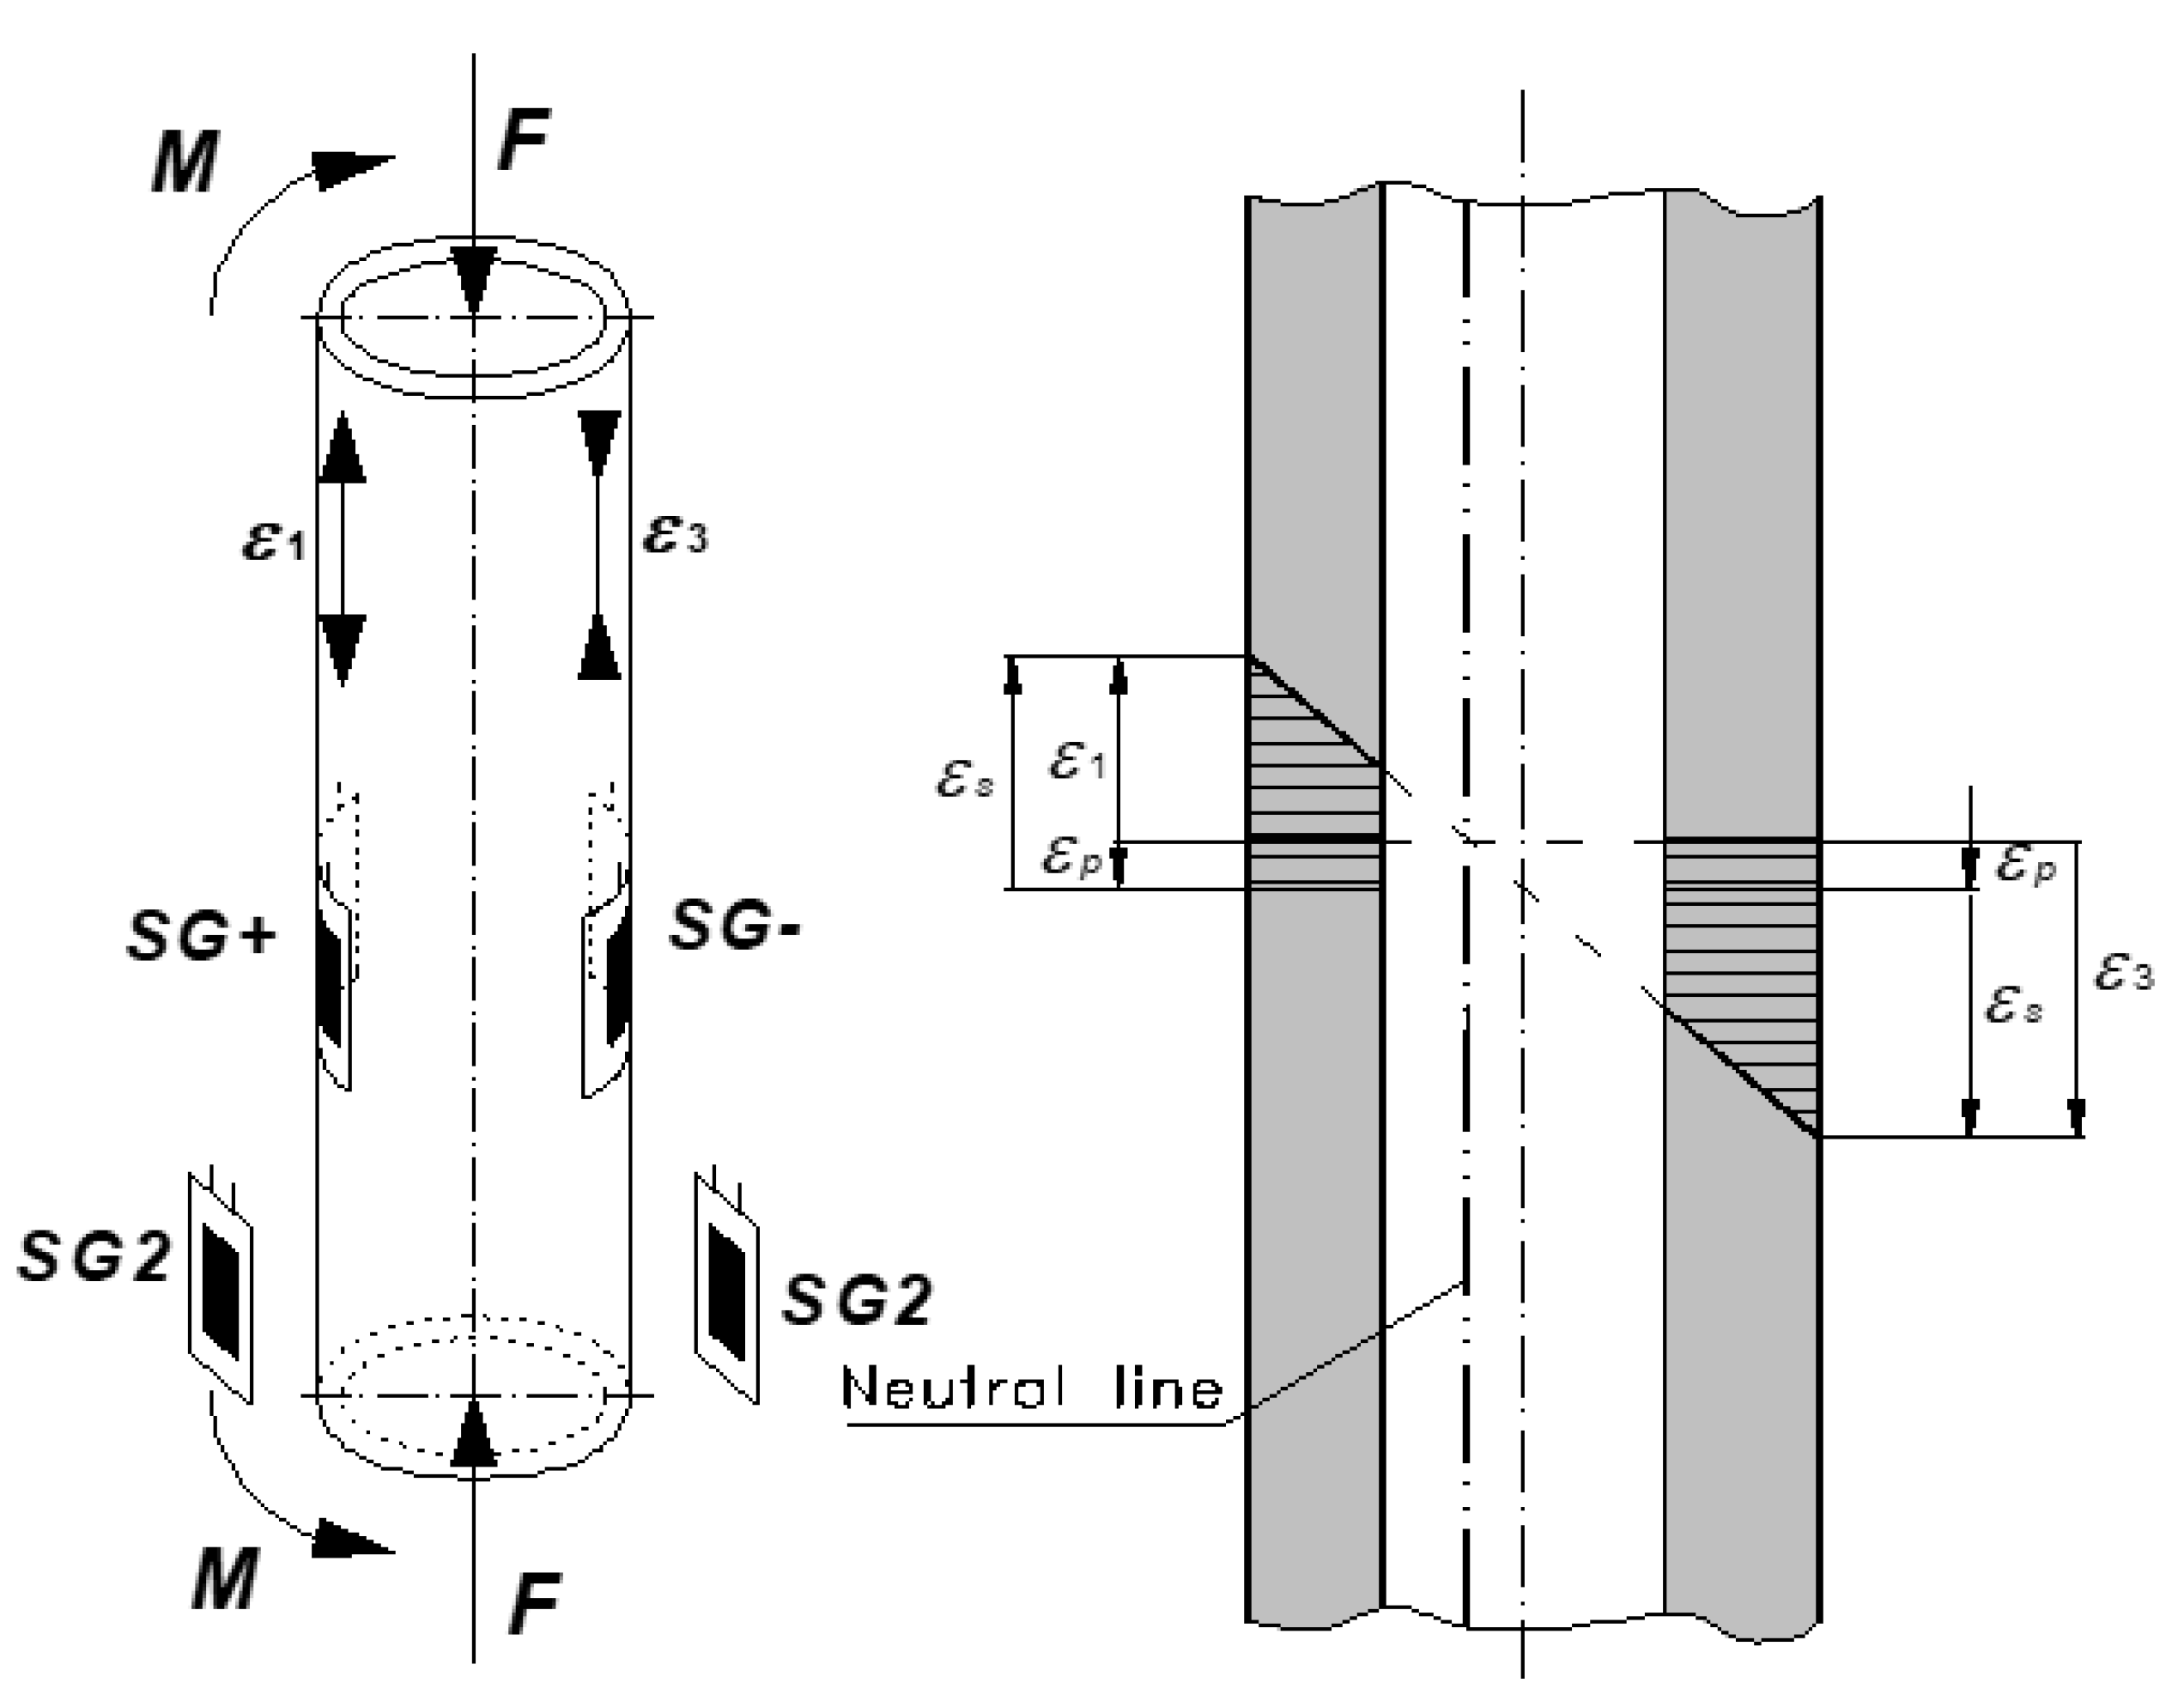
The fixator tree is loaded with eccentric pressure load at the place of the proximal bone segment. Because of eccentric pressure, principal deformations consist of bending deformations and axial pressure (
Figure 8); because of this, they can be defined using the superposition, as follows:
where:
is the strain component caused by the axial compressive force,
is the strain component caused by the bending moment,
is the axial compressive force, A the area cross-section of the fixator connecting rod, E modulus of elasticity, M bending moment, Z section modulus of the fixator connecting rod.
In this case, bending deformations are much larger than pressure deformations (
). According to that, this case of load has unequally distributed principal deformations along the longitudinal section of the tree. The neutral line does not match the axis of symmetry of the fixator tree (
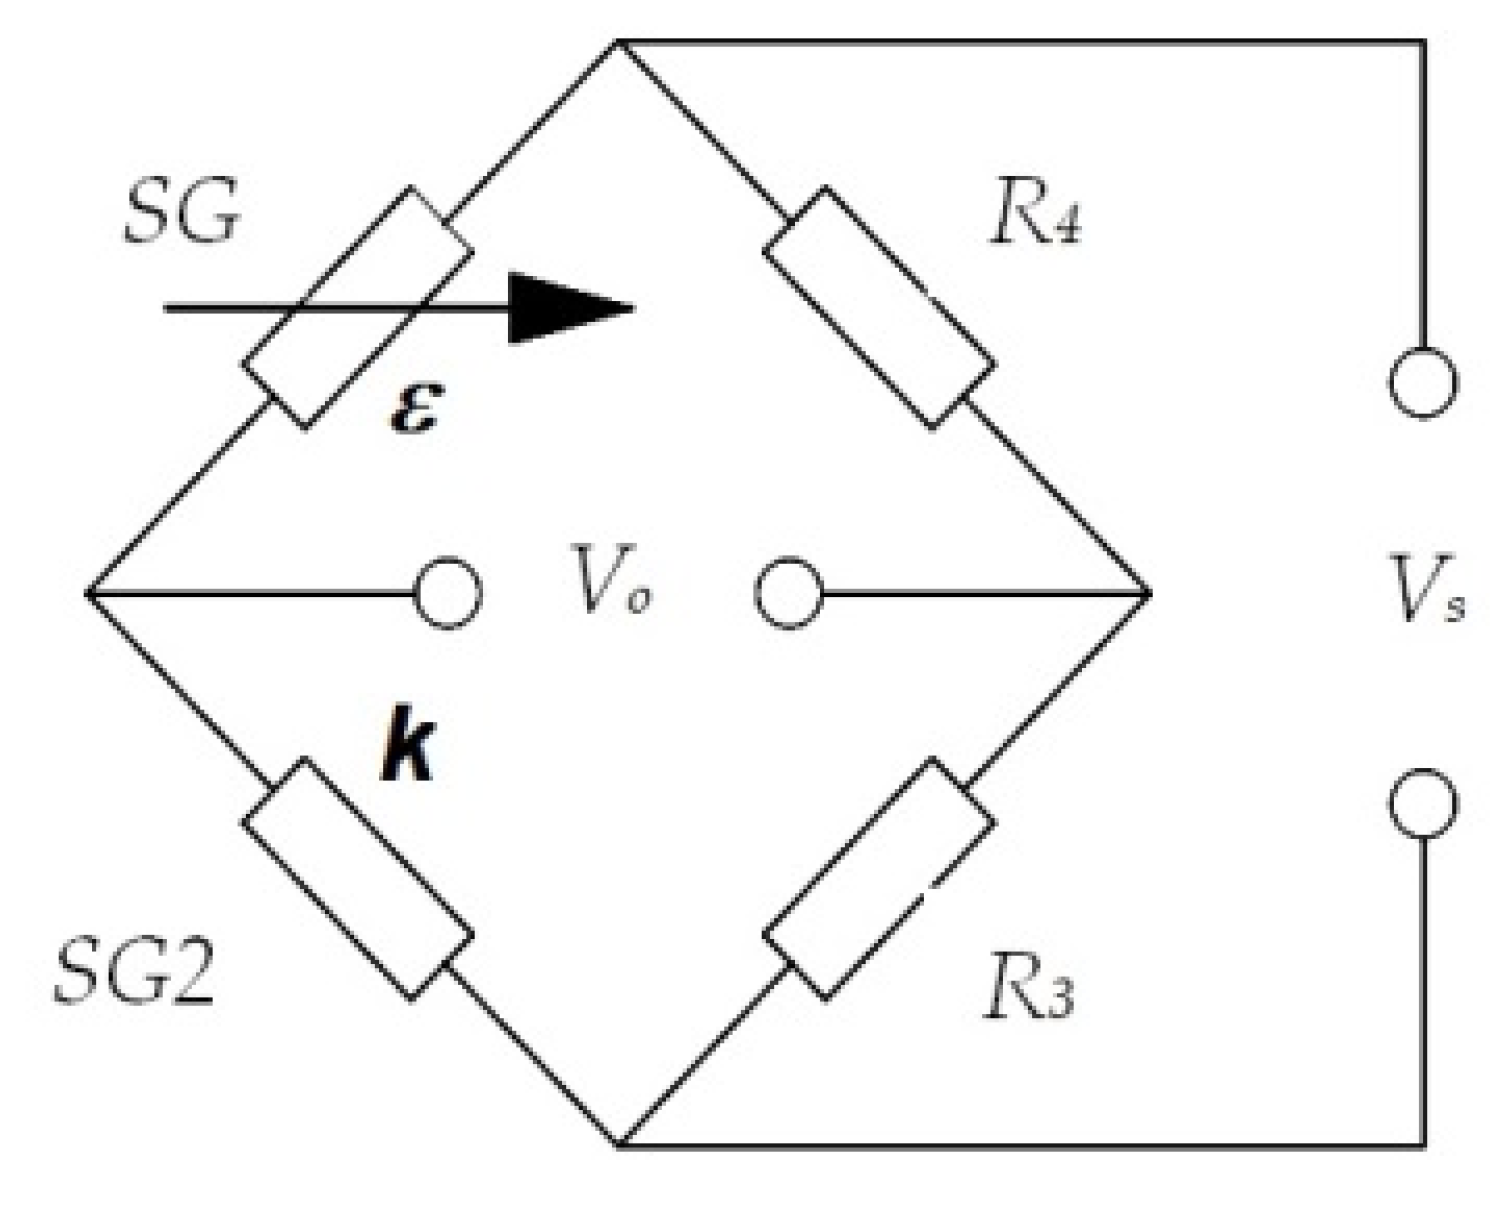
Figure 8). Because of this, two Wheatstone quarter bridges are applied and connected to the Quantum X system using two measuring channels. Wheatstone quarter bridges have one active SG and one compensation (passive) strain gauge SG2 (
Figure 8 and
Figure 9) of the same type. Compensation strain gauge is applied on the small, unloaded part, which is connected to fixator tree close to active strain gauge (
Figure 7 and
Figure 8). The unloaded part is manufactured from the same material as the fixator tree.
Using basic equation of the Wheatstone bridge:
If Equation (12) is used for quarter bridge deformation is:
where:
i
are output voltage and power voltage of Wheatstone bridge,
factor of strain gauge,
deformations measured using strain gauges.
Active strain gauges are applied at the diametrically opposite places of the fixator tree, at the nearest and farthest place from the bone model (
Figure 7 and
Figure 8), its longitudinal axis are lined up with the directions of principal deformations (
i
) at measuring places. Using this method, it is possible to measure the intensity of principal stresses at measuring places. Using the already carried up FEM numerical analysis, the direction and intensity of principal stress are determined. It can be noticed that the other two principal stresses are negligible in comparison to the biggest one (
at MP+) and smallest one (
at MP−) (
Table 4). According to this, principal stresses at measuring places (MP+ and MP−) can be calculated using Hook law for one axis stress condition:
For acquisition, processing and monitoring of measured results DAQ software Catman (HBM) were used.
5. Verification of Numerical Structural Analysis
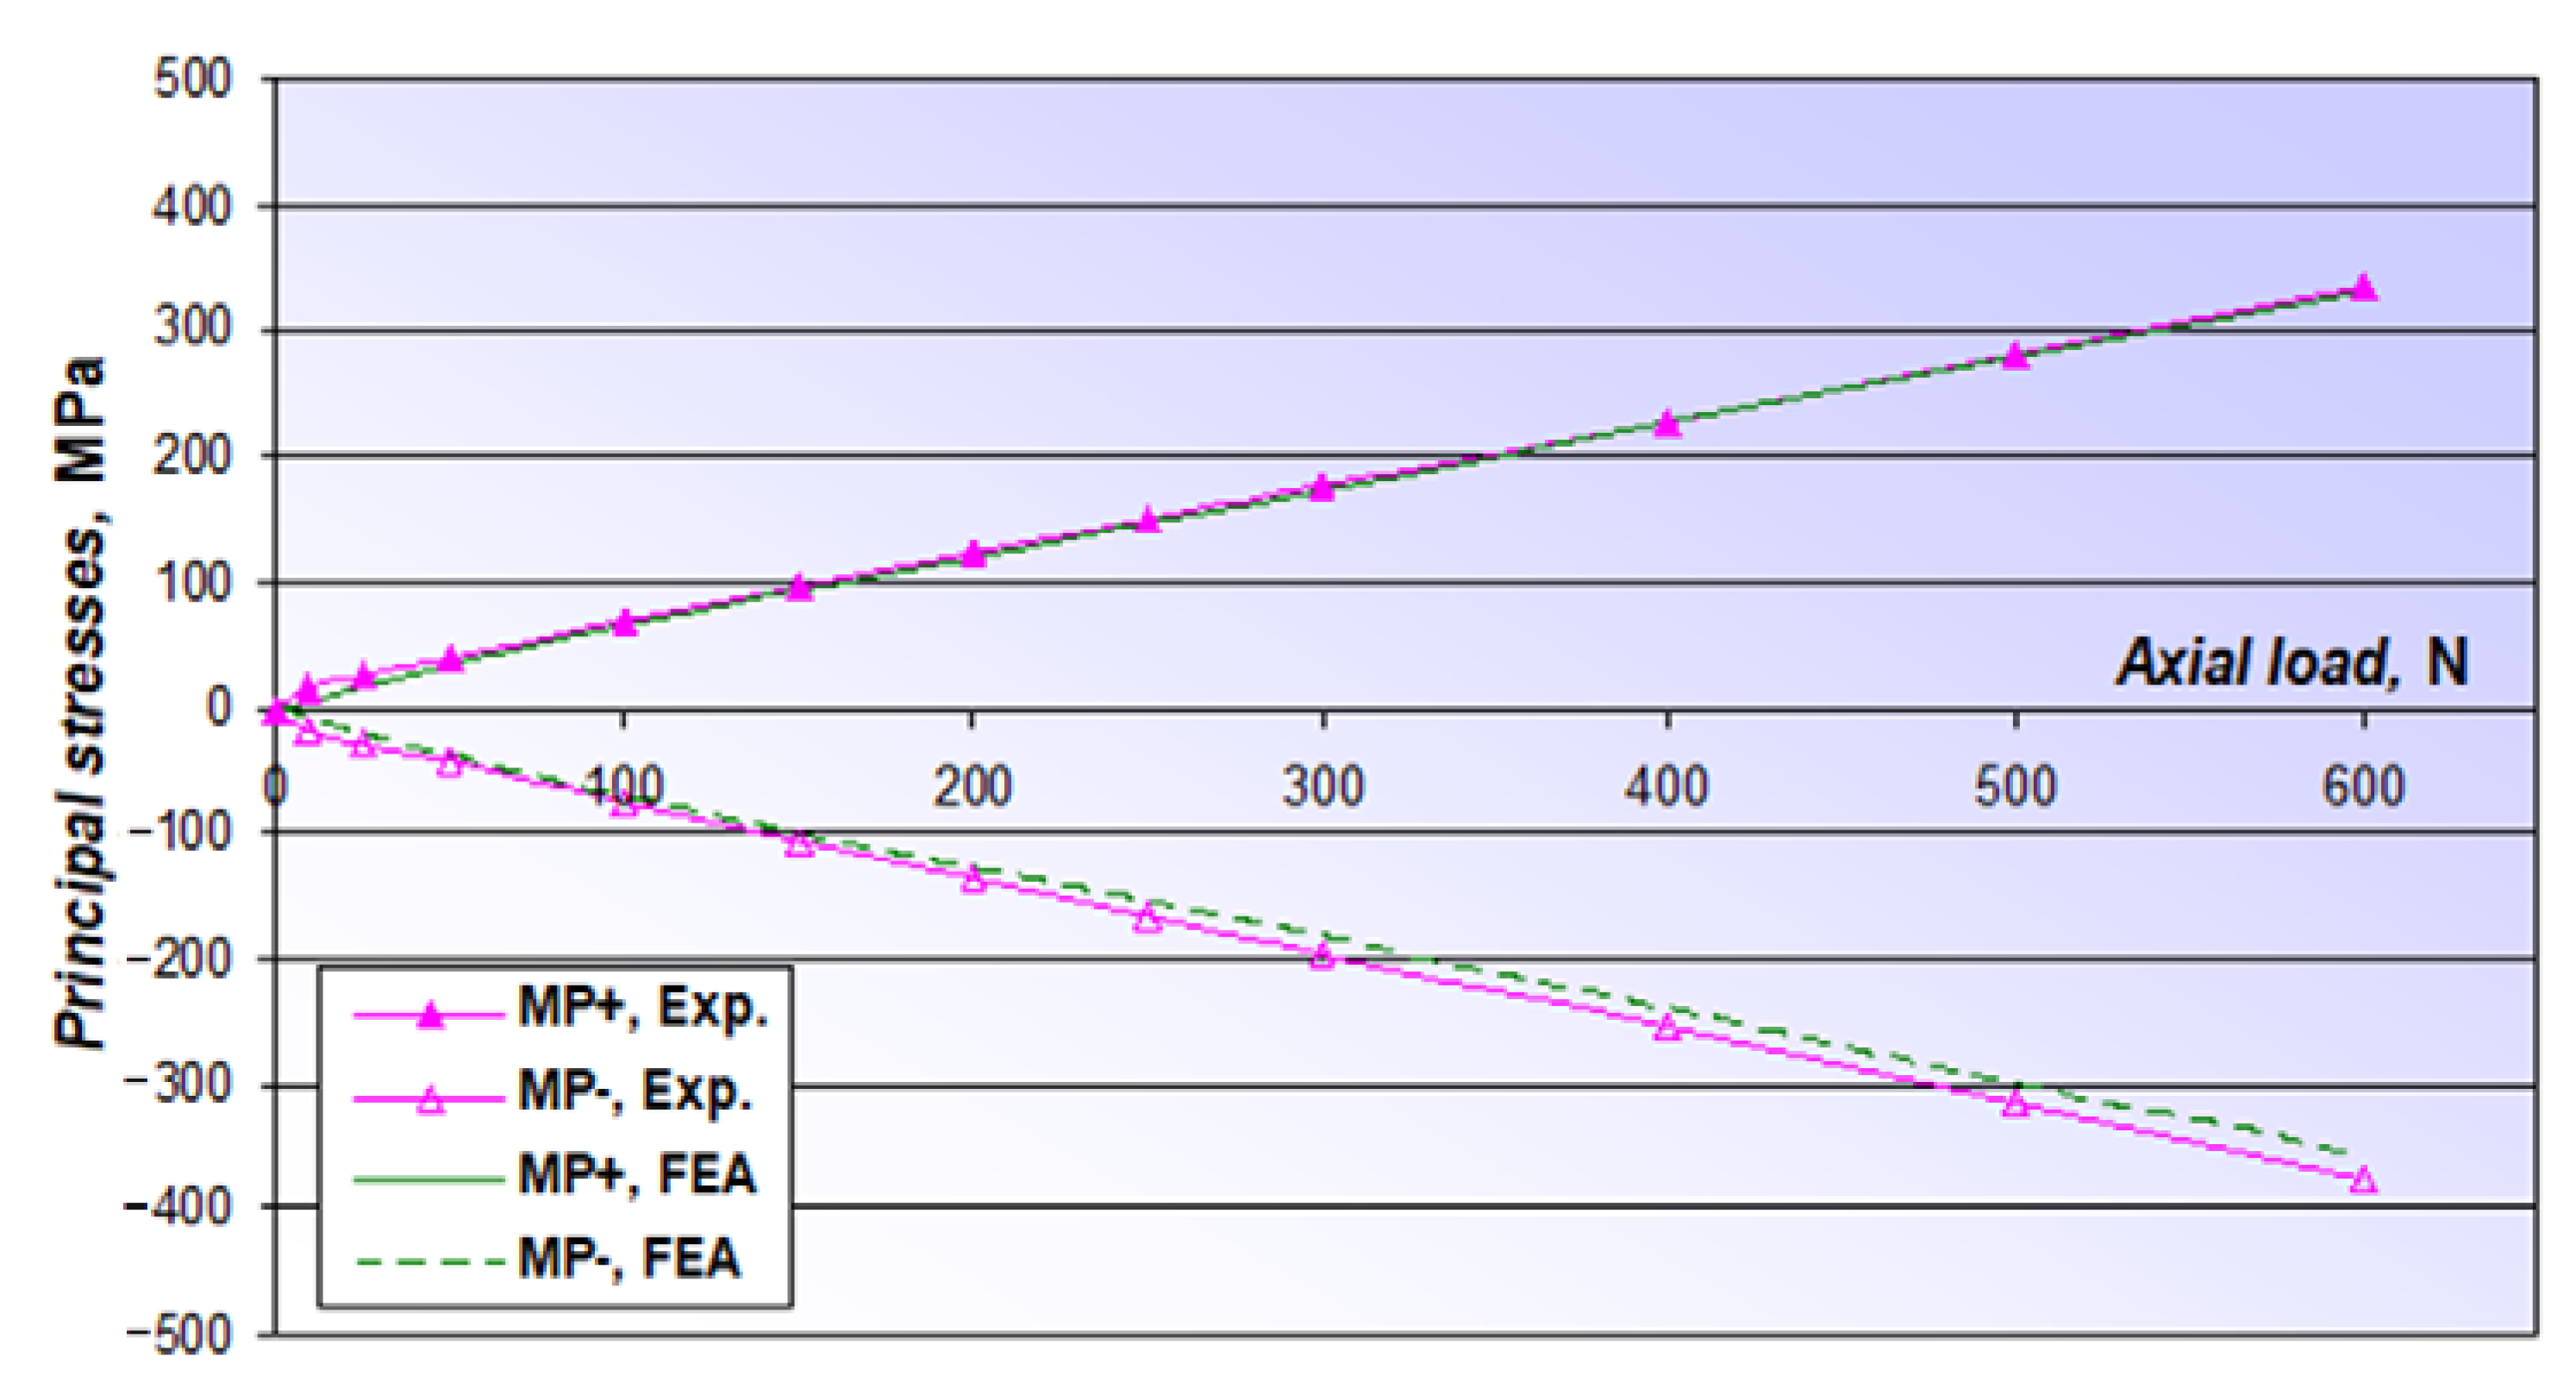
A comparative diagram of principal stresses
at MP+ and
at MP− during axial loads for experimental and numerical structural analysis is shown at
Figure 10. Good match of the results can be noticed with maximal deviations of 3.5% for principal stress
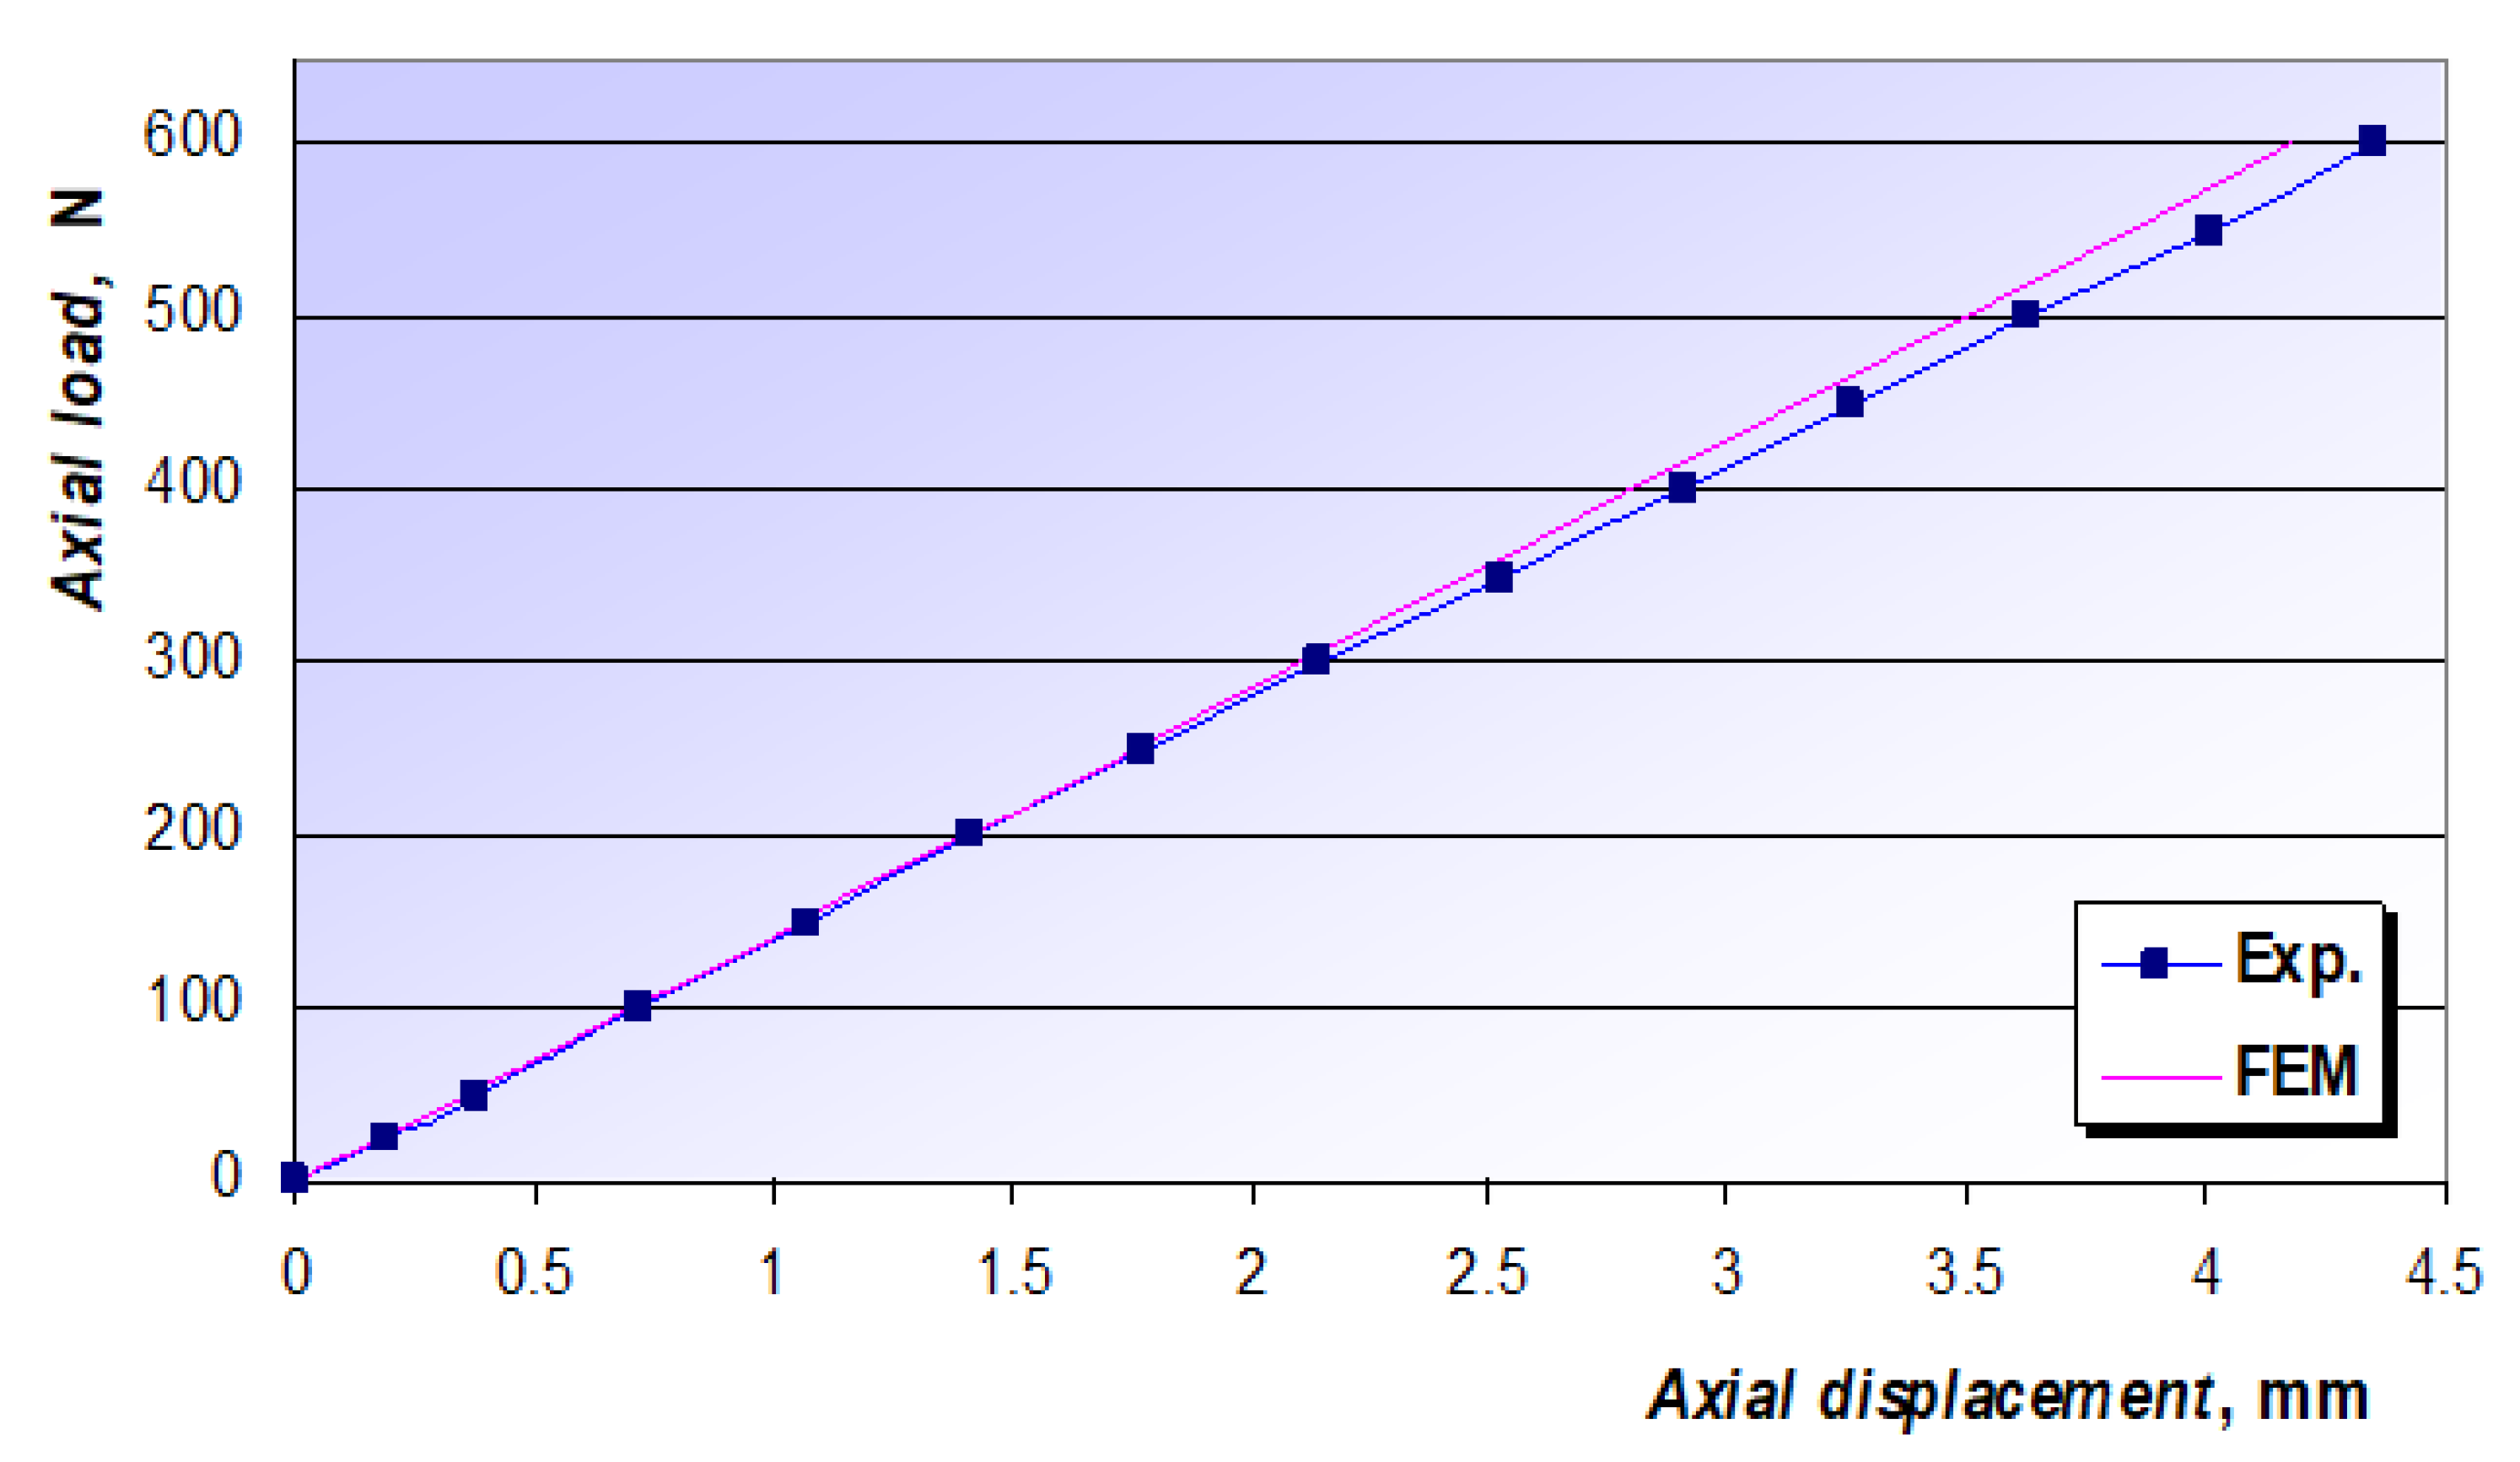
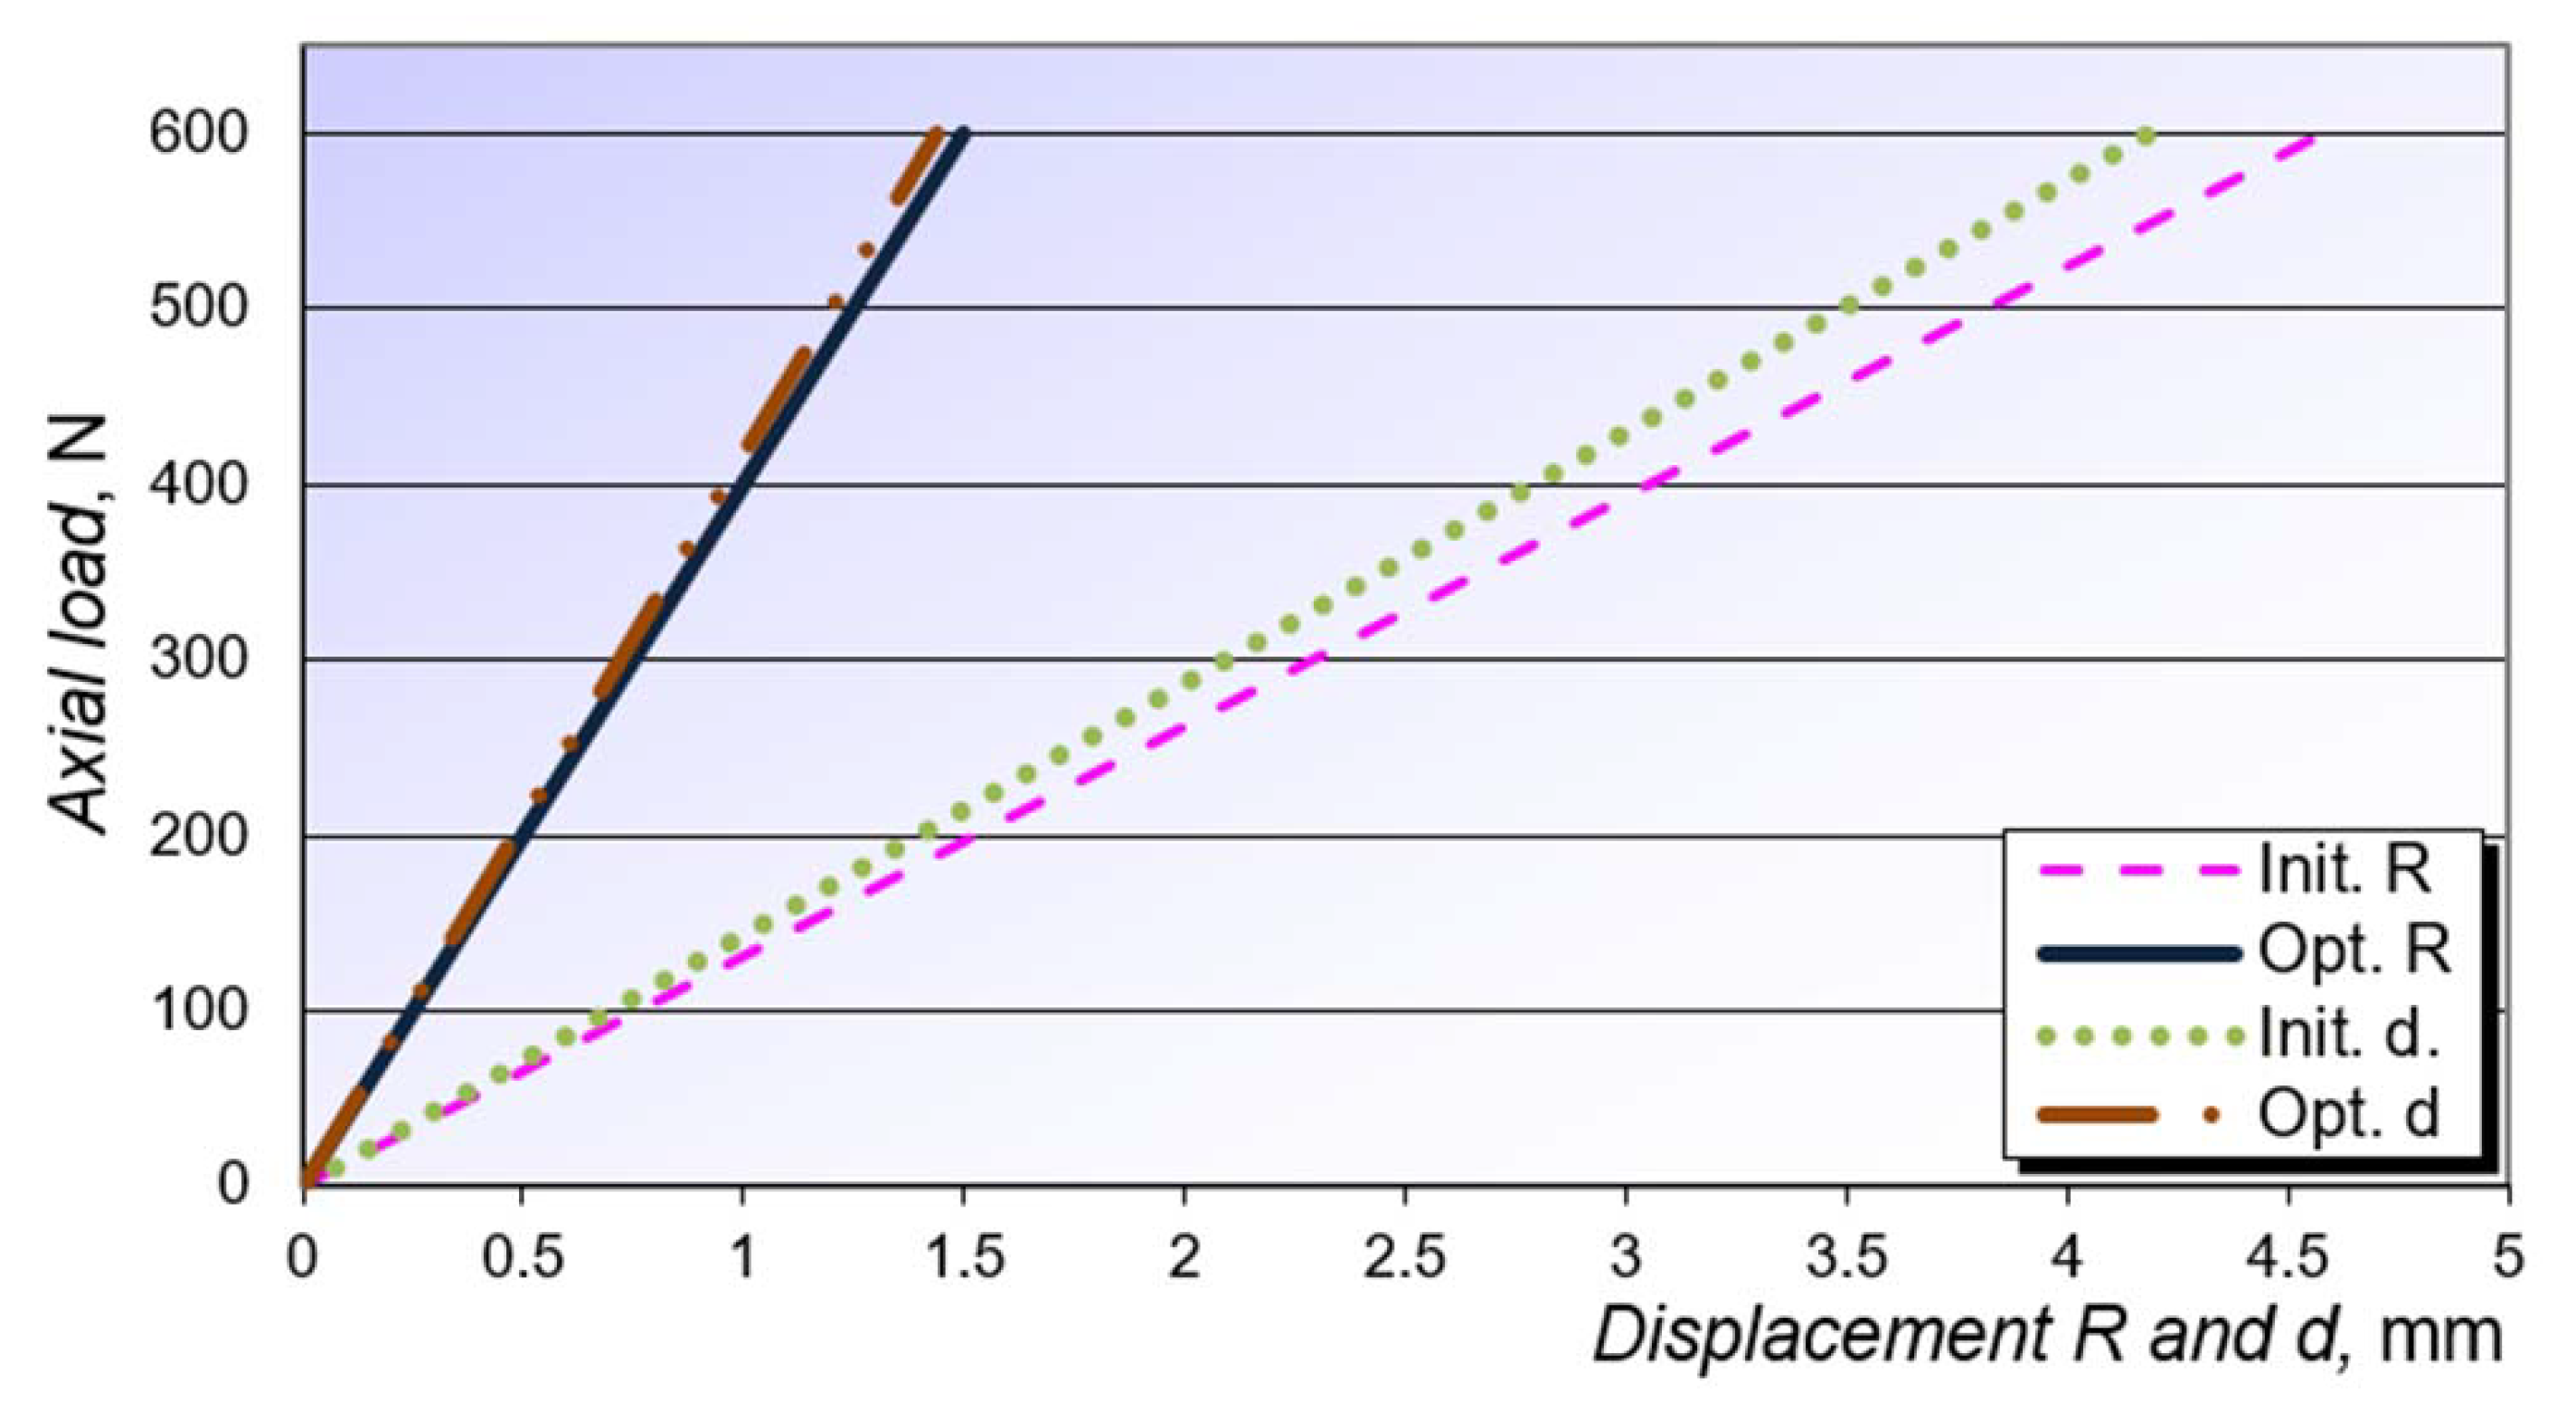
at fixator tree. In addition, comparative diagrams of dependencies of loads and displacements at the place of loads for experimental and numerical structural analysis are shown at
Figure 11. Moreover, a good match of the results can be noticed, with maximal deviations of 3.9% for axial displacements.
Table 3 shows results for interfragmentary displacement and displacement at loading place from FEM numerical analysis and experimental analysis.
Using Equation (2) and data from
Table 3 relative axial
, craniocaudal
and lateromedial
displacements can be calculated. Relative axial displacements are dominant. Lateromedial have significantly smaller values, and craniocaudal are equal to zero.
Table 4 shows intensity of principal and von Mises stresses at measuring places for FEM and an experimental analysis.
It can be seen that von Mises stress at measuring place MP+ correspond to the intensity of principal stress σ1 at same place. In addition, von Mises stress at measuring place MP− corresponds to the intensity of principal stress .
6. Optimization Model
An iterative hybrid optimization algorithm is developed. This algorithm works on a combined global and local level. At the global level, the global algorithm based on the simulated annealing (SA) method is used, and on the local level, local algorithm based on the conjugate gradient (CG) method is used. Search for the solution space starts with the SA method, because local optima need to be avoided. After a global optimum is located, the algorithm of the CG method is activated, with a goal to precisely find a local optimum.
6.1. Simulated Annealing Method
To explain the SA method, the term “temperature” is used, together with Boltzmann criterion, and it represents the “mathematical temperature” of the optimization system [
30]. Boltzmann distribution means that the energy of the system E, for thermal balance at temperature T distributed using following equation:
where: P(E) probability of reaching energy level E, k Boltzmann constant.
It can be noticed that, at higher temperatures, the system has almost the same possibility to reach any energy level, but at lower temperatures, the system has the small possibility of reaching height energy level (8).
Table 5 shows an analogy between real physics annealing and the SA method for optimization.
Based on the Metropolis criterion [
30], the possibility of acceptant of next point (state) x
i+1 depends on the difference in energy levels or values of the cost function of two points:
New energy state or now potential solution x
i+1 can be calculated using Boltzmann distribution:
Boltzmann constant is used as a scaling factor in the SA method, and usually, it has a value of k = 1. In the case that , Equation (10) gives and point xi+1 are always accepted. This is a logical choice in the content of cost function minimization, because its value is better (smaller) than In the case that value of equation is worse (bigger) than .
Conventional optimization methods will not accept the point xi+1 as the next point of the iteration. The possibility of accepting of point xi+1, despite the fact that it gives poorer value of cost function in comparison to point xi, is final (no matter how small it may be) in the case that Metropolis criterion is used.
It is important to notice that the possibility of accepting the point xi+1, defined using Equation (10), is not the same, and it depends on the values of and T. If the temperature T is high, the possibility of accepting the point xi+1, with a high value of cost function , will also be high. Because of this, in the case of high temperatures, because of a high possibility, poorer solutions can be accepted. In the case when temperature is low, possibility of acceptance of solution xi+1 is also small. It can be concluded that whit the fall of temperature (closing to the optimal solution), the possibility of acceptance of point xi+1, with bigger values than point xi, is smaller.
6.2. Conjugate Gradient Method
In comparison to SA method, which is not constrained with the shape of constrains and cost functions, the conjugate gradient (CG) method works with continuous differential functions. CG methods enable a local search, and because of this, continual cost functions with one optimum are recommended. It is based on finding a close local minimum of the function with n variables, with an assumption that the gradient of that function can be calculated [
30].
Successive approximations for the cost function f(
x) minimum in the CG method [
31] are generated using the iterative equation:
where
is optimal length of the step in direction
. The solution of the 1D optimization problem is:
Gradient of cost function f (
x) = f (x
1, x
2, …, x
n) represents a vector:
Important properties of the gradient vector are in the fact that the gradient in point
x is directed in the direction of the maximal increasing of cost function. The maximal decreasing is in the opposite direction. It represents a negative gradient vector. A small step in the direction of negative gradient vector will result in maximal local decreasing of cost function. Negative gradient vector represents a direction of the maximal decreasing of cost function. It can be described as:
6.3. Optimization Model of External Fixation Device
For mobile design such as external fixation device, fast and reliably healing (decreasing the displacement at fracture gap) with light design is most important. Because of that, for the cost function of the optimization model, the minimum volume of design is selected:
where:
is vector of reference construction parameters which are used for fixator parametrization (
Table 6),
is the volume of fixator elements, and i is the element of design. External fixation device has 61 elements in total.
For optimization parameters, referent design parameters are chosen. Parameters have the most important impact on cost function. Using numerical and experimental analysis, the most important parameters are determined. These parameters have a big influence on the mechanical stability of external fixation device, and on its volume. These parameters are optimization parameters (free parameters). Range and step can be defined for these parameters (
Table 6).
Using these optimization parameters and its range and steps, areas of possible design solution are reduced. Constrains of optimization parameters are defined as:
The initial values of optimization parameters (
Table 6) are defined at the beginning of the optimization process. The optimization algorithm uses these values, and tries to reduce its values to achieve convergences to its optimal values. If the search in one direction is successful and the local optimum is not found, the step is increased with a goal to increase the speed of the algorithm.
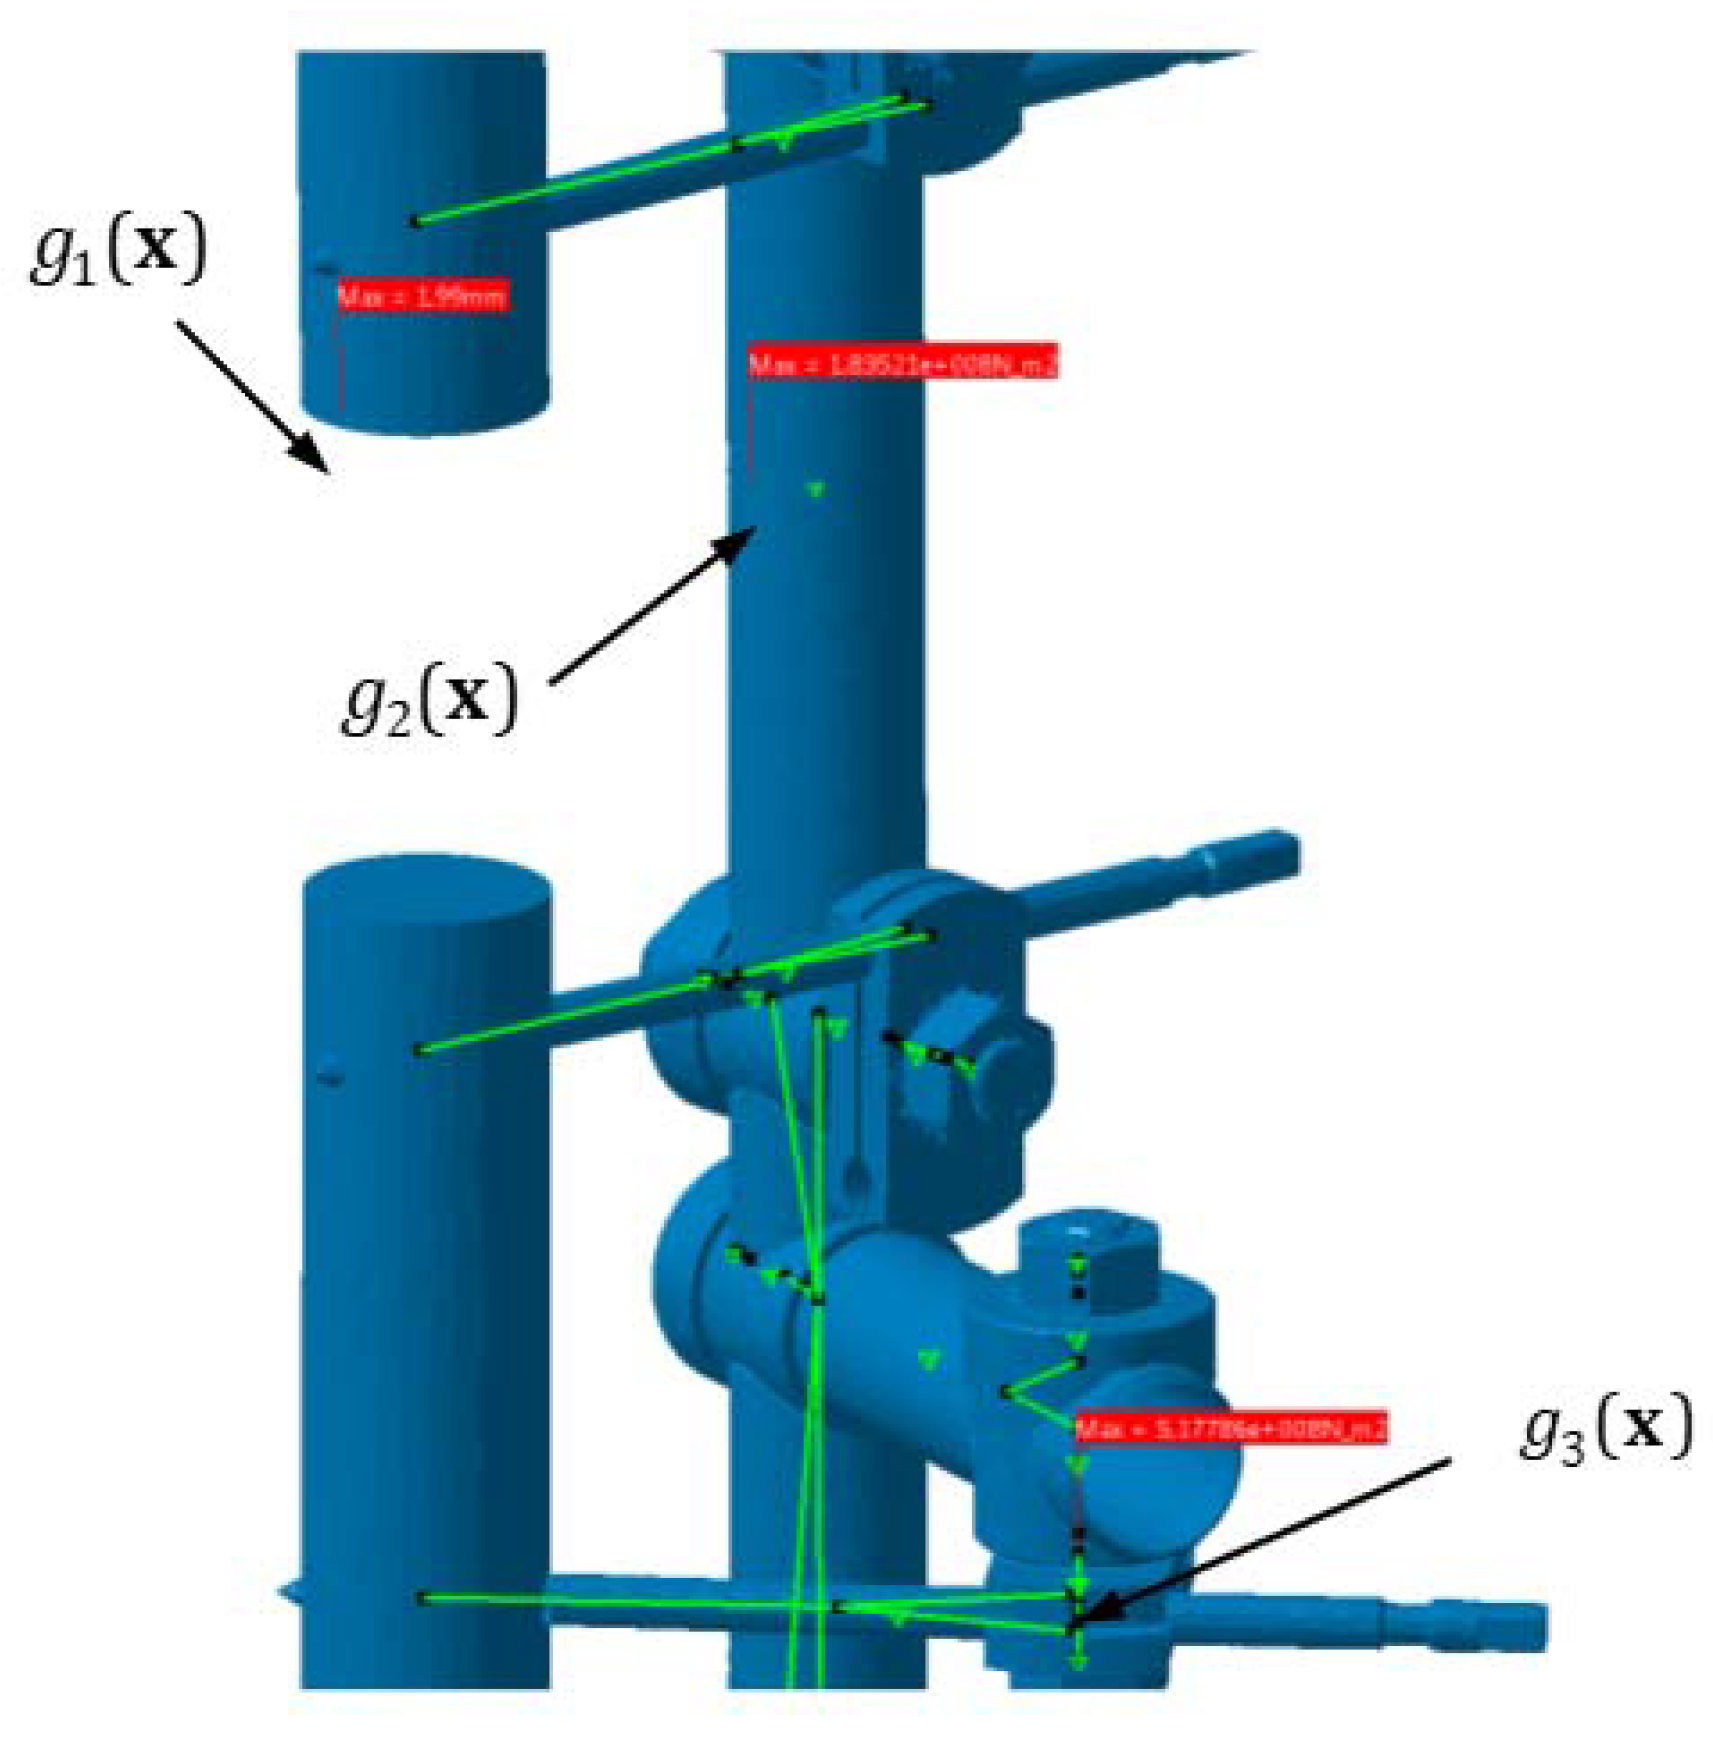
Optimization design constrains in the form of stress and deformation constrains are defined in FEM model. The constrains of optimization model are defined in a form of interfragmentary displacements at fracture gap and as dimensional and stress constrains of external fixator device and its components. Dimensional constrains are defined using already mentioned ranges for optimization parameters.
Allowed displacements at fracture gap are significantly reduced in comparison to initial design. This is done because small displacements increase the speed of bone healing. The constrains of interfragmentary displacement are treated as main constrain (Constraint 1). The equation of constrain of proximal segment displacement at fracture gap (
Figure 12) is:
where:
is maximal resulted displacement of proximal bone segment at fracture gap, and
is recommended for the maximal displacements of proximal bone segment at fracture gap for given fracture gap size [
27].
In the optimization model of the external fixation device, two stress constrains are given:
- -
At control place at the middle of fixator, tree local sensor for von Mises stress (local sensor-von Mises stress) is defined. The place of local sensor is the same place where strain gauges are placed in experimental analysis, and the same place where stress is controlled during numerical structural analysis (
Figure 12). The equation of stress constrains at fixator tree is:
where:
is maximal von Mises stress measured using sensors at fixator tree,
= 700 MPa is allowed stress of material.
- -
At the place of maximal von Mises stress at clamping plates, the local sensor for von Mises stress (
Figure 12) is defined. This constrain is introduced with the goal to control the value of stress during optimization process. Equation of stress constrain at clamping plates is:
where:
is maximal von Mises stress measured using sensors at clamping plates.
At
Figure 12, places of applied constrains of displacement
and stress constrains
, are defined.
7. Integration of Knowledge-Based Engineering System
Working principles, structure, and information flow through the developed algorithm of the KBE system (
Figure 13), and can be described via the following steps:
The optimization algorithm has a task to calculate the values of optimization parameters (inside defined range) which satisfy constrains (displacements and stresses), and at the same time, minimize the cost function (volume). This algorithm generates a different combination of optimization variables, which are variables for potential optimum, and which are then used by the parametrization algorithm as design parameters. In this way, the optimization algorithm changes the geometry of the external fixation device.
The developed algorithm for parametric 3D CAD modeling uses optimization variables as design parameters. Changing these design parameters, the design of the external fixation device can be changed. The calculation of volume for every new design of the external fixation device is automatically carried out by the optimization algorithm.
The FEM model is updated, and a structural analysis is carried out. Updating the CAD model leads to the automatic update of the FEM model. The mesh of the FEM model and the connection between components are updated. Numerical structural analysis is carried out again, and new results are obtained.
Using structural analysis and considering:
- -
values of cost function (volume of updated CAD model) and
- -
stress and deformation constrains at control places generated combinations of optimization parameters (design parameters) are evaluated. Algorithm saves the best achieved result of the cost function in one iteration. Each iteration algorithm tries to improve the solution from the previous iteration.
Steps from 1 to 4 are repeated until the convergence of results is achieved, or one of the constrains stop the optimization process.
8. Results
The goal of the developed KBE system is to achieve better design of the external fixation device without major design changes. The volume of the external fixation device is reduced from 1.143 × 10
5 mm
3 to 1.032 × 10
5 mm
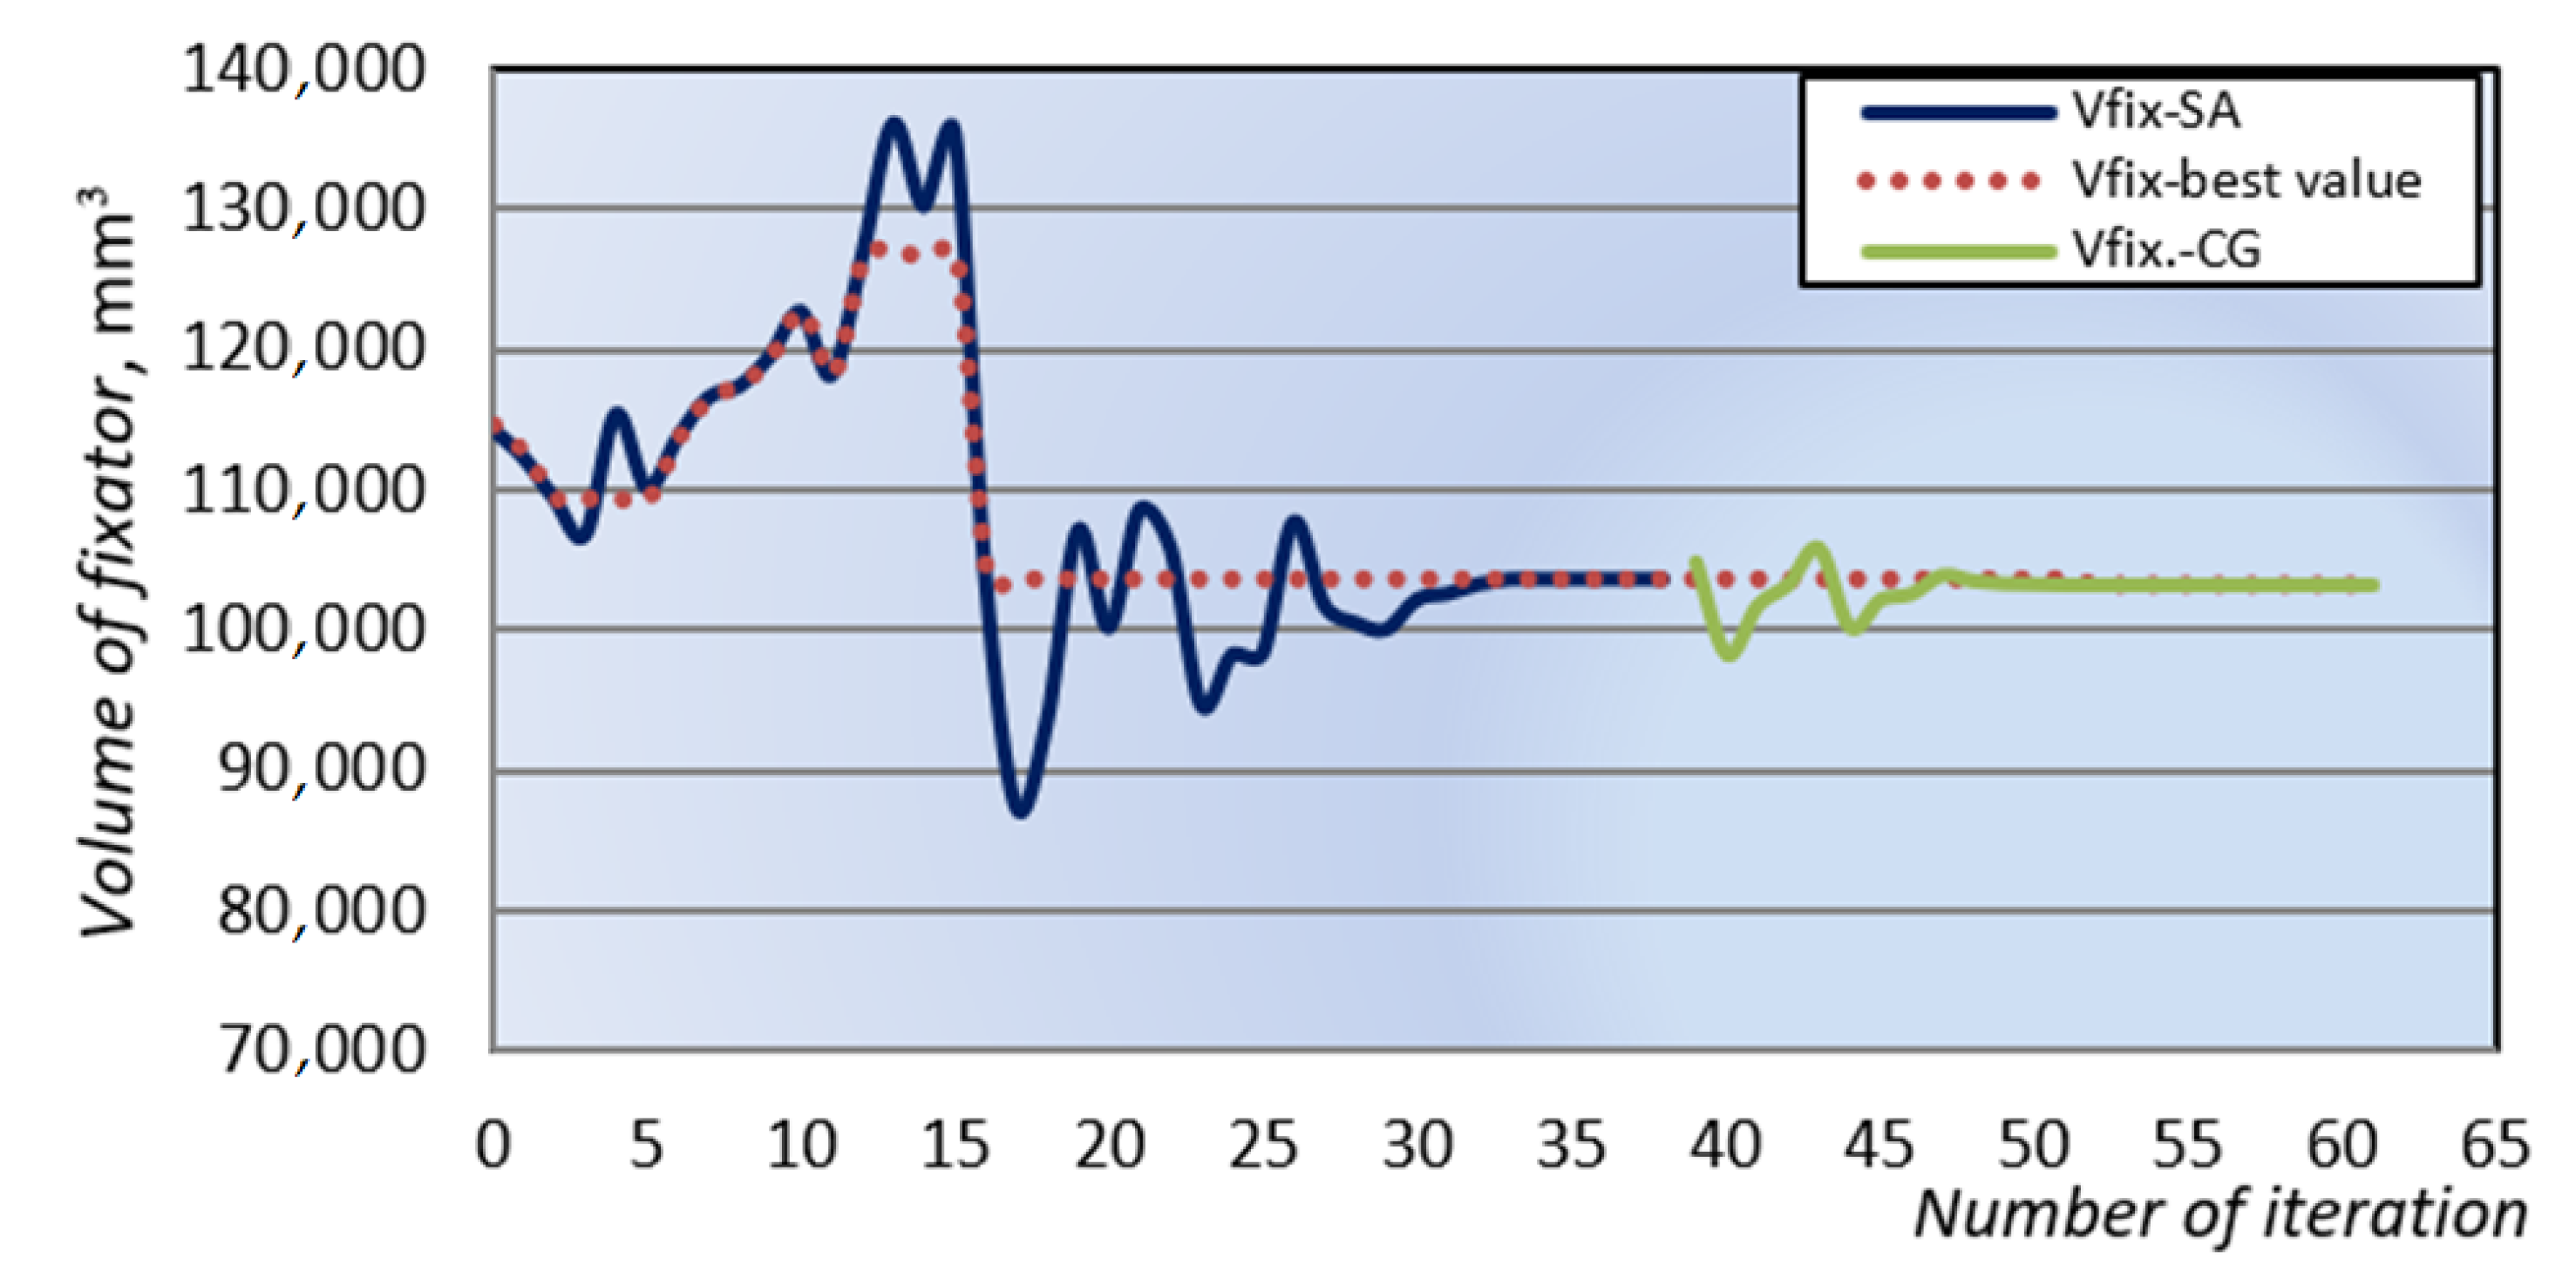
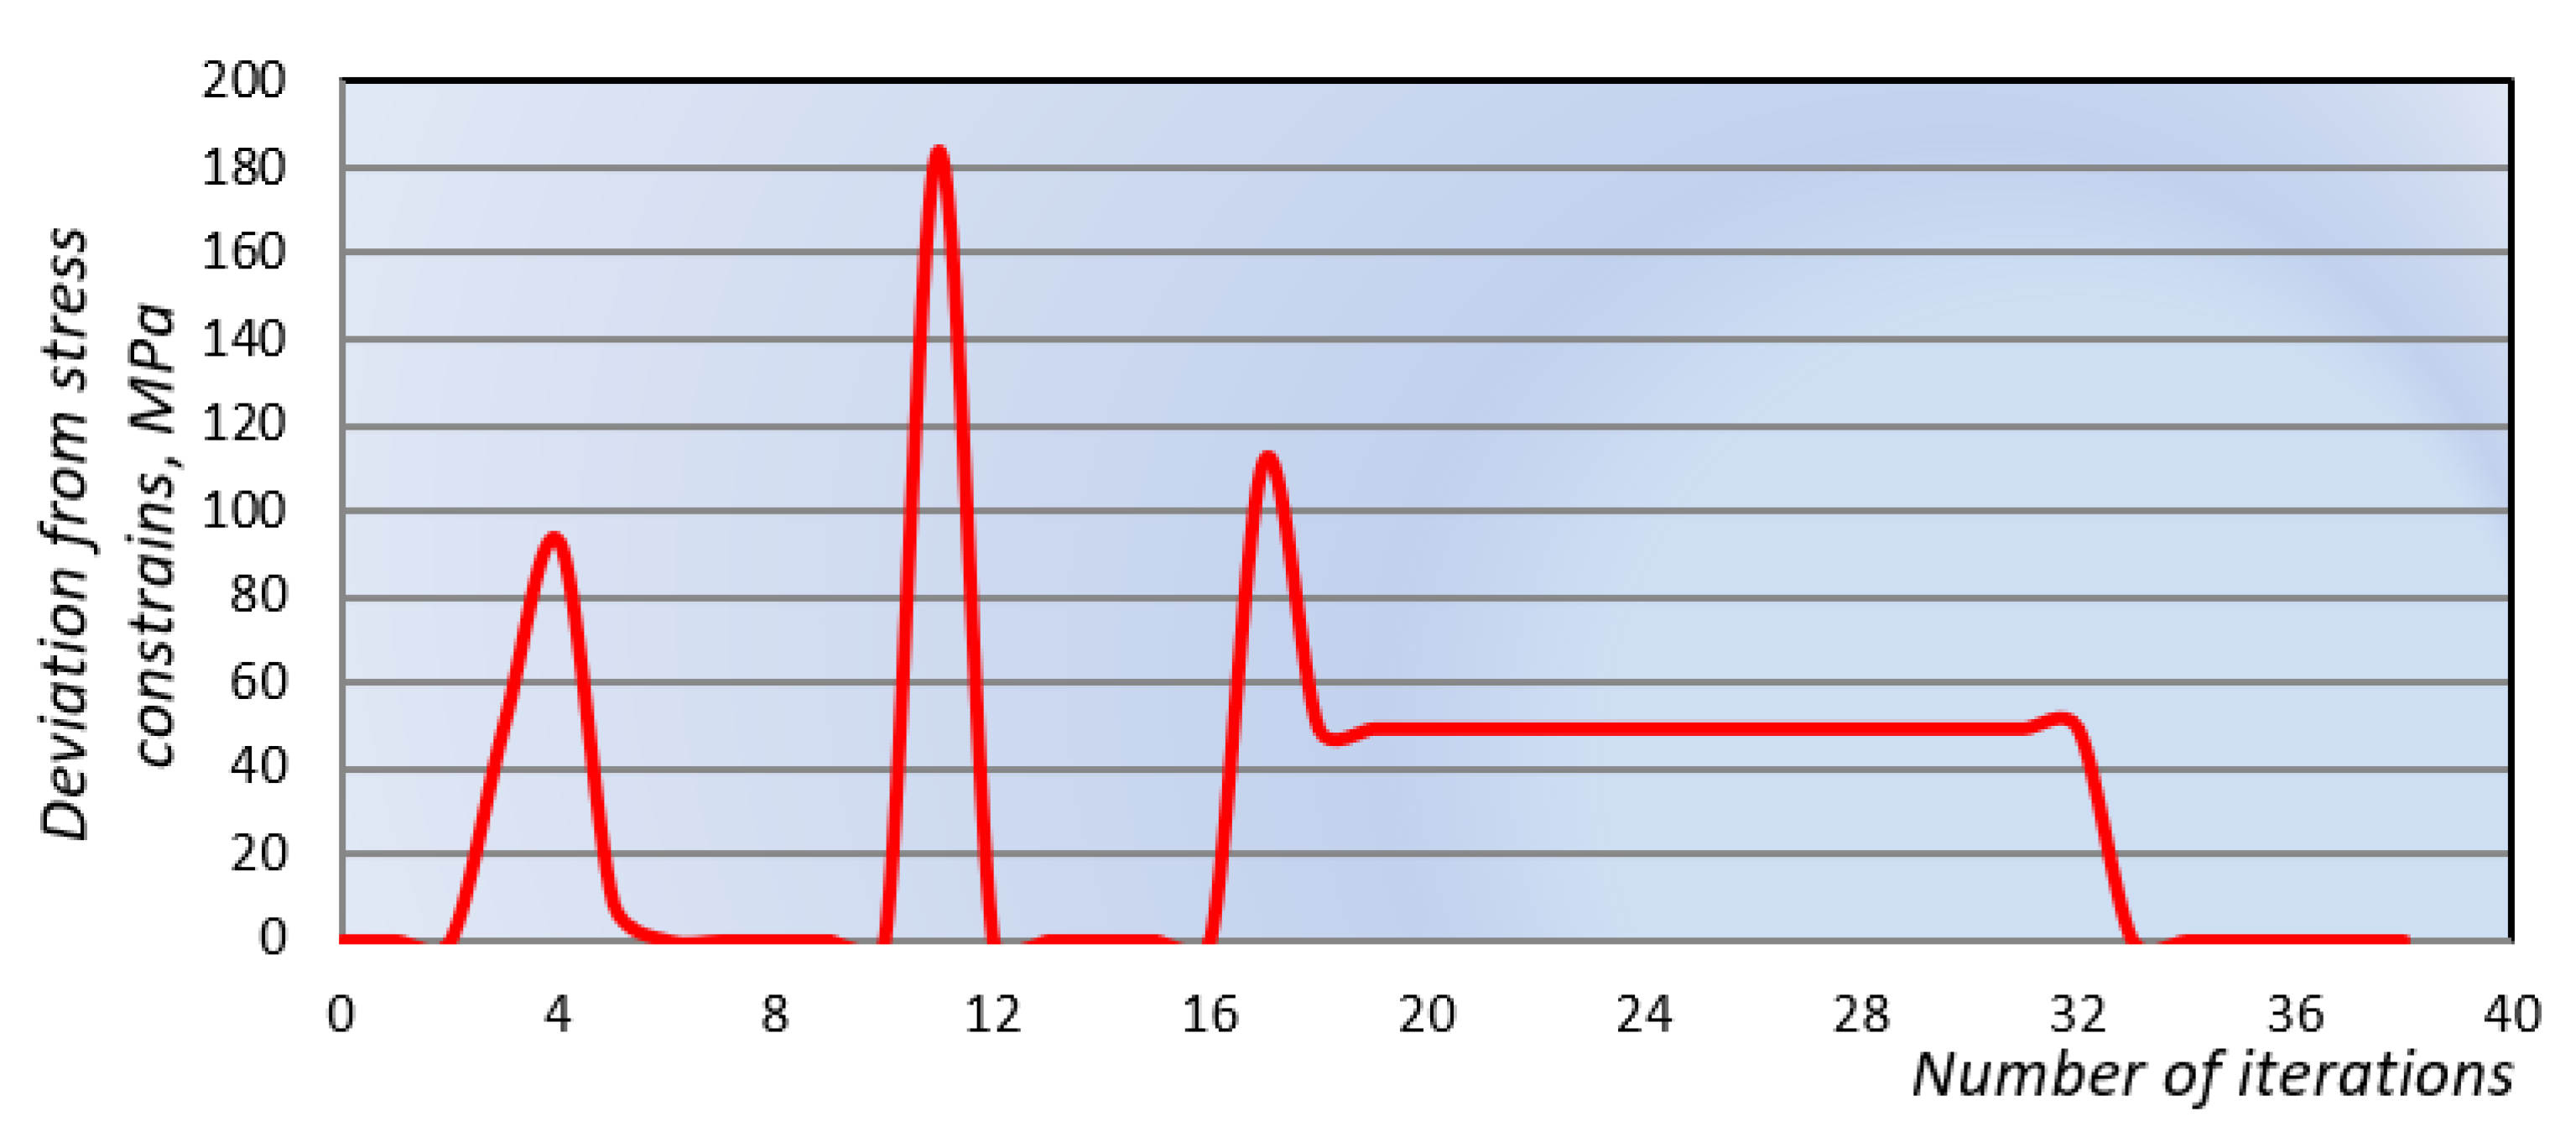
3. The best solution for cost function is achieved in the sixteenth iteration of the SA algorithm (
Figure 14). After that, the algorithm tries to find a better solution (from 16. to 33. iteration), but constrains go out of the allowed range. After finding the optimal solution using the global algorithm, CG algorithm is activated. CG algorithm did not improve the optimal solution significantly; the value of cost function decreases from 1.036 × 10
5 mm
3 to 1.032 × 10
5 mm
3 (
Figure 14).
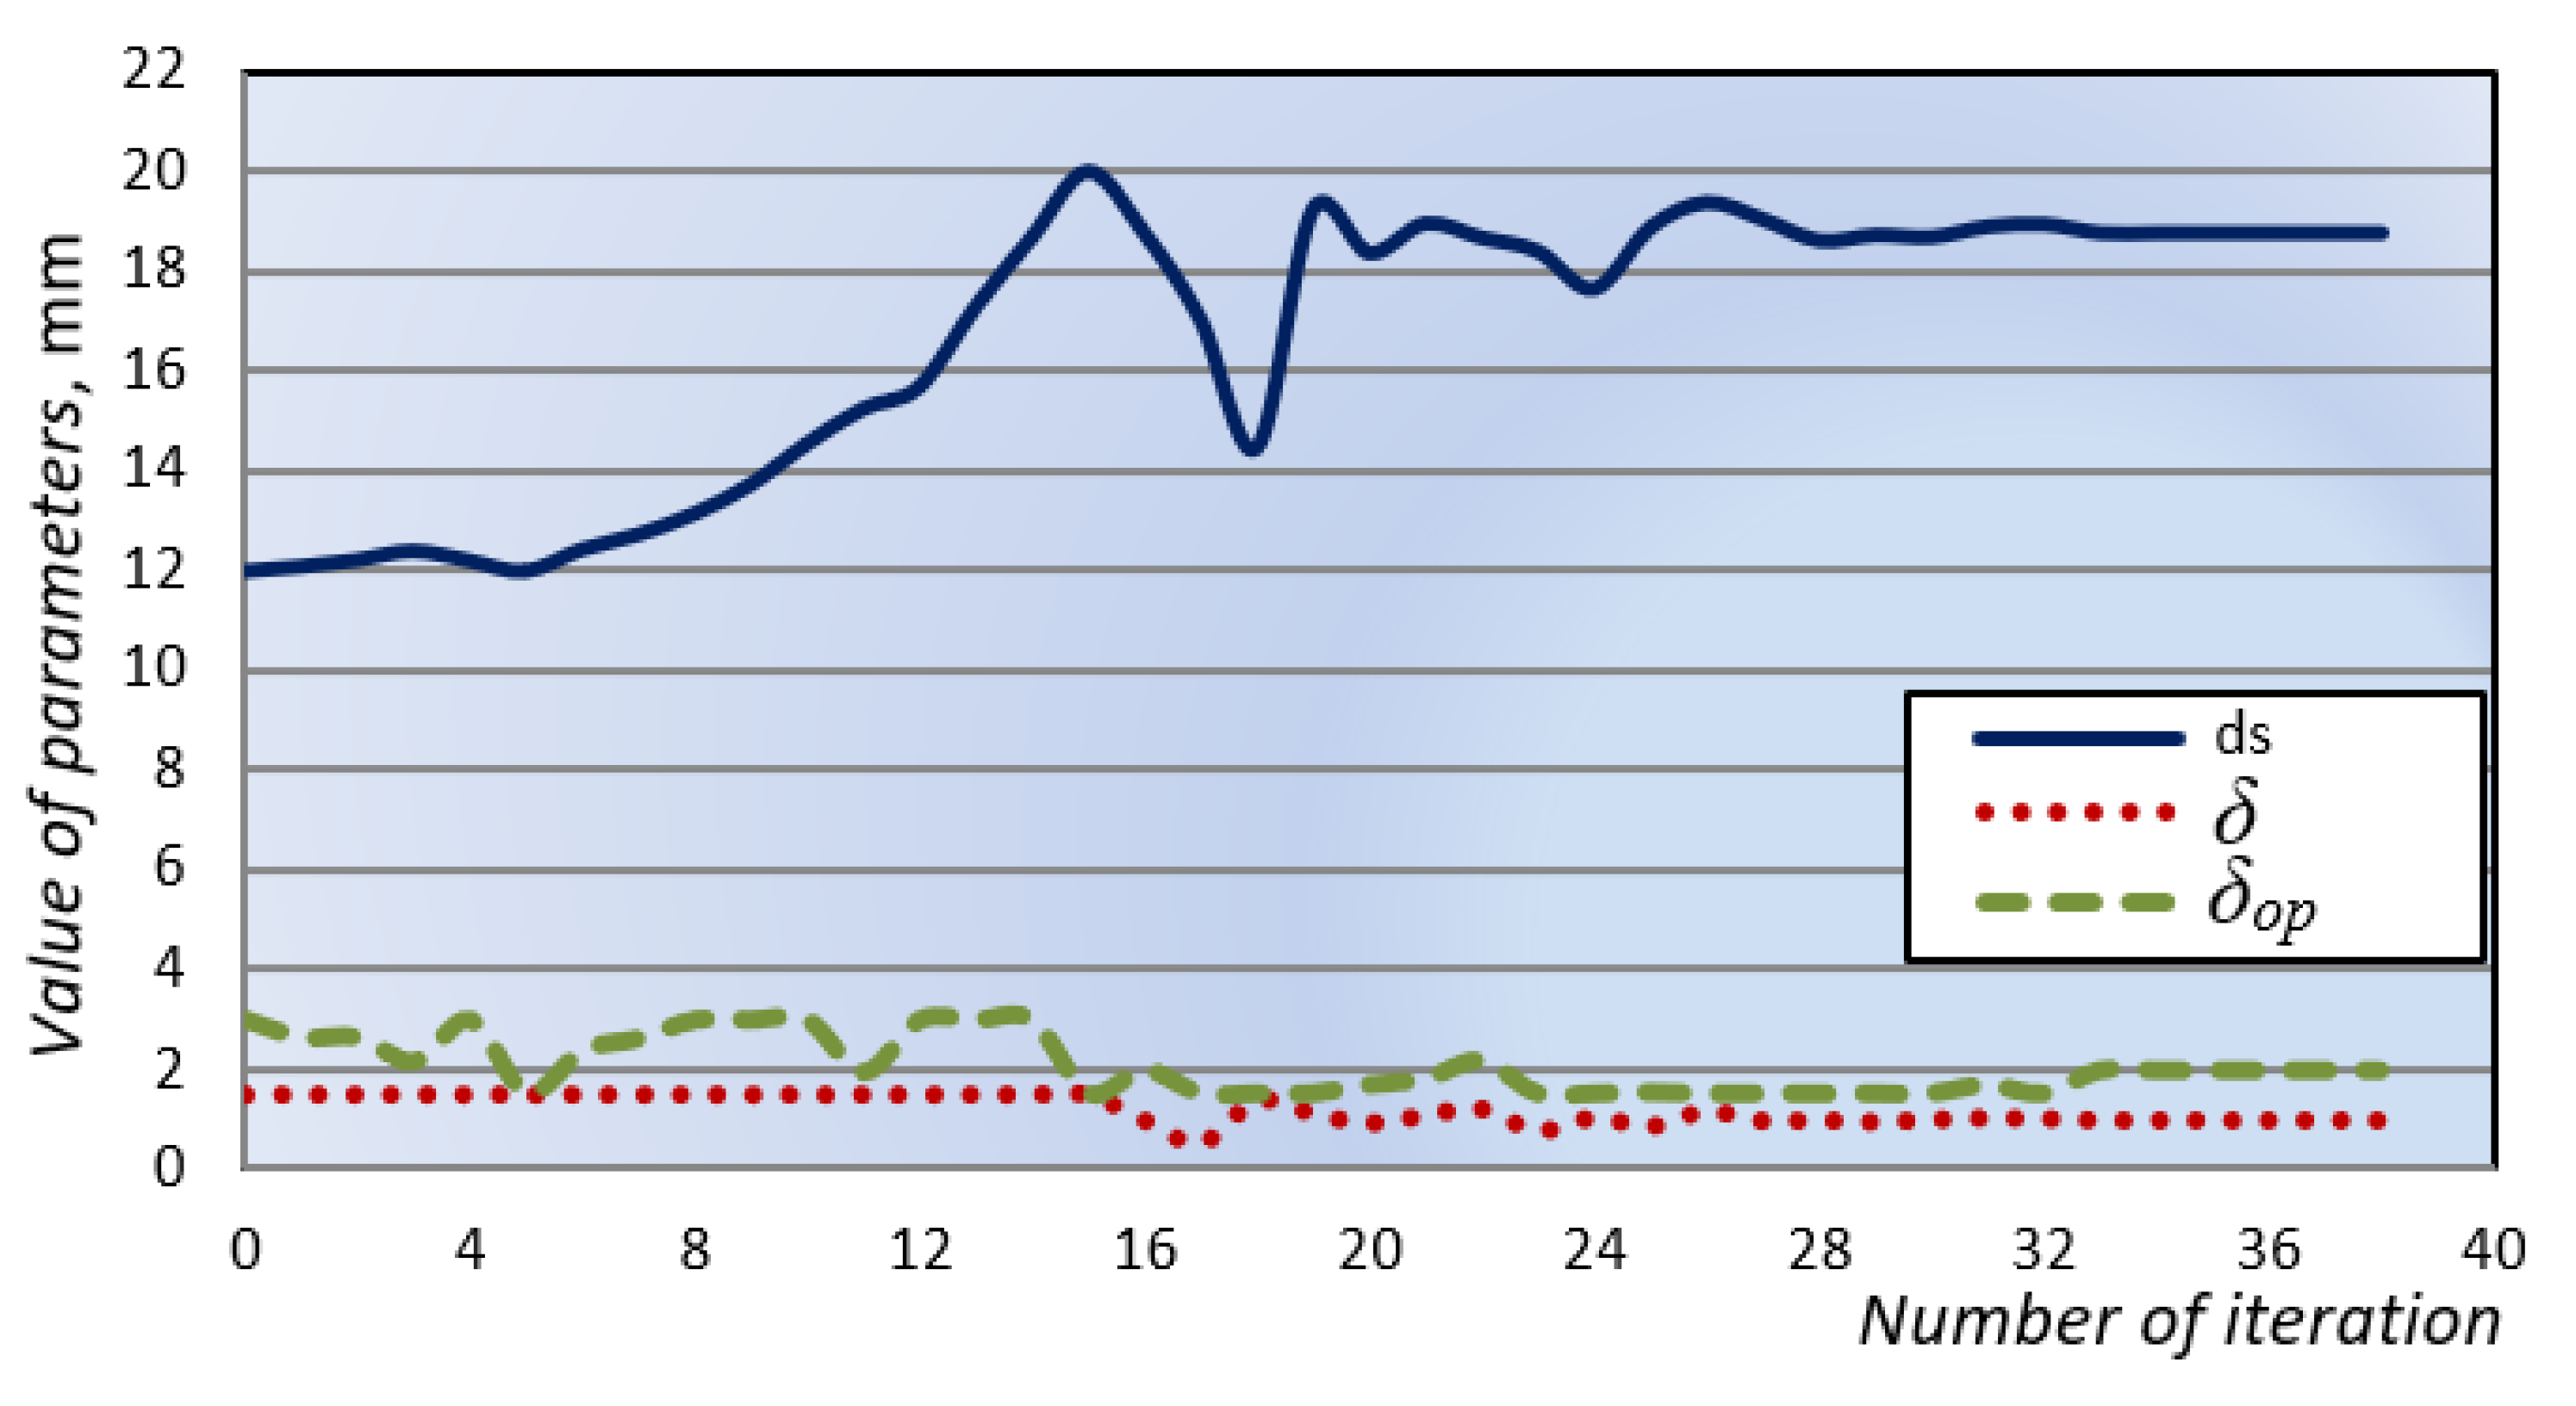
Changes in optimization parameters (design parameters), during the optimization process, are shown in
Figure 15. The diameter of fixator tree is increased ds (56.37%), and at the same time, tree wall thickness δ (35.07%) and basic thickness of clamping plates δ
op (34.5%) are decreased (
Figure 15 and
Table 7). In addition, the values of interfragmentary displacement at fracture place R, which indicate the stability of fracture place, are decreased for 67.25% (
Table 7).
The SA algorithm, after 33 iterations, completely converges to the best solution of cost function (
Figure 14), and achieves the optimal solution of analyzed design parameters, which minimizes the value of the external fixation device volume (
Figure 15). In addition, optimization constrains in the form of displacements and von Mises stresses are fulfilled (
Figure 16 and
Figure 17). The CG algorithm did not have significant influence on the optimization parameters.
Significant decreases of displacement of bone segment D
p (68.31%) (
Figure 16) and interfragmentary displacement D
d (R) (
Figure 18) are achieved by increasing the diameter of the external fixation device tree (56.37%), which results in a significant increase of the resistance moment (108.52%), and a reduction of the deformations and von Mises stresses (48.21%) at the fixator tree (
Table 7).
The comparison between initial and optimized design, using basic design parameters, is given in
Table 7. The goal of structural optimization was to decrease the volume of the whole design of the external fixation device by optimizing non-standard components. In addition, the goal was to increase the mechanical properties of the external fixation device. The volume of the initial design of external fixation device is reduced by 9.36%.
It is important to notice that using this optimized design of the external fixation device, significantly smaller lateromedially displacements at fracture gap can be achieved, D
p(y) and for 72.22% and D
d(y) for 72.96% in correlation to initial design (
Table 7 and
Figure 18). It is known that transverse displacements can slow down the speed of recovery, and they can cause the occurrence of pseudo arthrosis.
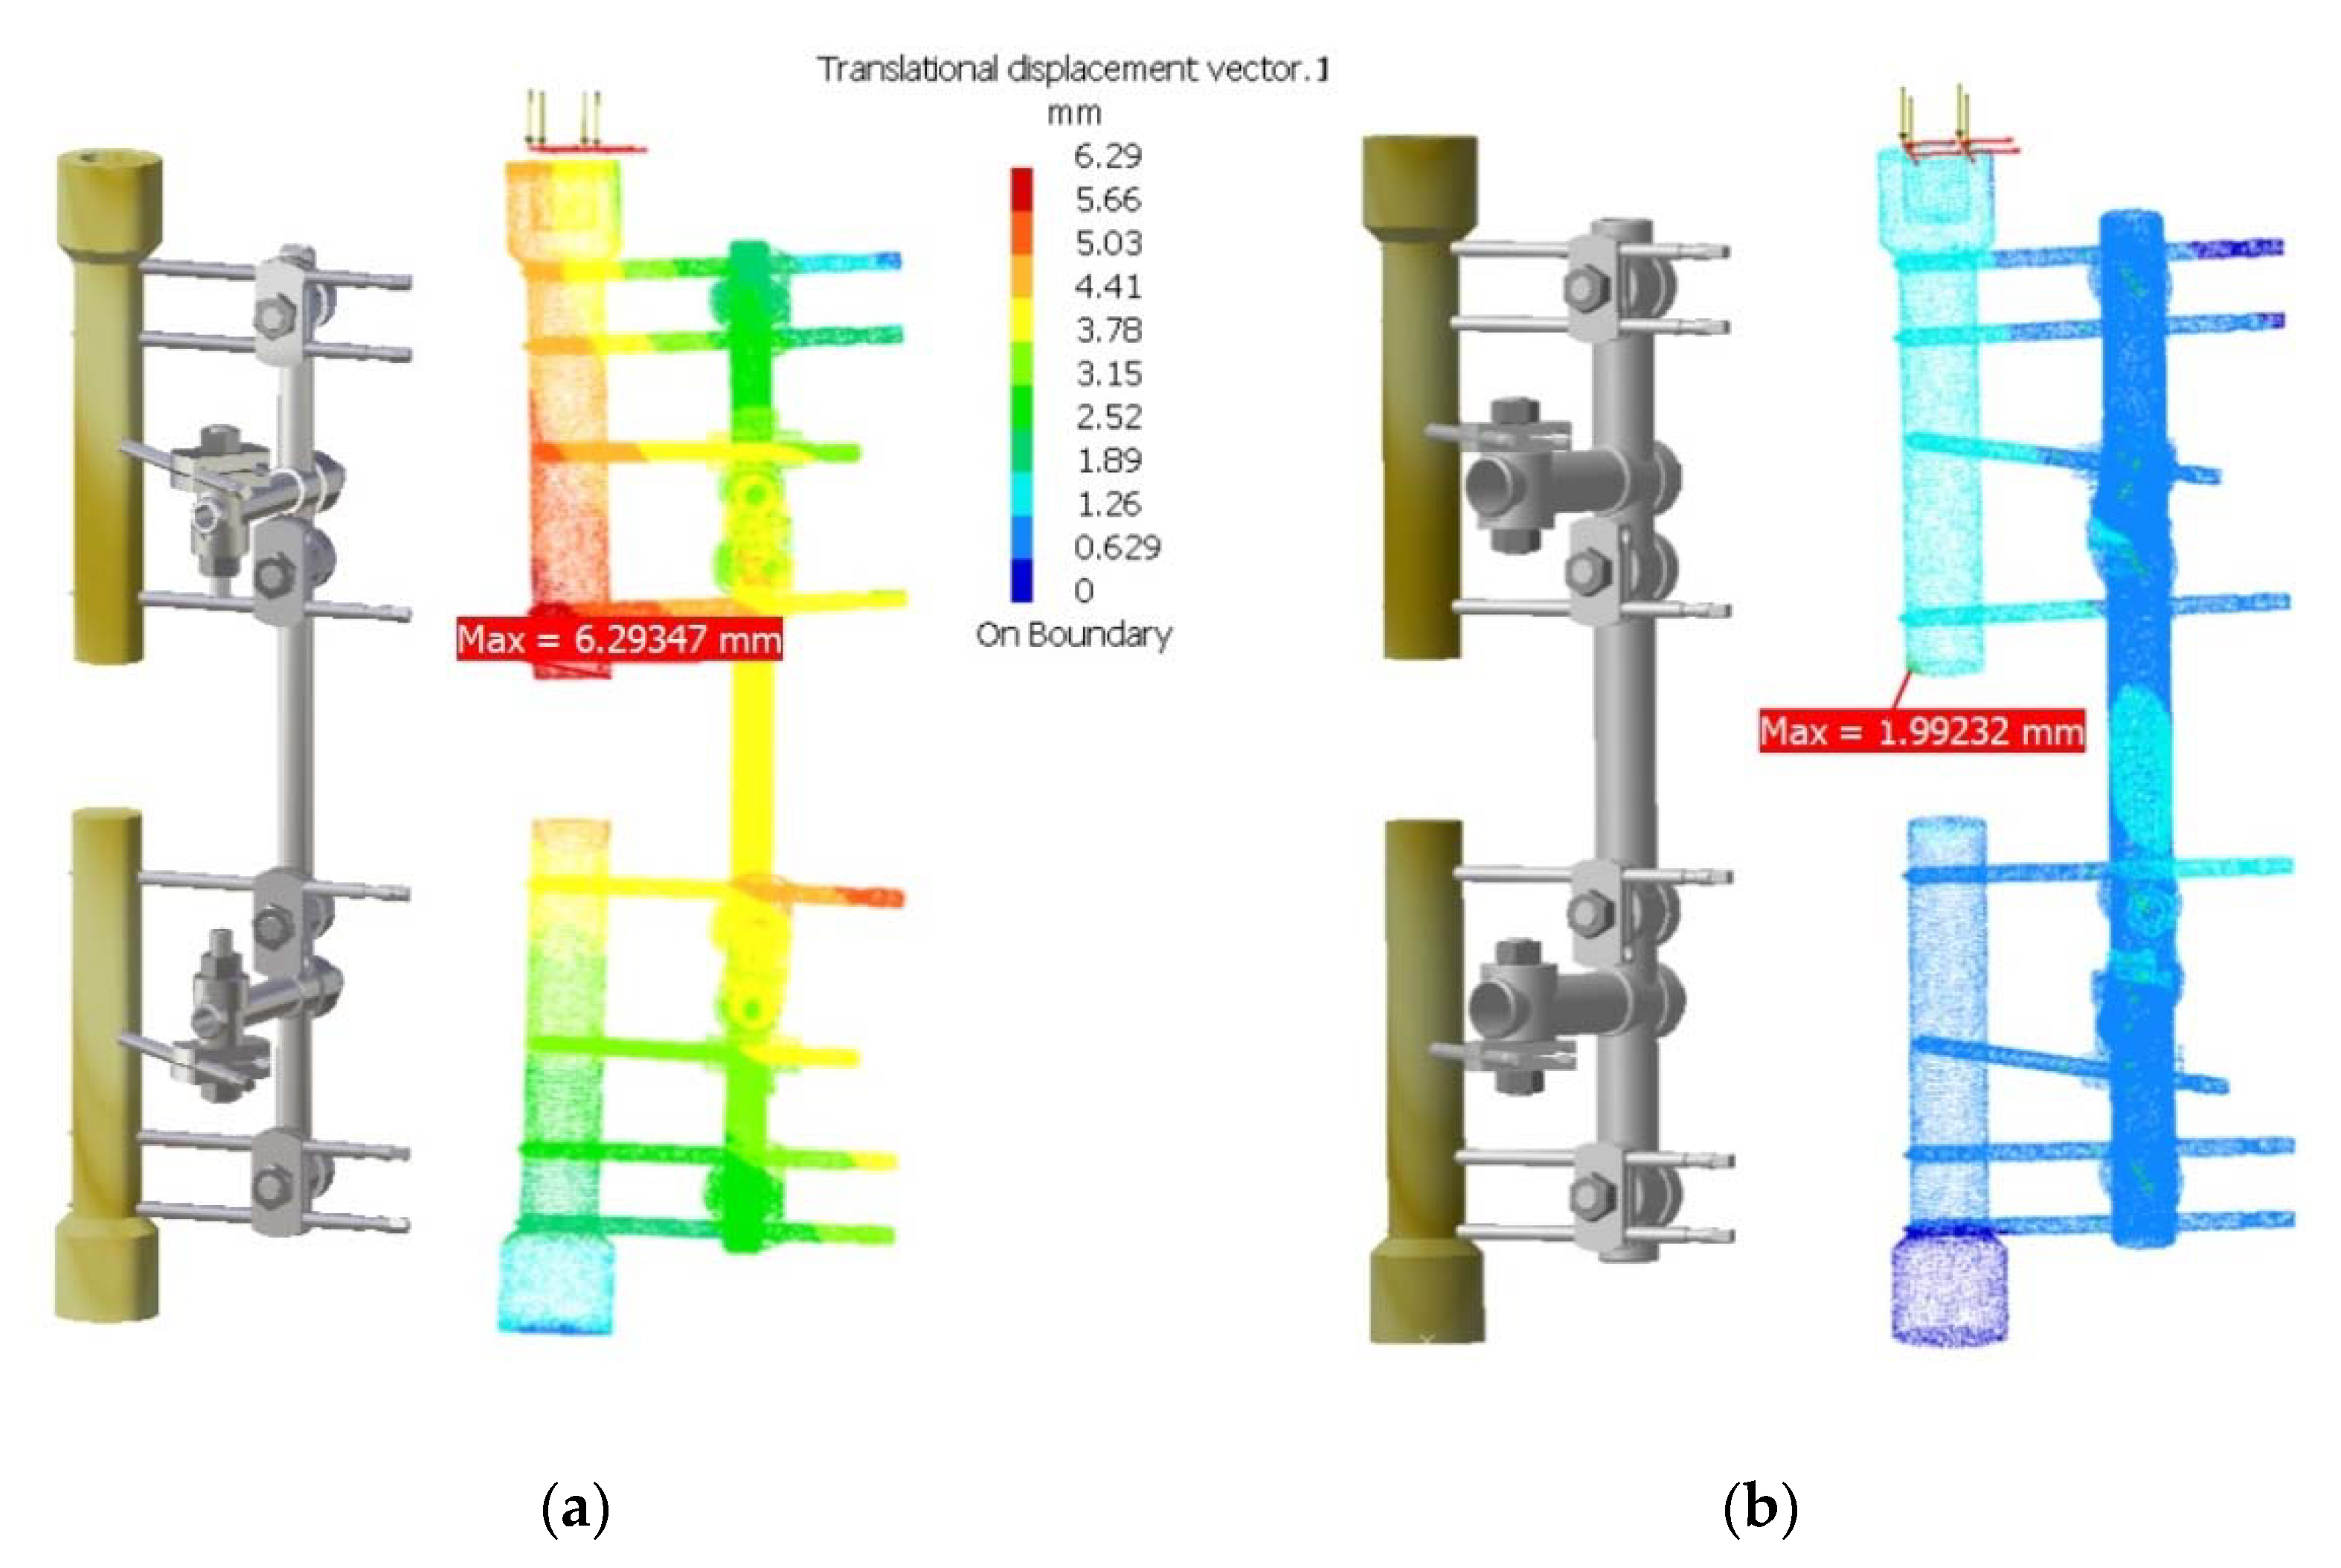
The initial and optimized design of external fixation device shown with displacement field are given in
Figure 18. The maximal displacement of the design is marked. This displacement represents the maximal resulting displacement of proximal bone segment D
p, and at the same time, it is optimization constrain g
1(x).
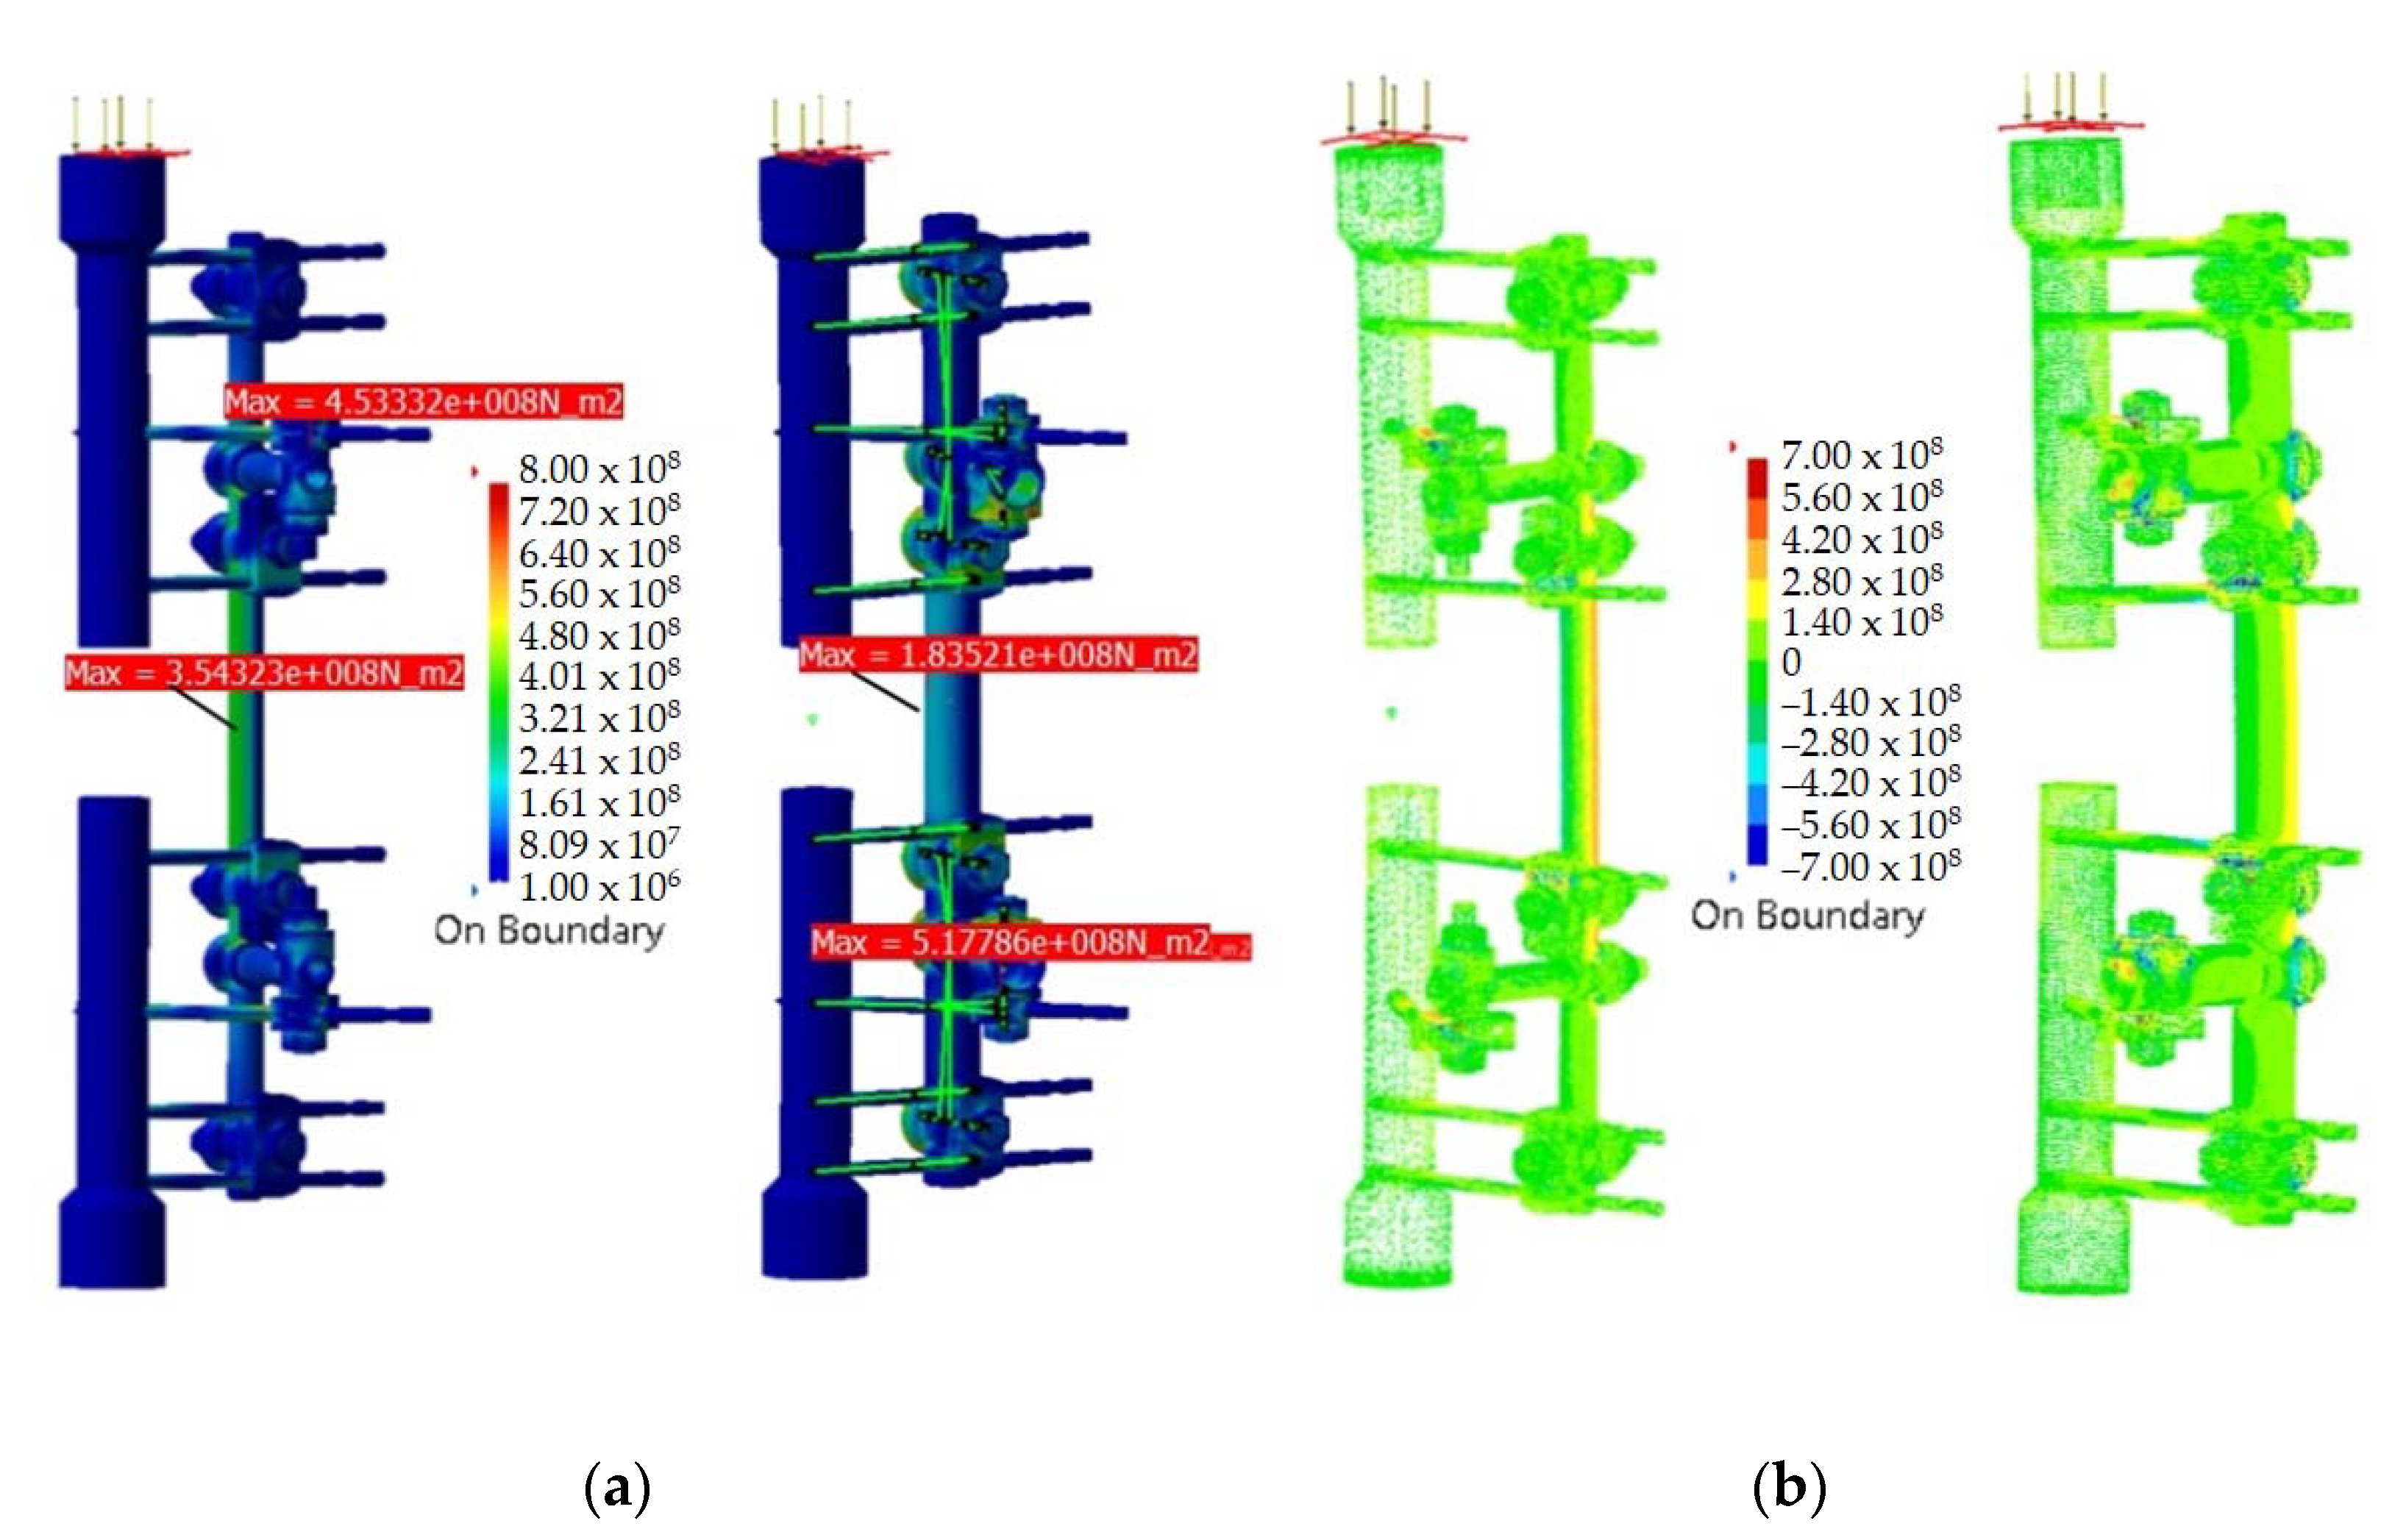
The distribution of von Mises and principal stresses on initial and optimized design of external fixation device is given in
Figure 20. Control places are marked: von Mises stress at control place MP−, (σ
vm−) and von Mises stress at clamping plate (σ
vm,p). These stresses are also optimization constrains at the same time—g
2(x) and g
3(x) (
Table 7).
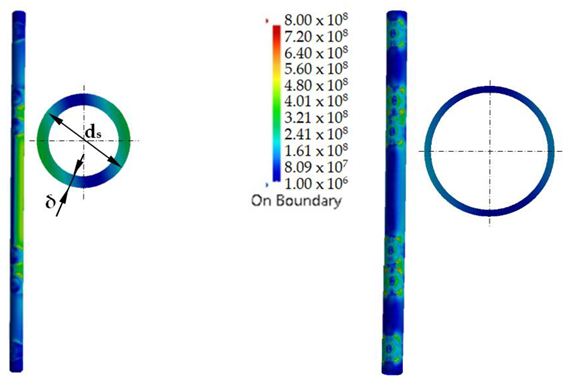
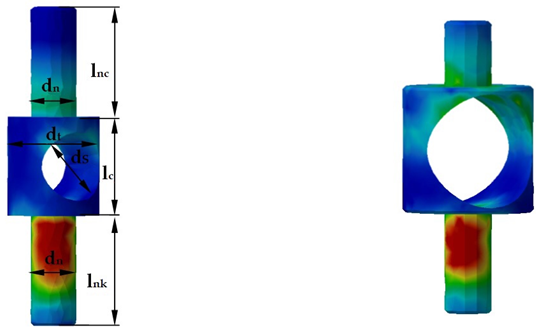
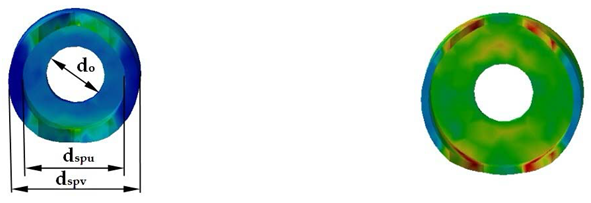
The distribution of von Mises stress on all non-standard parts of initial and optimized design of external fixation device is given in
Table 8. Using the structural optimization of the external fixation device, better distribution of von Mises stress on fixator tree is achieved, with a significant reduction of maximal value from 354.3 MPa to 183.5 MPa at control place MM-, because the diameter of the fixator tree is increased. At the same time, tree wall thickness is reduced (
Table 8).
The optimization process of the coupling plate resulted with the decrease of coupling plate thickness from 3 mm to 1.965 mm, without significant changes in distributions and maximal values of von Mises stress (
Table 7 and
Table 8). Moreover, the same thing happened with the coupling body; thickness on the central part is decreased (
Table 8). The coupling carrier body had significant geometrical changes; the thickness of the long part of the coupling carrier body decreased from 1.5 mm to 0.974 mm; this resulted in von Mises stress increasing up to the value of allowed stress. Because of functional purposes, dimensions of diameters on this part must be adjusted to fixator tree (
Table 1 and
Table 8). For coupling ring, the dimensions are also changed, mostly because it needs to be adjusted to new dimensions of the fixator tree and coupling carrier body. In addition, the thickness of the outer wall of coupling ring is reduced, which resulted in better von Mises stress distribution and the better use of materials (
Table 1 and
Table 8).
9. Conclusions
In this paper, the properties of developed KBE system for the automation of numerical structural size optimization of external fixation device are presented. To develop this kind of system, it is necessary to be familiar with data which have precise correlation between the loads of external fixation device in real applied conditions, and design parameters. It is necessary to choose the proper dimensions, shape, and place for all external fixation device components.
Structural size optimization of external fixation device is carried out, with a goal to reduce interfragmentary displacements at the place of bone fracture, to reduce the mass of the fixator, and to achieve better distribution of von Mises stress at critical places on the design. Interfragmentary displacements and stiffnesses of external fixation device have significant influence on the speed and quality of the healing process.
Using the multidisciplinary approach to the problem of research, optimized design is obtained. Optimized design has better properties from the aspect of clinical applications, with significantly smaller interfragmentary displacements and smaller mass. In addition, the results of structural design optimization show that, with small design changes, a significant improvement in fixator performance can be achieved. Furthermore, it is important to notice that the simplicity and manufacturability of the external fixation device are not disturbed.
A developed KBE system for structural size optimization, based on the FEM model, is verified and implemented on the real design of the external fixation device. The research carried out in this paper can be used to define dependencies between design parameters and loads in real condition. In this way, it is possible to control the stiffness of the fixator, and to control the process of dynamization, with a goal to stimulate and speed up the healing process.
To test the biomechanical properties of the external fixation device in vitro, experimental, CAD, FEM and optimization models are developed. Using this model, it is possible to study the movements of fracture, to control stiffness, and to control stresses at specific places. All these data are used for the optimization of the external fixation device. The clinical importance of these results needs to be interpreted in the light of fracture movements and generated stresses, using in vivo testing.
The integration of methodologies from generative, FEM and optimization modeling, and the automation of structural size optimization of the product, are enabled. Using this methodology and technology, in the form of the KBE system, the time for product development and design process can be significantly reduced.
