
Characteristics of the Vertical and Horizontal Response Spectra of Earthquakes in the Jeju Island Region


Abstract
:1. Introduction
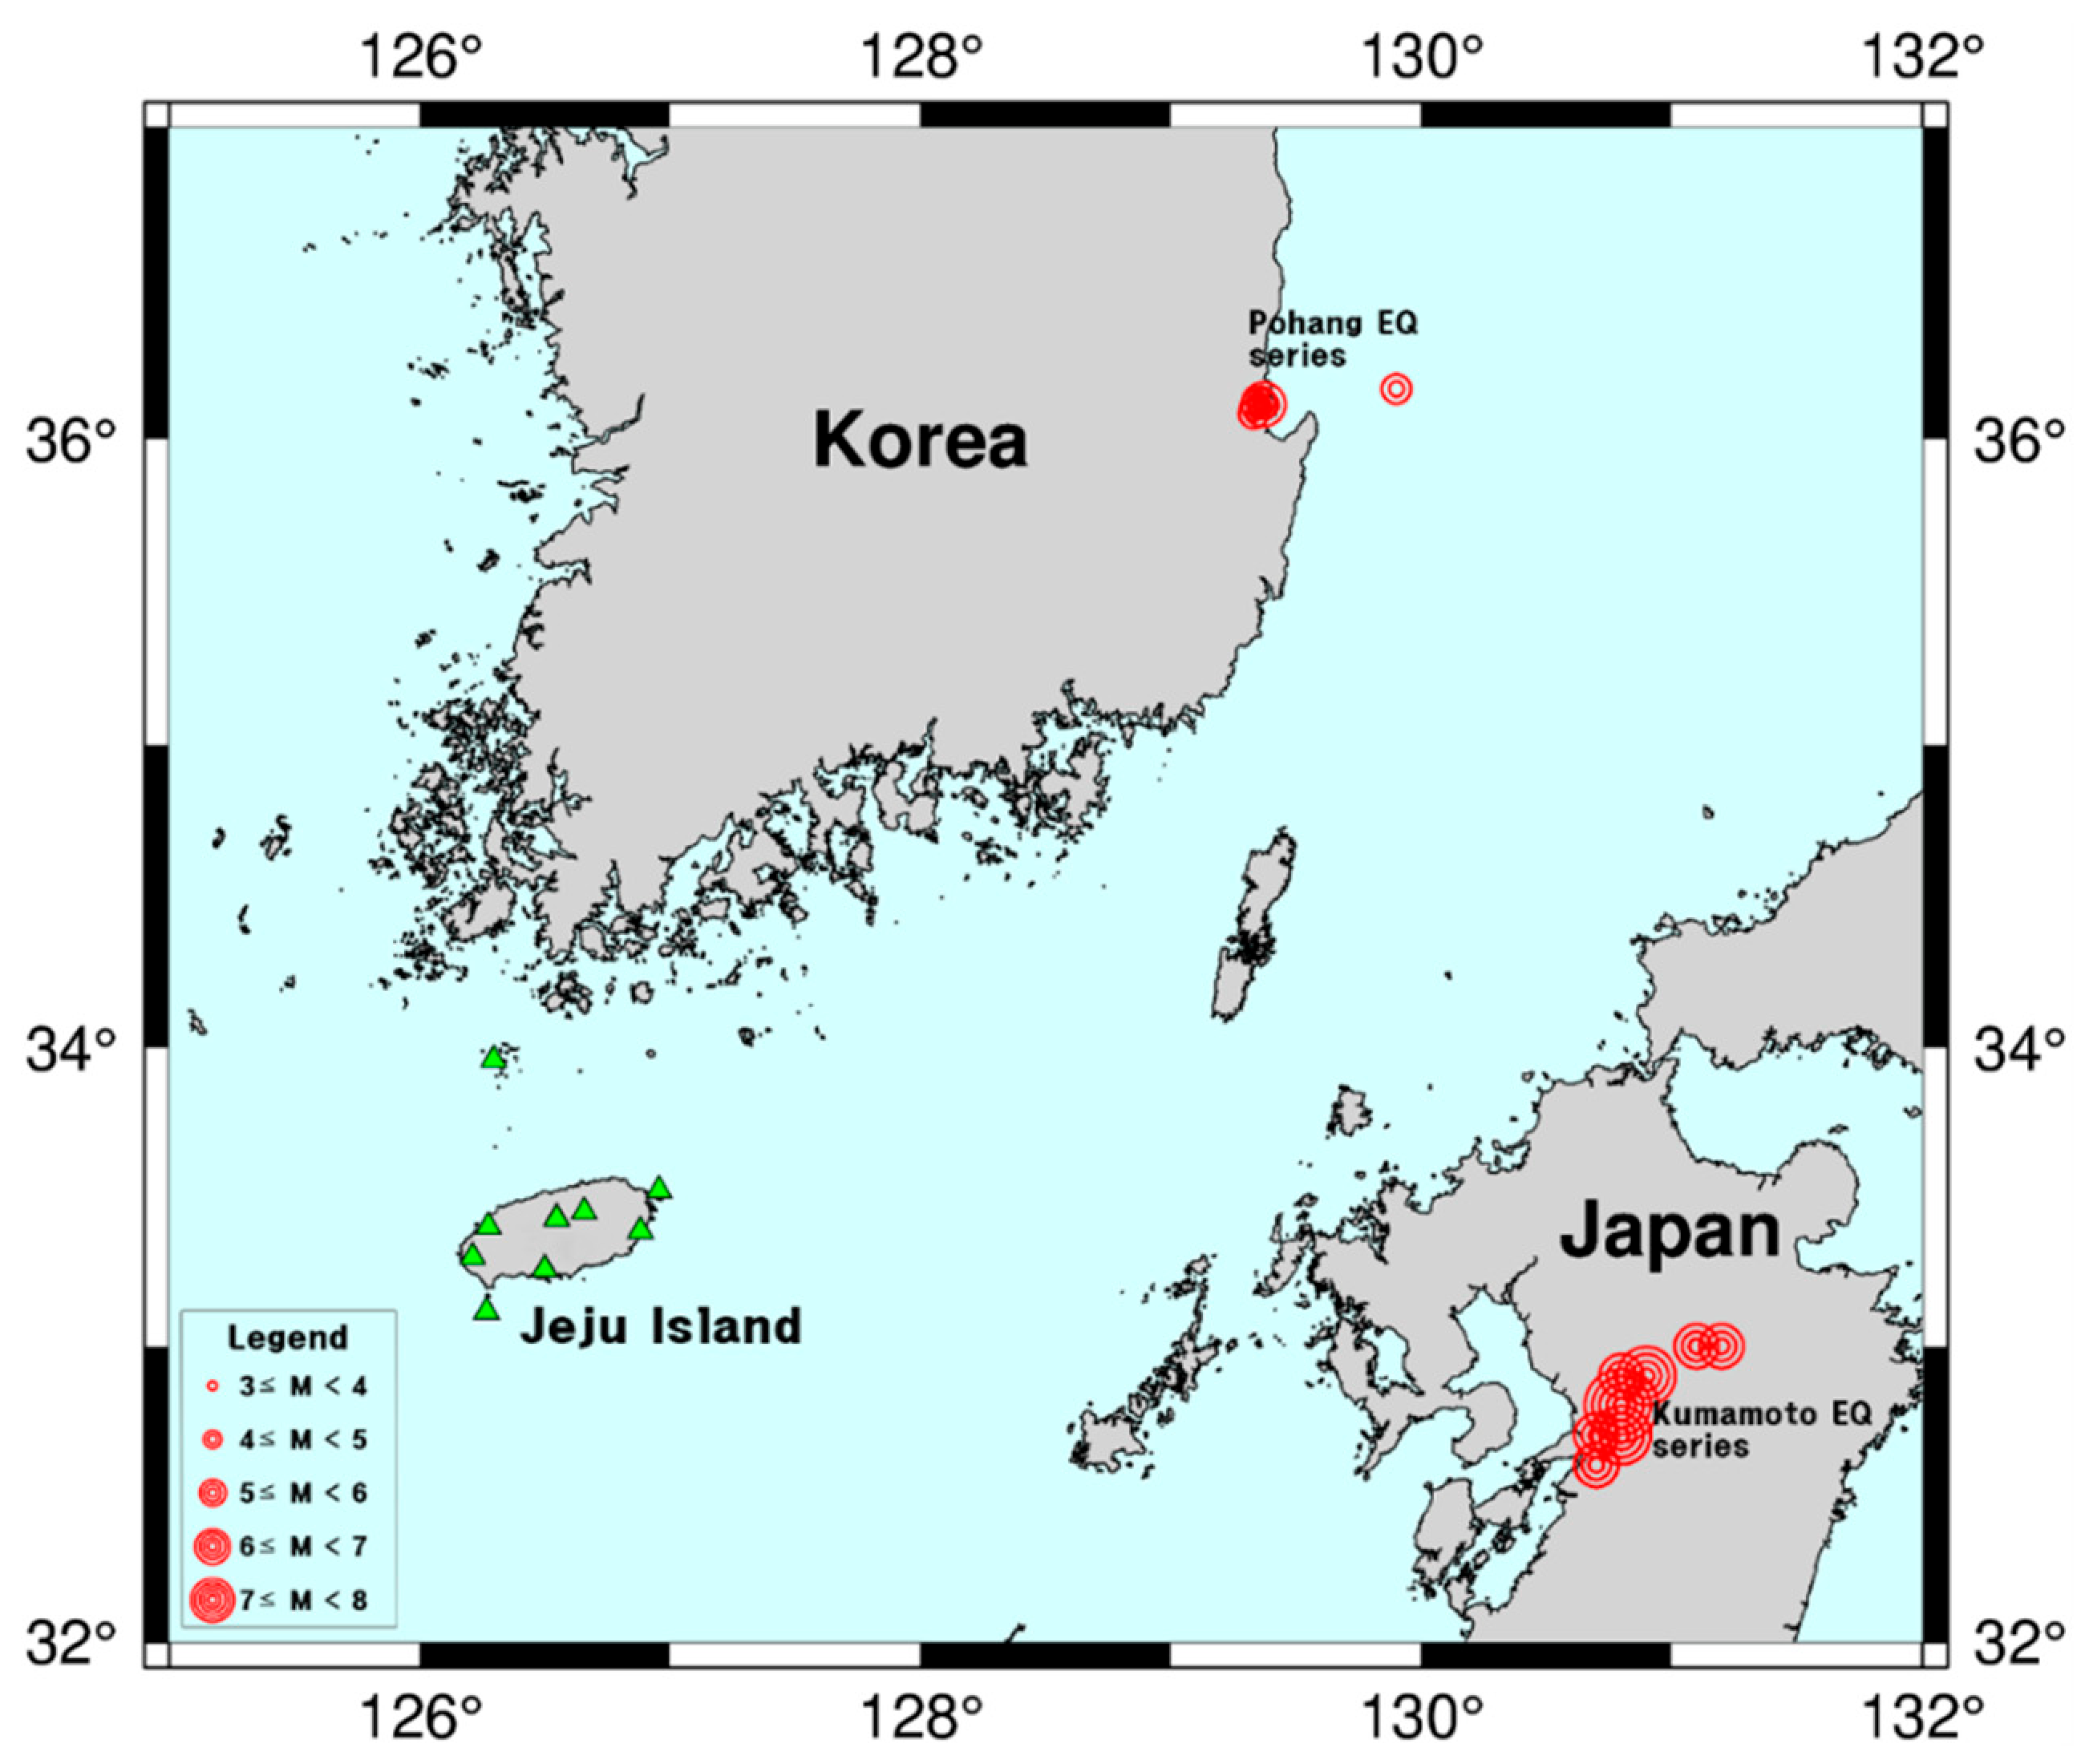
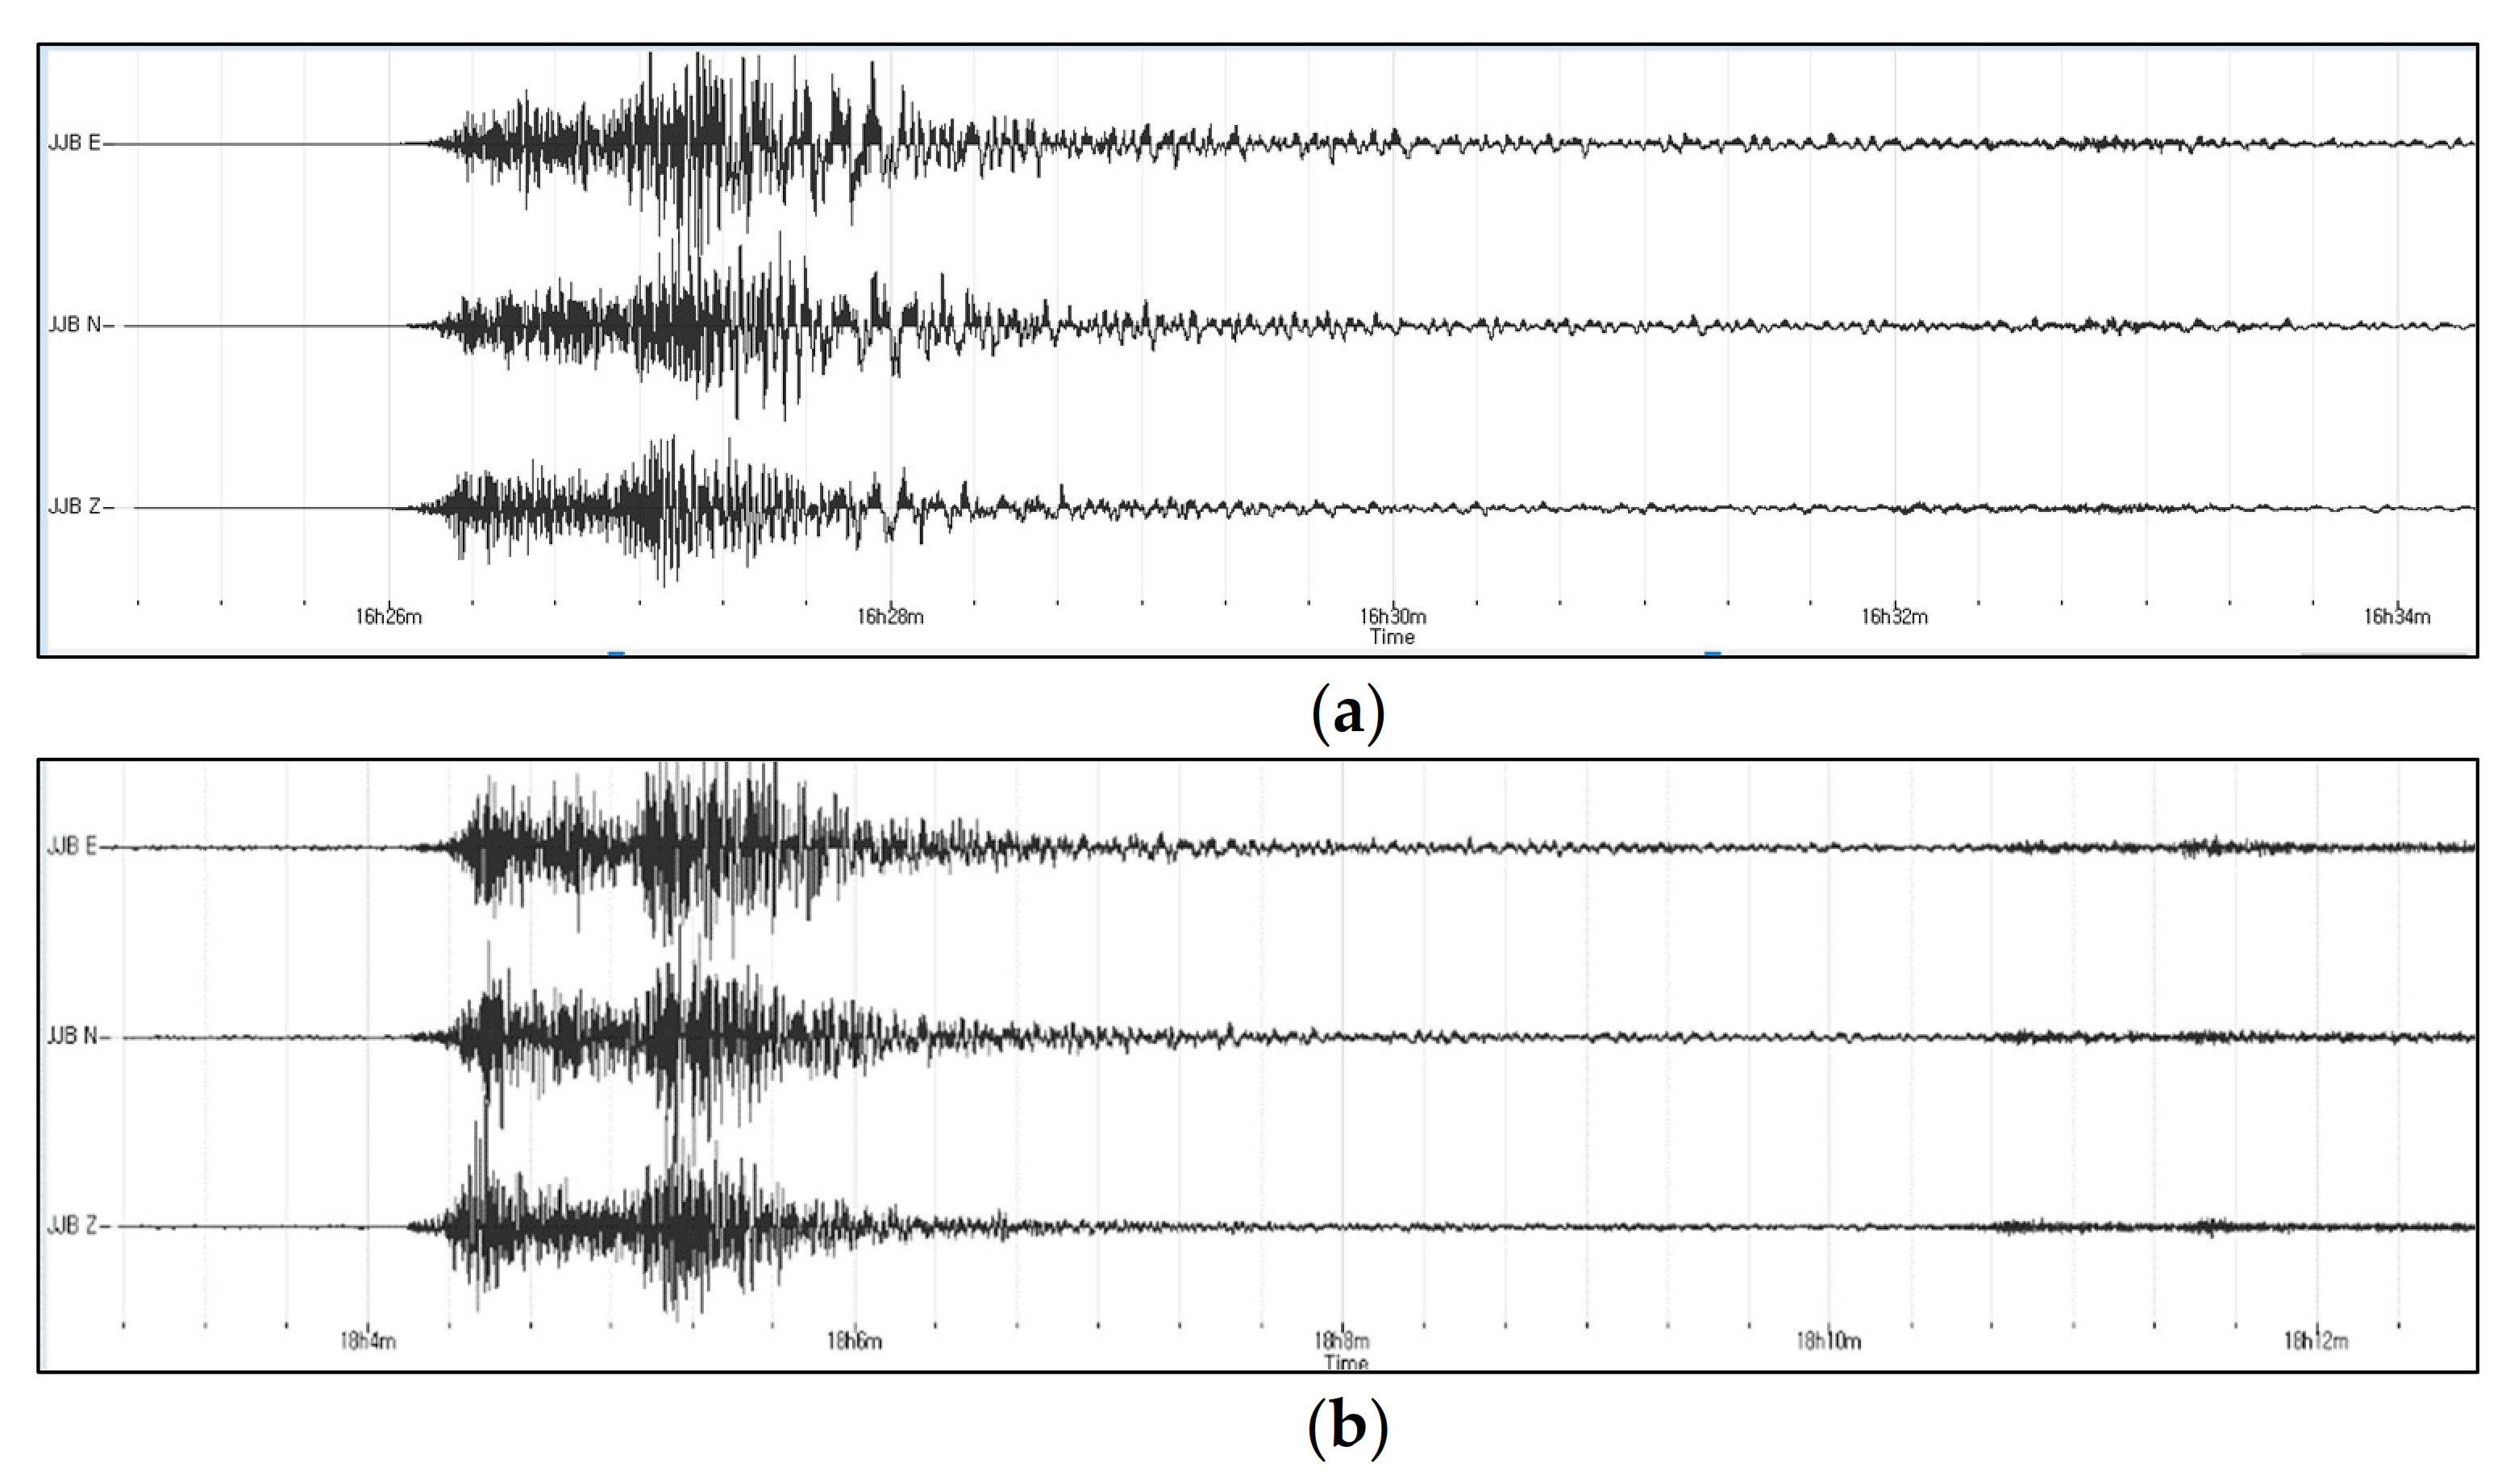
2. Ground Motions

| No. | Station | Lat. | Long. | Sensor | Distances |
|---|---|---|---|---|---|
| 1 | GOS1 | 33.3003 | 126.2100 | ES-T | 431.65 |
| 2 | HALB | 33.4019 | 126.2729 | ES-DH | 427.20 |
| 3 | JJU1 | 33.4306 | 126.5463 | ES-T | 402.53 |
| 4 | JJU2 | 33.4294 | 126.5463 | ES-T | 394.14 |
| 5 | SGP1 | 33.2587 | 126.4994 | ES-T | 404.40 |
| 6 | SGP2 | 33.2587 | 126.4983 | ES-T | 411.63 |
| 7 | SSP | 33.3873 | 126.8801 | ES-T | 371.16 |
| 8 | CJD | 33.9594 | 126.2934 | ES-T | 368.24 |
| 9 | UDO | 33.5228 | 126.954 | ES-T | 362.50 |
| 10 | MRD | 33.1166 | 126.2659 | ES-T | 424.94 |
| 11 | JJB | 33.4515 | 126.6559 | ES-DH | 392.85 |

3. Frequency Bands and Normalisation of the Response Spectra
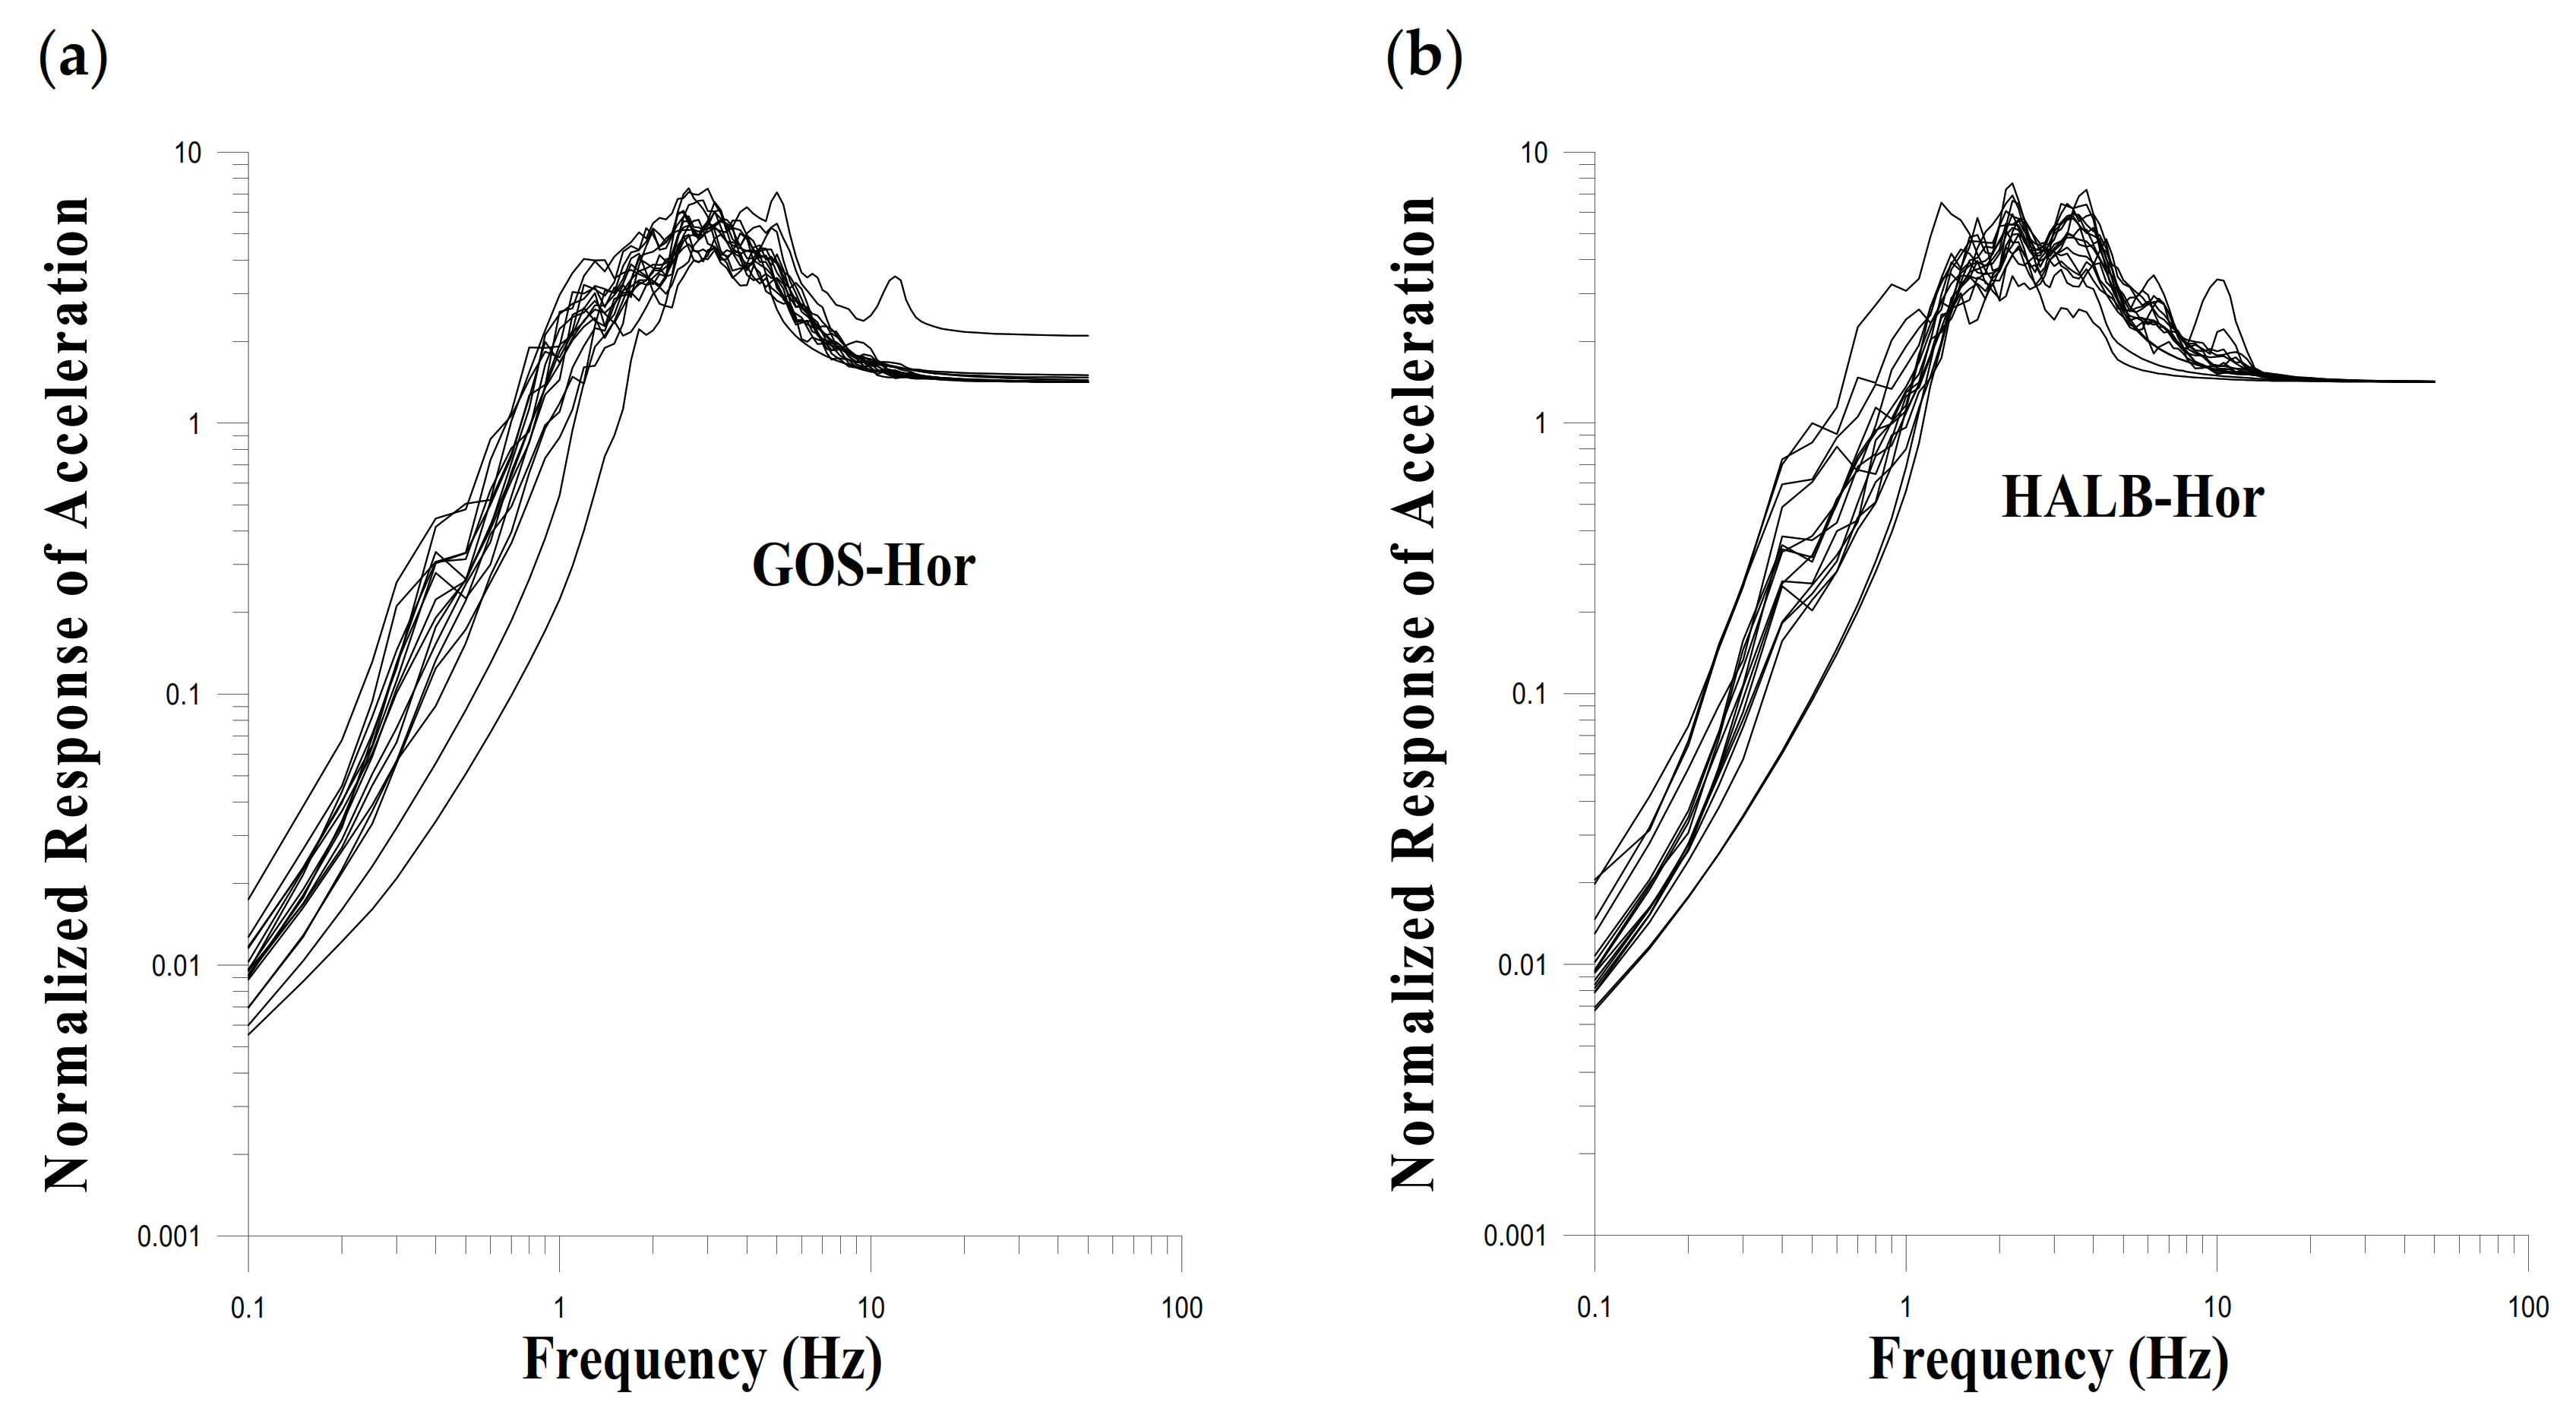
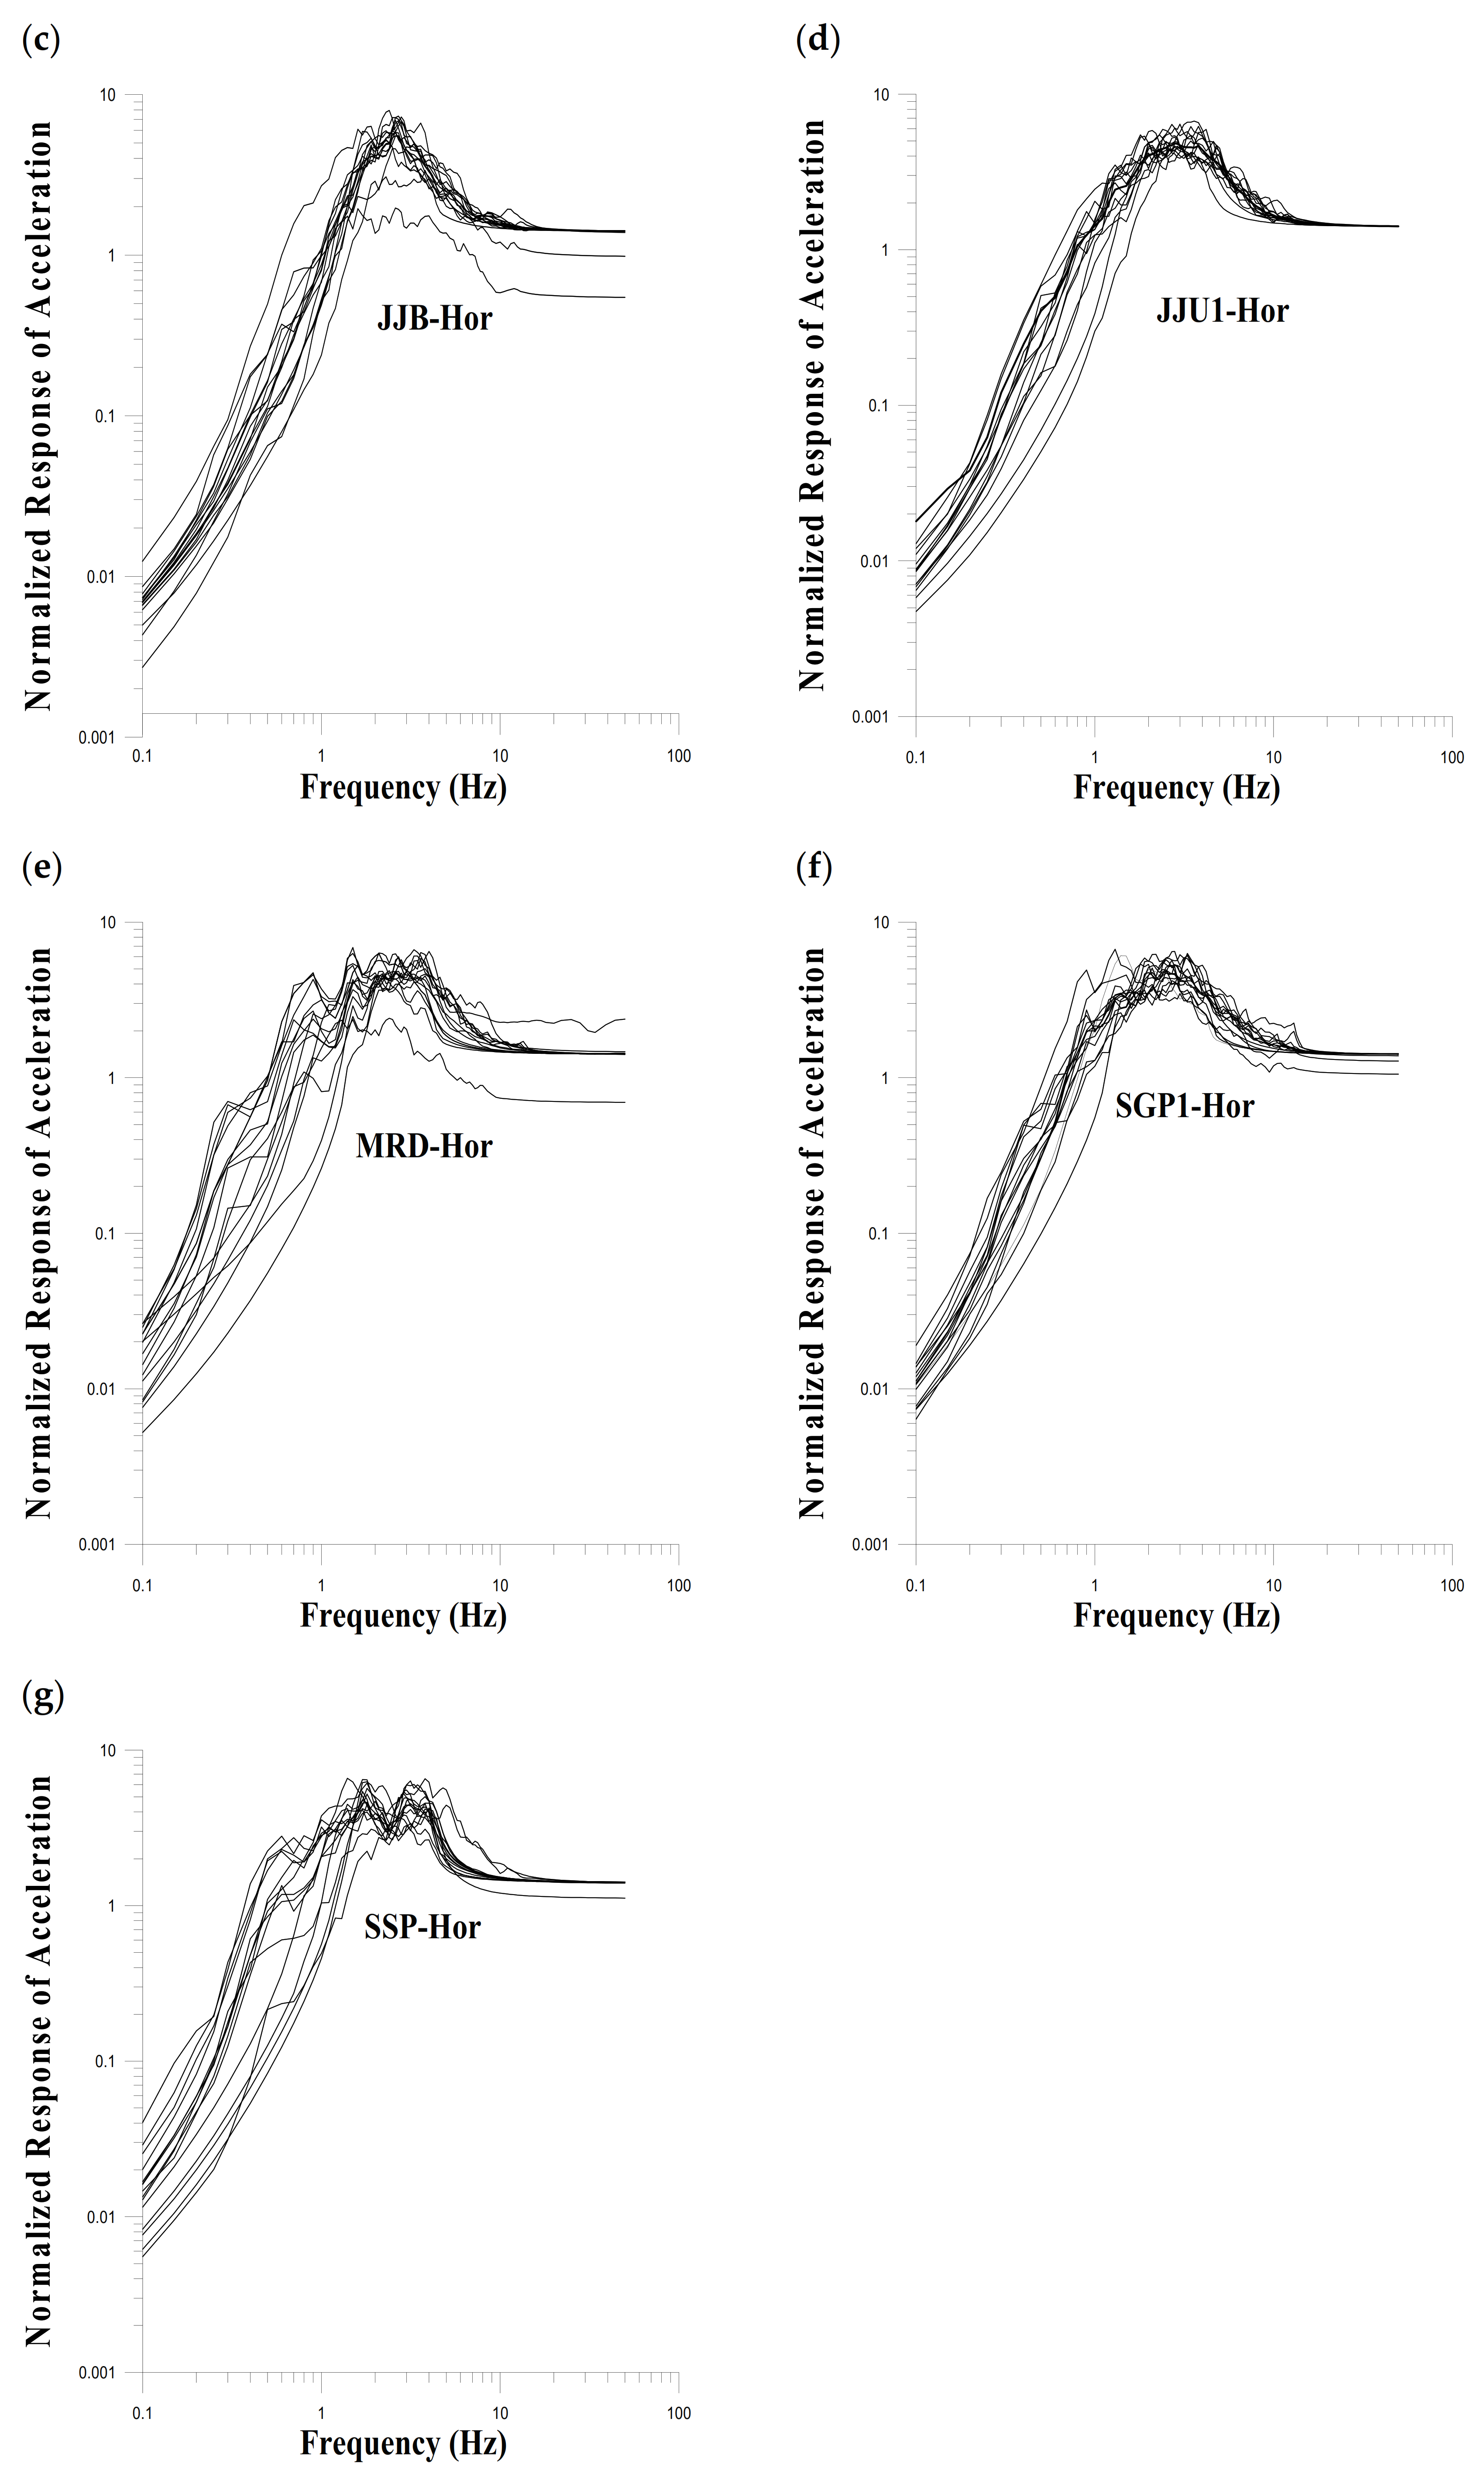
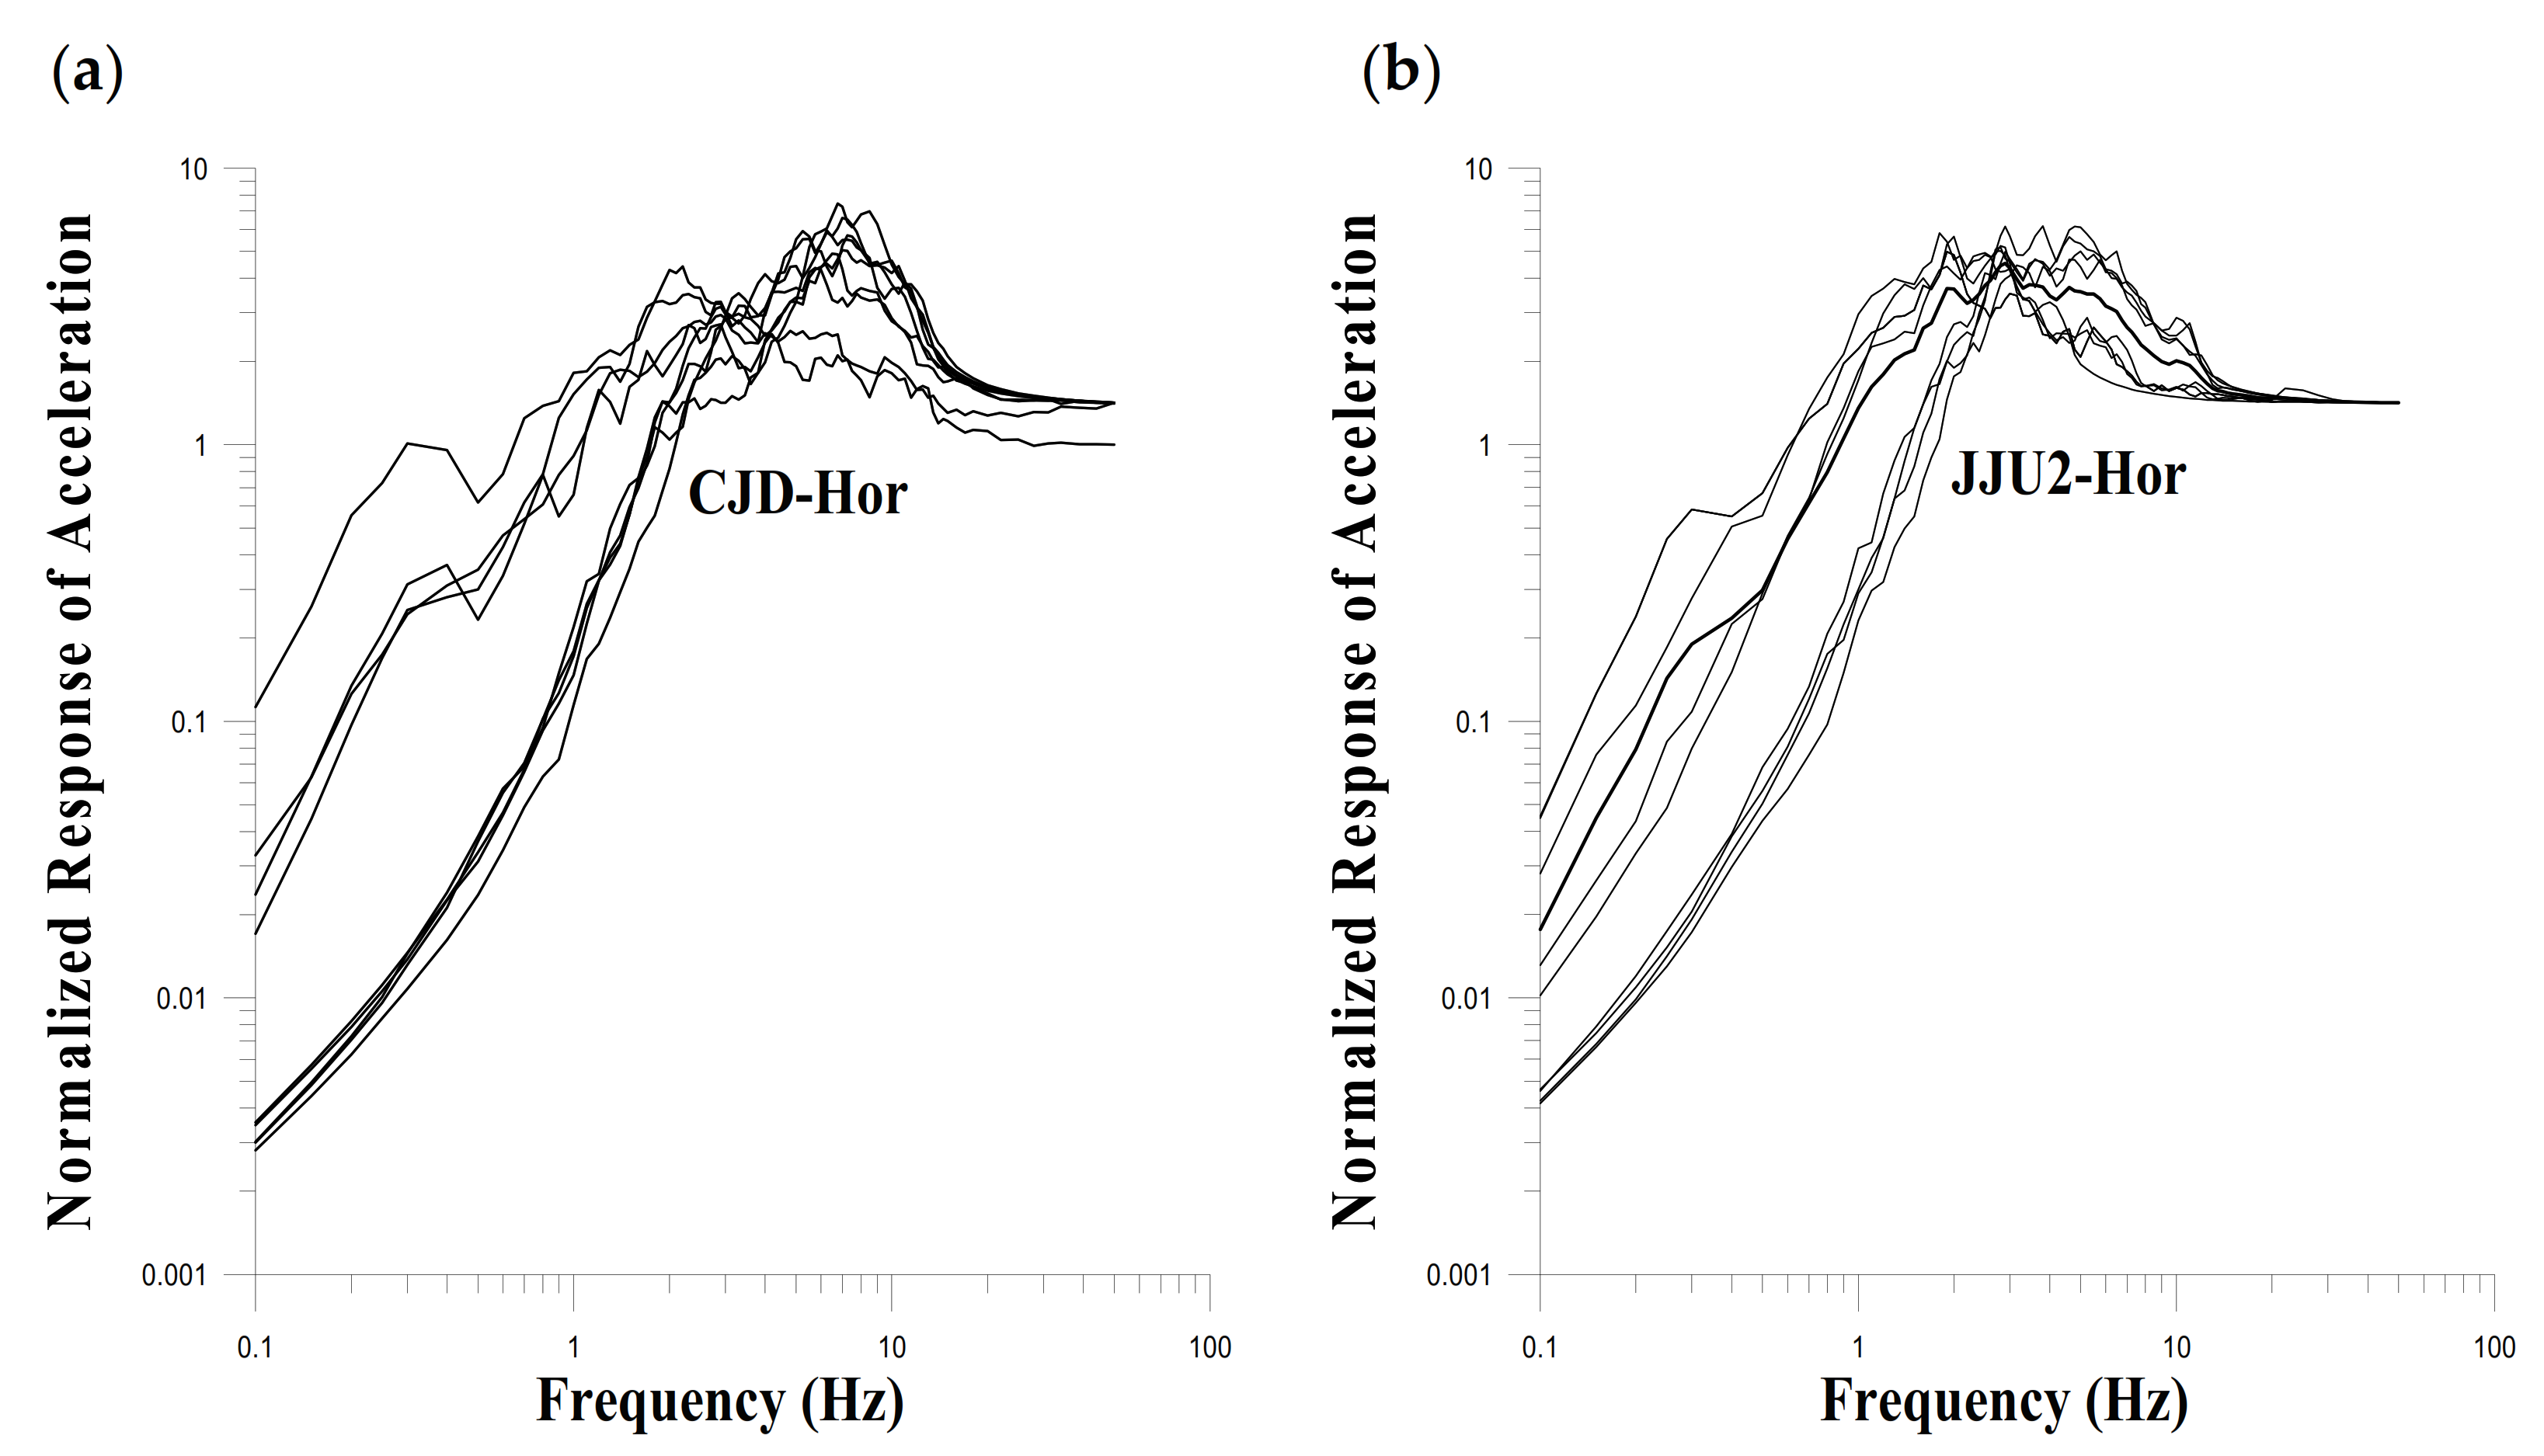
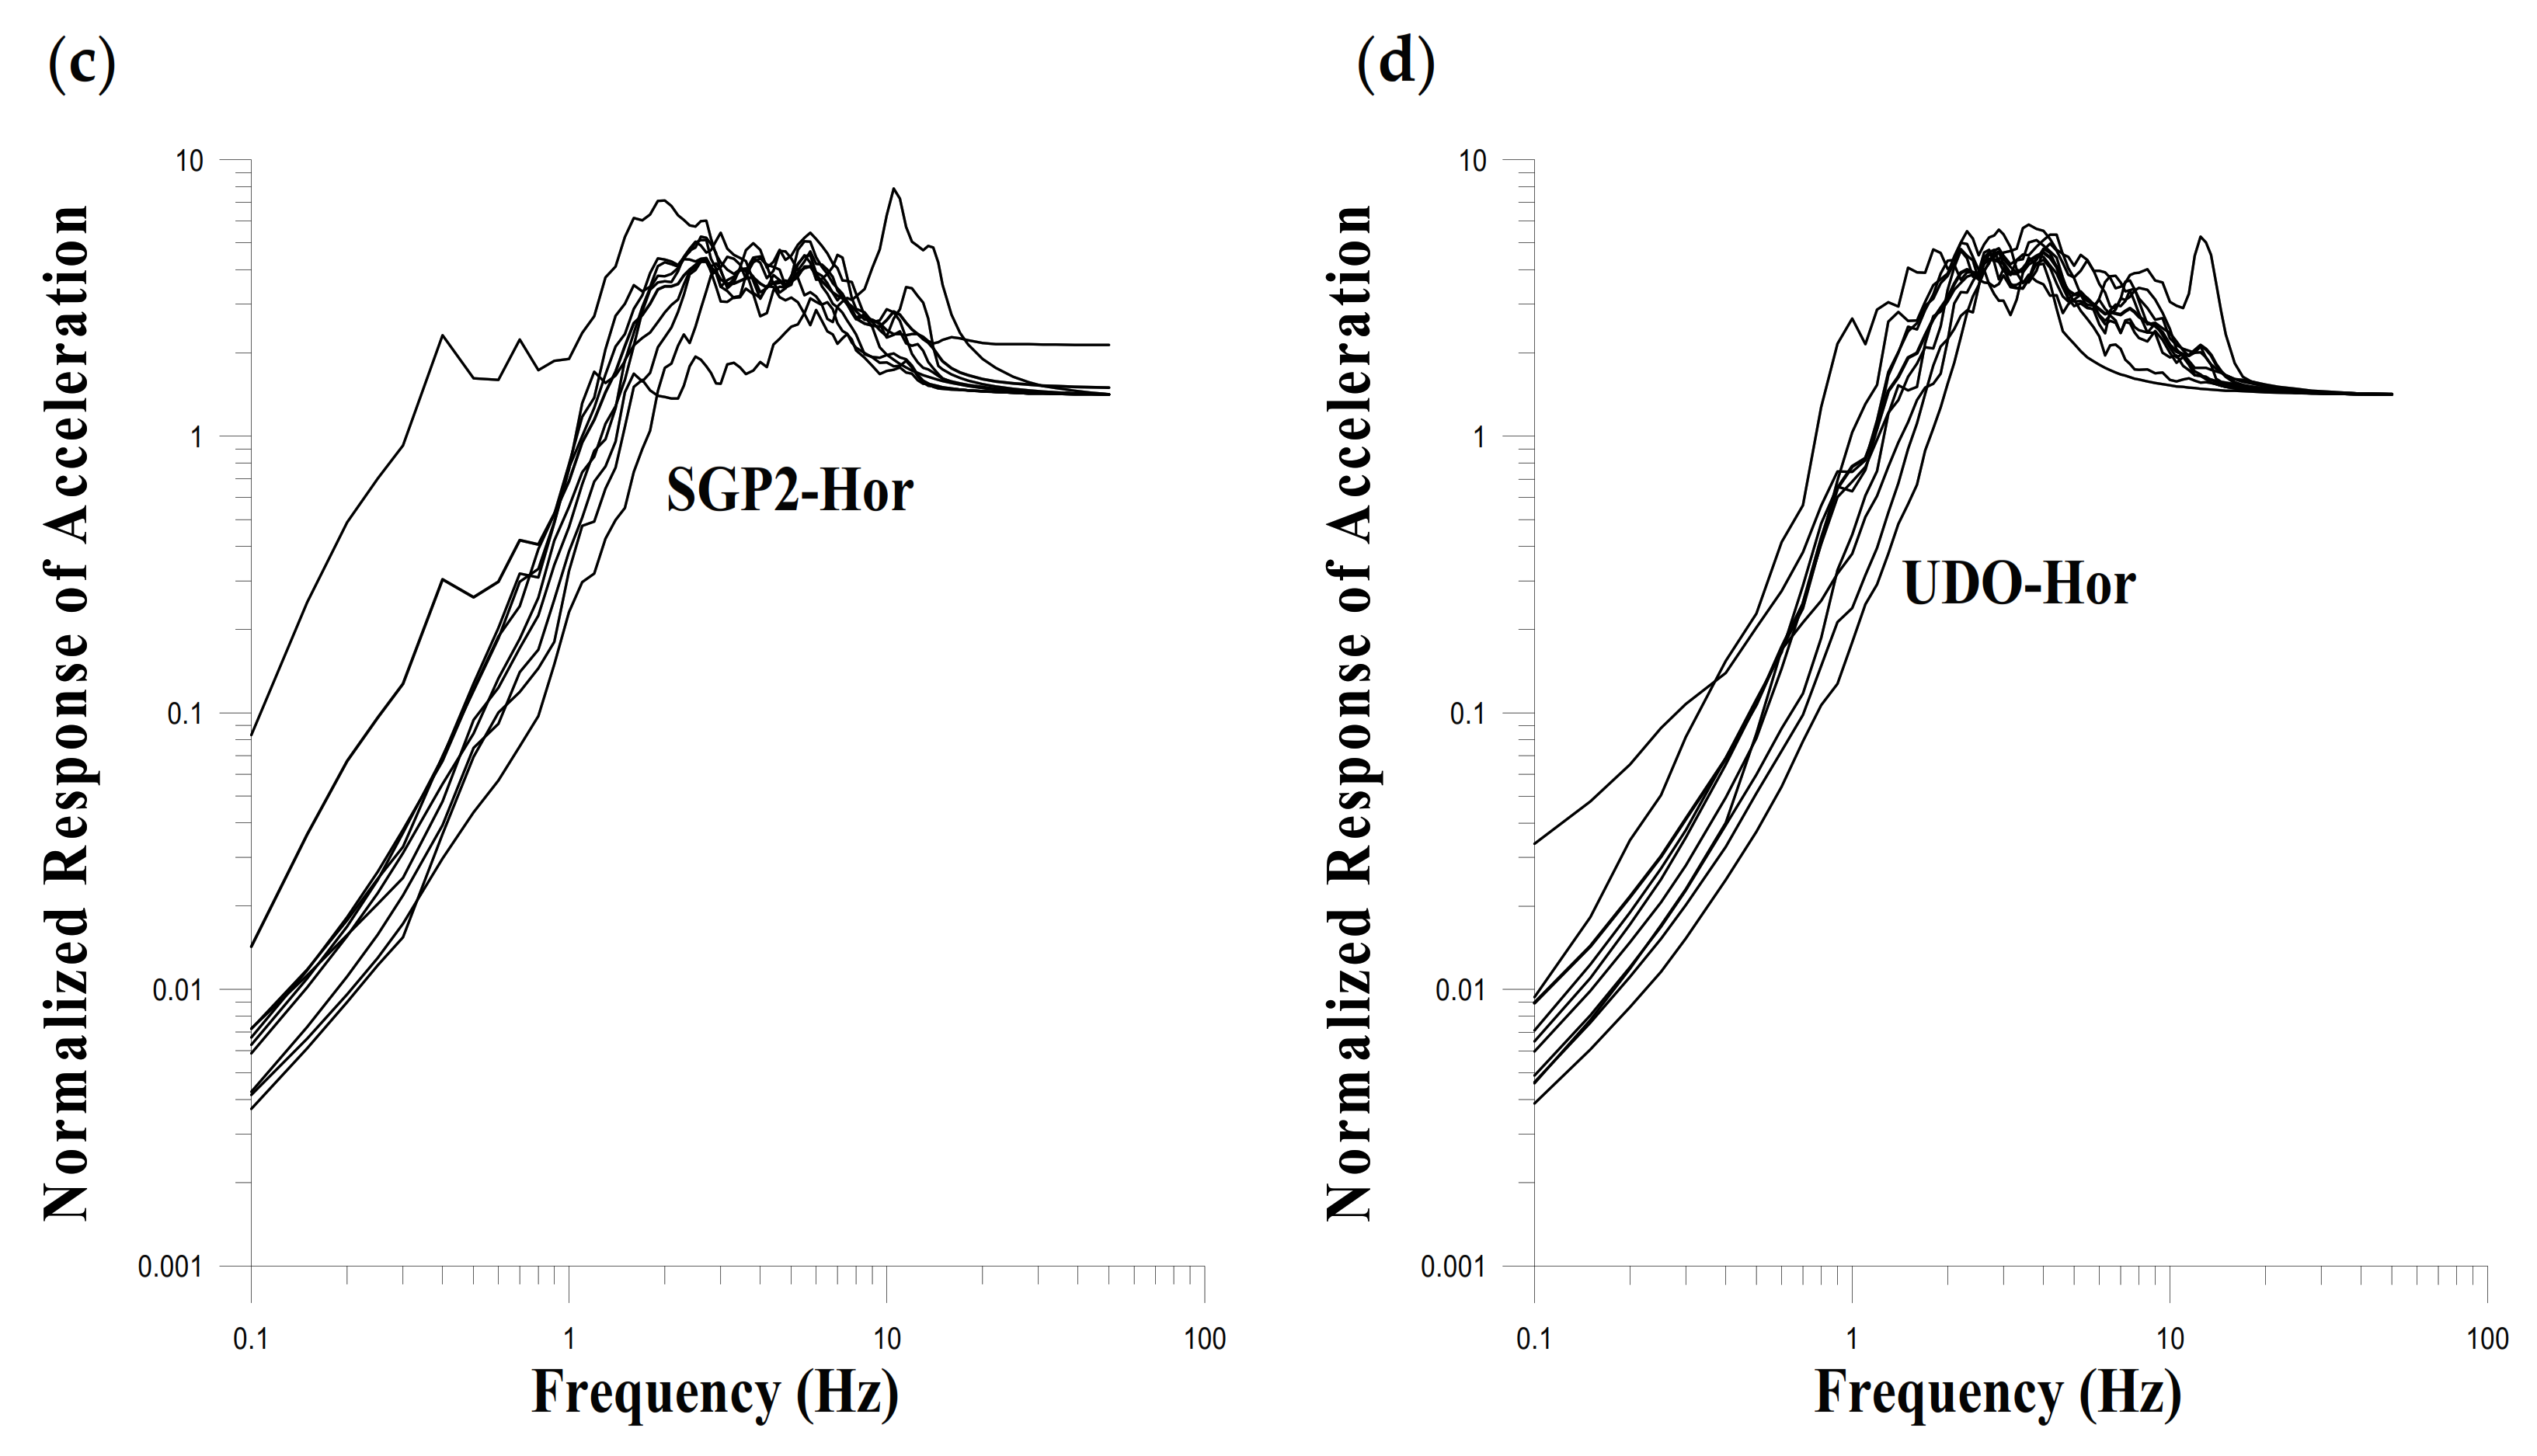
4. Characteristics of the Horizontal Response Spectra in Jeju Island
5. Results and Discussion
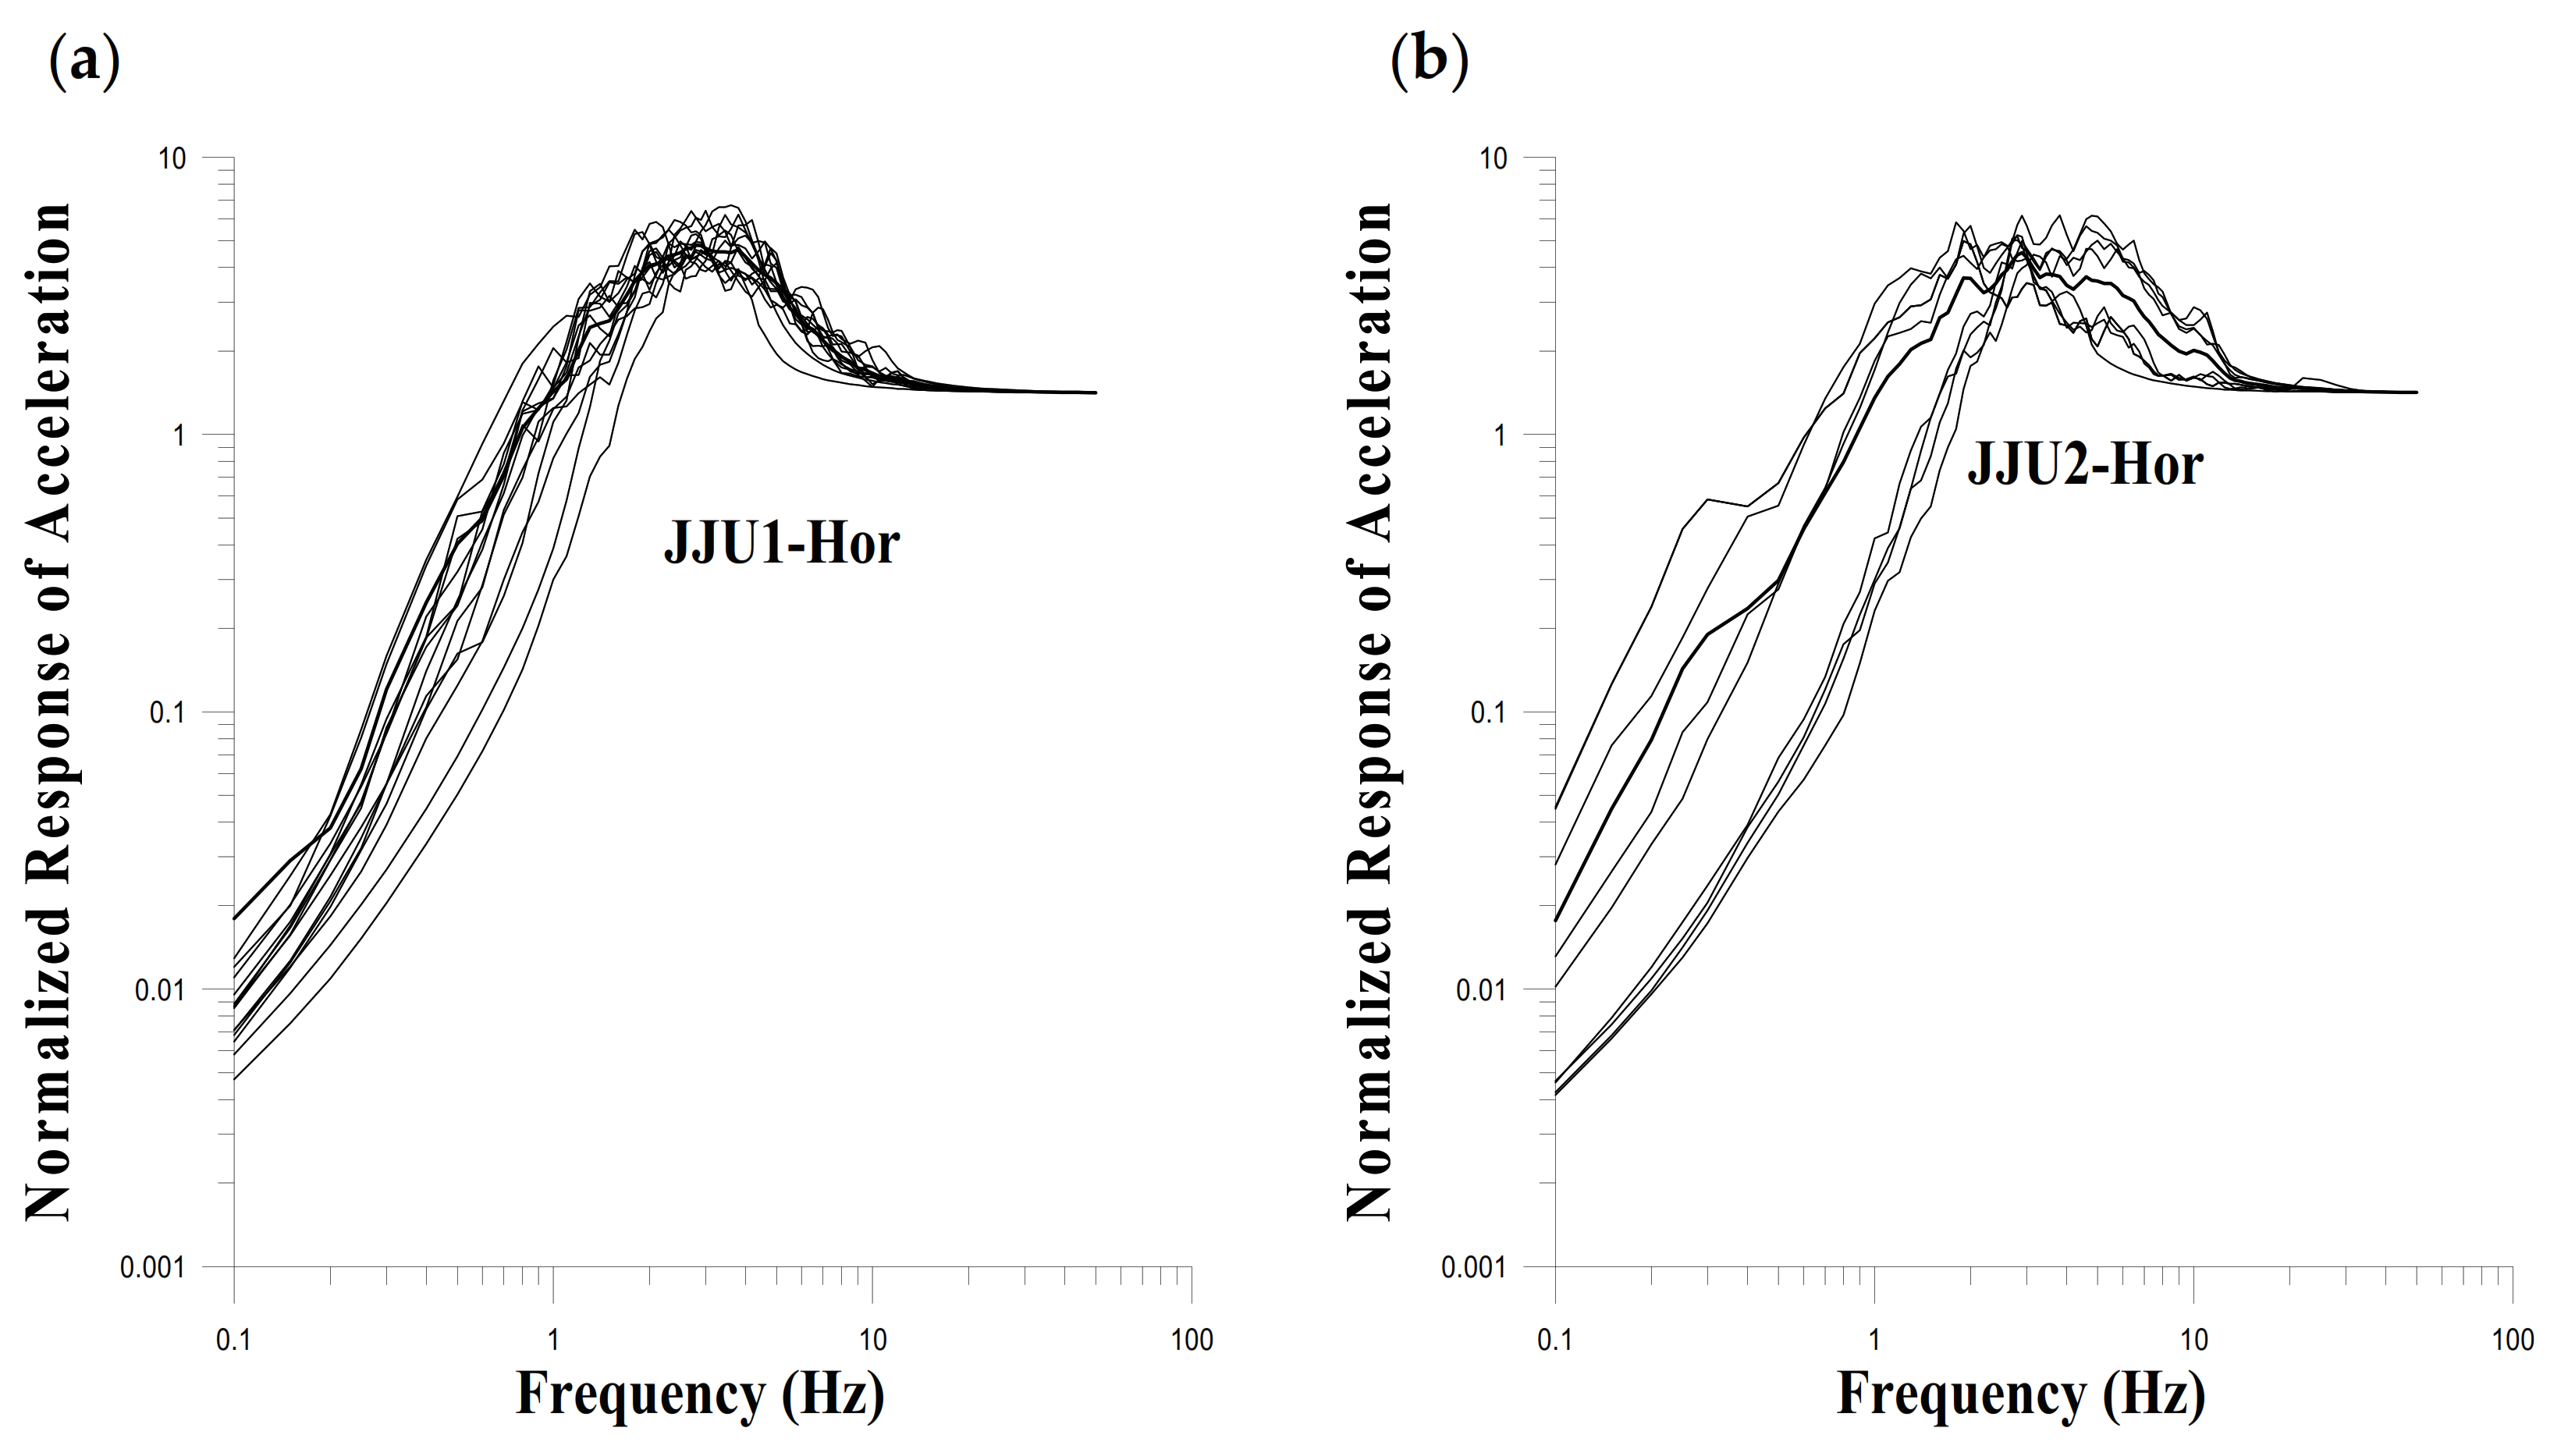
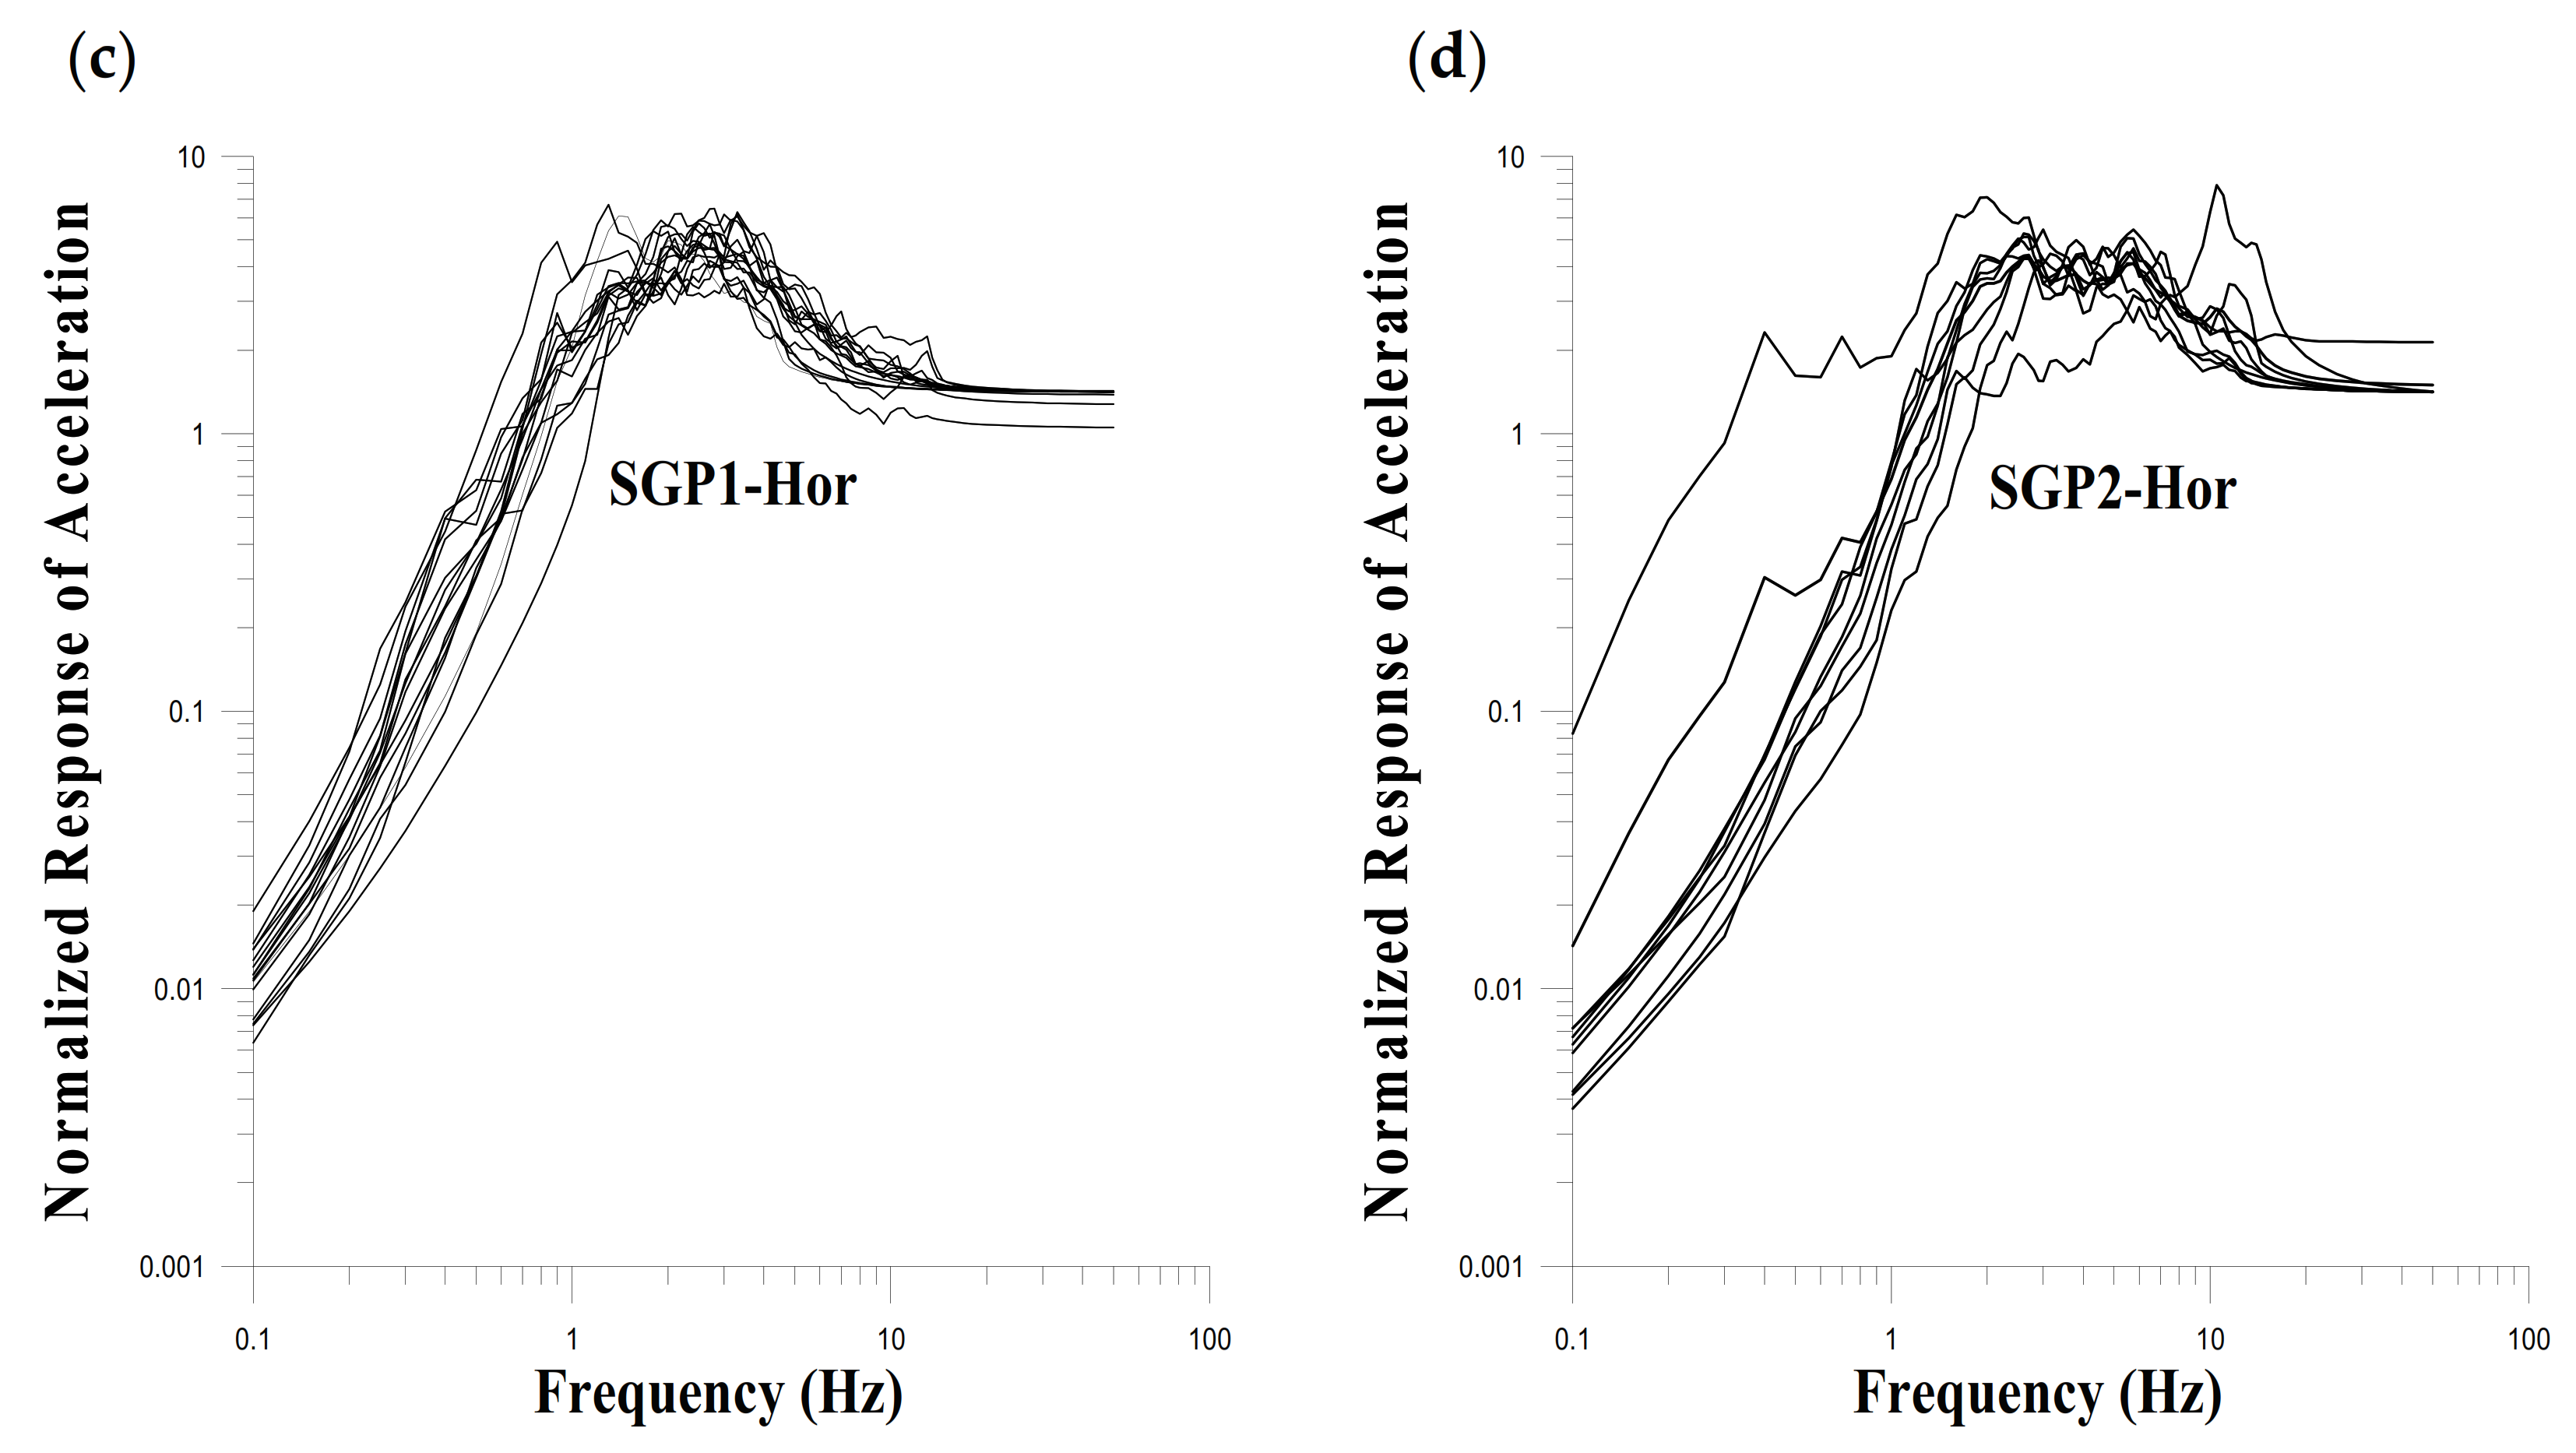
5.1. Comparison of the Response Spectra between Two Pairs of Stations: JJU1 and JJU2, and SGP1 and SGP2
5.2. Influence of Earthquake Magnitude on the Horizontal and Vertical Response Spectra
5.3. Horizontal and Vertical Response Spectra of the Jeju Region
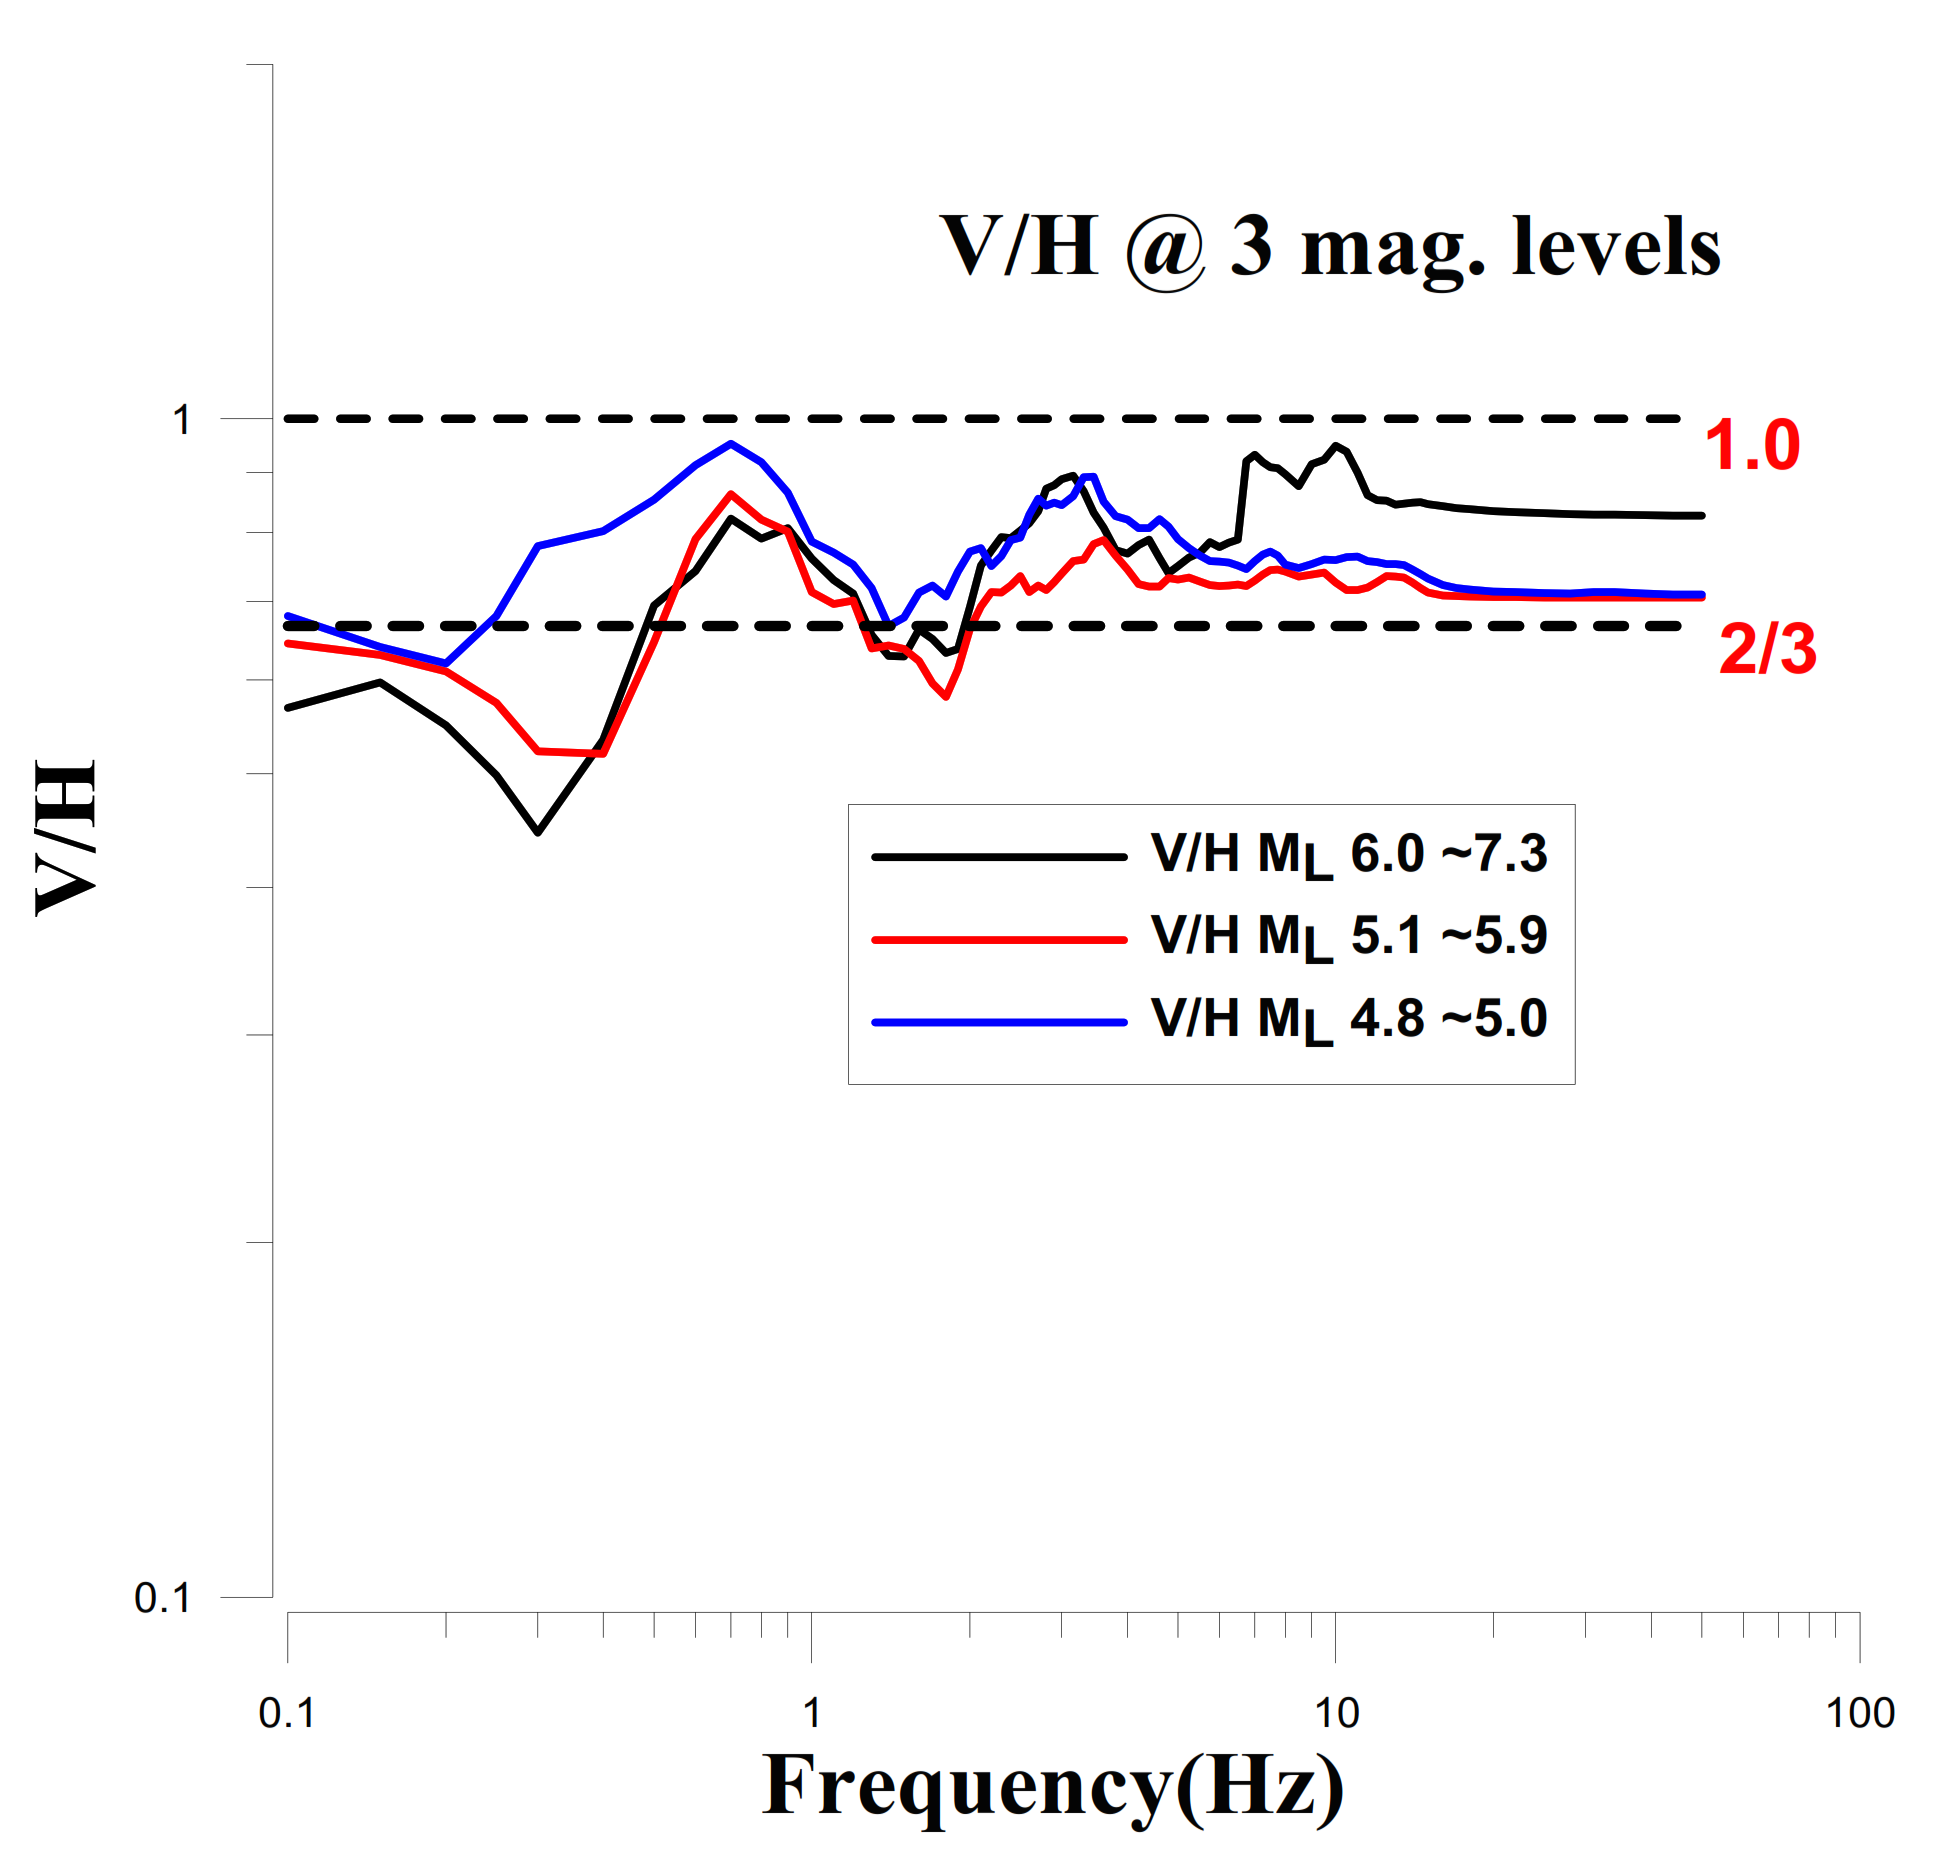
5.4. Ratio of the Vertical Response Spectra to the Horizontal Response Spectra (V/H)
| Standards | V/H Ratio | |
|---|---|---|
| High Frequency (Short Period) | Low Frequency (Long Period) | |
| Eurocode 8 (Type 1) | 0.9 | 0.9 |
| Eurocode 8 (Type 2) | 0.45 | 0.45 |
| USNRC | 1 | 2/3 |
| ASCE 4–16 | 2/3 | 2/3 |
| NEHRP | 0.7 | 1/2 |

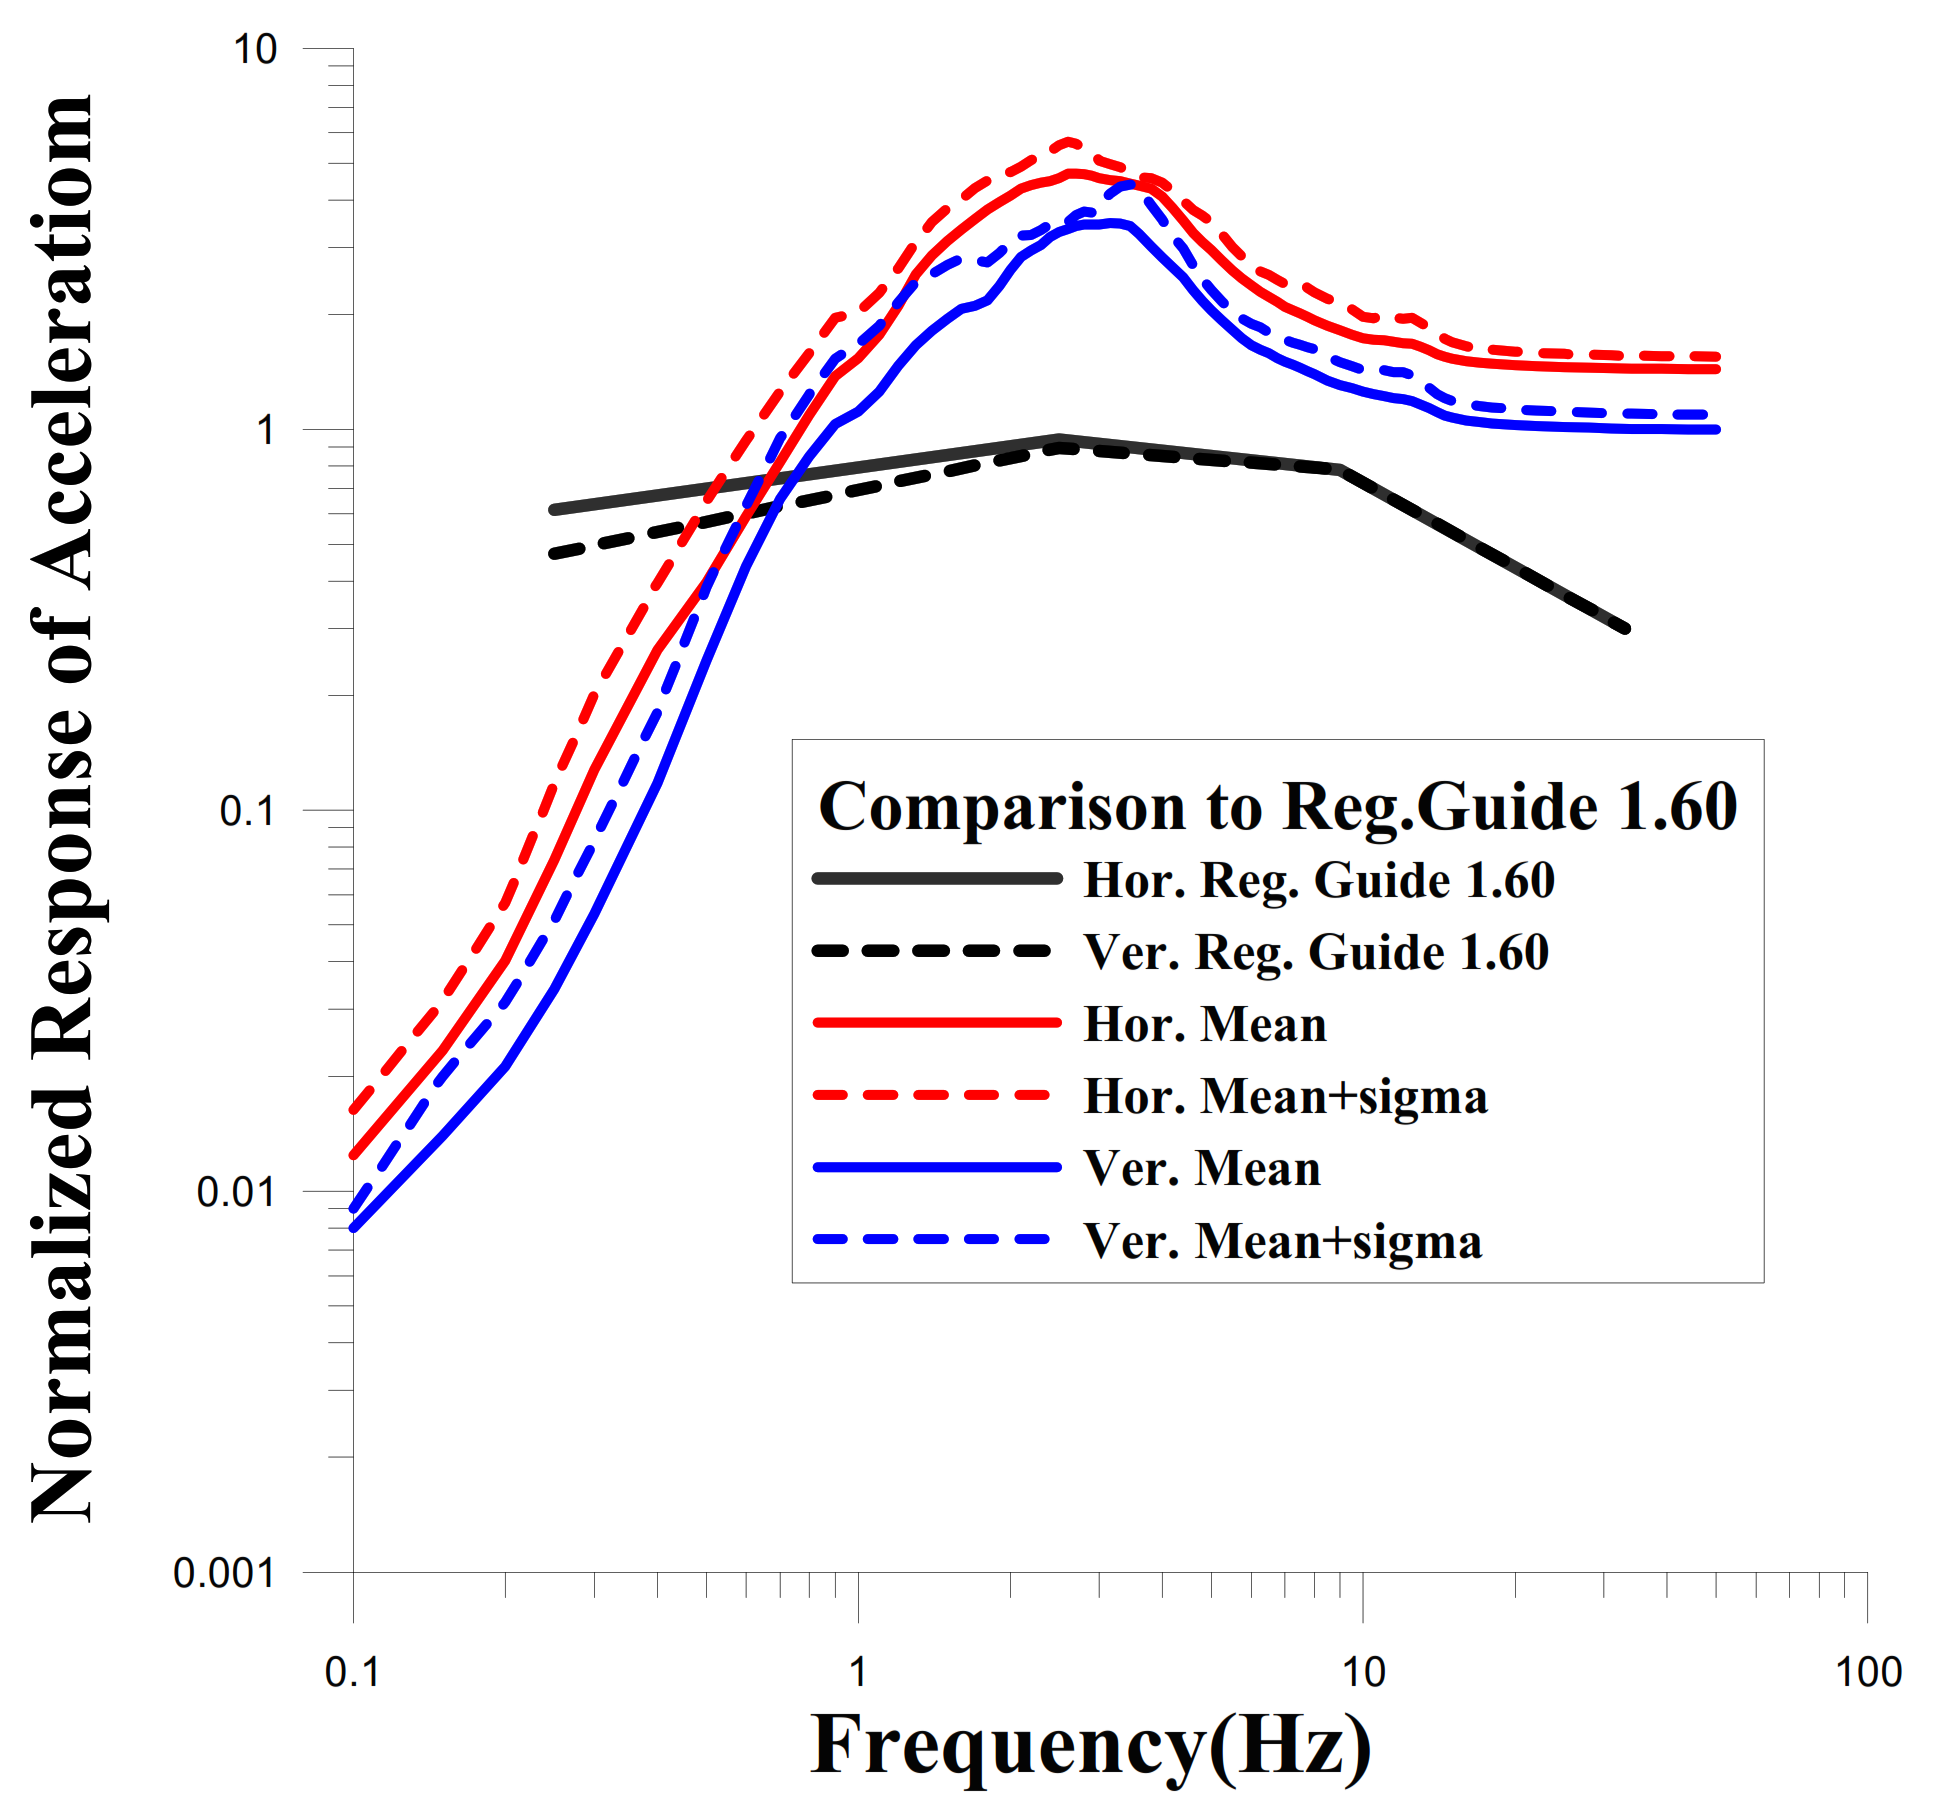
5.5. Comparison of the Results with the Reg. Guide 1.60
5.6. Comparison with KBC 2016
6. Conclusions
- We analyzed 24 macro-earthquakes, including the Kumamoto main shock (2016-04-16, ML; 7.3) and Pohang main shock (2017-11-15, ML; 5.4). Their response spectra showed characteristics similar to the typical design response spectrum shapes, as suggested by the various design standards, Reg Guide 1.60, 1.165, and 1.208 (US NRC 1973, 1997, 2007) and ASME (Gupta and Hall, 2017) [10,17,20,21].
- The vertical response spectra of the eight stations were consistently lower than the vector-summed horizontal spectra, which was in good agreement with the V/H scales suggested by various seismic design standards (Table 3). Furthermore, the vertical response spectra clearly indicated magnitude dependence in the lower frequency band.
- When establishing design response spectra that represents an arbitrary region or the Jeju region, it is necessary to consider a number of fairly large magnitudes of earthquakes (ML 6.0 or larger) considering the earthquake magnitude is essential for determining the characteristics of the response spectrum, especially in the low-frequency bands suggested in this and other studies. Fairly large earthquake magnitudes, e.g., ML 6.0 or larger, secure conservatism in the low-frequency ranges suggested by this study and other studies and are also important to reduce variability of observed response spectra. Considering the rare occurrence of seismic activities of ML 6.0 or larger in the Korean Peninsula, it is necessary to collect seismic ground motions from the south-eastern region of Japan, which is geographically closer to the Korean Peninsula, where earthquakes of ML 6.0 or larger occur frequently.
- Compared to that of inland areas, the maximum horizontal response in the Jeju area was fairly higher (~12%–13 %), whereas the frequency band with high responses at the peak (~2.0–6.0 Hz) was significantly lower. This could be attributed to the local geological environment of Jeju Island, which was formed mainly by a surface volcano eruption with lower shear velocity and is related to the existence of unconsolidated Pleistocene marine sediments distributed widely in the area. Further studies are necessary to understand the characteristic influence of layers with low shear wave velocity distributed in the Jeju region on the seismic responses based on the frequency band and amplitudes at the surface of Jeju.
- In this study, most frequency ranges with very high responses, including the peak, overlapped with the resonance frequencies of general low-rise and mid-rise buildings (2-story~7 story) considering both the brief formula and design response spectra suggested by KBC 2016, in contrast to frequencies higher than ~ 9 Hz in inland areas, which is far from the resonance frequency band. Owing to this, the seismic hazard on general buildings in the Jeju region could be much higher than that in inland areas. Therefore, it is necessary to establish an improved design response spectrum with site-specific response spectra in Jeju or to alter existing standards by applying natural resonance frequency ranges that are different from that of the inland areas.
- For the construction of nuclear facilities in the Jeju area, the seismic design code for nuclear facilities as suggested in Reg. Guide 1.60, should be carefully considered to provide the appropriate safety margins for frequencies ranging 0.6 Hz or higher. Therefore, rather than relying only on Reg. Guide 1.60, it is recommended to significantly improve the current design standards or develop new site-specific seismic design standards for nuclear facilities, which reflect the local seismo-tectonic and geological environment.
Author Contributions
Funding
Institutional Review Board Statement
Informed Consent Statement
Conflicts of Interest
References
- Kim, G.J.; Yang, K.K.; Kim, B.S.; Kim, H.J.; Yun, S.J.; Song, J.K. Seismic response evaluation of seismically isolated nuclear power structure subjected to Gyeongju earthquake. J. Earthq. Eng. 2016, 20, 453–469. [Google Scholar]
- Shin, D.H.; Hong, S.J.; Kim, H.J. Investigation on effective peak ground accelerations based on the Gyeongju earthquake records. J. Earthq. Eng. 2016, 20, 425–434. [Google Scholar] [CrossRef]
- Jee, H.W.; Han, S.W. Prediction of peak ground acceleration generated from the 2017 Pohang earthquake. J. Earthq. Eng. 2018, 22, 211–217. [Google Scholar] [CrossRef]
- Heo, T.M.; Kim, J.H.; Lee, J.H.; Kim, J.K. Response spectra of 2017 Pohang Earthquake and Comparison with Korean Standard Design Spectra. J. Earthq. Eng. 2018, 22, 129–137. [Google Scholar] [CrossRef]
- KIGAM. 1:250,000 Explanatory Note of the Jeju (Baekado, Jinnampo) Sheet; KIGAM: Daejeon, Korea, 2000. [Google Scholar]
- Tatsumi, Y.; Shukuno, H.; Yoshikawa, M.; Chang, Q.; Sato, K.; Lee, M.W. The petrology and geochemistry of volcanic rocks on Jeju Island: Plume magmatism along the Asian continental margin. J. Petrol. 2005, 46, 523–553. [Google Scholar] [CrossRef] [Green Version]
- Kim, K.Y.; Hong, M.H. Shear-wave velocity structure of Jeju island, Korea. Geosci. J. 2012, 16, 35–45. [Google Scholar] [CrossRef]
- Choi, J.; Kim, H.J.; Nam, M.J.; Lee, T.J.; Ham, N.; Lee, S.K.; Song, Y.; Suh, J.H. A study on geoelectrical structure of Jeju Island using 3D MT inversion of 2D profile data. Geophys. Geophys. Explor. 2007, 10, 268–274. (In Korean) [Google Scholar]
- Hahm, D.G.; Seo, J.M.; Choi, I.K.; Rhee, H.M. Uniform hazard spectrum evaluation method for nuclear power plants on soil sites based on the hazard spectra of bedrock sites. Korea J. Earthq. Eng. Soc. 2012, 16, 35–42. [Google Scholar] [CrossRef] [Green Version]
- Regulatory Guide 1. 208. A Performance-Based Approach to Define the Site-Specific Earthquake Ground Motion; U.S. Nuclear Regulatory Commission: Washington, DC, USA, 2007. [Google Scholar]
- Housner, G.W. Behavior of structures during earthquakes. J. Eng. Mech. ASCE 1959, 85, 104–111. [Google Scholar] [CrossRef]
- Bozorgnia, Y.; Campbell, K.W. The vertical-to-horizontal response spectral ratio and tentative procedures for developing simplified V/H and vertical design spectra. J. Earthq. Eng. 2004, 8, 175–207. [Google Scholar] [CrossRef]
- Elgamal, A.; He, L. Vertical earthquake ground motion records: An overview. J. Earthq. Eng. 2004, 8, 663–697. [Google Scholar] [CrossRef]
- Kim, J.K.; Oh, T.S. Characteristics of vertical and horizontal response spectra using accelerations from the Fukuoka earthquake series. Disaster Adv. 2016, 9, 1–9. [Google Scholar]
- Kim, J.K.; Oh, T.S.; Kwon, Y.J.; Noh, J.S. Characteristics of the horizontal and vertical response spectra of the Pohang earthquake. Disaster Adv. 2018, 11, 1–10. [Google Scholar]
- Kim, J.K.; Wee, S.H.; Yoo, S.H. Characteristics of the vertical and horizontal response spectra of the Gyeongju earthquake (12 September 2016, ML = 5.8) series. Explor. Geophys. 2019, 50, 136–143. [Google Scholar] [CrossRef]
- Regulatory Guide 1. 60. Design Response Spectra for Seismic Design of Nuclear Power Plants; Revision 1; U.S. Atomic Energy Commission: Washington, DC, USA, 1973. [Google Scholar]
- MOLIT. Korean Building Code, Building Structural Code Revision; MOLIT: Seoul, Korea, 2016. [Google Scholar]
- NUREG-0800. Standard Review Plan for the Review of Safety Analysis Reports for Nuclear Power Plants; U.S. Nuclear Regulatory Commission: Washington, DC, USA, 1975. [Google Scholar]
- Regulatory Guide 1. 165. Identification and Characterization of Seismic Sources and Determination of Safe Shutdown Earthquake Ground Motion; U.S. Nuclear Regulatory Commission: Washington, DC, USA, 1997. [Google Scholar]
- Gupta, B.K.; Hall, W.J. Response Spectrum Method in Seismic Analysis and Design of Structures; Imprint Routledge: Boca Raton, FL, USA, 2017. [Google Scholar] [CrossRef]
- Silva, W.J.; Youngs, R.R.; Idriss, I.M. Development of design response spectral shapes for Central and Eastern US (CEUS) and Western US (WUS) rock site conditions. In Proceedings of the OECE-NEA Workshop on Engineering Characterization of Seismic, Upton, NY, USA, 15–17 November 1999. [Google Scholar]
- Brune, J.N. Tectonic stress and the spectra of seismic shear waves from earthquakes. JGR 1970, 75, 4997–5009. [Google Scholar] [CrossRef] [Green Version]
- Madariaga, R. Dynamics of an expanding circular fault. Bull. Seism. Soc. Am. 1976, 66, 639–666. [Google Scholar] [CrossRef]
- Beresnev, I.A.; Atkinson, G.M. FINSIM—A FORTRAN program for simulating stochastic acceleration time histories from finite faults. Seism. Res. Lett. 1998, 69, 27–32. [Google Scholar] [CrossRef] [Green Version]
- Boore, D.M. Prediction of ground motion using the stochastic method. Pure Appl. Geophy. 2003, 160, 635–676. [Google Scholar] [CrossRef] [Green Version]
- Motazedian, D.; Atkinson, G.M. Stochastic finite-fault modeling based on a dynamic corner frequency. Bull. Seism. Soc. Am. 2015, 95, 995–1010. [Google Scholar] [CrossRef]
- Yang, J.; Lee, C.M. Characteristics of vertical and horizontal ground motions recorded during the Niigata-ken Chuetsu, Japan Earthquake of 23 October 2004. Eng. Geol. 2007, 94, 50–64. [Google Scholar] [CrossRef]
- Campbell, K.W.; Bozorgnia, Y. GA-West2 Ground Motion Model for the Average Horizontal Components of PGA, PGV, and 5% Damped Linear Acceleration Response Spectra. Earthq. Spectra 2014, 30, 1087–1115. [Google Scholar] [CrossRef]
- Bindi, D.; Spallarossa, D.; Pacork, F. Between-event and between-station variability observed in the Fourier and response spectra domains: Comparison with seismological models. Geophy. J. Int. 2017, 210, 1092–1104. [Google Scholar] [CrossRef] [Green Version]
- Douglas, J.; Philippe, J. Modeling the Difference in Ground-Motion Magnitude-Scaling in Small and Large. Seism. Rese. Lett. 2011, 82, 504–508. [Google Scholar] [CrossRef]
- Oh, J.; Yi, S.; Yoon, S.; Koh, G.W.; Yun, H.; Lee, J.D. Subsurface stratigraphy of Jeju Island. Korea J. Earthq. Eng. Soc. 2000, 36, 181–194, (In Korean with English abstract). [Google Scholar]
- Yoon, J.G.; Kim, D.S.; Bang, E.S. Development of Site Classification System and Modification of Design Response Spectra considering Geotechnical Site Characteristics in Korea (I)—Problem Statements of the Current Seismic Design Code. Korea J. Earthq. Eng. Soc. 2006, 10, 39–50. [Google Scholar]
- Sun, C.G.; Chung, C.K.; Kim, D.S.; Kim, J.K. Evaluation of site-specific seismic response characteristics at town fortress areas damaged by historical earthquakes. Eng. Geol. 2007, 17, 1–13. [Google Scholar]


| No. | Event Date | Lat. | Log. | ML | Stations | Remarks |
|---|---|---|---|---|---|---|
| 1 | 2016-04-14 21:26:00 | 32.70 | 130.80 | 6.5 | GOS1,HALB,JJB,JJU1,MRD,SGP1,SSP | Kumamoto Event |
| 2 | 2016-04-14 22:07:00 | 32.80 | 130.80 | 5.7 | GOS1,HALB,JJB,JJU1,MRD,SGP1,SSP | Kumamoto Event |
| 3 | 2016-04-14 22:38:00 | 32.70 | 130.70 | 5.0 | GOS1,HALB,JJB,JJU1,MRD,SGP1,SSP | Kumamoto Event |
| 4 | 2016-04-15 00:03:00 | 32.70 | 130.80 | 6.4 | GOS1,HALB,JJB,JJU1,MRD,SGP1,SSP | Kumamoto Event |
| 5 | 2016-04-15 01:53:00 | 32.70 | 130.80 | 4.8 | GOS1,HALB,JJB,JJU1,MRD,SGP1,SSP | Kumamoto Event |
| 6 | 2016-04-16 01:25:00 | 32.80 | 130.80 | 7.3 | GOS1,HALB,JJB,JJU1,MRD,SGP1,SSP | Kumamoto Event |
| 7 | 2016-04-16 01:45:00 | 32.90 | 130.90 | 6.0 | GOS1,HALB,JJB,JJU1,MRD,SGP1,SSP | Kumamoto Event |
| 8 | 2016-04-16 03:03:00 | 33.00 | 131.10 | 5.8 | GOS1,HALB,JJB,JJU1,MRD,SGP1,SSP | Kumamoto Event |
| 9 | 2016-04-16 03:55:00 | 33.00 | 131.20 | 5.8 | GOS1,HALB,JJB,JJU1,MRD,SGP1,SSP | Kumamoto Event |
| 10 | 2016-04-16 07:23:00 | 32.80 | 130.80 | 4.8 | GOS1,HALB,JJB,JJU1,MRD,SGP1,SSP | Kumamoto Event |
| 11 | 2016-04-16 09:48:00 | 32.90 | 130.80 | 5.4 | GOS1,HALB,JJB,JJU1,MRD,SGP1,SSP | Kumamoto Event |
| 12 | 2016-04-16 16:01:00 | 32.80 | 130.80 | 5.3 | GOS1,HALB,JJB,JJU1,MRD,SGP1,SSP | Kumamoto Event |
| 13 | 2016-04-17 00:14:00 | 33.00 | 131.10 | 4.9 | GOS1,HALB,JJB,JJU1,MRD,SGP1,SSP | Kumamoto Event |
| 14 | 2016-04-19 17:52:00 | 32.60 | 130.70 | 5.5 | GOS1,HALB,JJB,JJU1,MRD,SGP1,SSP | Kumamoto Event |
| 15 | 2016-04-19 20:47:00 | 32.60 | 130.70 | 5.0 | GOS1,HALB,JJB,JJU1,MRD,SGP1,SSP | Kumamoto Event |
| 16 | 2017-11-15 14:29:31 | 36.11 | 129.37 | 5.4 | CJD,JJU2,SGP2,UDO | Pohang Event |
| 17 | 2017-11-15 14:32:59 | 36.10 | 129.36 | 3.6 | CJD,JJU2,SGP2,UDO | Pohang Event |
| 18 | 2017-11-15 15:09:49 | 36.09 | 129.34 | 3.5 | CJD,JJU2,SGP2,UDO | Pohang Event |
| 19 | 2017-11-15 16:49:30 | 36.12 | 129.36 | 4.3 | CJD,JJU2,SGP2,UDO | Pohang Event |
| 20 | 2017-11-19 23:45:47 | 36.12 | 129.36 | 3.5 | CJD,JJU2,SGP2,UDO | Pohang Event |
| 21 | 2017-11-20 06:05:15 | 36.14 | 129.36 | 3.6 | CJD,JJU2,SGP2,UDO | Pohang Event |
| 22 | 2017-12-25 16:19:22 | 36.11 | 129.36 | 3.5 | CJD,JJU2,SGP2,UDO | Pohang Event |
| 23 | 2018-02-11 05:03:03 | 36.08 | 129.33 | 4.6 | CJD,JJU2,SGP2,UDO | Pohang Event |
| 24 | 2019-02-10 12:53:38 | 36.16 | 129.90 | 4.1 | CJD,JJU2,SGP2,UDO | Pohang Event |
Publisher’s Note: MDPI stays neutral with regard to jurisdictional claims in published maps and institutional affiliations. |
© 2021 by the authors. Licensee MDPI, Basel, Switzerland. This article is an open access article distributed under the terms and conditions of the Creative Commons Attribution (CC BY) license (https://creativecommons.org/licenses/by/4.0/).
Share and Cite
Kim, J.-K.; Wee, S.-H.; Yoo, S.-H.; Kim, K.-H. Characteristics of the Vertical and Horizontal Response Spectra of Earthquakes in the Jeju Island Region. Appl. Sci. 2021, 11, 10690. https://doi.org/10.3390/app112210690
Kim J-K, Wee S-H, Yoo S-H, Kim K-H. Characteristics of the Vertical and Horizontal Response Spectra of Earthquakes in the Jeju Island Region. Applied Sciences. 2021; 11(22):10690. https://doi.org/10.3390/app112210690
Chicago/Turabian StyleKim, Jun-Kyoung, Soung-Hoon Wee, Seong-Hwa Yoo, and Kwang-Hee Kim. 2021. "Characteristics of the Vertical and Horizontal Response Spectra of Earthquakes in the Jeju Island Region" Applied Sciences 11, no. 22: 10690. https://doi.org/10.3390/app112210690
APA StyleKim, J.-K., Wee, S.-H., Yoo, S.-H., & Kim, K.-H. (2021). Characteristics of the Vertical and Horizontal Response Spectra of Earthquakes in the Jeju Island Region. Applied Sciences, 11(22), 10690. https://doi.org/10.3390/app112210690