
Denitrification in Intrinsic and Specific Groundwater Vulnerability Assessment: A Review


Abstract
:1. Introduction
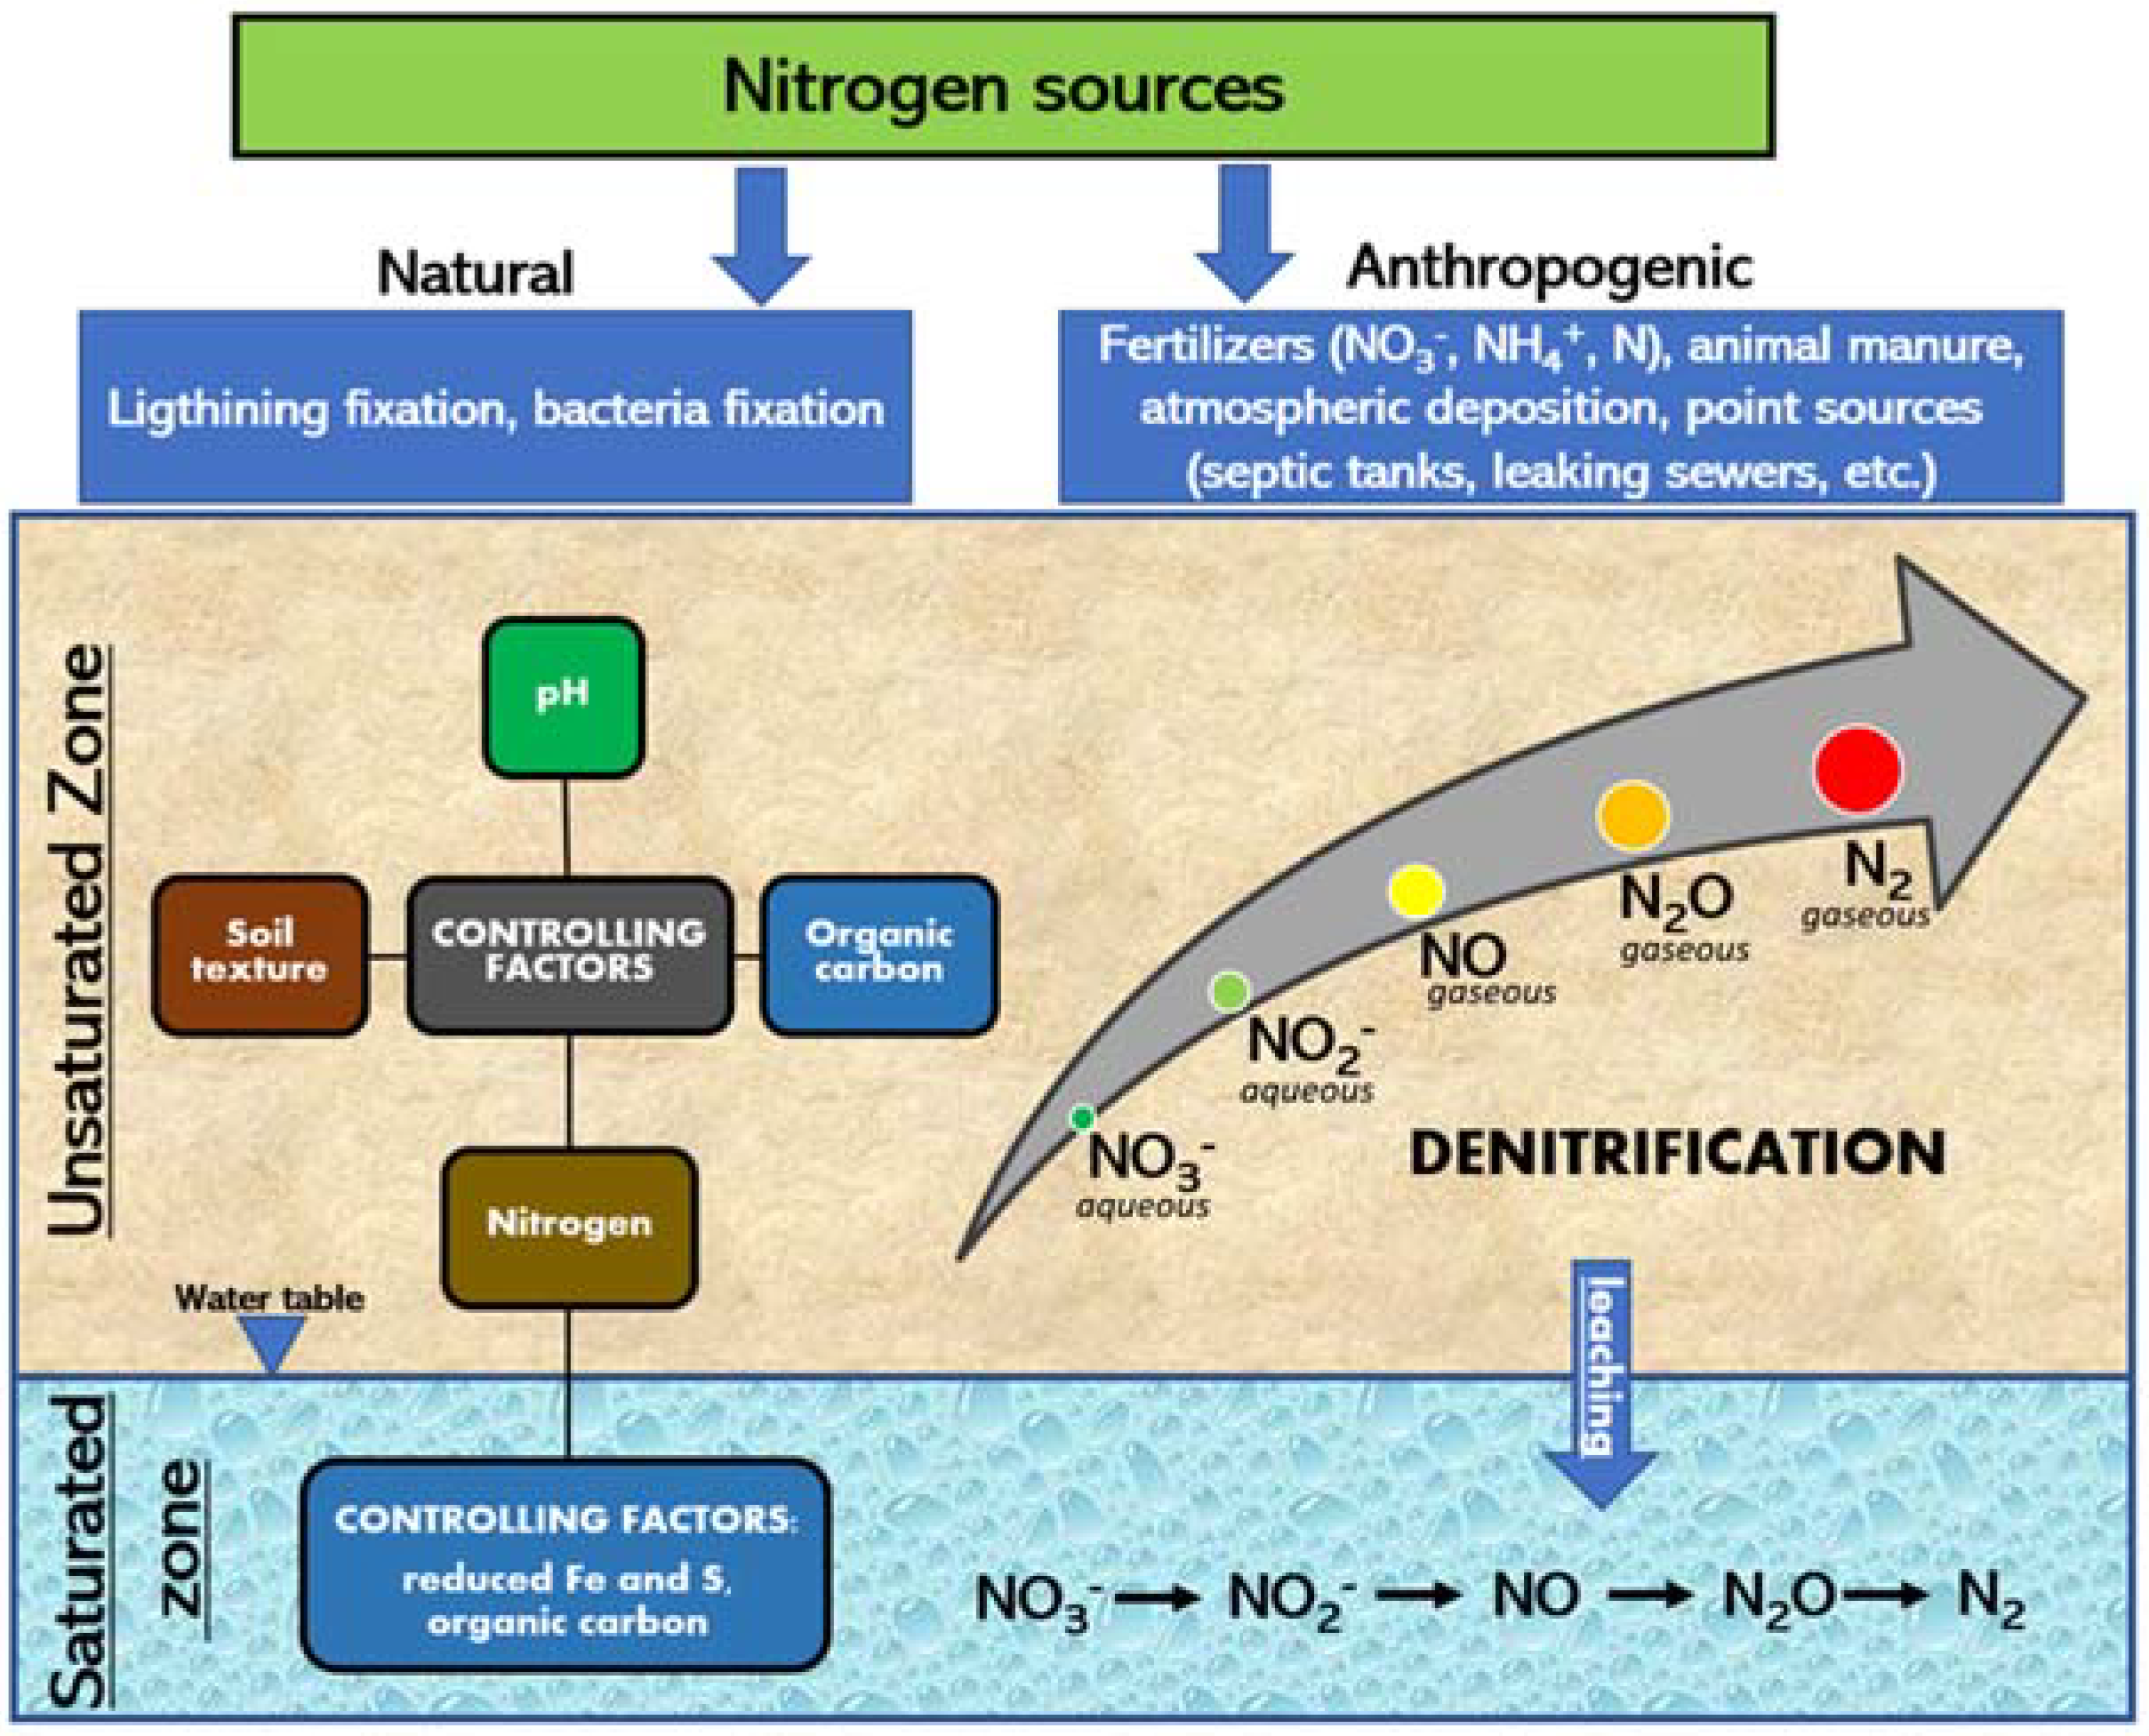
2. Denitrification in the Unsaturated and Saturated Zones
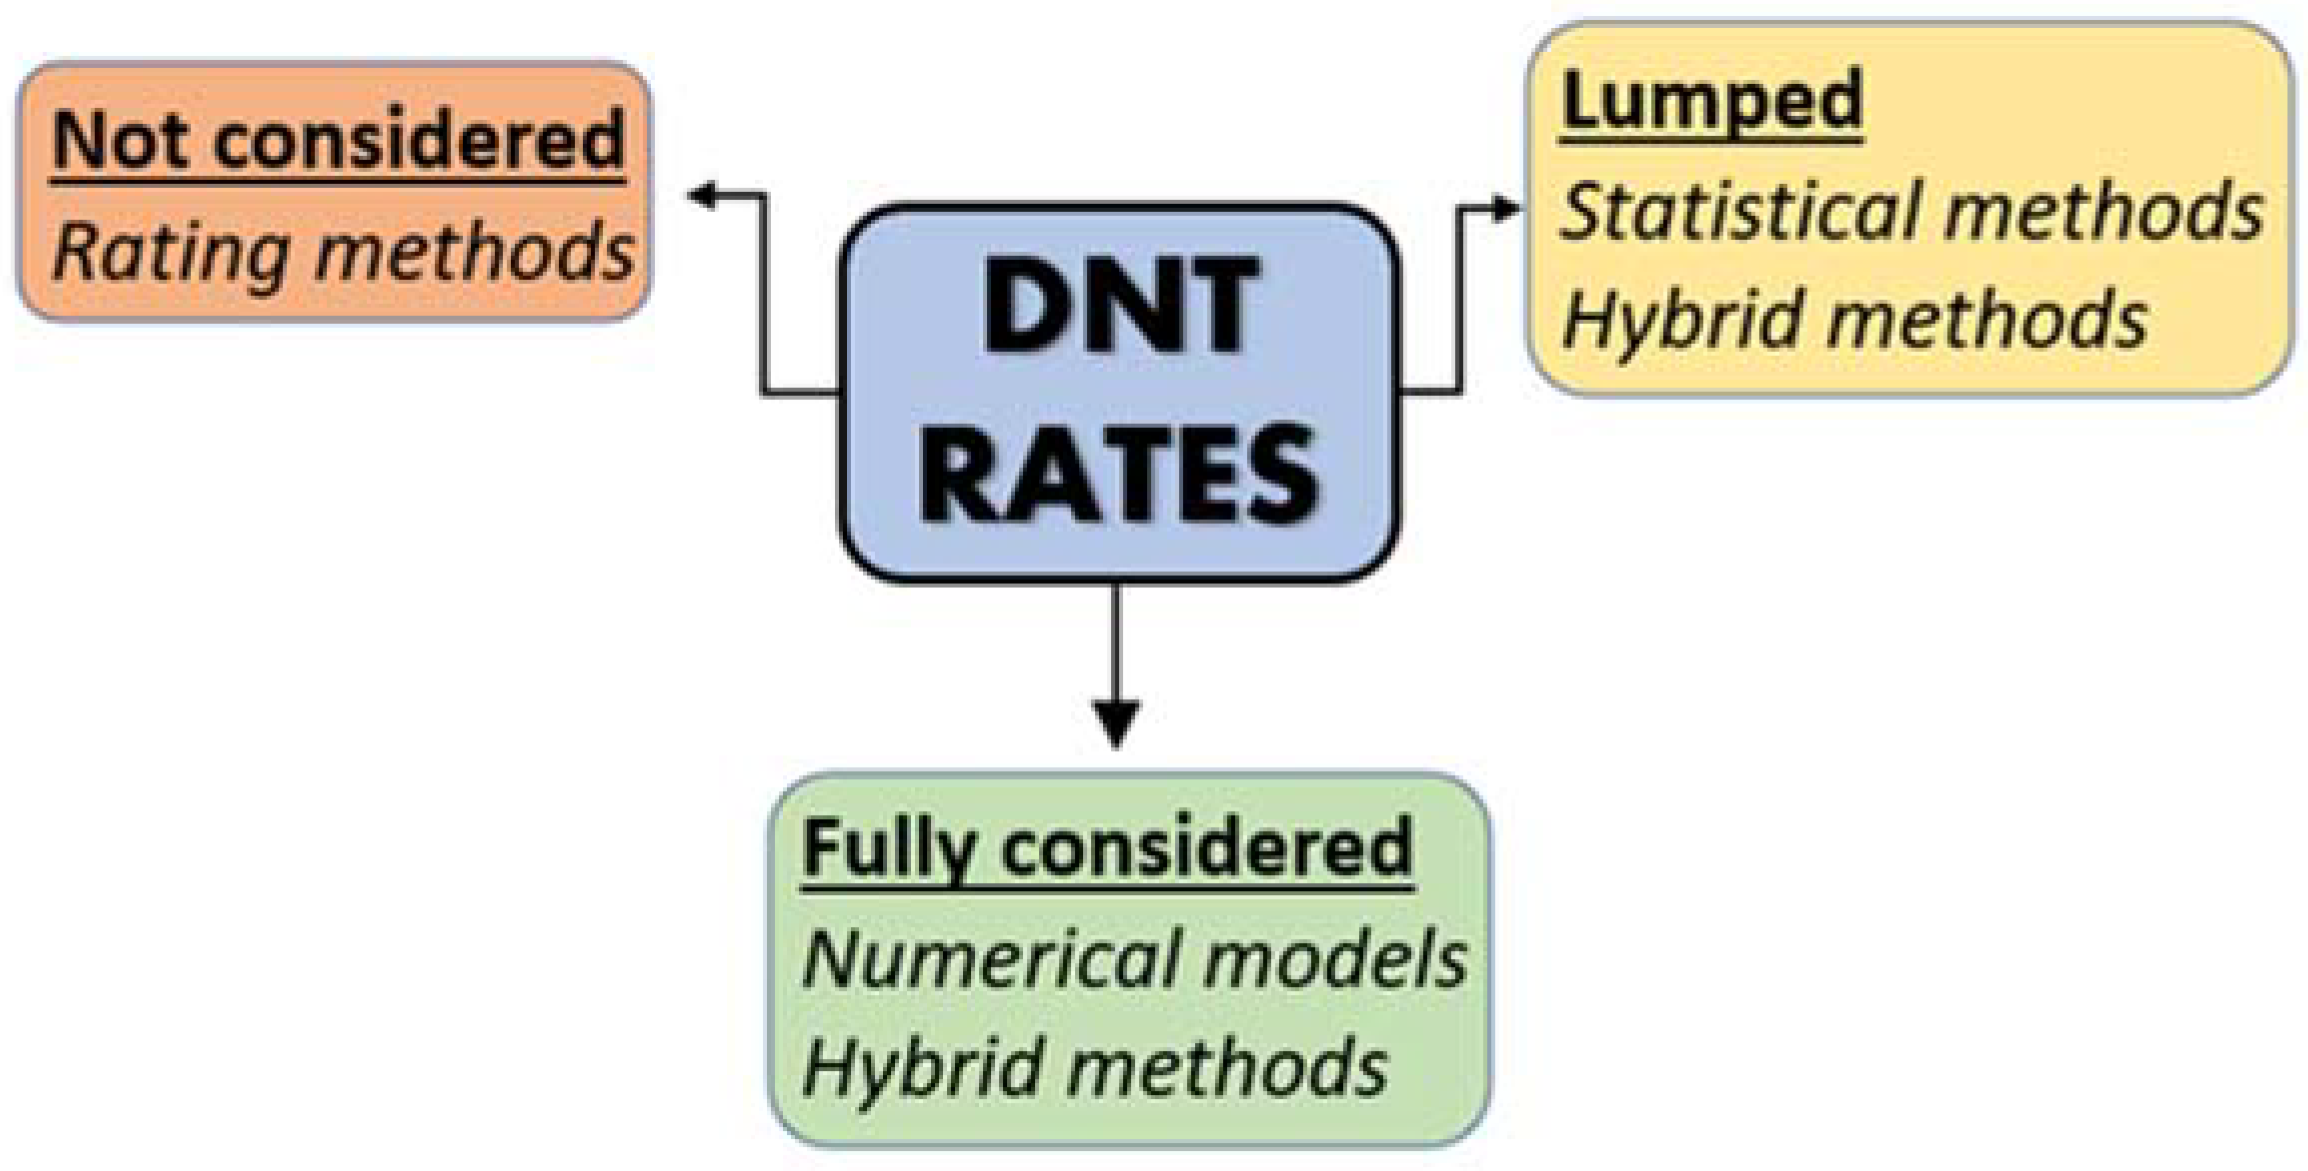
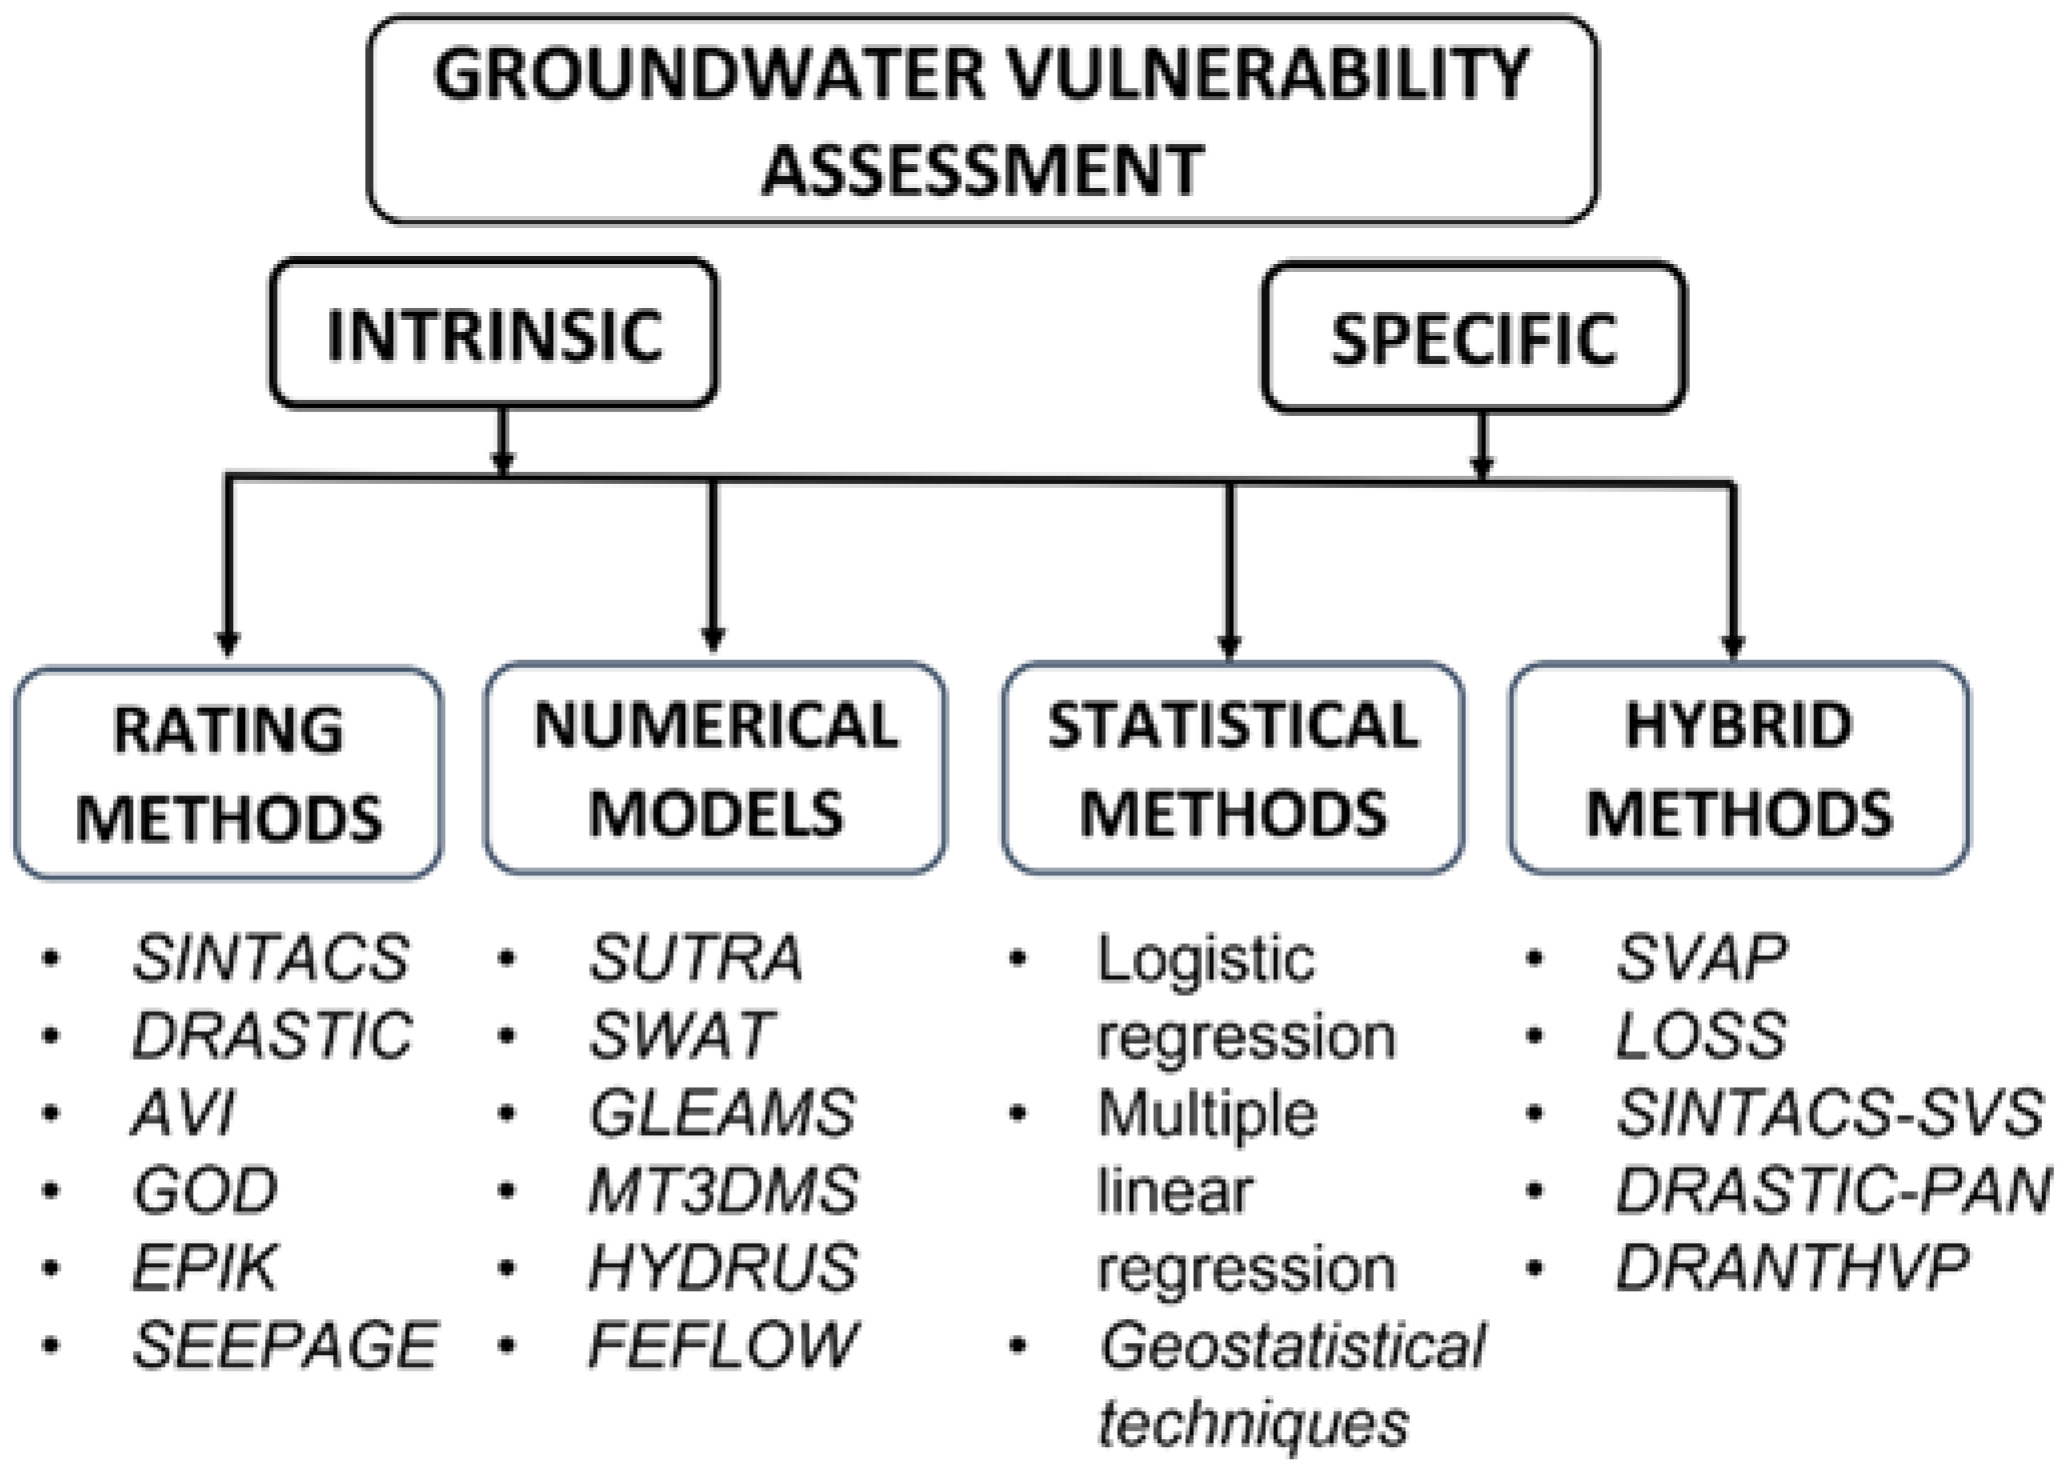
3. Materials and Methods
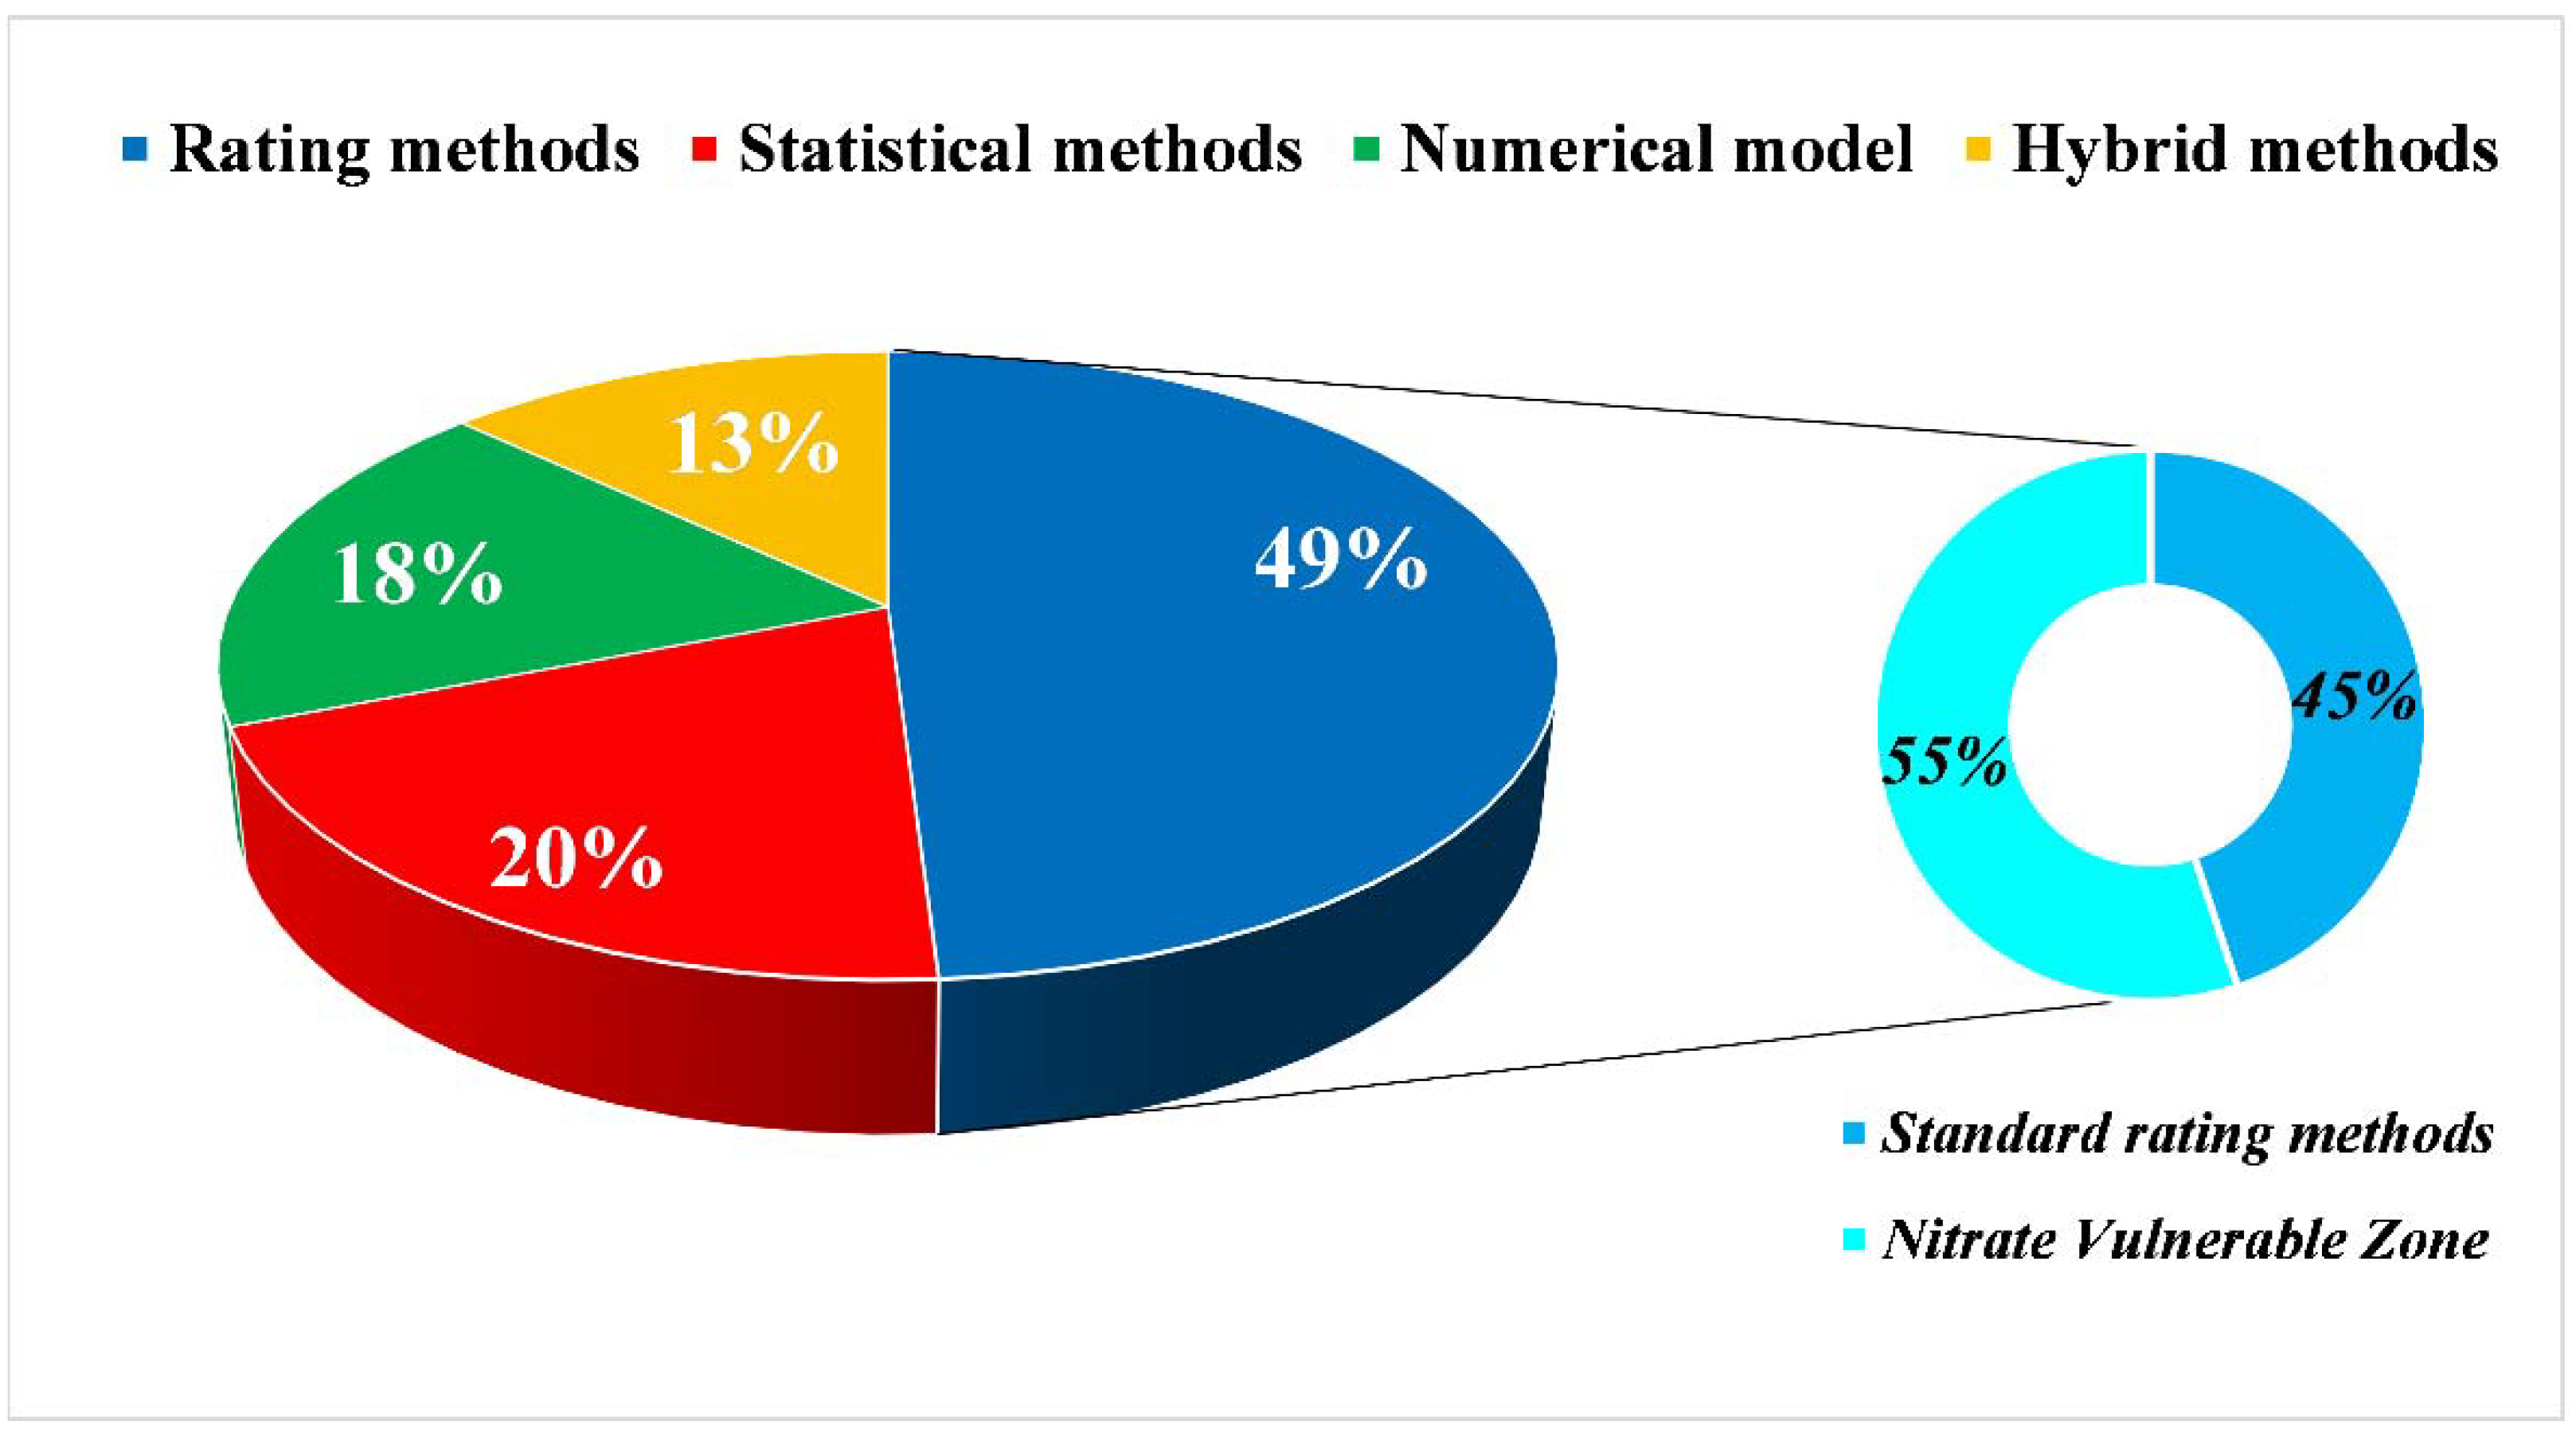
4. Results and Discussion
4.1. Rating Methods for Nitrate Vulnerability Assessment
Nitrate Vulnerable Zones
4.2. Statistical Methods
4.3. Numerical Models
4.4. Hybrid Methodologies
5. Concluding Remarks
5.1. The Role of Denitrification in Groundwater Vulnerability Assessment
5.2. Future Trends in the Application of Groundwater Vulnerability Assessment
Author Contributions
Funding
Institutional Review Board Statement
Informed Consent Statement
Data Availability Statement
Conflicts of Interest
References
- Han, D.; Currell, M.J.; Cao, G. Deep challenges for China’s war on water pollution. Environ. Pollut. 2016, 218, 1222–1233. [Google Scholar] [CrossRef] [PubMed] [Green Version]
- Kut, K.M.K.; Sarswat, A.; Srivastava, A.; Pittman, C.U.; Mohan, D. A review of fluoride in african groundwater and local remediation methods. Groundw. Sustain. Dev. 2016, 2–3, 190–212. [Google Scholar] [CrossRef]
- Burri, N.M.; Weatherl, R.; Moeck, C.; Schirmer, M. A review of threats to groundwater quality in the Anthropocene. Sci. Total Environ. 2019, 684, 136–154. [Google Scholar] [CrossRef]
- Kurwadkar, S. Emerging Trends in Groundwater Pollution and Quality. Water Environ. Res. 2014, 86, 1677–1691. [Google Scholar] [CrossRef]
- Kristensen, P.; Whalley, C.; Néry, F.; Zal, N.; Christiansen, T. European Waters—Assessment of Status and Pressures 2018; EEA Report No. 7/2018; European Environment Agency: Copenhagen, Denmark, 2018. [CrossRef]
- Gorelick, S.M.; Zheng, C. Global change and the groundwater management challenge. Water Resour. Res. 2015, 51, 3031–3051. [Google Scholar] [CrossRef]
- Kumar, R.; Heße, F.; Rao, P.S.C.; Musolff, A.; Jawitz, J.W.; Sarrazin, F.; Samaniego, L.; Fleckenstein, J.H.; Rakovec, O.; Thober, S.; et al. Strong hydroclimatic controls on vulnerability to subsurface nitrate contamination across Europe. Nat. Commun. 2020, 11, 6302. [Google Scholar] [CrossRef] [PubMed]
- Ascott, M.J.; Gooddy, D.C.; Wang, L.; Stuart, M.E.; Lewis, M.A.; Ward, R.S.; Binley, A.M. Global patterns of nitrate storage in the vadose zone. Nat. Commun. 2017, 8, 1416. [Google Scholar] [CrossRef]
- Erisman, J.W.; Galloway, J.N.; Seitzinger, S.; Bleeker, A.; Dise, N.B.; Petrescu, A.M.R.; Leach, A.M.; de Vries, W. Consequences of human modification of the global nitrogen cycle. Philos. Trans. R Soc. B Biol. Sci. 2013, 368, 20130116. [Google Scholar] [CrossRef] [Green Version]
- Liu, G.D.; Wu, W.L.; Zhang, J. Regional differentiation of non-point source pollution of agriculture-derived nitrate nitrogen in groundwater in northern China. Agric. Ecosyst. Environ. 2005, 107, 211–220. [Google Scholar] [CrossRef]
- Busico, G.; Kazakis, N.; Colombani, N.; Khosravi, K.; Voudouris, K.; Mastrocicco, M. The Importance of Incorporating Denitrification in the Assessment of Groundwater Vulnerability. Appl. Sci. 2020, 10, 2328. [Google Scholar] [CrossRef] [Green Version]
- Steffen, W.; Richardson, K.; Rockstrom, J.; Cornell, S.E.; Fetzer, I.; Bennett, E.M.; Biggs, R.; Carpenter, S.R.; de Vries, W.; de Wit, C.A.; et al. Planetary boundaries: Guiding human development on a changing planet. Science 2015, 347, 1259855. [Google Scholar] [CrossRef] [PubMed] [Green Version]
- Manassaram, D.M.; Backer, L.C.; Messing, R.; Fleming, L.E.; Luke, B.; Monteilh, C.P. Nitrates in drinking water and methemoglobin levels in pregnancy: A longitudinal study. Environ. Health 2010, 9, 60. [Google Scholar] [CrossRef] [Green Version]
- Morée, A.L.; Beusen, A.H.W.; Bouwman, A.F.; Willems, W.J. Exploring global nitrogen and phosphorus flows in urban wastes during the twentieth century. Glob. Biogeochem. Cycles 2013, 27, 836–846. [Google Scholar] [CrossRef] [Green Version]
- U.S. Environmental Protection Agency. 2018 Edition of the Drinking Water Standards and Health Advisories Tables; Office of Water-U.S. EPA: Washington, DC, USA, 2018.
- European Union Council. Council Directive 98/83/EC of 3 November 1998 on the Quality of Water Intended for Human Consumption. Off. J. Eur. Union 1998, 330, 32–54. [Google Scholar]
- Seitzinger, S.; Harrison, J.A.; Böhlke, J.K.; Bouwman, A.F.; Lowrance, R.; Peterson, B.; Tobias, C.; Drecht, G.V. Denitrification across landscapes and waterscapes: A synthesis. Ecol. Appl. 2006, 16, 2064–2090. [Google Scholar] [CrossRef] [Green Version]
- Debernardi, L.; De Luca, D.A.; Lasagna, M. Correlation between nitrate concentration in groundwater and parameters affecting aquifer intrinsic vulnerability. Environ. Geol. 2008, 55, 539–558. [Google Scholar] [CrossRef]
- Otero, N.; Torrentó, C.; Soler, A.; Menció, A.; Mas-Pla, J. Monitoring groundwater nitrate attenuation in a regional system coupling hydrogeology with multi-isotopic methods: The case of Plana de Vic (Osona, Spain). Agric. Ecosyst. Environ. 2009, 133, 103–113. [Google Scholar] [CrossRef] [Green Version]
- Yoon, S.; Song, B.; Phillips, R.L.; Chang, J.; Song, M.J. Ecological and physiological implications of nitrogen oxide reduction pathways on greenhouse gas emissions in agroecosystems. FEMS Microbiol. Ecol. 2019, 95. [Google Scholar] [CrossRef]
- Silver, W.L.; Herman, D.J.; Firestone, M.K. Dissimilatory nitrate reduction to ammonium in upland tropical forest soils. Ecology 2001, 82, 2410–2416. [Google Scholar] [CrossRef]
- Kartal, B.; Kuypers, M.M.M.; Lavik, G.; Schalk, J.; Op den Camp, H.J.M.; Jetten, M.S.M.; Strous, M. Anammox bacteria disguised as denitrifiers: Nitrate reduction to dinitrogen gas via nitrite and ammonium. Environ. Microbiol. 2007, 9, 635–642. [Google Scholar] [CrossRef]
- Di Capua, F.; Pirozzi, F.; Lens, P.N.L.; Esposito, G. Electron donors for autotrophic denitrification. Chem. Eng. J. 2019, 362, 922–937. [Google Scholar] [CrossRef]
- Dinnes, D.L.; Karlen, D.L.; Jaynes, D.B.; Kaspar, T.C.; Hatfield, J.L.; Colvin, T.S.; Cambardella, C.A. Nitrogen Management Strategies to Reduce Nitrate Leaching in Tile-Drained Midwestern Soils. Agron. J. 2002, 94, 153. [Google Scholar] [CrossRef]
- Biddau, R.; Cidu, R.; Da Pelo, S.; Carletti, A.; Ghiglieri, G.; Pittalis, D. Source and fate of nitrate in contaminated groundwater systems: Assessing spatial and temporal variations by hydrogeochemistry and multiple stable isotope tools. Sci. Total Environ. 2019, 647, 1121–1136. [Google Scholar] [CrossRef]
- Liu, C.-Q.; Li, S.-L.; Lang, Y.-C.; Xiao, H.-Y. Using δ 15 N- and δ 18 O-Values To Identify Nitrate Sources in Karst Ground Water, Guiyang, Southwest China. Environ. Sci. Technol. 2006, 40, 6928–6933. [Google Scholar] [CrossRef]
- Kazakis, N.; Matiatos, I.; Ntona, M.-M.; Bannenberg, M.; Kalaitzidou, K.; Kaprara, E.; Mitrakas, M.; Ioannidou, A.; Vargemezis, G.; Voudouris, K. Origin, implications and management strategies for nitrate pollution in surface and ground waters of Anthemountas basin based on a δ15N-NO3− and δ18O-NO3− isotope approach. Sci. Total Environ. 2020, 724, 138211. [Google Scholar] [CrossRef] [PubMed]
- Busico, G.; Cuoco, E.; Kazakis, N.; Colombani, N.; Mastrocicco, M.; Tedesco, D.; Voudouris, K. Multivariate statistical analysis to characterize/discriminate between anthropogenic and geogenic trace elements occurrence in the Campania Plain, Southern Italy. Environ. Pollut. 2018, 234, 260–269. [Google Scholar] [CrossRef]
- Wijayanti, Y.; Nakamura, T.; Nishida, K.; Haramoto, E.; Sakamoto, Y. Seasonal Differences and Source Estimation of Groundwater Nitrate Contamination. J. Water Environ. Technol. 2013, 11, 163–174. [Google Scholar] [CrossRef] [Green Version]
- Jin, L.; Whitehead, P.G.; Futter, M.N.; Lu, Z. Modelling the impacts of climate change on flow and nitrate in the River Thames: Assessing potential adaptation strategies. Hydrol. Res. 2012, 43, 902–916. [Google Scholar] [CrossRef]
- Menció, A.; Boy, M.; Mas-Pla, J. Analysis of vulnerability factors that control nitrate occurrence in natural springs (Osona Region, NE Spain). Sci. Total Environ. 2011, 409, 3049–3058. [Google Scholar] [CrossRef]
- Álvarez-Cabria, M.; Barquín, J.; Peñas, F.J. Modelling the spatial and seasonal variability of water quality for entire river networks: Relationships with natural and anthropogenic factors. Sci. Total Environ. 2016, 545–546, 152–162. [Google Scholar] [CrossRef]
- Vigliotti, M.; Busico, G.; Ruberti, D. Assessment of the Vulnerability to Agricultural Nitrate in Two Highly Diversified Environmental Settings. Environments 2020, 7, 80. [Google Scholar] [CrossRef]
- Jha, M.K.; Chowdhury, A.; Chowdary, V.M.; Peiffer, S. Groundwater management and development by integrated remote sensing and geographic information systems: Prospects and constraints. Water Resour. Manag. 2007, 21, 427–467. [Google Scholar] [CrossRef]
- Vrba, J.; Zaporozec, A. Guidebook on mapping groundwater vulnerability. In IAH International Contributions to Hydrogeology; Heise Pub: Hannover, Germany, 1994; Volume 16. [Google Scholar]
- Foster, S.; Hirata, R.; Andreo, B. The aquifer pollution vulnerability concept: Aid or impediment in promoting groundwater protection? Hydrogeol. J. 2013, 21, 1389–1392. [Google Scholar] [CrossRef]
- National Research Council. Groundwater Vulnerability Assessment—Predicting Relative Contamination Potential under Conditions of Uncertainty; National Academy Press: Washington, DC, USA, 1993. [Google Scholar] [CrossRef]
- Machiwal, D.; Jha, M.K.; Singh, V.P.; Mohan, C. Assessment and mapping of groundwater vulnerability to pollution: Current status and challenges. Earth-Sci. Rev. 2018, 185, 901–927. [Google Scholar] [CrossRef]
- Behrend, H.; Opitz, D. Retention of nutrients in river systems: Dependence on specific runoff and hydraulic load. In Man and River Systems. Developments in Hydrobiology; Garnier, J., Mouchel, J.M., Eds.; Springer: Dordrecht, The Netherlands, 1999; pp. 111–122. [Google Scholar] [CrossRef]
- Bicking, S.; Steinhoff-Knopp, B.; Burkhard, B.; Müller, F. Quantification and mapping of the nutrient regulation ecosystem service demand on a local scale. Ecosyst. People 2020, 16, 114–134. [Google Scholar] [CrossRef] [Green Version]
- Kersebaum, K.C.; Matzdorf, B.; Kiesel, J.; Piorr, A.; Steidl, J. Model-based evaluation of agri-environmental measures in the Federal State of Brandenburg (Germany) concerning N pollution of groundwater and surface water. J. Plant Nutr. Soil Sci. 2006, 169, 352–359. [Google Scholar] [CrossRef]
- Lasagna, M.; De Luca, D.A.; Franchino, E. The role of physical and biological processes in aquifers and their importance on groundwater vulnerability to nitrate pollution. Environ. Earth Sci. 2016, 75, 961. [Google Scholar] [CrossRef]
- Lasagna, M.; De Luca, D.A.; Franchino, E. Intrinsic groundwater vulnerability assessment: Issues, comparison of different methodologies and correlation with nitrate concentrations in NW Italy. Environ. Earth Sci. 2018, 77, 277. [Google Scholar] [CrossRef]
- Rivett, M.O.; Buss, S.R.; Morgan, P.; Smith, J.W.N.; Bemment, C.D. Nitrate attenuation in groundwater: A review of biogeochemical controlling processes. Water Res. 2008, 42, 4215–4232. [Google Scholar] [CrossRef]
- Akiyama, H.; Yan, X.; Yagi, K. Evaluation of effectiveness of enhanced-efficiency fertilizers as mitigation options for N2O and NO emissions from agricultural soils: Meta-analysis. Glob. Chang. Biol. 2009, 16, 1837–1846. [Google Scholar] [CrossRef]
- Šimek, M.; Cooper, J.E.; Picek, T.; Šantrůčková, H. Denitrification in arable soils in relation to their physico-chemical properties and fertilization practice. Soil Biol. Biochem. 2000, 32, 101–110. [Google Scholar] [CrossRef]
- Li, X.; Hu, C.; Delgado, J.A.; Zhang, Y.; Ouyang, Z. Increased nitrogen use efficiencies as a key mitigation alternative to reduce nitrate leaching in north china plain. Agric. Water Manag. 2007, 89, 137–147. [Google Scholar] [CrossRef]
- D’Haene, K.; Moreels, E.; De Neve, S.; Chaves Daguilar, B.; Boeckx, P.; Hofman, G.; Van Cleemput, O. Soil properties influencing the denitrification potential of Flemish agricultural soils. Biol. Fertil. Soils 2003, 38, 358–366. [Google Scholar] [CrossRef]
- Ma, B.L.; Wu, T.Y.; Tremblay, N.; Deen, W.; Morrison, M.J.; Mclaughlin, N.B.; Gregorich, E.G.; Stewart, G. Nitrous oxide fluxes from corn fields: On-farm assessment of the amount and timing of nitrogen fertilizer. Glob. Chang. Biol. 2010, 16, 156–170. [Google Scholar] [CrossRef]
- Lebender, U.; Senbayram, M.; Lammel, J.; Kuhlmann, H. Impact of mineral N fertilizer application rates on N2O emissions from arable soils under winter wheat. Nutr. Cycl. Agroecosyst. 2014, 100, 111–120. [Google Scholar] [CrossRef]
- Castaldelli, G.; Colombani, N.; Vincenzi, F.; Mastrocicco, M. Linking dissolved organic carbon, acetate and denitrification in agricultural soils. Environ. Earth Sci. 2013, 68, 939–945. [Google Scholar] [CrossRef]
- Colombani, N.; Mastrocicco, M.; Vincenzi, F.; Castaldelli, G. Modeling Soil Nitrate Accumulation and Leaching in Conventional and Conservation Agriculture Cropping Systems. Water 2020, 12, 1571. [Google Scholar] [CrossRef]
- Jahangir, M.M.R.; Fenton, O.; Müller, C.; Harrington, R.; Johnston, P.; Richards, K.G. In situ denitrification and DNRA rates in groundwater beneath an integrated constructed wetland. Water Res. 2017, 111, 254–264. [Google Scholar] [CrossRef]
- Almaraz, M.; Wong, M.Y.; Yang, W.H. Looking back to look ahead: A vision for soil denitrification research. Ecology 2020, 101, e02917. [Google Scholar] [CrossRef] [Green Version]
- Gorski, G.; Dailey, H.; Fisher, A.T.; Schrad, N.; Saltikov, C. Denitrification during infiltration for managed aquifer recharge: Infiltration rate controls and microbial response. Sci. Total Environ. 2020, 727, 138642. [Google Scholar] [CrossRef]
- Watts, S.H.; Seitzinger, S.P. Denitrification rates in organic and mineral soils from riparian sites: A comparison of N2 flux and acetylene inhibition methods. Soil Biol. Biochem. 2000, 32, 1383–1392. [Google Scholar] [CrossRef]
- Pinay, G.; Gumiero, B.; Tabacchi, E.; Gimenez, O.; Tabacchi-Planty, A.M.; Hefting, M.M.; Burt, T.P.; Black, V.A.; Nilsson, C.; Iordache, V.; et al. Patterns of denitrification rates in European alluvial soils under various hydrological regimes. Freshw. Biol. 2007, 52, 252–266. [Google Scholar] [CrossRef]
- Tan, X.; Shao, D.; Gu, W. Effects of temperature and soil moisture on gross nitrification and denitrification rates of a Chinese lowland paddy field soil. Paddy Water Environ. 2018, 16, 687–698. [Google Scholar] [CrossRef]
- Groffman, P.M.; Turner, C.L. Plant productivity and nitrogen gas fluxes in a tallgrass prairie landscape. Landsc. Ecol. 1995, 10, 255–266. [Google Scholar] [CrossRef] [Green Version]
- Li, B.; Chen, J.; Wu, Z.; Wu, S.; Xie, S.; Liu, Y. Seasonal and spatial dynamics of denitrification rate and denitrifier community in constructed wetland treating polluted river water. Int. Biodeterior. Biodegrad. 2018, 126, 143–151. [Google Scholar] [CrossRef]
- Ruz-Jerez, B.E.; White, R.E.; Ball, P.R. Long-term measurement of denitrification in three contrasting pastures grazed by sheep. Soil Biol. Biochem. 1994, 26, 29–39. [Google Scholar] [CrossRef]
- Bragan, R.J.; Starr, J.L.; Parkin, T.B. Shallow Groundwater Denitrification Rate Measurement by Acetylene Block. J. Environ. Qual. 1997, 26, 1531–1538. [Google Scholar] [CrossRef] [Green Version]
- Singh, B.; Ryden, J.C.; Whitehead, D.C. Denitrification potential and actual rates of denitrification in soils under long-term grassland and arable cropping. Soil Biol. Biochem. 1989, 21, 897–901. [Google Scholar] [CrossRef]
- Elmi, A.A.; Madramootoo, C.; Hamel, C. Influence of water table and nitrogen management on residual soil NO3− and denitrification rate under corn production in sandy loam soil in Quebec. Agric. Ecosyst. Environ. 2000, 79, 187–197. [Google Scholar] [CrossRef]
- van Beek, C.L.; Hummelink, E.W.J.; Velthof, G.L.; Oenema, O. Denitrification rates in relation to groundwater level in a peat soil under grassland. Biol. Fertil. Soils 2004, 39, 329–336. [Google Scholar] [CrossRef]
- Barton, L.; McLay, C.D.A.; Schipper, L.A.; Smith, C.T. Denitrification Rates in a Wastewater-Irrigated Forest Soil in New Zealand. J. Environ. Qual. 1999, 28, 2008–2014. [Google Scholar] [CrossRef]
- Mohn, J.; Schürmann, A.; Hagedorn, F.; Schleppi, P.; Bachofen, R. Increased rates of denitrification in nitrogen-treated forest soils. For. Ecol. Manag. 2000, 137, 113–119. [Google Scholar] [CrossRef]
- Keuskamp, J.A.; van Drecht, G.; Bouwman, A.F. European-scale modelling of groundwater denitrification and associated N2O production. Environ. Pollut. 2012, 165, 67–76. [Google Scholar] [CrossRef]
- Estavillo, J.M.; Rodriguez, M.; Domingo, M.; Munoz-Rueda, A.; Gonzalez-Murua, C. Denitrification losses from a natural grassland in the Basque Country under organic and inorganic fertilization. Plant Soil 1994, 162, 19–29. [Google Scholar] [CrossRef]
- Ryden, J.C.; Lund, L.J. Nature and Extent of Directly Measured Denitrification Losses from Some Irrigated Vegetable Crop Production Units. Soil Sci. Soc. Am. J. 1980, 44, 505–511. [Google Scholar] [CrossRef]
- Ledgard, S.F.; Penno, J.W.; Sprosen, M.S. Nitrogen balances and losses on intensive dairy farms. Proc. N. Z. Grassl. Assoc. 1997, 49–53. [Google Scholar] [CrossRef]
- Schwarz, L.; Kapp, M.; Benckiser, G.; Ottow, J.C.G. Evaluation of denitrification losses by the acetylene inhibition technique in a permanent ryegrass field (Lolium perenne L.) fertilized with animal slurry or ammonium nitrate. Biol. Fertil. Soils 1994, 18, 327–333. [Google Scholar] [CrossRef]
- De Klein, C.A.M.; Van Logtestijn, R.S.P. Denitrification in the top soil of managed grasslands in The Netherlands in relation to soil type and fertilizer level. Plant Soil 1994, 163, 33–44. [Google Scholar] [CrossRef]
- Schnabel, R.R.; Stout, W.L. Denitrification Loss from Two Pennsylvania Floodplain Soils. J. Environ. Qual. 1994, 23, 344–348. [Google Scholar] [CrossRef]
- Aulakh, M.S.; Rennie, D.A.; Paul, E.A. The Influence of Plant Residues on Denitrification Rates in Conventional and Zero Tilled Soils. Soil Sci. Soc. Am. J. 1984, 48, 790–794. [Google Scholar] [CrossRef] [Green Version]
- Myrold, D.D. Denitrification in Ryegrass and Winter Wheat Cropping Systems of Western Oregon. Soil Sci. Soc. Am. J. 1988, 52, 412–416. [Google Scholar] [CrossRef]
- Aller, L.; Bennet, T.; Lehr, J.H.; Petty, R.J.; Hackett, G. DRASTIC: A Standardized System for Evaluating Ground-Water Pollution Potential Using Hydrogeologic Settings; U.S. Environmental Protection Agency: Washington, DC, USA, 1987.
- Foster, S.S.D. Fundamental concepts in aquifer vulnerability, pollution risk and protection strategy. In Vulnerability of Soil and Groundwater to Pollutants; Van Duijvenbooden, W., Van Waegeningh, H.G., Eds.; Committee on Hydrological Research: The Hague, The Netherlands, 1987; pp. 69–86. [Google Scholar]
- Stempvoort, D.V.; Ewert, L.; Wassenaar, L. Aquifer Vulnerability Index: A Gis-Compatible Method For Groundwater Vulnerability Mapping. Can. Water Resour. J. 1993, 18, 25–37. [Google Scholar] [CrossRef] [Green Version]
- Doerfliger, N.; Jeannin, P.-Y.; Zwahlen, F. Water vulnerability assessment in karst environments: A new method of defining protection areas using a multi-attribute approach and GIS tools (EPIK method). Environ. Geol. 1999, 39, 165–176. [Google Scholar] [CrossRef] [Green Version]
- Civita, M.; De Maio, M. Assessing and mapping groundwater vulnerability to contamination: The Italian “combined” approach. Geofis. Int. 2004, 43, 513–532. [Google Scholar] [CrossRef] [Green Version]
- Moore, P.; John, S. SEEPAGE: A System for Early Evaluation of the Pollution Potential of Agricultural Groundwater Environments; Geology Technical Note; USDA, SCS, Northeast Technical Center: Chester, PA, USA, 1990.
- Ouedraogo, I.; Defourny, P.; Vanclooster, M. Mapping the groundwater vulnerability for pollution at the pan African scale. Sci. Total Environ. 2016, 544, 939–953. [Google Scholar] [CrossRef]
- Fakhri, M.S.; Moghaddam, A.A.; Najib, M.; Barzegar, R. Investigation on nitrate concentrations in groundwater resources of marand plain and groundwater vulnerability assessment using AVI and GODS methods. J. Environ. Stud. 2015, 41, 49–66. [Google Scholar]
- Hamza, S.M.; Ahsan, A.; Imteaz, M.A.; Rahman, A.; Mohammad, T.A.; Ghazali, A.H. Accomplishment and subjectivity of GIS-based DRASTIC groundwater vulnerability assessment method: A review. Environ. Earth Sci. 2015, 73, 3063–3076. [Google Scholar] [CrossRef]
- Shrestha, S.; Kafle, R.; Pandey, V.P. Evaluation of index-overlay methods for groundwater vulnerability and risk assessment in Kathmandu Valley, Nepal. Sci. Total Environ. 2017, 575, 779–790. [Google Scholar] [CrossRef] [PubMed]
- Busico, G.; Cuoco, E.; Sirna, M.; Mastrocicco, M.; Tedesco, D. Aquifer vulnerability and potential risk assessment: Application to an intensely cultivated and densely populated area in Southern Italy. Arab. J. Geosci. 2017, 10, 222. [Google Scholar] [CrossRef]
- Hu, M.; Peñuelas, J.; Sardans, J.; Huang, J.; Xu, K.; Tong, C. Denitrification rates in tidal marsh soils: The roles of soil texture, salinity and nitrogen enrichment. Eur. J. Soil Sci. 2021, 72, 474–479. [Google Scholar] [CrossRef]
- Palta, M.M.; Ehrenfeld, J.G.; Giménez, D.; Groffman, P.M.; Subroy, V. Soil texture and water retention as spatial predictors of denitrification in urban wetlands. Soil Biol. Biochem. 2016, 101, 237–250. [Google Scholar] [CrossRef]
- Navulur, K.C.S.; Engel, B.A. Groundwater vulnerability assessment to non-point source nitrate pollution on a regional scale using gis. Trans. ASAE 1998, 41, 1671–1678. [Google Scholar] [CrossRef]
- Jang, W.; Engel, B.; Harbor, J.; Theller, L. Aquifer Vulnerability Assessment for Sustainable Groundwater Management Using DRASTIC. Water 2017, 9, 792. [Google Scholar] [CrossRef] [Green Version]
- Pacheco, F.A.L.; Sanches Fernandes, L.F. The multivariate statistical structure of DRASTIC model. J. Hydrol. 2013, 476, 442–459. [Google Scholar] [CrossRef]
- Garewal, S.K.; Vasudeo, A.D.; Ghare, A.D. Optimization of the GIS-Based DRASTIC Model for Groundwater Vulnerability Assessment. In Nature-Inspired Methods for Metaheuristics Optimization; Springer: Berlin/Heidelberg, Germany, 2020; pp. 489–502. [Google Scholar] [CrossRef]
- Asefi, M.; Radmanesh, F.; Zarei, H. Optimization of DRASTIC and SINTACS models according to geographical information system with the use of Analytical Hierarchy Process (AHP) (Case study: Andimeshk Plain). J. Environ. Stud. 2014, 40, 79–94. [Google Scholar] [CrossRef]
- Goudarzi, S.; Jozi, S.A.; Monavari, S.M.; Karbasi, A.; Hasani, A.H. Assessment of groundwater vulnerability to nitrate pollution caused by agricultural practices. Water Qual. Res. J. 2017, 52, 64–77. [Google Scholar] [CrossRef]
- Sullivan, T.P.; Gao, Y. Development of a new P3 (Probability, Protection, and Precipitation) method for vulnerability, hazard, and risk intensity index assessments in karst watersheds. J. Hydrol. 2017, 549, 428–451. [Google Scholar] [CrossRef]
- Padovani, L.; Trevisan, M. I nitrati di origine agricola nelle acque sotterranee [Nitrates of agricultural origin in groundwater]. Quad. Tecnic. Prot. Ambient. 2002, 75, 120. [Google Scholar]
- Palma, R.M.; Rímolo, M.; Saubidet, M.I.; Conti, M.E. Influence of tillage system on denitrification in maize-cropped soils. Biol. Fertil. Soils 1997, 25, 142–146. [Google Scholar] [CrossRef]
- Wang, J.; Zou, J. No-till increases soil denitrification via its positive effects on the activity and abundance of the denitrifying community. Soil Biol. Biochem. 2020, 142, 107706. [Google Scholar] [CrossRef]
- Capri, E.; Civita, M.; Corniello, A.; Cusimano, G.; De Maio, M.; Ducci, D.; Fait, G.; Fiorucci, A.; Hauser, S.; Pisciotta, A.; et al. Assessment of nitrate contamination risk: The Italian experience. J. Geochem. Explor. 2009, 102, 71–86. [Google Scholar] [CrossRef] [Green Version]
- Rizeei, H.M.; Azeez, O.S.; Pradhan, B.; Khamees, H.H. Assessment of groundwater nitrate contamination hazard in a semi-arid region by using integrated parametric IPNOA and data-driven logistic regression models. Environ. Monit. Assess. 2018, 190, 633. [Google Scholar] [CrossRef]
- Kazemi, E.; Karyab, H.; Emamjome, M.-M. Optimization of interpolation method for nitrate pollution in groundwater and assessing vulnerability with IPNOA and IPNOC method in Qazvin plain. J. Environ. Health Sci. Eng. 2017, 15, 23. [Google Scholar] [CrossRef] [PubMed] [Green Version]
- Ghiglieri, G.; Barbieri, G.; Vernier, A.; Carletti, A.; Demurtas, N.; Pinna, R.; Pittalis, D. Potential risks of nitrate pollution in aquifers from agricultural practices in the Nurra region, northwestern Sardinia, Italy. J. Hydrol. 2009, 379, 339–350. [Google Scholar] [CrossRef]
- Pisciotta, A.; Cusimano, G.; Favara, R. Groundwater nitrate risk assessment using intrinsic vulnerability methods: A comparative study of environmental impact by intensive farming in the Mediterranean region of Sicily, Italy. J. Geochem. Explor. 2015, 156, 89–100. [Google Scholar] [CrossRef]
- Watson, C.A.; Bengtsson, H.; Ebbesvik, M.; Løes, A.-K.; Myrbeck, A.; Salomon, E.; Schroder, J.; Stockdale, E.A. A review of farm-scale nutrient budgets for organic farms as a tool for management of soil fertility. Soil Use Manag. 2006, 18, 264–273. [Google Scholar] [CrossRef] [Green Version]
- Gentry, L.E.; David, M.B.; Below, F.E.; Royer, T.V.; McIsaac, G.F. Nitrogen Mass Balance of a Tile-drained Agricultural Watershed in East-Central Illinois. J. Environ. Qual. 2009, 38, 1841–1847. [Google Scholar] [CrossRef] [PubMed] [Green Version]
- Pinardi, M.; Soana, E.; Laini, A.; Bresciani, M.; Bartoli, M. Soil system budgets of N, Si and P in an agricultural irrigated watershed: Surplus, differential export and underlying mechanisms. Biogeochemistry 2018, 140, 175–197. [Google Scholar] [CrossRef]
- Castaldelli, G.; Vincenzi, F.; Fano, E.A.; Soana, E. In Search for the Missing Nitrogen: Closing the Budget to Assess the Role of Denitrification in Agricultural Watersheds. Appl. Sci. 2020, 10, 2136. [Google Scholar] [CrossRef] [Green Version]
- Cameira, M.R.; Rolim, J.; Valente, F.; Faro, A.; Dragosits, U.; Cordovil, C.M.d.S. Spatial distribution and uncertainties of nitrogen budgets for agriculture in the Tagus river basin in Portugal—Implications for effectiveness of mitigation measures. Land Use Policy 2019, 84, 278–293. [Google Scholar] [CrossRef]
- Serra, J.; Cordovil, C.M.d.S.; Cruz, S.; Cameira, M.R.; Hutchings, N.J. Challenges and solutions in identifying agricultural pollution hotspots using gross nitrogen balances. Agric. Ecosyst. Environ. 2019, 283, 106568. [Google Scholar] [CrossRef]
- Serra, J.; Cameira, M.d.R.; Cordovil, C.M.d.S.; Hutchings, N.J. Development of a groundwater contamination index based on the agricultural hazard and aquifer vulnerability: Application to Portugal. Sci. Total Environ. 2021, 772, 145032. [Google Scholar] [CrossRef] [PubMed]
- He, W.; Jiang, R.; He, P.; Yang, J.; Zhou, W.; Ma, J.; Liu, Y. Estimating soil nitrogen balance at regional scale in China’s croplands from 1984 to 2014. Agric. Syst. 2018, 167, 125–135. [Google Scholar] [CrossRef]
- Leip, A.; Britz, W.; Weiss, F.; de Vries, W. Farm, land, and soil nitrogen budgets for agriculture in Europe calculated with CAPRI. Environ. Pollut. 2011, 159, 3243–3253. [Google Scholar] [CrossRef]
- Rebolledo, B.; Gil, A.; Flotats, X.; Sánchez, J.Á. Assessment of groundwater vulnerability to nitrates from agricultural sources using a GIS-compatible logic multicriteria model. J. Environ. Manag. 2016, 171, 70–80. [Google Scholar] [CrossRef] [PubMed] [Green Version]
- Arauzo, M.; García, G.; Valladolid, M. Assessment of the risks of N–loss to groundwater from data on N–balance surplus in Spanish crops: An empirical basis to identify Nitrate Vulnerable Zones. Sci. Total Environ. 2019, 696, 133713. [Google Scholar] [CrossRef] [PubMed]
- Cameira, M.d.R.; Rolim, J.; Valente, F.; Mesquita, M.; Dragosits, U.; Cordovil, C.M.d.S. Translating the agricultural N surplus hazard into groundwater pollution risk: Implications for effectiveness of mitigation measures in nitrate vulnerable zones. Agric. Ecosyst. Environ. 2021, 306, 107204. [Google Scholar] [CrossRef]
- Busico, G.; Mastrocicco, M.; Cuoco, E.; Sirna, M.; Tedesco, D. Protection from natural and anthropogenic sources: A new rating methodology to delineate “Nitrate Vulnerable Zones”. Environ. Earth Sci. 2019, 78, 104. [Google Scholar] [CrossRef]
- Bannenberg, M.; Ntona, M.M.; Busico, G.; Kalaitzidou, K.; Mitrakas, M.; Vargemezis, G.; Fikos, I.; Kazakis, N.; Voudouris, K. Hydrogeological and Hydrochemical Regime Evaluation in Flamouria Basin in Edessa (Northern Greece). Environments 2020, 7, 105. [Google Scholar] [CrossRef]
- Morari, F.; Lugato, E.; Polese, R.; Berti, A.; Giardini, L. Nitrate concentrations in groundwater under contrasting agricultural management practices in the low plains of Italy. Agric. Ecosyst. Environ. 2012, 147, 47–56. [Google Scholar] [CrossRef]
- Masetti, M.; Poli, S.; Sterlacchini, S. The Use of the Weights-of-Evidence Modeling Technique to Estimate the Vulnerability of Groundwater to Nitrate Contamination. Nat. Resour. Res. 2007, 16, 109–119. [Google Scholar] [CrossRef]
- Tesoriero, A.J.; Voss, F.D. Predicting the Probability of Elevated Nitrate Concentrations in the Puget Sound Basin: Implications for Aquifer Susceptibility and Vulnerability. Ground Water 1997, 35, 1029–1039. [Google Scholar] [CrossRef]
- Steichen, J.; Koelliker, J.; Grosh, D.; Heiman, A.; Yearout, R.; Robbins, V. Contamination of Farmstead Wells by Pesticides, Volatile Organics, and Inorganic Chemicals in Kansas. Groundw. Monit. Remediat. 1988, 8, 153–160. [Google Scholar] [CrossRef]
- Chica-Olmo, M.; Luque-Espinar, J.A.; Rodriguez-Galiano, V.; Pardo-Igúzquiza, E.; Chica-Rivas, L. Categorical Indicator Kriging for assessing the risk of groundwater nitrate pollution: The case of Vega de Granada aquifer (SE Spain). Sci. Total Environ. 2014, 470–471, 229–239. [Google Scholar] [CrossRef] [PubMed]
- Nolan, B.T.; Hitt, K.J. Vulnerability of Shallow Groundwater and Drinking-Water Wells to Nitrate in the United States. Environ. Sci. Technol. 2006, 40, 7834–7840. [Google Scholar] [CrossRef] [PubMed]
- Nolan, B.T.; Gronberg, J.M.; Faunt, C.C.; Eberts, S.M.; Belitz, K. Modeling Nitrate at Domestic and Public-Supply Well Depths in the Central Valley, California. Environ. Sci. Technol. 2014, 48, 5643–5651. [Google Scholar] [CrossRef]
- Gurdak, J.J.; Qi, S.L. Vulnerability of Recently Recharged Groundwater in Principle Aquifers of the United States To Nitrate Contamination. Environ. Sci. Technol. 2012, 46, 6004–6012. [Google Scholar] [CrossRef] [PubMed]
- Sorichetta, A.; Ballabio, C.; Masetti, M.; Robinson, G.R.; Sterlacchini, S. A Comparison of Data-Driven Groundwater Vulnerability Assessment Methods. Groundwater 2013, 51, 866–879. [Google Scholar] [CrossRef]
- Rodriguez-Galiano, V.; Mendes, M.P.; Garcia-Soldado, M.J.; Chica-Olmo, M.; Ribeiro, L. Predictive modeling of groundwater nitrate pollution using Random Forest and multisource variables related to intrinsic and specific vulnerability: A case study in an agricultural setting (Southern Spain). Sci. Total Environ. 2014, 476–477, 189–206. [Google Scholar] [CrossRef]
- Jang, C.-S.; Chen, S.-K. Integrating indicator-based geostatistical estimation and aquifer vulnerability of nitrate-N for establishing groundwater protection zones. J. Hydrol. 2015, 523, 441–451. [Google Scholar] [CrossRef]
- Gurdak, J.J.; Geyer, G.E.; Nanus, L.; Taniguchi, M.; Corona, C.R. Scale dependence of controls on groundwater vulnerability in the water–energy–food nexus, California Coastal Basin aquifer system. J. Hydrol. Reg. Stud. 2017, 11, 126–138. [Google Scholar] [CrossRef] [Green Version]
- Hagedorn, B.; Clarke, N.; Ruane, M.; Faulkner, K. Assessing aquifer vulnerability from lumped parameter modeling of modern water proportions in groundwater mixtures: Application to California’s South Coast Range. Sci. Total Environ. 2018, 624, 1550–1560. [Google Scholar] [CrossRef] [PubMed]
- Mair, A.; El-Kadi, A.I. Logistic regression modeling to assess groundwater vulnerability to contamination in Hawaii, USA. J. Contam. Hydrol. 2013, 153, 1–23. [Google Scholar] [CrossRef] [PubMed]
- Boy-Roura, M.; Nolan, B.T.; Menció, A.; Mas-Pla, J. Regression model for aquifer vulnerability assessment of nitrate pollution in the Osona region (NE Spain). J. Hydrol. 2013, 505, 150–162. [Google Scholar] [CrossRef]
- Leonard, R.A.; Knisel, W.G.; Still, D.A. GLEAMS: Groundwater Loading Effects of Agricultural Management Systems. Trans. ASAE 1987, 30, 1403–1418. [Google Scholar] [CrossRef]
- Voss, C.I. A Finite Element Simulation Model for Saturated-Unsaturated Fluid Density-Dependent Groundwater Flow with Energy Transport or Chemically Reactive Single-Species Solute Transport; U.S. Geological Survey: Reston, VA, USA, 1984. [CrossRef]
- Harbaugh, A.W. MODFLOW-2005, the US Geological Survey Modular Ground-Water Model—The Groundwater Flow Process; Book 6; U.S. Geological Survey: Reston, VA, USA, 2005.
- Zheng, C.; Wang, P.P. MT3DMS: A Modular Three-Dimensional Multispecies Transport Model for Simulation of Advection, Dispersion, and Chemical Reactions of Contaminants in Groundwater Systems; Documentation and User’s Guide; Contract Report SERDP-99-1; U.S. Army Engineer Research and Development Center: Vicksburg, MS, USA, 1999.
- Diersch, H.J.G. FEFLOW: Finite Element Modeling of Flow, Mass and Heat Transport in Porous and Fractured Media; Springer: Berlin/Heidelberg, Germany, 2013. [Google Scholar] [CrossRef]
- Appelo, C.A.J.; Rolle, M. PHT3D: A Reactive Multicomponent Transport Model for Saturated Porous Media. Ground Water 2010, 48, 627–632. [Google Scholar] [CrossRef]
- Šimůnek, J.; Šejna, M.; van Genuchten, M.T. The HYDRUS-1D Software Package for Simulating the One-Dimensional Movement of Water, Heat, and Multiple Solutes in Variably-Saturated Media; University of California: Riverside, CA, USA, 2005; p. 240. [Google Scholar]
- Šejna, M.; Šimůnek, J.; van Genuchten, M. The HYDRUS Software Package for Simulating Two- and Three-Dimensional Movement of Water, Heat, and Multiple Solutes in Variably-Saturated Media; User Manual, Version 3.01; PC-Progress: Prague, Czech Republic, 2018; p. 322. [Google Scholar]
- Arnold, J.G.; Moriasi, D.N.; Gassman, P.W.; Abbaspour, K.C.; White, M.J.; Srinivasan, R.; Santhi, C.; Harmel, R.D.; van Griensven, A.; Van Liew, M.W.; et al. SWAT: Model Use, Calibration, and Validation. Trans. ASABE 2012, 55, 1491–1508. [Google Scholar] [CrossRef]
- Prommer, H.; Barry, D.A.; Zheng, C. MODFLOW/MT3DMS-Based Reactive Multicomponent Transport Modeling. Ground Water 2003, 41, 247–257. [Google Scholar] [CrossRef]
- Lim, J.-W.; Bae, G.-O.; Lee, K.-K. Groundwater vulnerability assessment by determining maximum contaminant loading limit in the vicinity of pumping wells. Geosci. J. 2009, 13, 79–85. [Google Scholar] [CrossRef]
- Almasri, M.N.; Kaluarachchi, J.J. Modeling nitrate contamination of groundwater in agricultural watersheds. J. Hydrol. 2007, 343, 211–229. [Google Scholar] [CrossRef]
- Conan, C.; Bouraoui, F.; Turpin, N.; de Marsily, G.; Bidoglio, G. Modeling Flow and Nitrate Fate at Catchment Scale in Brittany (France). J. Environ. Qual. 2003, 32, 2026–2032. [Google Scholar] [CrossRef]
- Ameur, M.; Aouiti, S.; Hamzaoui-Azaza, F.; Cheikha, L.B.; Gueddari, M. Vulnerability assessment, transport modeling and simulation of nitrate in groundwater using SI method and modflow-MT3DMS software: Case of Sminja aquifer, Tunisia. Environ. Earth Sci. 2021, 80, 220. [Google Scholar] [CrossRef]
- Uhan, J.; Vižintin, G.; Pezdič, J. Groundwater nitrate vulnerability assessment in alluvial aquifer using process-based models and weights-of-evidence method: Lower Savinja Valley case study (Slovenia). Environ. Earth Sci. 2011, 64, 97–105. [Google Scholar] [CrossRef]
- Cui, C.; Zhou, W.; Geza, M. GIS-based nitrogen removal model for assessing Florida’s surficial aquifer vulnerability. Environ. Earth Sci. 2016, 75, 526. [Google Scholar] [CrossRef]
- Hansen, B.; Sonnenborg, T.O.; Møller, I.; Bernth, J.D.; Høyer, A.-S.; Rasmussen, P.; Sandersen, P.B.E.; Jørgensen, F. Nitrate vulnerability assessment of aquifers. Environ. Earth Sci. 2016, 75, 999. [Google Scholar] [CrossRef] [Green Version]
- Huan, H.; Wang, J.; Lai, D.; Teng, Y.; Zhai, Y. Assessment of well vulnerability for groundwater source protection based on a solute transport model: A case study from Jilin City, northeast China. Hydrogeol. J. 2015, 23, 581–596. [Google Scholar] [CrossRef]
- Huan, H.; Wang, J.; Zhai, Y.; Xi, B.; Li, J.; Li, M. Quantitative evaluation of specific vulnerability to nitrate for groundwater resource protection based on process-based simulation model. Sci. Total Environ. 2016, 550, 768–784. [Google Scholar] [CrossRef] [PubMed]
- Huan, H.; Hu, L.; Yang, Y.; Jia, Y.; Lian, X.; Ma, X.; Jiang, Y.; Xi, B. Groundwater nitrate pollution risk assessment of the groundwater source field based on the integrated numerical simulations in the unsaturated zone and saturated aquifer. Environ. Int. 2020, 137, 105532. [Google Scholar] [CrossRef] [PubMed]
- Aschonitis, V.G.; Salemi, E.; Colombani, N.; Castaldelli, G.; Mastrocicco, M. Formulation of Indices to Describe Intrinsic Nitrogen Transformation Rates for the Implementation of Best Management Practices in Agricultural Lands. Water Air Soil Pollut. 2013, 224, 1489. [Google Scholar] [CrossRef]
- Aschonitis, V.G.; Mastrocicco, M.; Colombani, N.; Salemi, E.; Kazakis, N.; Voudouris, K.; Castaldelli, G. Assessment of the Intrinsic Vulnerability of Agricultural Land to Water and Nitrogen Losses via Deterministic Approach and Regression Analysis. Water Air Soil Pollut. 2012, 223, 1605–1614. [Google Scholar] [CrossRef]
- Kazakis, N.; Voudouris, K.S. Groundwater vulnerability and pollution risk assessment of porous aquifers to nitrate: Modifying the DRASTIC method using quantitative parameters. J. Hydrol. 2015, 525, 13–25. [Google Scholar] [CrossRef]
- Huan, H.; Wang, J.; Teng, Y. Assessment and validation of groundwater vulnerability to nitrate based on a modified DRASTIC model: A case study in Jilin City of northeast China. Sci. Total Environ. 2012, 440, 14–23. [Google Scholar] [CrossRef]
- Busico, G.; Kazakis, N.; Colombani, N.; Mastrocicco, M.; Voudouris, K.; Tedesco, D. A modified SINTACS method for groundwater vulnerability and pollution risk assessment in highly anthropized regions based on NO3− and SO42− concentrations. Sci. Total Environ. 2017, 609, 1512–1523. [Google Scholar] [CrossRef]
- Busico, G.; Kazakis, N.; Cuoco, E.; Colombani, N.; Tedesco, D.; Voudouris, K.; Mastrocicco, M. A novel hybrid method of specific vulnerability to anthropogenic pollution using multivariate statistical and regression analyses. Water Res. 2020, 171, 115386. [Google Scholar] [CrossRef] [PubMed]
- Jia, Z.; Bian, J.; Wang, Y.; Wan, H.; Sun, X.; Li, Q. Assessment and validation of groundwater vulnerability to nitrate in porous aquifers based on a DRASTIC method modified by projection pursuit dynamic clustering model. J. Contam. Hydrol. 2019, 226, 103522. [Google Scholar] [CrossRef] [PubMed]
- Zhang, Y.; Zhang, S.; Liu, C.L.; Hou, H.B.; Dong, H.; Zhang, M. Prospect of capability of aeration zone in soil in prevention nitrogen from pollution of groundwater. J. Agro-Environ. Sci. 2006, 25, 339–346. [Google Scholar]
- Leifeld, J.; Kögel-Knabner, I. Soil organic matter fractions as early indicators for carbon stock changes under different land-use? Geoderma 2005, 124, 143–155. [Google Scholar] [CrossRef]
- Voutchkova, D.D.; Schullehner, J.; Rasmussen, P.; Hansen, B. A high-resolution nitrate vulnerability assessment of sandy aquifers (DRASTIC-N). J. Environ. Manag. 2021, 277, 111330. [Google Scholar] [CrossRef]
- Juncher Jørgensen, C.; Jacobsen, O.S.; Elberling, B.; Aamand, J. Microbial Oxidation of Pyrite Coupled to Nitrate Reduction in Anoxic Groundwater Sediment. Environ. Sci. Technol. 2009, 43, 4851–4857. [Google Scholar] [CrossRef]
- Bigi, V.; Pezzoli, A.; Comino, E.; Rosso, M. A Vulnerability Assessment in Scant Data Context: The Case of North Horr Sub-County. Sustainability 2020, 12, 6024. [Google Scholar] [CrossRef]
- Field, C.B.; Barros, V.R.; Dokken, D.J.; Mach, K.J.; Mastrandrea, M.D.; Bilir, T.E.; Chatterjee, M.; Yuka, K.L.E.; Estrada, O.; Genova, R.C.; et al. Climate Change 2014 Impacts, Adaptation, and Vulnerability Part A: Global and Sectoral Aspects Working Group II Contribution to the Fifth Assessment Report of the Intergovernmental Panel on Climate Change; Cambridge University Press: New York, NY, USA, 2014; ISBN 978-1-107-05807-1. [Google Scholar]
- Cardona, O.-D.; van Aalst, M.K.; Birkmann, J.; Fordham, M.; McGregor, G.; Perez, R.; Pulwarty, R.S.; Lisa Schipper, E.F.; Tan Sinh, B.; Décamps, H.; et al. Determinants of risk: Exposure and vulnerability. In Managing the Risks of Extreme Events and Disasters to Advance Climate Change Adaptation; Cambridge University Press: Cambridge, UK; New York, NY, USA, 2012. [Google Scholar]
- U.S. Environmental Protection Agency. Risk Assessment Guidance for Superfund. Volume 1: Human Health Evaluation Manual; U.S. EPA: Washington, DC, USA, 1989.
- Hancock, P.J.; Boulton, A.J.; Humphreys, W.F. Aquifers and hyporheic zones: Towards an ecological understanding of groundwater. Hydrogeol. J. 2005, 13, 98–111. [Google Scholar] [CrossRef]
- Erostate, M.; Huneau, F.; Garel, E.; Ghiotti, S.; Vystavna, Y.; Garrido, M.; Pasqualini, V. Groundwater dependent ecosystems in coastal Mediterranean regions: Characterization, challenges and management for their protection. Water Res. 2020, 172, 115461. [Google Scholar] [CrossRef] [PubMed]


| Land Use and Location | Rate (Kg-N/ha/Year) | Type of Matrix | Reference | |
|---|---|---|---|---|
| LABORATORY | Drainage Basin, California | 0–3600 | Sand | [55] |
| Agricultural field, Georgia | 12–300 | Organic soil | [56] | |
| Forest, Georgia | 43–159 | Clay | [56] | |
| Grassland, Europe | 0–2190 | Clay Loam | [57] | |
| Rice, China | 6–119 | Silty Clay Loam | [58] | |
| Tallgrass prairie, USA | 6.2 | Silty Clay | [59] | |
| Wetland, China | 0.5–135 | Various | [60] | |
| FIELD | Agricultural field, Germany | 10–150 | Loam | [40] |
| Grass–clover, New Zealand | 3.4 | Fine Sandy Loam | [61] | |
| Herbal ley, New Zealand | 4.4 | Fine Sandy Loam | [61] | |
| Fertilized grass, New Zealand | 19.3 | Fine Sandy Loam | [61] | |
| Agricultural field, Maryland | 0.8 | Silty loam | [62] | |
| Agricultural field, England | 73–547 | Sandy loam | [63] | |
| Corn, Canada | 13.5 | Sandy loam | [64] | |
| Farm, Netherlands | 56–120 | Peat | [65] | |
| Forest, Maryland | 1.5 | Silty loam | [62] | |
| Forest, Globe | 0–239 | Various | [66] | |
| Forest, Swiss | 2–3 | Clay | [67] | |
| Grassland, Europe | 20–400 | Various | [68] | |
| Grassland, Maryland | 1.4 | Silty loam | [62] | |
| Grassland, Spain | 3–37 | Clay Loam | [69] | |
| Grassland, The Netherlands | 100–120 | Peat | [65] | |
| Horticultural field, USA | 95–233 | Sandy loam | [70] | |
| Pasture, New Zealand | 5–25 | Silty loam | [71] | |
| Ryegrass, Germany | 0.2–3.1 | Sandy loam | [72] | |
| Ryegrass, Netherlands | 3–25 | Various | [73] | |
| Ryegrass, USA | 2–110 | Loam | [74] | |
| Wheat, Canada | 3.2–22.5 | Clay Loam | [75] | |
| Wheat, USA | 0.7–1.7 | Silty loam | [76] |
Publisher’s Note: MDPI stays neutral with regard to jurisdictional claims in published maps and institutional affiliations. |
© 2021 by the authors. Licensee MDPI, Basel, Switzerland. This article is an open access article distributed under the terms and conditions of the Creative Commons Attribution (CC BY) license (https://creativecommons.org/licenses/by/4.0/).
Share and Cite
Busico, G.; Alessandrino, L.; Mastrocicco, M. Denitrification in Intrinsic and Specific Groundwater Vulnerability Assessment: A Review. Appl. Sci. 2021, 11, 10657. https://doi.org/10.3390/app112210657
Busico G, Alessandrino L, Mastrocicco M. Denitrification in Intrinsic and Specific Groundwater Vulnerability Assessment: A Review. Applied Sciences. 2021; 11(22):10657. https://doi.org/10.3390/app112210657
Chicago/Turabian StyleBusico, Gianluigi, Luigi Alessandrino, and Micòl Mastrocicco. 2021. "Denitrification in Intrinsic and Specific Groundwater Vulnerability Assessment: A Review" Applied Sciences 11, no. 22: 10657. https://doi.org/10.3390/app112210657
APA StyleBusico, G., Alessandrino, L., & Mastrocicco, M. (2021). Denitrification in Intrinsic and Specific Groundwater Vulnerability Assessment: A Review. Applied Sciences, 11(22), 10657. https://doi.org/10.3390/app112210657