Article

Phytomanagement of a Trace Element-Contaminated Site to Produce a Natural Dye: First Screening of an Emerging Biomass Valorization Chain

1
Department of Green Chemistry and Technology, Ghent University, 9000 Ghent, Belgium
2
Clean Technologies and Circular Economy, INERIS, Parc Technologique Alata, BP2, 60550 Verneuil-en-Halatte, France
3
Analytical Methods and Developments for the Environment, INERIS, Parc Technologique Alata, BP2, 60550 Verneuil-en-Halatte, France
4
Centre of Expertise on Sustainable Chemistry, Karel de Grote University of Applied Sciences and Arts, 2660 Hoboken, Belgium
*
Author to whom correspondence should be addressed.
Appl. Sci. 2021, 11(22), 10613; https://doi.org/10.3390/app112210613
Submission received: 22 September 2021 / Revised: 3 November 2021 / Accepted: 7 November 2021 / Published: 11 November 2021
(This article belongs to the Section Environmental Sciences)

Abstract

:
The study of different possible biomass valorization routes is crucial in order to diversify phytomanagement options, allowing the landowner/stakeholder to choose the best option based on site characteristics and the benefits of local value chains. In the current study, field and laboratory experiments were conducted to assess the suitabilitity of Malva sylvestris L. for the phytoattenuation of a dredged sediment disposal site contaminated with trace elements (trace element (Cd, Cu, Pb, and Zn). The selected crop was Malva sylvestris, a flowering plant from which a colourant can be extracted to be used in dying of textiles as a way to valorize the produced biomass grown on this contaminated land. Under the conditions of the investigated site, the analysis of TE in the sediment and the biomass matrix showed no effect of M. sylvestris on the sediment TE contamination mobility with an excluder phenotype (Bioconcentration factor < 1). Metal concentrations were found to be the highest in the leaves followed by in the stem and flower. The dye extract obtained from the flower part of M. sylvestris permitted the silk alum-pretreated fabric to be dyed yellow, and the TE concentration in the dyed textile fabrics respected the threshold values set by OEKO-Tex standard 100.

1. Introduction

Marginal lands can be characterized as soils that are unsuitable for conventional utilization purposes due to several causes, with contamination or soil fertility problems being the most common causes [1,2]. When conventional management techniques are not applicable and when land-use options are limited, e.g., contaminated land with a large area and a high environmental cost for soil treatment with chemical methods, phytomanagement can be a promising solution.
Phytomanagement is based on the choice of the best-adapted phytotechnology to reduce the risks that are caused due to the presence of pollutants combined with a strategy to value the land, with one way being to valorize the plant biomass produced on the contaminated land [3,4,5,6,7]. When the land marginality is due to trace element (TE) contamination, various phytotechnology strategies using certain species of plants can be applied on the site to manage environmental and health risks: phytoextraction or phytostabilization [8]. Phytoextraction can be defined as a technique that permits partial clean-up through the uptake of the bioavailable TE fraction in the soil. Soil clean-up is performed by repeating the export of TE-enriched plant biomass. This TE removal can be achieved by using hyperaccumulator species (e.g., Arabidopsis halleri L.) that contain high TE concentrations in their biomass or crops with a high biomass yield and lower TE concentration (e.g., Salix viminalis L.) [3,7]. Nonetheless, the applicability of phytoextraction can be limited by several reasons, such as multi-TE contamination and a significant time being required to achieve remediation [7]. In contrast, phytostabilization consists of the use of plant species with an excluder phenotype, i.e., a plant with a bioconcentration factor < 1, to limit the TE transfer between the soil and the aboveground part of the plant. In addition, such a plant can decrease the TE mobility in the soil through the effects of the root system [4,7,9]. In this way, the aim of phytostabilization is not to clean the pollution from the soil but to confine it by controlling the TE transfer pathways. Annual herbaceous plants can be used as phytomanagement tools to manage TE in contaminated soils, but studies to date have mainly focused on species of negligible economic value. The combination of a more gradual improvement of soil quality using plant-based techniques with the economic valorization of the produced biomass is also referred to as phytoattenuation. In this strategy, the economic use of the land as well as the risk mitigation of the contamination itself are the primary goals.
The diversity of the plant species involved in phytomanagement (e.g., trees, industrial crops, herbs, and aromatic plant) could allow biomass valorization as a material (fibers, essential oil, eco-catalyst) or as an energy source (combustion, biogas, bioethanol) [6,10,11,12,13,14,15,16,17,18,19]. These non-food purposes might be integrated into the biobased market and can contribute to its development. Specifically, In the European chemical market in 2019, only 3% of the products were biobased, with more than 51% of biomass feedstock being imported. The maturity of this sector was considered low or medium. However, the biobased chemical market is expected to grow in the coming years [20]. This will lead to an increase in biomass needs and in the intensification of land use, which might reduce biomass import-dependency in Europe. In this context, the reuse of marginal land can promote this increase in biomass production without competing with agricultural land [2]. According to the “paints, coating, inks and dye” sector, 12.5% of the content of these products were biobased and mainly concern solvents and polymers, not dyes [20]. In this sector, the substitution of synthetic dyes with biobased natural alternatives is a worldwide emerging research subject. These natural dyes could be used in various applications, such as in paint, food, chemical indicators, and textiles, and in emerging ones, such as materials for solar panels or pharmaceuticals [21,22]. Specifically, the textile sector is one of the most environmentally harmful sectors that use dyes; the use of synthetic metallic dyes composed of TE such as Cr, Co, Cu, and Pb results in a high content of pollutants in the wastewater of the dyeing process [23]. Therefore, the textile sector could highly benefit from biobased natural dyes, enhancing this sector’s environmental sustainability [24].
Malva sylvestris L. (common mallow) is considered a native species in Europe, North Africa, and Asia. Numerous studies have investigated the pharmacological properties of M. sylvestris, notably in the flowers and the leaves, and its use as a medicinal plant [25,26]. Moreover, M. sylvestris has been reported as a potential tinctorial plant [27], and a green-yellow color could be obtained in textiles [28]. Nevertheless, despite M. sylvestris being reported as a metal-tolerant plant in Europe [29,30,31] and as adequate for use in several non-food biomass valorization chains [32,33,34], no studies have combined these two factors to date.
This paper aims to conduct the first screening of an emerging biomass valorization chain that is based on the use of M. sylvestris in a phytomanagement strategy to work with a TE-contaminated site to produce a natural dye that has been extracted from flowers for use in a textile product. The adequacy of M. sylvestris for phytomanagement was evaluated through the study of (1) the growth performance of the plant on a TE-contaminated site, (2) the cultivation effect on the TE contamination mobility in the site, and (3) the TE concentration in different plant compartments composing the biomass. As its behaviour in response to TE (accumulator or excluder) is not known, its relevancy for other phytotechnologies was not chosen a priori. The use of M. sylvestris flowers to obtain a dye was studied through a dyeing test on textile fabrics that either may or may not have received pretreatments. To assess the quality of the produced textile fabrics, the TE concentrations in the dye extracts and dyed textiles were determined. Other value chain options were also explored therhetically.

2. Materials and Methods

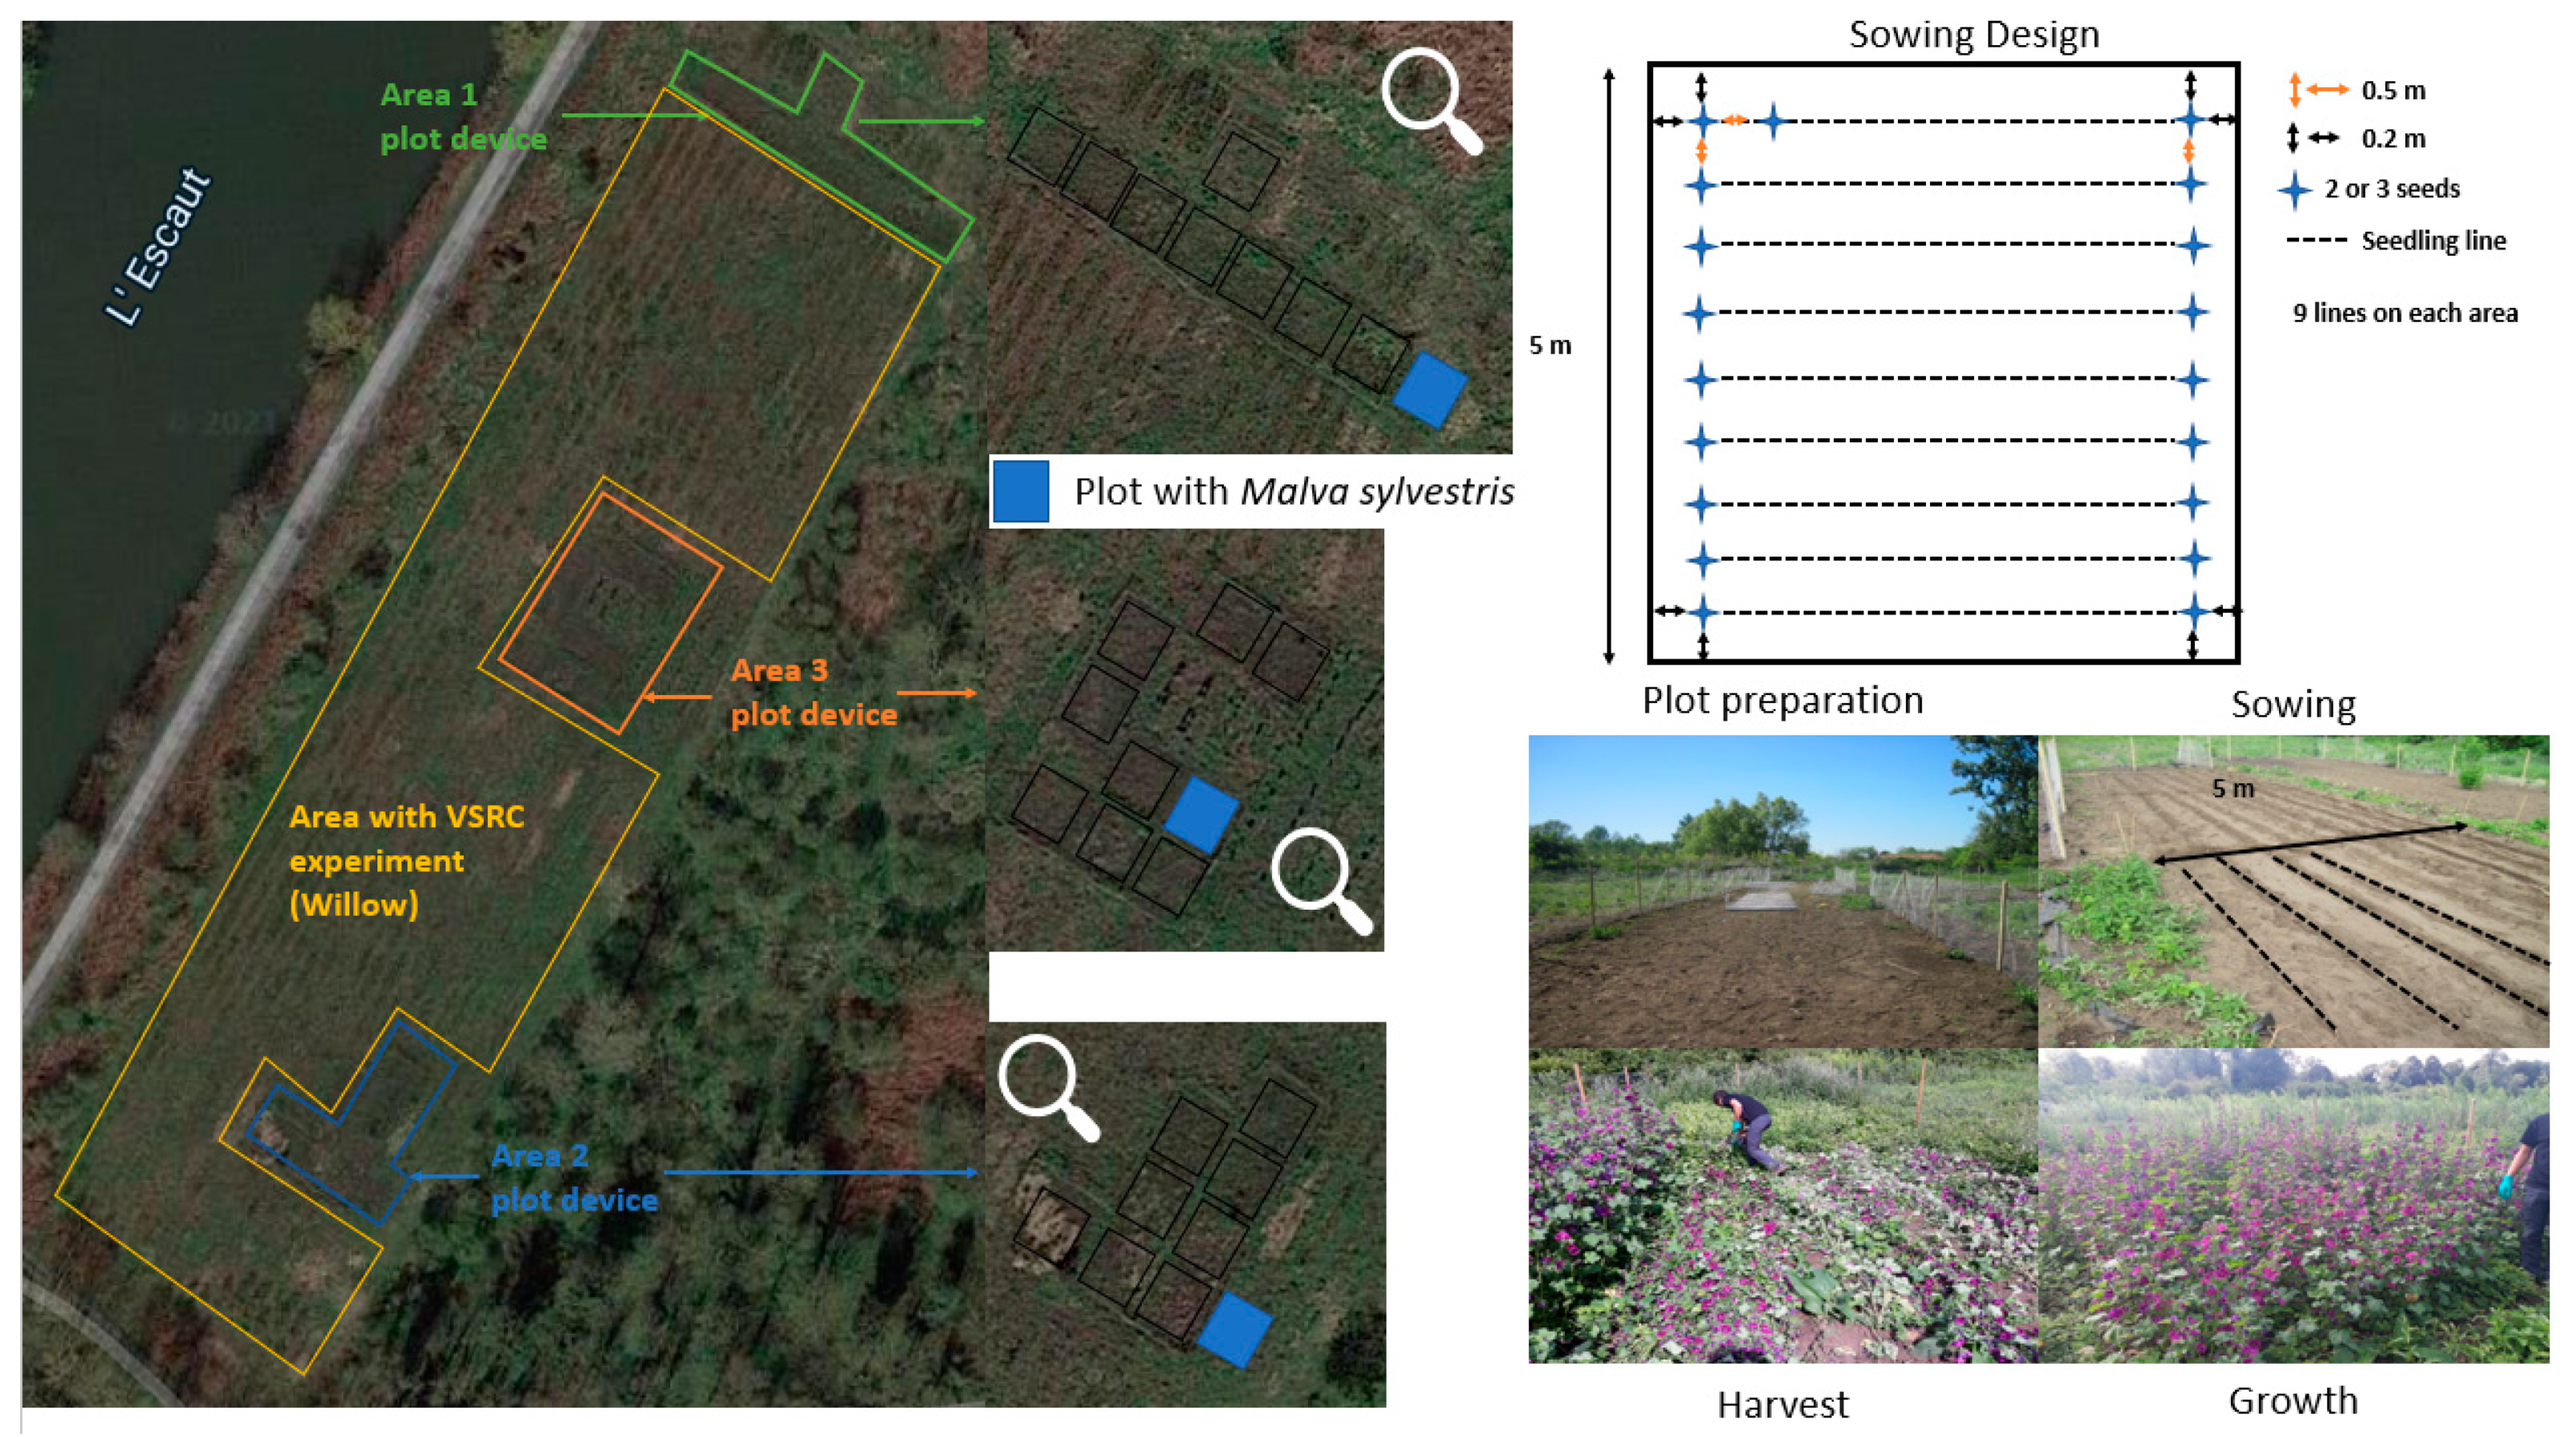
2.1. Site Description and Experimental Device

The experimental site was a former dredged sediment disposal site located in Fresnes-sur-Escaut (Hauts-de-France, France; 50°25’41.1” N 3°35’01.9” E) [18,35]. Between 1978 and 1989, this site received sediment from dredging activities on rivers and canals. TE concentration analyses of the sediment exhibited a high degree of contamination in this site. On three areas, an experimental setup with nine plots of 25 m² per area (Area 1, Area 2, Area 3, Figure 1) was devised in April 2019 to assess the applicability of different plant species for phytomanagement [18]. To reduce herbivory damage, the plots were protected by a 2 m high fence, which was buried down to 50 cm below ground. M. sylvestris, one of the species tested and the focus of this study, was sown on one plot of each area on the 16 and 17 May 2019, and the plants were harvested on 31 July 2019. During this period, the mean temperature was 17.2 °C (maximal temperature registered of 41.5 °C), and the cumulative precipitation was 130.7 mm [36]. The sediment was prepared (tillage and mechanical weeding, Figure 1) to allow for the manual sowing of the seeds [37]. The sowing design (Figure 1) that was applied for this species and the distance between the seedling line and the seed (0.5 m) were based on horticultural recommendations [38]. After seed germination, manual weeding was performed, and no chemical products were used due to constraints imposed by the site’s manager.

2.2. Sediment Sampling and Analysis

As described in Perlein et al. [18], two sediment sampling moments were performed during the experiment, one just before sowing and the second at harvest. The samples were collected with a hand auger, which permitted the sampling of the first 20 cm of the sediment depth. The sampling before sowing (middle of May) was conducted at five random collection points per plot, while the sampling during the harvest (end of July) consisted of ten random collection points per plot. For each sample that was collected, around 250 g of fresh sediment was dried until constant weight was achieved in a forced-air oven (40 °C), and the dry sediment (DS) was mechanically ground (Retsch BB51) and sieved to <2 mm. After this preparation, the pH was measured, and the extraction of TE by ammonium nitrate (1 M, NH4NO3) was performed. The pH measurements were based on NF ISO 10390 (2005), in which a mixture of 5 g of DS and 25 mL of distilled water was shaken for 2 h, followed by 1 h of rest before the pH was measured (pH meter Hanna edge). The TE was extracted from the DS following the NF ISO 19730:2008 (E) [39], in which 25 mL NH4NO3 (1 M) was mixed with 10 g of DS. To obtain the leachate containing the extractable TE fraction, after 2 h of shaking, the mixture was filtered (0.45 µm, Millipore), and nitric acid (HNO3, 69%) was added until a pH of 2 was reached.
A sediment composite was created for each area by mixing 50 g of fresh sediment per sample collected before sowing. On these three composites, the analysis of the agronomic sediment parameters was subcontracted (Laboratoire Départemental d’Analyses de la Mayenne, La Mayenne, France, Supplementary Materials Table S1). Moreover, total digestion of the three sediment composites was performed in triplicates after a preparation step (drying at 40 °C; ball mill grinding at 250 µm, Lavallab Pulverisette 6). In a microwave digester (Mars Xpress CEM), a mixture of 0.2 g of sediment and 6 mL of hydrofluoric acid (HF, 48%) was digested. Then, boric acid (5.5%) was added to neutralize the HF. The mixture was completed at 50 mL with Milli-Q water and was filtered at 0.45 μm (hydrophilic Teflon). The TE concentrations in digestates were analyzed either by inductive-coupled plasma optical emission spectrometry (ICP-OES, Agilent 5100, Agilent Technologies Inc., 5301 Stevens Creek Blvd Santa Clara, CA 95051, USA) or inductive-coupled plasma mass spectrometry (ICP-MS, Agilent 7500) depending on the concentration of the sediment sample concentration. One standard reference material was used for analytical quality control (NIST SRM 2710, Montana soil, National Institute of Standards & Technology, 100 Bureau drive Gaithersburg, MD 20899, USA). For all of the digestion sets, recoveries were between 0.80 and 0.93 for Cu, 0.95 and 0.98 for Pb, and 0.96 and 1.04 for Zn in the reference sediment. For Cd, no recoveries could be calculated, as the results obtained from ICP-OES analysis were below the limit of quantification (LoQ).
The extractable and total TE concentrations in the sediment were used to calculate the % TE mobility, with % mobility = [TE] sediment extractable/[TE] sediment total * 100.

2.3. Plant Sampling and TE Analysis

At harvest, during the flowering stage, the base of the aerial part of the plants was cut with a hand pruner. Per area, ten plants were randomly sampled simultaneously to the sediments. After the harvest, all of the aerial biomass was weighed (portable hand scale) to obtain the yield per area. The plant samples were transported to the laboratory for further analyses. M. sylvestris shoots are composed of three parts (the flower, the stem, and the leaf), which were manually separated and weighed for each plant sample to obtain the fresh weight (FW). The separated plant parts were washed with tap and deionized water and were dried until constant weight (40 °C). An additional weighing was performed on the dry sample (DW, dry weight), and each sample was ground with a blender to obtain a powder. Per plant, on each part (flower, stem, leaf), digestion (microwave digester Mars Xpress CEM) was performed with 0.5 g of DW with 10 mL of HNO3 (69%). The solution that was obtained was completed with Milli-Q water until 50 mL was reached, and the solution was filtered (0.45 μm, hydrophilic Teflon). The TE concentrations in the eluates were measured by ICP-OES (Agilent 5100) or ICP-MS (Agilent 7500). One standard reference material was used for analytical quality control (Branches and leaves of Bush “NCS DC 73349”, NCS Testing Technology, China, http://www.ncsstandard.com, accessed on 5 June 2018). For all of the digestion sets, recoveries of the reference material were between 0.96 and 0.99 for Cu, 1.03 and 1.05 for Pb, and 1.03 for Zn in the branches and leaves. The reference value for Cd was lower than the analytical LoQ. In 2020, to obtain the control TE concentrations in M. sylvestris on uncontaminated soil, 1 m² of M. sylvestris was sown in a private garden (50°25′43.5″ N, 3°33′16.5″ E) near the experimental site, and three shoots of mallow were harvested. Due to the low quantity of flowers that was obtained, flowers from uncontaminated soil were pooled and considered as a single sample. This additional experiment yielded three samples of mallow shoots and one flower sample of uncontaminated origins. These samples were characterized following the same protocols as those described for the contaminated samples. The TE concentration in the shoots was calculated according to the equation:
[TE] shoots = ([TE] flower * DW of flower + [TE] stem * DW of stem+ [TE] leaf * DW of leaf)/(DW of flower + DW of stem + DW of leaf)
Using the TE concentrations in the shoots and the total and extractable concentrations in the sediment, the bioconcentration factor (BCF) [40] was calculated as follows:
(1)
BCF ext = [TE] shoots/[TE] sediment extractable
(2)
BCF tot = [TE] shoots/[TE] sediment total

2.4. Dye Extraction and Dyeing Test

On the samples from each cultivation area, water extraction was performed with the dry flower powder (5 g L−1) to obtain a solution containing the dye compound. This solution was heated for 60 min at 90 °C on a stirring plate with constant stirring. The solution was filtered (grade 474 quantitative filter paper, particle retention 5–10 μm, Büchner funnel) to remove the flower powder. Additional dye extraction on flower powder from Area 2 was performed at 10 °C and at room temperature to assess the heating effect.
For the five dye extracts from the M. sylvestris flower (Area 1, Area 2, Area 3, 10 °C, room temperature), dye tests were performed on two types of fabric pieces of plant and animal origin (cotton and silk). On these fabrics, three pretreatment modalities were tested (no pretreatment, and alum or iron pretreatment). The alum or iron pretreatment of the fabric consisted of an addition of potassium alum (KAl(SO4)2·12H2O) or iron(II) sulfate (FeSO4) in the beaker in a proportion of 20% and 1% of the weight of fabric (WOF), respectively. Considering the amount of fabric, the pretreatment solutions were obtained by adding water to a proportion of 3 L of water per 100 g of fabric. After alum or iron dissolution, the fabric was added for 60 min at 90 °C on a stirring plate with occasional stirring. Once finished, the treated fabric was rinsed with fresh water and air-dried. The dyeing test consisted of adding 60 mL of dye extract from M. sylvestris flower and 0.6 g of fabric (1:100 ratio) in a beaker. On a stirring plate, the mixture was heated at 90 °C for 60 min and was left to stir. The fabric was then rinsed with fresh water and was air-dried.

2.5. TE Analysis in Textile Fabrics and Dye Extract Solutions

TE concentrations were measured by ICP-OES and ICP-MS after the digestion of the five dye extracts and the fabrics with HNO3 (69%) before and after pretreatment and after dyeing with the five extracts. The fabric digestion method was similar to the plant digestion method (cf 2.3). However, if the quantity of fabric available for digestion was lower than 0.25 g, 5 mL of HNO3 (69%) was used, and the solution was completed to 25 mL with Milli-Q water to keep the same acid/water proportion. In the case of the dye extract solution (5 g of dry flower L−1), 0.25 mL of the dye extract was digested with 10 mL of HNO3 (69%) and diluted to 50 mL with Milli-Q water.

2.6. Statistical Analysis

The software R 4.0.01 (6 June 2020) and R studio were used for the statistical analysis of the values and the boxplots making. The data normality was verified with a Shappiro test, and variance homogeneity was determined with the Bartlett test (parametric) or the Fligner–Killeen test (non-parametric). To compare the means of the different parameters (TE concentration in shoots, BCF ext, BCF tot) between areas, a one-way ANOVA test was performed when the data respected normality and variance homogeneity; if not, a Kruskal–Wallis test was applied. A two-way ANOVA was used when the means of the parameters (pH, TE extractable concentration, TE concentration in the three plant parts, TE mobility in the soil) were compared (area and plant parts or area and time (sowing, harvest)). In the case of statistical difference at a 5% risk or below, a post hoc test (Tukey Honestly Significant Difference (HSD) test, Duncan test or pairwise t test) was used. The study of correlations between variables (pH and TE extractable concentration; TE shoot concentration and TE extractable concentration) was performed with a Pearson correlation test.

3. Results and Discussion

3.1. Initial Agronomic and Contamination Characteristics of the Site

The agronomic parameters and the total TE concentration in the sediment (Table 1) of the three areas were already presented and discussed in earlier research [18]. The agronomic parameters showed a fine sediment texture on the three areas, with a pH of around 8. The organic matter and C/N were high due to the matrix origin, i.e., dredged sediment. Concerning the characterization of the total TE concentration in the sediment, our results were compared to the threshold values (S1, Table 1) defined in the French law (French Environmental code, article R214-1, rubrique 3.2.1.0) [41]. For all of the areas, the Cd, Pb, and Zn concentrations were 3–4 times, 7–10 times, and 20–30 times higher than the legal threshold values, respectively. This proves the high degree of contamination of our site and confirms the need for adapted management. Moreover, the TE contamination was heterogeneous on the site, with the highest contamination in Area 3 and the lowest in Area 2. In addition, the Cd, Cu, Pb, and Zn concentrations in the extractable solution were superior to the values that are frequently retrieved in extractable solutions that are reported in the standard ISO 19730:2008 (E) (Cd: 0.005 µg g−1; Cu: 0.25 µg g−1; Pb: 0.02 µg g−1; Zn: 0.25 µg g−1) [39]. The sediment’s total and extractable TE concentration evidenced that Cd, Cu, Pb, and Zn were the cause of the most concern due to their potential environmental risks.

3.2. Growth of M. sylvestris on the 3 Metal-Contaminated Areas

In the three areas, all life stages of M. sylvestris were observed from seed germination to the growth and emergence of flowers, without any visible toxicity symptoms. Our results corroborate the results of cultivation experiments in TE-contaminated sites/pots already reported in southern Europe [29,30,31].
Concerning the dry weight (Table 2), a statistically significant area effect was observed (p < 0.05) with a better growth in Area 3. Delfine et al. [34] discussed that soil fertility, notably the soil’s organic matter (OM) content, could increase M. sylvestris biomass production. The best biomass production and yield observed in Area 3 could be due to the higher cation exchange capacity and OM content of its soil (Table 1).
To our knowledge, M. sylvestris is not a common crop, with only few studies and data concerning the yield of this species being reported. In Italy, Delfine et al. [34] reported minimum and maximum biomass yields of 0.98 and 4.73 t ha−1 of DW, with most of the yields ranging between 1–3 t ha−1 of DW. The yields obtained in our study, between 2.2 and 2.9 t ha−1, can therefore be considered average. As the best yield was obtained in Area 3, and our results confirmed the high tolerance of M sylvestris to a high TE contamination level. Moreover, in this study, flower production was essential for assessing dye production on a contaminated site. Therefore, specific data concerning flower production were gathered, and a flower percentage per plant between 8% and 10% and a flower yield of 0.145–0.241 T ha−1 of DW were obtained (Table 2). To our best knowledge there are no data available in the literature to compare our results to.
As M. sylvestris is usually cultivated for horticultural purposes (as ornamental crop), and it requires an agricultural technical itinerary to be cultivated in a large area for phytomanagement purposes. Based on this paper’s sowing design, The soil should be worked mechanically (tillage and weeding) before sowing. The distance of 0.5 m between the seedling lines and seeds seemed appropriate for this species’ growth; this could be achieved by using agricultural machinery that allows sowing in a line and that respects the distance between seedling lines. However, three factors could impede the cultivation of M. sylvestris on an agricultural scale: (1) seed production should be adapted to the agricultural market; (2) a mechanical harvester should be developed, which could be the most problematic point, as the machine must cut the base of the plant and harvest it with care in order to not to damage the flower part; (3) a process for the separation of the flower from the shoots should also be developed; this could be done manually directly after the harvest, but this is time-consuming (around 15 min per plant) and could limit the economic viability of the dye. An alternative to manual separation should be investigated and tested. For example, the aerial biomass could be dried in a chamber, and the separation of flowers could be performed on the dry matter with airflow or by shaking the biomass. Flowers that had fallen to the ground by gravity would just need to be picked up. This option could be energy-consuming but might facilitate the conservation of the harvested biomass for future valorization.

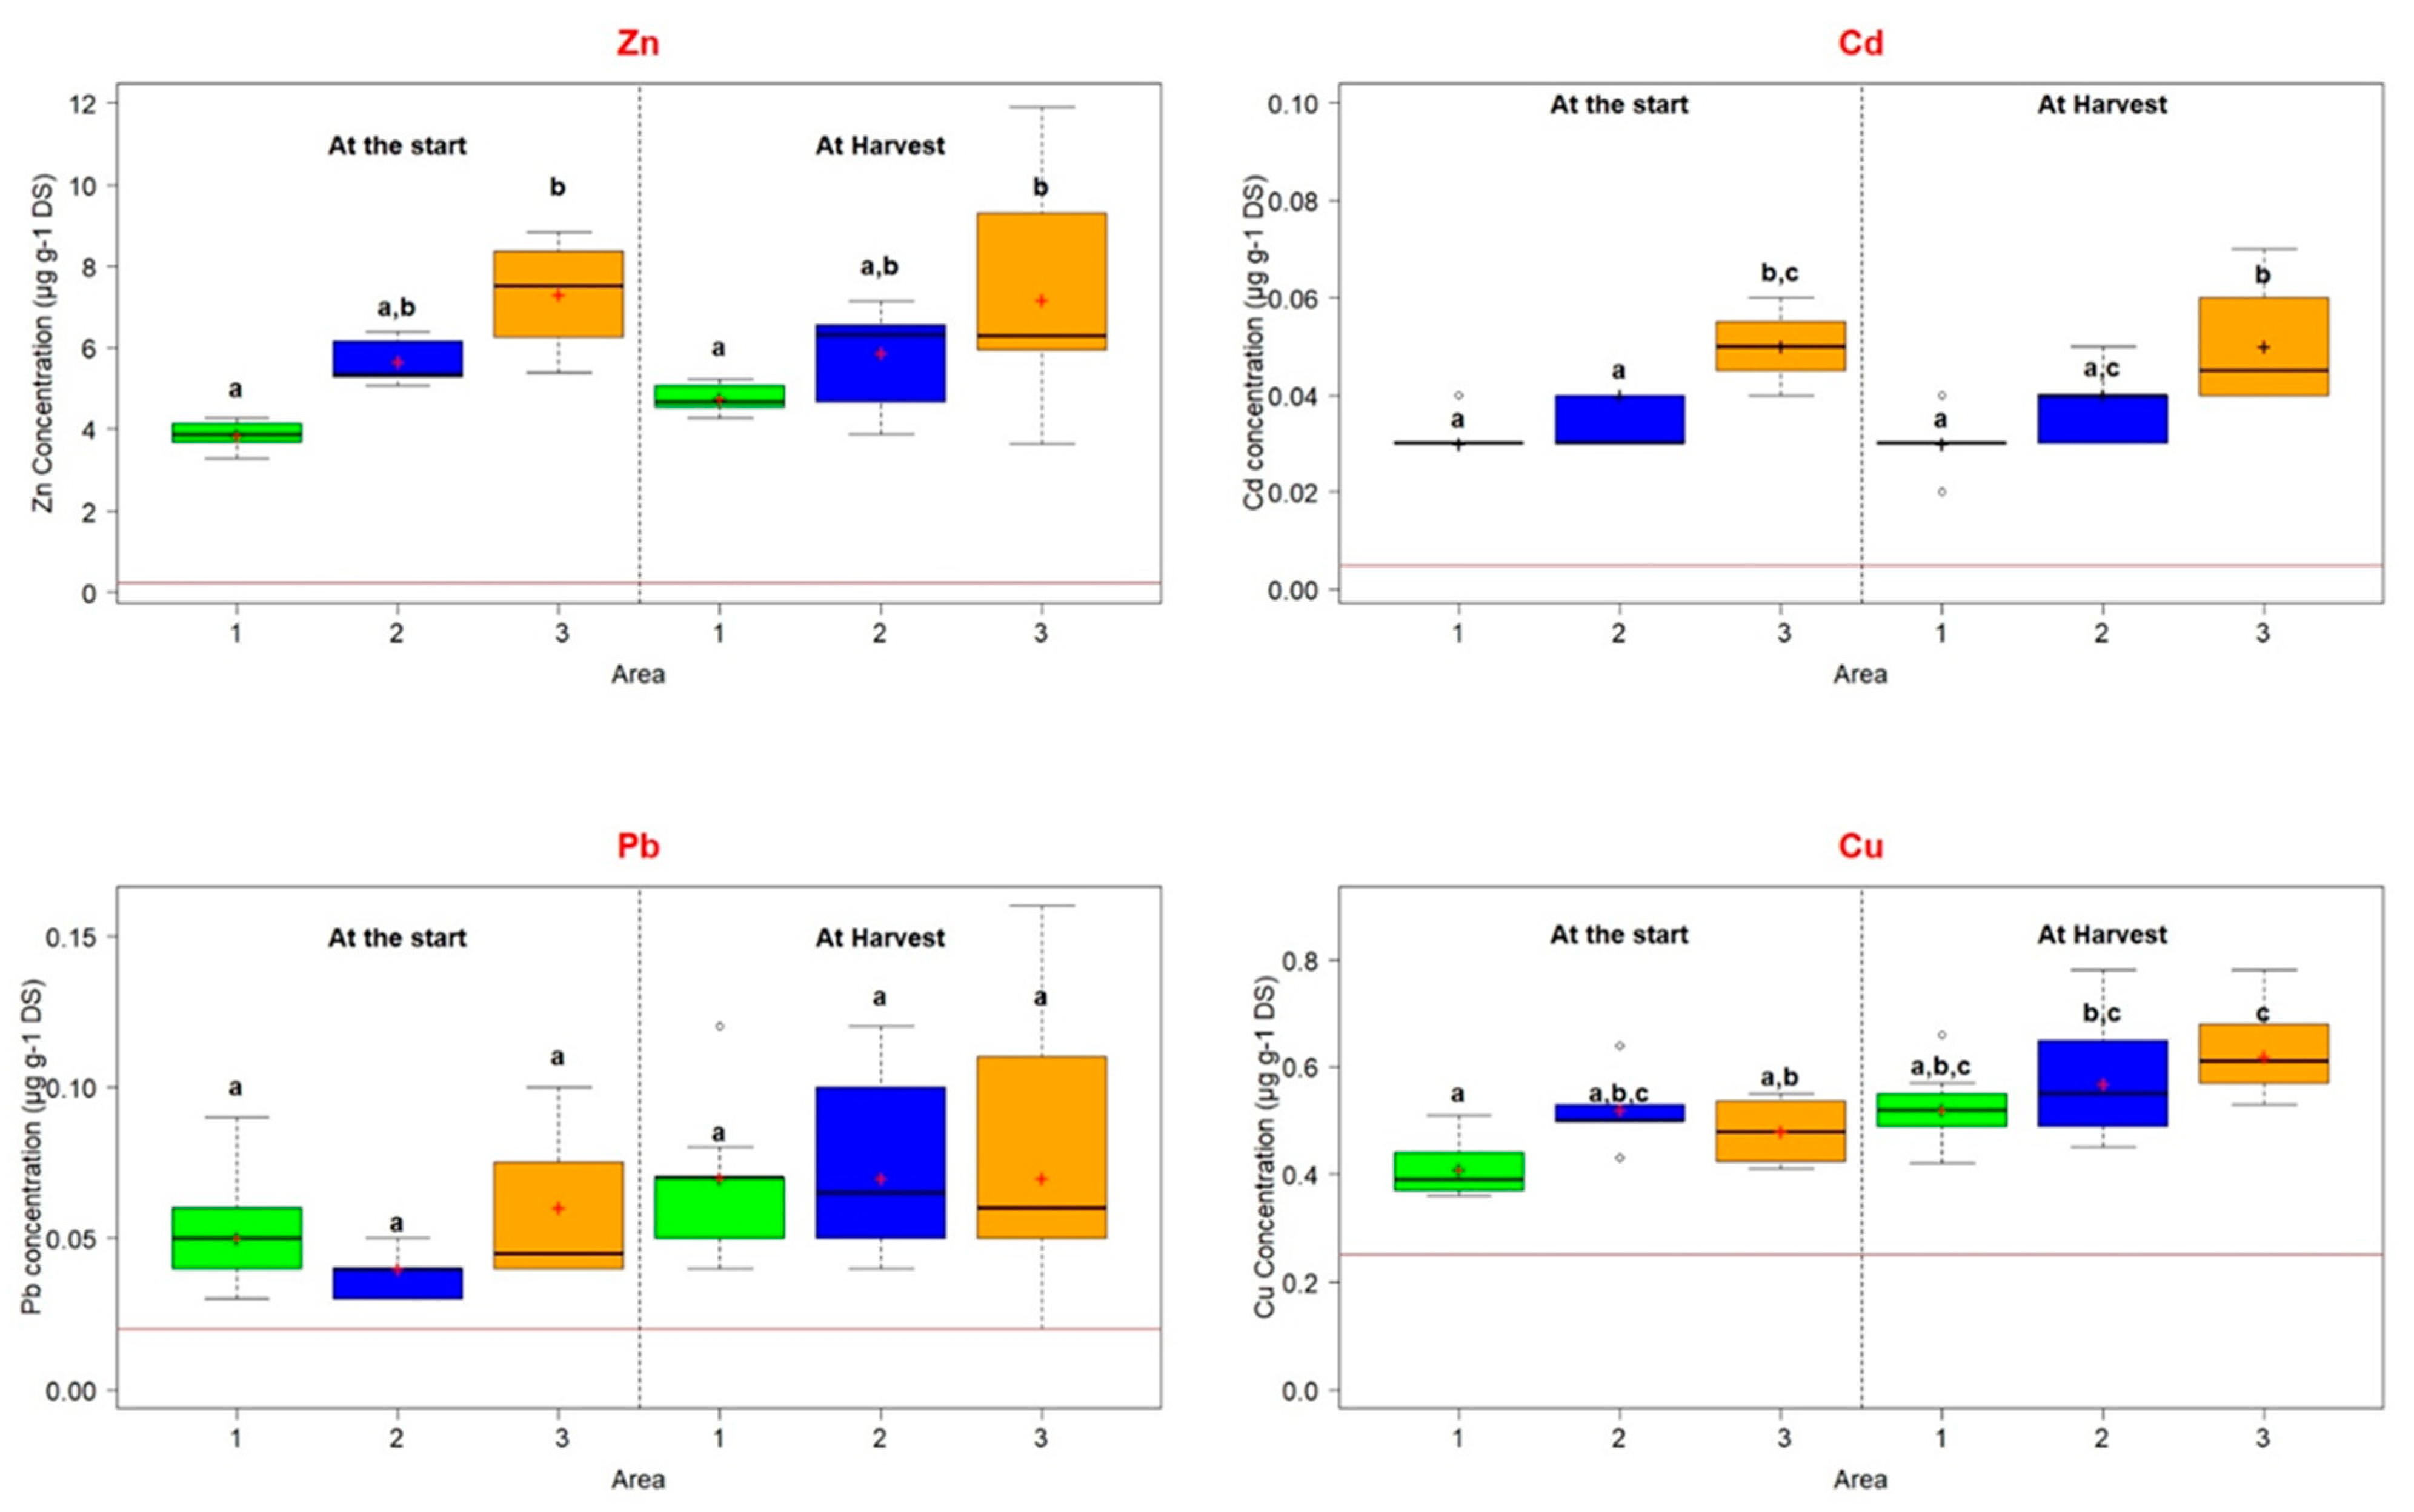
3.3. M. sylvestris Effect on TE Extractable Fraction and Mobility in the Sediment

The pH of the sediment was measured to assess the potential impact of M. sylvestris on its acidification by the root system [42]. pH variation has been reported as a factor that could significantly impact the solubility and mobility of TE in sediment [43]. All of the pH values measured varied between around 8 and 8.4 (Supplementary Materials Figure S1). In our sediment conditions, the cultivation of M. sylvestris slightly increased the pH of the area 3 (0.16 unit) at the harvest time (p < 0.05).
The TE (Zn, Cd, Pb, Cu) sediment concentrations retrieved in the extract solution obtained by NH4NO3 extraction are presented in Figure 2. These TE concentrations represent the most soluble fraction in the sediment solution [39] and therefore have a higher environmental risk because of their potential availability and leaching into the groundwater. The four TE extractable concentrations were measured on all of the sediment sampled at the beginning of the experiment (i.e., without the plant) and at the harvest. At both sampling periods, the extractable concentrations exceeded the extractable concentration frequently retrieved in soils [39]. Depending on the areas, the Zn and Cd boxplots (Figure 2) showed similar spreading data at the start of the growing process and at harvest. The spreading data were the highest in the area 3, especially at the time of harvest (Figure 2). Concerning the Pb boxplots (Figure 2), on all areas although the concentrations that were measured were low, deviations from the mean were high. For the Cu boxplots (Figure 2), the spreading data increased at the time of harvest in area 2 and area 3 compared to at the start.
In the beginning, the extractable concentrations of Zn in Area 3 were above values measured in Area 1 (p < 0.05, Figure 2), and this difference persisted at the end of the experiment. A moderate pH correlation could partially explain this slight area effect (p < 0.05, r = −0.34), as a lower pH could increase the soluble Zn fraction. M. sylvestris cultivation did not change the Zn extractable concentration and the low sediment mobility (<0.1% of total Zn, Supplementary Materials Table S2). The extractable Cd concentrations (Figure 2) presented a similar pattern to Zn. The highest extractable Cd concentrations were measured in Area 3 at both sampling periods (p < 0.05), indicating an area effect. The Cd extractable concentration correlation with the sediment pH could also explain this observation (p < 0.05, r = −0.43). The cultivation of M. sylvestris also did not affect the extractable fraction (p > 0.05) nor the mobility of Cd in the sediment (Supplementary Materials Table S2). Cd has been shown to be less mobile in alkaline soil [43], such as in the soil of our site. Nevertheless, compared to the three other TE, the Cd mobility could be considered high (<0.69% of the total Cd, Supplementary Materials Table S2). Kabata-Pendias [43] suggested that the increase of soil alkalinity could reduce Cd2+ adsorption due to the presence of other elements (Ca2+ and Mg2+) and by the increase of CdOH+, which could not easily interact with the cationic exchange capacity (CEC). It could be assumed that the high Cd mobility was due to the presence of ionic Cd in the sediment. Concerning Pb (Figure 2), the extractable concentration that was measured did not change depending on the area and the period (p > 0.05). It should be noted that the percentage of Pb mobility (Supplementary Materials Table S2) was already extremely low before cultivation (<0.012% of the total Pb, Supplementary Materials Table S2). For Cu, a slight plant effect was observed (p < 0.05), leading to an increase in the extractable concentration in Area 3 at harvest. However, this effect was not present when Cu mobility was studied (Supplementary Materials Table S2, p > 0.05).
M. sylvestris cultivation alone did not reach the phytostabilization objectives of TE mobility reduction in our sediment conditions. In order to reduce the Cd mobility and to enhance stabilization, combining an amendment with the cultivation of M. sylvestris could be an option. As already discussed in our previous study on the same site [18], a biochar amendment could reach this objective by interacting with Cd2+ and CdOH+ to form a stable complex without altering the pH. The study of a biological amendment such as mycorrhiza fungi might also be an option.

3.4. TE Transfer in the Aerial Plant Parts of M. sylvestris

Cd, Cu, Pb, and Zn concentrations were evaluated in the three plant compartments (flower, stem, and leaf) composing the shoots of M. sylvestris and are reported in Table 3. This allowed the assessment of several biomass valorization options for these plant parts by taking into account their TE concentrations (Section 3.5).
For Cd and Zn, the laboratory measurements showed equal concentrations in the flowers and the stems (p > 0.05, Table 3). For these two TE, the concentrations measured in the leaves were above those contained in the flowers and the stems (p < 0.05). These differences could be explained by the role of the TE, essential versus not essential, and by the physiological role played by the plant parts. The leaf is the part where photosynthesis takes place, whereas the flower is a reproductive organ that allows seed production. The stem permits the transport of nutriments and TE to all plant parts. Zn is essential because it is involved in several plant metabolisms and functions (e.g., photosynthesis, mitochondrial function) and composes different plant proteins [43,44]. Nevertheless, at concentrations ranging between 100 and 500 µg g−1 DW, Zn could be toxic for most of the plants [43]. As our Zn concentrations are in this range (Table 3), our results suggest the Zn tolerance of M. sylvestris. In agreement with this hypothesis, the Zn concentrations in the flowers (Table 3) are four times more than the ones measured in the flowers of the control plants (Table 4). On the contrary, as Cd is both not essential and phytotoxic from 10 µg g−1 DW [43,45], the plant might protect itself by limiting its accumulation in the flower and by sequestering it in the vacuoles as a main detoxification mechanism [43,44,45]. Although the Cd concentration in the flowers of the control plants were two times lower (Table 4) than those measured in the flowers from the contaminated areas (Table 3), our results support this hypothesis.
As for the Cd concentrations measured in the three parts, the calculated Cd shoots concentrations of around 1.6 µg g−1 of DW (Table 4, p > 0.05) were not affected by the area, whereas based on the extractable Cd results, a difference could be expected (Figure 2). However, the calculated average Zn shoot concentration of 386 µg g−1 of DW was higher in Area 3 (Table 4, p < 0.05) compared to in the two other areas, which showed values of around 310 µg g−1 of DW. Results also showed higher Zn concentrations in the leaves of plants grown in Area 3 compared to those of plants grown in the two other areas (Table 3, p < 0.05). An extractable Zn concentration correlation might partially explain this cultivation area effect on the Zn shoot concentrations (p < 0.05, r = 0.47). The difference in the shoot accumulation of Zn and Cd could be due to the fact that Zn is essential to the plant, contrary to Cd [43].
While the Pb concentrations in the flowers were higher than those in the stems (Table 3, p < 0.05), the Pb concentrations in the leaves were equal to those in the flower and in the stems. The concentrations in the flowers were around 45 times higher than the one measured in the flowers of the control, suggesting the tolerance of M. sylvestris to Pb, this element being not essential. The concentration of Pb in the three plant parts and the shoots (4.4–5.2 µg g−1 of DW, Table 4) were not affected by the cultivation area (p > 0.05).
Concerning Cu, except for in the stems, the cultivation area did not change the concentration measured in the flowers and leaves (Table 3) and shoots (9.6–11.6 µg g−1 of DW, Table 4). Equal Cu concentrations were constantly measured in the leaves and flowers (p > 0.05). As for Zn, Cu is an essential element. These concentrations correspond to physiological concentrations for most of the plants [43].
For the four TE, the calculated BCF totals were strongly inferior to 1, with a maximum of 0.297 for Cd and a minimum of 0.005 for Pb. These low BCF tot suggested an excluder phenotype of M. sylvestris and confirmed the interest of M. sylvestris in a phytostabilization strategy on a highly TE-contaminated site. To our knowledge, no study has reported the concentrations in different plant compartments of mallow as carried out in the present study. The concentrations in the mallow flowers from the control (Table 4), which are reported here for the first time, were the lowest compared to those measured in the malva flowers collected on the contaminated site. Furthermore, the concentrations in the plant shoots were compared to the expected concentrations in uncontaminated and contaminated conditions. Turkish studies have reported TE concentrations in mallow obtained at a local market (uncontaminated plant). For these four TE, the concentrations ranged between (µg g−1 of DW) Cd: 0.07, Cu: 7–10, Pb: 0.69–3.5, and Zn: 25.9–49.4 [46,47,48,49]. Using XRF, Desideri et al. [50] measured samples in Italy containing Cd, Cu, Pb, and Zn concentrations of 0.6, 16.7, 1.5 and 40.8 µg g−1 of DW, respectively. Compared to the TE control concentration measured in the shoots on uncontaminated soil (Table 4), only Zn was slightly above the concentration reported in [46,47,48,49,50]. These different studies showed a slight variation of the TE concentration in uncontaminated conditions. In our study on a TE-contaminated site, only Cu showed concentrations that were similar to or below the ones reported in the control (Table 4). For the other TE, the concentrations were 6, 12, and 4.5 times higher than the values reported in the control plants for Cd, Pb and Zn, respectively (Table 4). The TE concentrations reported in contaminated sites or in the artificially contaminated soil varied considerably [30,49,51,52]. The Cd concentrations ranged between 0.24–3.5 µg g−1 and 33.5 µg g−1 when the soil was artificially contaminated [30,49,51,52]. For the Cu, Pb, and Zn, the literature concentrations were of 4.3–20 µg g−1, 8–9 µg g−1, and 75–400 µg g−1, respectively [30,49,51]. In our study, just the Zn concentrations values that were were above or similar to the highest value retrieved in these other experiments in contaminated conditions.

3.5. M. sylvestris Biomass Valorization Options

In this paper, the main non-food biomass valorization selected for M. sylvestris was the production of a natural water-extracted dye from its flowers for textile applications (Section 3.5.1). However, flowers only represent 10% of the total plant biomass (Table 2). The remaining 90% of the biomass should also be valorized to create a sustainable biomass processing chain either as a material or as an energy source, and these are further explored in Section 3.5.2. Pharmaceutical applications were not considered to be relevant due to site contamination.

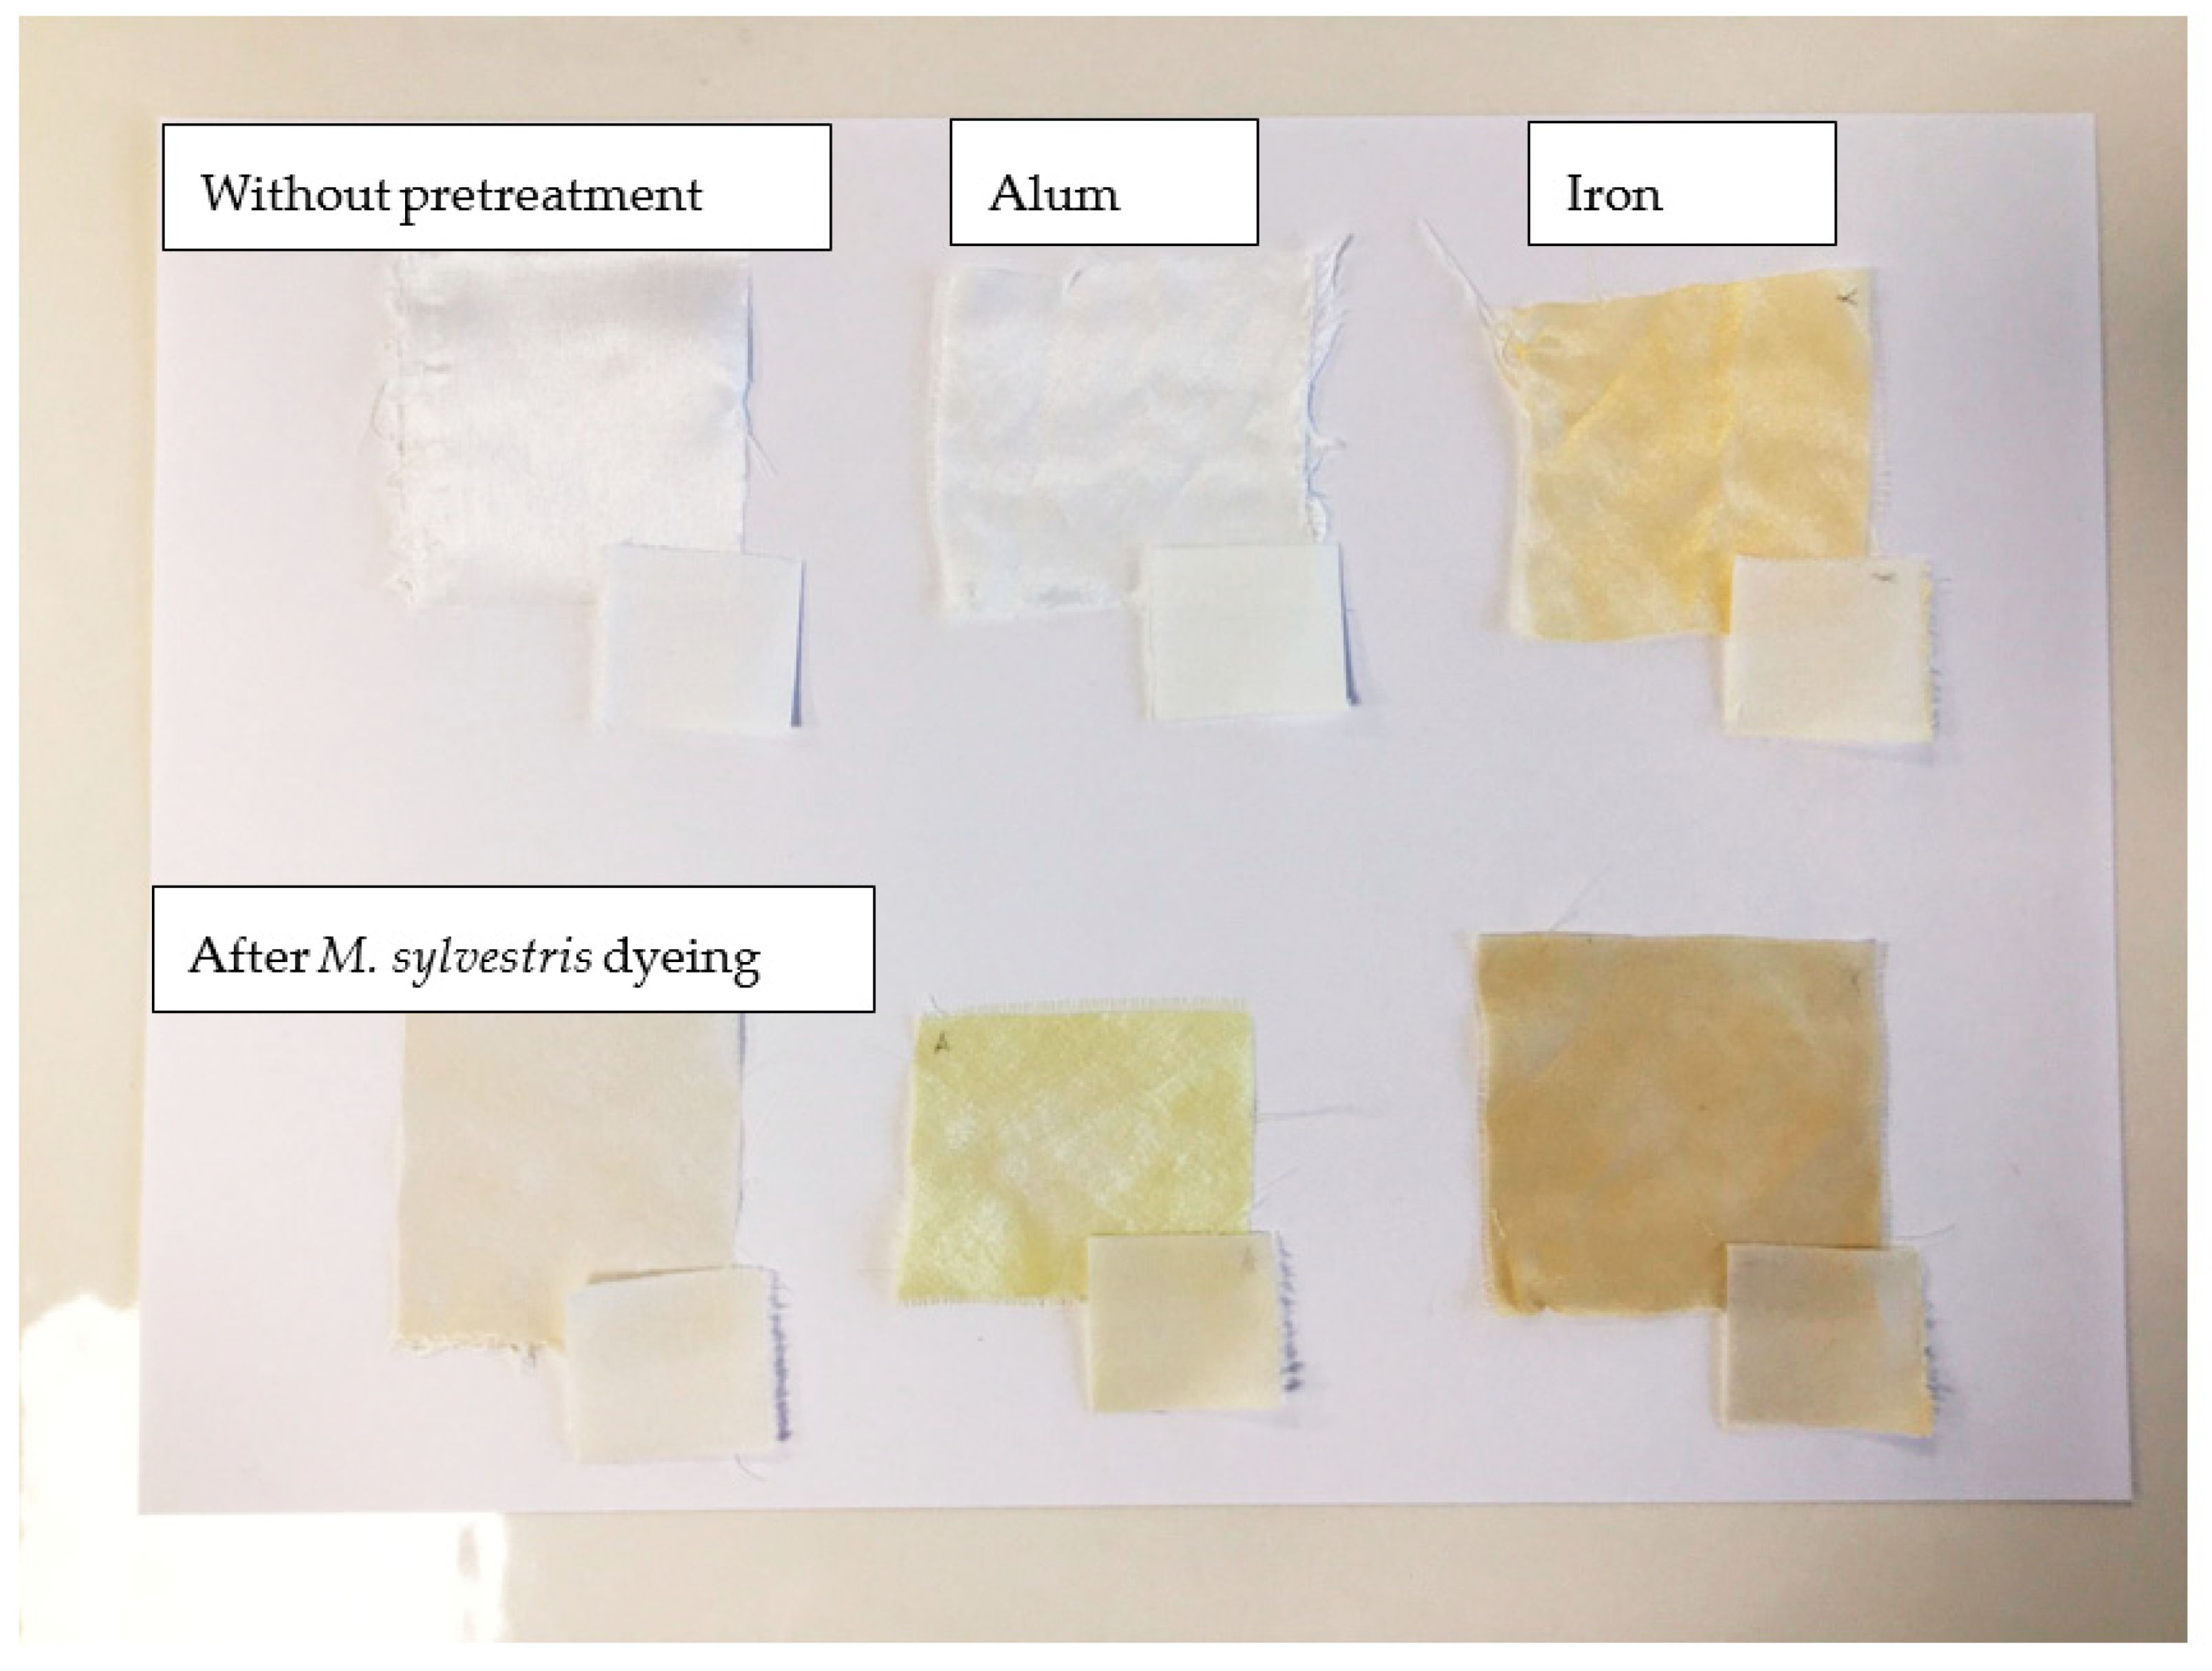
3.5.1. The Textile Dyeing Valorization Chain

The pretreatment of textile with alum or iron is a current practice, as it improves the dyeing of the textile, but that should be avoided if possible in order to reduce the use of metals in the dyeing process. Therefore, three modalities were compared for the used textiles: without pretreatment or with iron or alum pretreatment.
For all dye extracts (area 1, area 2, area 3, 10 °C and room temperature), the mixture of flower powder and water initially had a purple color. As expected, the purple color faded into a brownish color during the heating process and after several minutes without heating. These brownish extracts were used for the dying test on cotton or silk fabrics for the three pretreatment modalities (without pretreatment or iron or alum pretreatment, Figure 3). The initial colors of the pretreated fabrics are reported in Figure 3. The untreated and the alum-pretreated fabrics were white, while the iron-pretreated fabrics presented a light orange color.
For the three pretreatment modalities, the dyeing process with the M. sylvestris flower extract was not impacted by the cultivation area, the heating time, or the extraction temperature (Supplementary Materials Figure S2). The dyeing of the fabrics without pretreatment was unsuccessful, and only a faint color was achieved (Figure 3, Supplementary Materials Figure S2). The orange shade obtained on the iron-pretreated fabrics was mainly due to the pretreatment itself, with the addition of the flower extract only slightly intensifying the color (Figure 3, Supplementary Materials Figure S2). The best dyeing results were achieved on the alum-pretreated silk fabrics, which had a bright yellow shade that could be due to the flavonoid content reported in M. sylvestris flowers [25,53]. Such shade could also be obtained from other plant species extracts, such as onions [53]. All of these observations emphasize the importance of pretreating the fabric with alum prior to the dyeing test. Moreover, our results suggest better dyeing on silk compared to cotton. This higher affinity of silk with natural colorants has been previously reported [21,54].
The possible darkening of the yellow shade on the fabrics was investigated using a ratio of 1:40 to increase the extract amount in relation to the textile. The dyeing color result was similar to the 1:100 ratio (results not shown). We assumed that the reason why the shade could not be darkened with the 1:100 ratio was because the dye contained in the extract solution had already saturated the fabrics. This is in line with a previous study [54] that attributed the color strength to the number of functional groups interacting with the natural dye extract.
Using a dyeing ratio of 1:100, 0.6 g of silk could be dyed with an extract obtained with 0.3 g of dry flowers. Based on this dyeing capacity, we could assess the quantity of silk that could be dyed with the flowers harvested per hectare. Through the use of the flower yield extrapolation (Table 2), the number of flowers obtained per hectare was able to dye around 290–482 kg of silk.
The TE concentrations throughout the textile dyeing process were studied to assess this valorization option when using mallow issued from phytomanagement. TE concentrations were measured in the dyeing extract solution and in the fabrics (cotton and silk) during the three steps of the dyeing process: before pretreatment, after pretreatment, and after dyeing. The TE concentrations measured in the five dye extract solutions (Table 5) were significantly low when compared to the values retrieved in the flowers (Table 3) and were in usual concentrations in the dye (Table 5) [55]. The TE concentrations in the natural dye extract solution respected the threshold set by the Eco passport by OEKO-Tex (Table 5) [56]; therefore, it might be assumed that they are safe to be used in the textile sector. Indeed, this European standard aims to reinforce processes and product safety at every stage of the chemical value chain by certification. The Cu and Zn concentrations were higher compared to Cd and Pb.
The results on the raw fabrics showed lower TE concentrations in the cotton compared to in the silk (Table 6). In general, the order of the TE concentrations was as follows: Zn > > Cu > > Pb > Cd. The iron and alum pretreatment conducted before dyeing seemed to have increased the Cu and Zn concentrations in the two fabrics, with the lowest concentrations being found in cotton. After dyeing, the highest TE concentrations were measured in silk fabrics, especially Zn and Cu. The highest Cu and Zn concentrations in dyed silks could be related to a better affinity of the dye with this fabric, as observed by the stronger color obtained in silk after dyeing with the mallow extract. Other studies [55,57] have shown that the textile’s fabric origin and the dye used could change the TE concentrations that were measured; our results were in accordance with these.
The TE concentrations in all fabric materials (Table 6), notably for Cd and Pb, were significantly inferior to the total limit (µg g−1) or the sweat extractable (µg g−1) limit set in the OEKO-Tex standard 100 (Cd: 40, Cu: 50, Pb: 90, Zn: 750; Supplementary Materials Table S3) [58]. This indicates that, according to the OEKO-Tex label, the cotton and silk fabrics dyed with natural dye of TE-contaminated origins in this study could be considered as sanitary and safe for textiles that are in direct contact with the skin. The results of the TE concentrations in the different steps of the dyeing process (dye extract and textile fabrics) suggested that the dyeing valorization chain with natural dye could become a phytomanagement option after a preliminary assessment of the TE concentration in the dye and the textile fabrics. Nevertheless, to confirm this, a sweat extraction should be performed, and the dyed fabrics should respect the threshold set for other chemicals by OEKO-Tex standard 100 (Supplementary Materials Table S3) [58].
In order to further assess the use of Malva sylvestris flower extract as a textile dye, additional investigations should be performed concerning the dyeing process, such as testing alternative biomordants, dyeing other fabrics, modifying the chemical composition of the dye extract, and testing the dyeing resistance to light, time, and washing [59].

3.5.2. Other Emerging Biomass Valorization Options for M. sylvestris

In the scientific literature, many innovative biomass valorization options of M. sylvestris have been discussed and might be integrated as a part of the dye production valorization chain. The remaining TE concentrations in the shoots were below the threshold set by the REGULATION (EU) 2019/1009 [60] (Cd 2 µg g−1, Cu 300 µg g−1, Pb 120 µg g−1, Zn 800 µg g−1), permitting the compost of this biomass to be used as a soil improver.
As proposed in Section 3.1, M. sylvestris biomass could be dried to separate flowers from leaves and stems. The remaining dried biomass of M. sylvestris could be used as an alternative biomaterial for the production of activated carbon to remove metals such as Cu2+ and Hg2+ from water [32,33]. As this would aim to saturate the biomaterial with metal, the initial metal concentration of this biomaterial might not be a problematic point as long as it does not leach out in the applied conditions. To consider the feasibility of this option, the removal capacity of multiple contaminants by biomass grown on TE-contaminated sites needs to be further investigated. The production of an environmentally friendly adsorbent for water remediation with M. sylvestris could be a complementary valorization option.
Based on the chemical composition of the remaining biomass, the extraction of high-value compounds could also be a valorization option. This extraction can, for instance, be performed by the hydrodistillation of the M. sylvestris shoots to obtain essential oils (EO), as suggested in [34] or by water extraction [49]. EO or water extract have been reported as having antibacterial properties [34,49]. Moreover, a wide variety of chemical properties, such as a fungicide, were reported and are currently being investigated [26]. In the case of EO produced from biomass from contaminated sites, the metal transfer in the end-products was reported to be extremely low [10,17,19,61]. Concerning the water extract obtained with biomass grown on a contaminated site, TE transfer (Cd, Pb, Cu and Zn) could be expected but were reported to respect the recommended international limits [49]. The obtention of such products for the non-food sector could be a feasible option for M. sylvestris that has been cultivated on TE-contaminated sites.
The remaining biomass of M. sylvestris obtained after water or steam extraction (residues) should be used in an additional valorization step to increase the environmental and economic sustainability of the whole chain. Perlein et al. [19] suggested the use of biomass residues obtained after the distillation of aromatic and medicinal plants cultivated on TE-contaminated soil as soil improver if the concentration threshold of REGULATION (EU) 2019/1009 [60] was respected or in anaerobic digestion (AD) to produce biogas. If the Cd concentration in the extraction residues of M. sylvestris respected this threshold, then the residues could be used as soil improver. To valorize the extraction residues of M. sylvestris, another suitable option could be the use of AD to produce energy, as suggested in other studies and for other plant species [6,18,19,62,63,64,65,66]. Nonetheless, part of the M. sylvestris residues is formed with stems that are lignocellulosic, a part that is not easily transformed in biogas during AD. Extrusion pretreatment of the residues could alleviate this constraint by increasing the biomethane potential (BMP) [67]. To confirm the AD valorization option for mallow extraction residues, an AD test should be performed to assess the BMP and TE impact and fate on the whole AD chain.

4. Conclusions and Perspectives

Our results showed that M. sylvestris had an excluder phenotype and could be cultivated on a heavily TE-contaminated site. The growth and development of mallow were not impacted by the contamination, leading to yields that were similar to average yields obtained in uncontaminated sites. However, M. sylvestris alone did not result in the decrease of Cd mobility in our sediment conditions. Therefore, to achieve phytostabilization, the cultivation of mallow should be aided by biological or/and mineral amendments. M. sylvestris could enable several valorization options, with a focus on natural dye production. To our knowledge, this was the first time that a dye extraction and dyeing test were conducted with M. sylvestris flowers grown on a TE-contaminated site resulting in a yellow shade on alum-pretreated silk fabric while respecting the OEKO-Tex standard 100 TE threshold limit value. Our results concerning the TE concentration throughout the dyeing process encourage the study of other tinctorial plants in the context of the phytomanagement of TE-contaminated sites, as this valorization option seems feasible. The remaining mallow biomass could be valorized as biomaterials such as an absorbent for water remediation or as sources to produce high-value compounds combined with the valorization energy of the residues through biogas production. Overall, the results of the dyeing assay with M. sylvestris should be confirmed at pilot, scale and the dyeing quality should be assessed. Moreover, an adapted technical itinerary that is based on agricultural practices should be developed for phytomanagement in large areas.

Supplementary Materials

The following are available online at https://www.mdpi.com/article/10.3390/app112210613/s1, Figure S1: Water pH in sediment on Area 1 (green), Area 2 (blue), and Area 3 (orange) at the start (n = 5) and at harvest (n = 10) (the box plots indicate the median (black line) and the 25 (lower bar) and 75 (upper bar) percentiles; red cross = mean). Significant differences between conditions are indicated by different letters at the level of α = 0.05, Figure S2: Picture of fabric dyed with Malva sylvestris L. extract depending on the area of cultivation, the temperature of extraction, the fabric origins, and the pretreatment. The small fabric squares are cotton, and the large fabric squares are silk. From left to right, the fabric was either not pretreated, pretreated with alum, and pretreated with iron, Table S1: List of the agronomic analyses and methods performed by the subcontracted laboratory, Table S2: Percentage of mobile trace elements (Cd, Cu, Pb, Zn) calculated as extractable concentrations over total concentrations in sediment at the three areas, at the start (n = 5), and at the harvest (n = 10) (mean ± SD). Significant differences between conditions are indicated by different letters (normal or italic) or numbers (normal or italic) at the level of α = 0.05 (Tukey HSD test), Table S3: OEKO-Tex TE concentration threshold limit value (extractable and total in µg g−1) in textile directly in contact with skin.

Author Contributions

Conceptualization, A.P. (Alexandre Perlein), V.B. and M.F.d.S.; methodology, A.P. (Alexandre Perlein), V.B., A.P. (Arnaud Papin) and J.G.; software, A.P. (Alexandre Perlein); formal analysis, A.P. (Alexandre Perlein); investigation, A.P. (Alexandre Perlein), A.W.; resources, A.P. (Arnaud Papin), R.G. and J.G.; data curation, A.P. (Alexandre Perlein); writing—original draft preparation, A.P. (Alexandre Perlein); writing—review and editing, E.M., V.B., R.G., J.G., and M.F.d.S.; visualization, A.P. (Alexandre Perlein); supervision, V.B., E.M., M.F.d.S. and R.G.; project administration, E.M., V.B. and R.G.; funding acquisition, E.M., V.B. and R.G. All authors have read and agreed to the published version of the manuscript.

Funding

This research was co-funded by the New-C-Land Project (Interreg France–Wallonie–Vlaanderen, with the support of the European Regional Development Fund, grant number: 1.2.294), the OVAM, the Province West Flanders, and the Walloon Region.

Institutional Review Board Statement

Not applicable.

Informed Consent Statement

Not applicable.

Data Availability Statement

Not applicable.

Acknowledgments

The authors thank Voies Navigables de France, who provided access to the field site. The authors are also grateful to Samuel Teillaud, Fabrice Richez, Yohann Baillon, and Farid Ait-Ben-Ahmad for their technical contributions during the sampling campaigns and chemical analyses. The authors are grateful to Farah Taleb for her help in checking the writing. We thank the Interreg Project New-C-Land, who permitted the field experiments and the writing of this paper. We thank the anonymous reviewers for their comments, which greatly helped us to improve the manuscript.

Conflicts of Interest

The authors declare no conflict of interest. The funders had no role in the design of the study; in the collection, analyses, or interpretation of data; in the writing of the manuscript; or in the decision to publish the results.

References

  1. Kang, S.; Post, W.; Wang, D.; Nichols, J.; Bandaru, V.; West, T. Hierarchical marginal land assessment for land use planning. Land Use Policy 2013, 30, 106–113. [Google Scholar] [CrossRef]
  2. Gopalakrishnan, G.; Negri, M.C.; Snyder, S.W. A novel framework to classify marginal land for sustainable biomass feedstock production. J. Environ. Qual. 2011, 40, 1593–1600. [Google Scholar] [CrossRef] [PubMed] [Green Version]
  3. Burges, A.; Alkorta, I.; Epelde, L.; Garbisu, C. From phytoremediation of soil contaminants to phytomanagement of ecosystem services in metal contaminated sites. Int. J. Phytoremediation 2018, 20, 384–397. [Google Scholar] [CrossRef]
  4. Robinson, B.H.; Banuelos, G.; Conesa, H.M.; Evangelou, M.W.; Schulin, R. The phytomanagement of Trace Elements in soil. Crit. Rev. Plant Sci. 2009, 28, 140–166. [Google Scholar] [CrossRef]
  5. Evangelou, M.W.H.; Deram, A. Phytomanagement: A Realistic Approach to Soil remediating Phytotechnologies with New Challenges for Plant Science. Intern. J. Plant Biol. Res. 2014, 2, 1023. [Google Scholar]
  6. Meers, E.; Van Slycken, S.; Adriaensen, K.; Ruttens, A.; Vangronsveld, J.; Du Laing, G.; Witters, N.; Thewys, T.; Tack, F.M.G. The use of bio-energy crops (Zea mays) for ‘phytoattenuation’ of heavy metals on moderately contaminated soils: A field experiment. Chemosphere 2010, 78, 35–41. [Google Scholar] [CrossRef] [PubMed]
  7. Garbisu, C.; Alkorta, I.; Kidd, P.; Epelde, L.; Mench, M. Keep and promote biodiversity at polluted sites under phytomanagement. Environ. Sci. Pollut. Res. 2020, 27, 44820–44834. [Google Scholar] [CrossRef] [PubMed]
  8. Su, C.; Jiang, L.; Zhang, W. A review on heavy metal contamination in the soil worldwide: Situation, impact and remediation techniques. Environ. Skept. Crit. 2014, 3, 24–38. [Google Scholar]
  9. Zine, H.; Midhat, L.; Hakkou, R.; El Adnani, M.; Ouhammou, A. Guidelines for a phytomanagement plan by the phytostabilization of mining wastes. Sci. Afr. 2020, 10, 2468–2476. [Google Scholar] [CrossRef]
  10. Angelova, V.R.; Ivanova, R.V.; Todorov, G.M.; Ivanov, K.I. Potential of Salvia sclarea L. for Phytoremediation of Soils Contaminated with Heavy Metals. Int. J. Agric. Biosyst. Eng. 2016, 10, 12. [Google Scholar]
  11. Deyris, P.A.; Bert, V.; Diliberto, S.; Boulanger, C.; Petit, E.; Legrand, Y.M.; Grison, C. Biosourced polymetallic catalysis: A surprising and efficient means to promote the knoevenagel condensation. Front. Chem. 2018, 6, 6–48. [Google Scholar] [CrossRef] [PubMed] [Green Version]
  12. Delplanque, M.; Collet, S.; Del Gratta, F.; Schnuriger, B.; Gaucher, R.; Robinson, B.; Bert, V. Combustion of Salix used for phytoextraction: The fate of metals and viability of the process. Biomass Bioenergy 2013, 49, 160–170. [Google Scholar] [CrossRef]
  13. Bert, V.; Allemon, J.; Sajet, P.; Dieu, S.; Papin, A.; Collet, S.; Gaucher, R.; Chalot, M.; Michiels, B.; Raventos, C. Torrefaction and pyrolysis of metal-enriched poplars from phytotechnologies: Effect of temperature and biomass chlorine content on metal distribution in end-products and valorization options. Biomass Bioenergy 2017, 96, 1–11. [Google Scholar] [CrossRef]
  14. Grignet, A.; De Vaufleury, A.; Papin, A.; Bert, V. Urban soil phytomanagment for Zn and Cd in situ removal, greening, and Zn-rich biomass production taking care of snail exposure. Environ. Sci. Pollut. Res. 2020, 27, 3187–3201. [Google Scholar] [CrossRef] [PubMed]
  15. Ziegler-Devin, I.; Menana, Z.; Chrusciel, L.; Chalot, M.; Bert, V.; Brosse, N. Steam explosion pretreatment of willow grown on phytomanaged soils for bioethanol production. Ind. Crop. Prod. 2019, 140. [Google Scholar] [CrossRef]
  16. Asad, M.; Menana, Z.; Ziegler-Devin, I.; Bert, V.; Chalot, M.; Herzig, R.; Mench, M.; Brosse, N. Pretreatment of trace element-enriched biomasses grown on phytomanaged soils for bioethanol production. Ind. Crop. Prod. 2017, 107, 63–72. [Google Scholar] [CrossRef]
  17. Zheljazkov, V.D.; Craker, L.E.; Xing, B.; Nielsen, N.E.; Wilcox, A. Aromatic plant production on metal contaminated soils. Sci. Total Environ. 2008, 395, 51–62. [Google Scholar] [CrossRef] [PubMed]
  18. Perlein, A.; Bert, V.; Desannaux, O.; Fernandes de Souza, M.; Papin, A.; Gaucher, R.; Zdanevitch, I.; Meers, E. The use of Sorghum in a phytoattenuation strategy: A field experiment on a TE contaminated site. Appl. Sci. 2021, 11, 3471. [Google Scholar] [CrossRef]
  19. Perlein, A.; Zdanevitch, I.; Gaucher, R.; Robinson, B.; Papin, A.; Sahraoui, A.L.H.; Bert, V. Phytomanagement of a metal(loid)-contaminated agricultural site using aromatic and medicinal plants to produce essential oils: Analysis of the metal(loid) fate in the value chain. Environ. Sci. Pollut. Res. 2021. [Google Scholar] [CrossRef]
  20. Spekreijse, J.; Lammens, T.; Parisi, C.; Ronzon, T.; Vis, M. Insights into the European Market. of Bio-Based Chemicals. Analysis Based on Ten Key Product Categories; Publications Office of the European Union: Luxembourg, 2019; ISBN 9789279984204. [Google Scholar]
  21. Shahid, M.; Islam, S.U.; Mohammad, F. Recent advancements in natural dye applications: A review. J. Clean. Prod. 2013, 53, 310–331. [Google Scholar] [CrossRef]
  22. Maurya, I.C.; Singh, S.; Srivastava, P.; Maiti, B.; Bahadur, L. Natural dye extract from Cassia fistula and its application in dye-sensitized solar cell: Experimental and density functional theory studies. Opt. Mater. 2019, 90, 273–280. [Google Scholar] [CrossRef]
  23. Rovira, J.; Domingo, J.L. Human health risks due to exposure to inorganic and organic chemicals from textiles: A review. Environ. Res. 2019, 168, 62–69. [Google Scholar] [CrossRef]
  24. Repon, M.R.; Islam, M.T.; Mamun, M.A.A. Ecological risk assessment and health safety speculation during color fastness properties enhancement of natural dyed cotton through metallic mordants. Fash Text. 2017, 4, 1–17. [Google Scholar] [CrossRef]
  25. Gasparetto, J.C.; Martins, C.A.F.; Hayashi, S.S.; Otuky, M.F.; Pontarolo, R. Ethnobotanical and scientific aspects of Malva sylvestris L.: A millennial herbal medicine. J. Pharm. Pharmacol. 2011, 64, 172–189. [Google Scholar] [CrossRef]
  26. Azab, A. Malva: Food, medicine and chemistry. Eur. Chem. Bull. 2017, 6, 295–320. [Google Scholar] [CrossRef] [Green Version]
  27. Guinot, P.; Rogé, A.; Gargadennec, A.; Garcia, M.; Dupont, D.; Lecoeur, E.; Candelier, L.; Andary, C. Dyeing plants screening: An approach to combine past heritage and present development. Color. Technol. 2006, 122, 93–101. [Google Scholar] [CrossRef]
  28. Despy, J.; Wymeersch, N.; Bouchat, I.; Destree, C.; Burette, A.; Richet, A.; Olive, G. Old inks: Pigments extracted from plants. In Proceedings of the 19e Symposium National on Applied Biological Sciences, Gembloux, Belgium, 7 February 2014. [Google Scholar]
  29. Montiel-Rozas, M.M.; Madejón, E.; Madejón, P. Evaluation of phytostabilizer ability of three ruderal plants in mining soils restored by application of organic amendments. Ecol. Eng. 2015, 83, 431–436. [Google Scholar] [CrossRef]
  30. Montiel-Rozas, M.M.; Madejón, E.; Madejón, P. Effect of heavy metals and organic matter on root exudates (low molecular weight organic acids) of herbaceous specie: An assessment in sand and soil condition under different levels of contamination. Environ. Pollut. 2016, 216, 273–281. [Google Scholar] [CrossRef] [Green Version]
  31. Madejón, E.; Pérez de Mora, A.; Felipe, E.; Burgo, P.; Cabrera, F. Soil amendments reduce trace element solubility in a contaminated soil and allow regrowth of natural vegetation. Environ. Pollut. 2006, 139, 40–52. [Google Scholar] [CrossRef]
  32. Ramavandi, B.; Rahbar, A.; Sahebi, S. Effective removal of Hg2+ from aqueous solutions and seawater by Malva sylvestris. Desalination Water Treat. 2016, 57, 23814–23826. [Google Scholar] [CrossRef]
  33. Ramavandi, B.; Asgari, G. Comparative study of sun-dried and oven-dried Malva sylvestris biomass for high-rate Cu(II° removal from wastewater. Process. Saf. Environ. Prot. 2018, 116, 61–73. [Google Scholar] [CrossRef]
  34. Delfine, S.; Marrelli, M.; Conforti, F.; Formisano, C.; Rigano, D.; Menichini, F.; Senatore, F. Variation of Malva sylvestris essential oil yield, chemical composition and biological activity in response to different environments across Southern Italy. Ind. Crop. Prod. 2017, 98, 29–37. [Google Scholar] [CrossRef]
  35. Phanthavongsa, P. Etude de deux Modalités de Phytomanagement Testées sur un Terrain de Gestion de Sédiments Contaminés par des Métaux et Métalloïdes. Ph.D. Thesis, Ecole Doctorale n°554 Environnements—Santé, Université de Bourgogne Franche-Comté, Besançon, France, 9 April 2018. [Google Scholar]
  36. Infoclimat.fr. Available online: https://www.infoclimat.fr/climatologie/annee/2019/lille-lesquin/valeurs/07015.html (accessed on 30 June 2020).
  37. Graines de Semences. Available online: https://www.graines-semences.com (accessed on 15 February 2021).
  38. Plante Aromatique. Available online: https://www.plantearomatique.com/nos-plantes/188-mauve-sylvestre-4.html (accessed on 15 February 2021).
  39. ISO. Soil quality—Extraction of Trace Elements from Soil Using Ammonium Nitrate Solution; ISO 19730:2008; ISO: Geneva, Switzerland, 2008. [Google Scholar]
  40. Komárek, M.; Chrastný, V.; Štíchová, J. Metal/metalloid contamination and isotopic composition of lead in edible mushrooms and forest soils originating from a smelting area. Environ. Int. 2007, 33, 677–684. [Google Scholar] [CrossRef]
  41. AIDA INERIS. Arrêté du 30/06/20 Modifiant l’arrêté du 9 août 2006 Relatif aux Niveaux à Prendre en Compte lors d’une Analyse de Rejets Dans les Eaux de Surface ou de Sédiments Marins, Estuariens ou Extraits de Cours d’eau ou Canaux Relevant Respectivement des Rubriques 2.2.3.0, 3.2.1.0 et 4.1.3.0 de la Nomenclature Annexée à L’article R. 214-1 du Code de L’environnement. Available online: https://aida.ineris.fr/consultation_document/43365 (accessed on 1 February 2021).
  42. Hinsinger, P.; Plassard, C.; Tang, C.; Jaillard, B. Origins of root-mediated pH change in the rhizosphere and their responses to environmental constraints: A review. Plant. Soil 2003, 248, 43–59. [Google Scholar] [CrossRef]
  43. Kabata-Pendias, A. Trace Elements in Soils and Plants, 4th ed.; Taylor and Francis Group: Oxford, UK, 2011. [Google Scholar]
  44. Jogawat, A.; Yadav, B.; Narayan, O.M. Metal transporter in organelles and their roles in heavy metal transportation and sequestration mechanisms in plants. Physiol. Plant 2021, 173, 259–275. [Google Scholar] [CrossRef]
  45. Singh, B.R.; Gupta, S.K.; Azaizeh, H.; Shilev, S.; Sudre, D.; Song, W.Y.; Martinoia, E.; Mench, M. Safety of food crops on land contaminated with trace elements (review). J. Sci. Food Agric. 2011, 91, 1349–1366. [Google Scholar] [CrossRef] [Green Version]
  46. Unver, M.C.; Ugulu, I.; Durkan, N.; Baslar, S.; Dogan, Y. Heavy metal contents of Malva sylvestris sold as edible greens in the local markets of Izmir. Ekoloji 2015, 96, 13–25. [Google Scholar] [CrossRef] [Green Version]
  47. Hiçsönmez, Ü.; Ereeş, F.S.; Özdemir, C.; Özdemir, A.; Ҫam, S. Determination of major and minor elements in the Malva sylvestris L. from Turkey using ICP-OES techniques. Biol. Trace Elem. Res. 2009, 128, 248–257. [Google Scholar] [CrossRef]
  48. Tokalioğlu, Ş. Determination of trace elements in commonly consumed medicinal herbs by ICP-MS and multivariate analysis. Food Chem. 2012, 134, 2504–2508. [Google Scholar] [CrossRef]
  49. Kostic, D.; Arsić, B.; Randelović, S.; Pavlović, A.; Tošić, S.; Stojanović, G. Correlation analysis of heavy metal contents of Malva sylvestris L. plant and its extracts from polluted and non-polluted locations in Niš, Republic of Serbia. Water Air Soik. Pollut. 2019, 230, 98. [Google Scholar] [CrossRef]
  50. Desideri, D.; Assunta Meli, M.; Roselli, C. Determination of essential and non-essential elements in some medicinal plants by polarized X ray fluorescence spectrometer (EDPXRF). Microchem. J. 2010, 95, 174–180. [Google Scholar] [CrossRef]
  51. Khan, S.; Rehman, S.; Khan, A.Z.; Khan, M.A.; Shah, M.T. Soil and vegetables enrichment with heavy metals from geological sources in Gilgit, northern Pakistan. Ecotoxicol. Environ. Saf. 2010, 73, 1820–1827. [Google Scholar] [CrossRef]
  52. Abe, T.; Fukami, M.; Ogasawara, M. Cadmium accumulation in the shoots and roots of 93 weed species. Soil Sci. Plant Nutr. 2008, 54, 566–573. [Google Scholar] [CrossRef] [Green Version]
  53. Mesquita, D.S.L.M.; Martins, M.; Pisani, L.P.; Ventura, S.P.M.; de Rosso, V.V. Insight on the use of alternative solvents and technologies to recover bio-based food pigments. Compr. Rev. Food Sci. Food Saf. 2021, 20, 787–818. [Google Scholar] [CrossRef]
  54. Prabhu, K.H.; Teli, M.D. Eco-dyeing using Tamarindus indica L. seed coat tannin as a natural mordant for textiles with antibacterial activity. J. Saudi Chem. Soc. 2014, 18, 864–872. [Google Scholar] [CrossRef] [Green Version]
  55. Rezić, I.; Steffan, I. ICP-OES determination of metals present in ttile materials. Microchem. J. 2007, 85, 46–51. [Google Scholar] [CrossRef]
  56. OEKO-Tex. International Association for Research and Testing in the Field of Textile and Leather Ecology. Eco Passport by OEKO-Tex. 2021. Available online: https://www.oeko-tex.com/en/apply-here/eco-passport-by-oeko-tex (accessed on 25 August 2021).
  57. Sungur, Ş.; Gülmez, F. Determination of metal contents of various fibers used in textile industry by MP-AES. J. Spectrosc. 2015, 2015. [Google Scholar] [CrossRef] [Green Version]
  58. OEKO-Tex. International Association for Research and Testing in the Field of Textile and Leather Ecology. Standards 100 by OEKO-Tex. 2021. Available online: https://www.oeko-tex.com/en/downloads (accessed on 11 August 2021).
  59. Rather, L.J.; Islam, S.U.; Shabbir, M.; Bukhari, M.N.; Shahid, M.; Khan, M.A.; Mohammad, F. Ecological dyeing of Woolen yarn with Adhatod vasica natural dye in the presence of biomordants as an alternative copartner to metal mordants. J. If. Environ. Chem. Eng. 2016, 4, 3041–3049. [Google Scholar] [CrossRef]
  60. European Parliament. Regulation (Eu) 2019/1009 of the European Parliament and of the Council of 5 June 2019 Laying down Rules on the Making Available on the Market of EU Fertilising Products and Amending Regulations (EC) No 1069/2009 and (EC) No 1107/2009 and Repealing Regulation (EC) No 2003/2003; European Parliament: Strasbourg, France, 2019. [Google Scholar]
  61. Elallem, K.A.; Sobeh, M.; Boularbah, A.; Yasri, A. Chemically degraded soil rehabilitation process using medicinal and aromatic plants: Review. Environ. Sci. Pollut. Res. 2020, 28, 73–93. [Google Scholar] [CrossRef]
  62. Cao, Z.; Wang, S.; Wang, T.; Chang, Z.; Shen, Z.; Chen, Y. Using contaminated plants involved in phytoremediation for anaerobic digestion. Int. J. Phytoremediation 2015, 17, 201–207. [Google Scholar] [CrossRef]
  63. Wong, M.H.; Cheung, Y.H. Gas production and digestion efficiency of sewage sludge containing elevated toxic metals. Bioressource Technol. 1995, 54, 261–268. [Google Scholar] [CrossRef]
  64. Thewys, T.; Witters, N.; Van Slycken, S.V.; Ruttens, A.; Meers, E.; Tack, F.M.G.; Vangronsveld, J. Economic viability of phytoremediation of a cadmium contaminated agricultural area using energy maize. Part I: Effect on the farmer’s income. Int. J. Phytoremediation 2010, 12, 650–662. [Google Scholar] [CrossRef] [Green Version]
  65. Thewys, T.; Witters, N.; Meers, E.; Vangronsveld, J. Economic viability of phytoremediation of a cadmium contaminated agricultural area using energy maize. Part II: Economics of anaerobic digestion of metal contaminated maize in Belgium. Int. J. Phytoremediation 2010, 12, 663–679. [Google Scholar] [CrossRef] [Green Version]
  66. Witters, N.; Mendelsohn, R.O.; Van Slycken, S.V.; Weyens, N.; Schreurs, E.; Meers, E.; Tack, F.; Carleer, R.; Vangronsveld, J. Phytoremediation, a sustainable remediation technology? Conclusions from a case study. I: Energy production and carbon dioxide abatement. Biomass Bioenergy 2012, 39, 454–469. [Google Scholar] [CrossRef]
  67. Souza, M.F.; Devriendt, N.; Willems, B.; Guisson, R.; Biswas, J.K.; Meers, E. Techno-economic feasibility of extrusion as a pretreatment step for biogas production from grass. BioEnergy Res. 2021. [Google Scholar] [CrossRef]
Figure 1. Aerial pictures of the site experiment and the plot device with the different areas (VSRC: very short rotation coppice; Area 1; Area 2; and Area 3), Malva sylvestris L. sowing design, and pictures of the different actions realized on the field.
Applsci 11 10613 g001
Figure 2. Sediment NH4NO3 extractable concentration of Zn, Cd, Pb, and Cu in Area 1 (green), Area 2 (blue), and Area 3 (orange) at the start (n = 5) and at harvest (n = 10). The box plots indicate the median (black line), the 25 (lower bar), and the 75 (upper bar) percentiles; red cross = mean; the red line corresponds to the value references noticed in the ISO 19730:2008€. Significant differences between conditions after Tukey HSD test are indicated by different letters at the level of α = 0.05.
Applsci 11 10613 g002
Figure 3. Color of the pretreated fabrics before and after the dyeing with Malva sylvestris L. extract. The small fabric squares are cotton, and the large fabric squares are silk.
Applsci 11 10613 g003
Table 1. Main physico-chemical properties, total and NH4NO3 extractable (between parenthesis) concentrations of TE in the sediment of the field site for each area, and TE threshold values (S1) for sediment management. TE are expressed in mg Kg−1 DW. With the exception of the sediment parameters (n = 1), values are means ± standard deviation (SD) (n = 5 for total TE; n = 3 for NH4NO3 extractable).
ParametersArea 1Area 2 Area 3S1 *
Clay (%)7.710.711.69-
Silt (%)6970.578.52-
Sand (%)23.318.89.79-
Sediment texture
(USDA texture triangle)
Fine siltFine siltFine silt-
Carbon (g kg−1)76.382.496.8-
Organic matter (g kg−1)131.3141.7166.5-
C/N **28.42831.5-
CEC (meq 100 g−1) +17.6 17.921.2-
CaO g kg−111.711.512.5-
TKN (g kg−1) ++2.692.943.07-
Phosphorus Olsen
(g kg−1) P2O5
0.2160.2590.258-
pH-H2O8.08 8.068.12-
Total TE
(mg kg−1)
(TE extractable concentration (mg kg−1))
Zn6685 ± 509
(3.86 ± 0.39)
6084 ± 132
(5.66 ± 0.59)
8980 ± 340
(7.32 ± 1.46)
300
Pb774 ± 18
(0.05 ± 0.02)
592 ± 12
(0.04 ± 0.008)
1043 ± 12
(0.06 ± 0.03)
100
Cd6.3 ± 0.14
(0.03 ± 0.005)
5 ± 0.08
(0.04 ± 0.003)
9 ± 0.13
(0.05 ± 0.008)
2
Cu87 ± 2.3
(0.41 ± 0.06)
76 ± 1.5
(0.52 ± 0.08)
101 ± 1.3
(0.48 ± 0.07)
100
*: [41], **: carbon/nitrogen, +: cationic exchange capacity, ++: total Kjeldahl nitrogen.
Table 2. Yield, percentage of flowers, and plant dry weight in the three areas. For the mean dry weight, significant differences between areas are indicated by different letters at the levels of α = 0.05. Standard deviation (SD) is expressed between parenthesis for the dry weight and flower percent (n = 10).
Area 1Area 2Area 3
Mean dry weight (g plant−1) 81.8 (±23.9) a89.8 (±23.2) a126.5 (±28.5) b
Yield (Kg 25 m−2 FW)31.626.338.9
Yield extrapolated (ton ha−1 FW)12.610.515.5
Yield extrapolated (ton ha−1 DW)2.32.22.9
Mean flower % by plant (FW)10.3 (±2.6)8.4 (±1.9)8.4 (±1.6)
Flower Yield extrapolated (ton ha−1 FW)1.30.91.3
Flower Yield extrapolated (ton ha−1 DW)0.2410.1450.226
FW: fresh weight, DW: dry weight.
Table 3. Concentrations of Zn, Cd, Pb, and Cu (µg g−1 of DW) in the flower, stem, and leaf parts of plants (n = 10) collected from the three areas (mean + SD). For each TE and each area, the concentrations between the three parts were compared. Significant differences are indicated by different letters (lowercase, uppercase), numbers (normal, italics) at the level of α = 0.05 (Tukey HSD test).
CdCuPbZn
FlowerStemLeafFlowerStemLeafFlowerStemLeafFlowerStemLeaf
Area 10.94 (±0.21) A1.08 (±0.22) A2.15 (±0.41) B14.81 (±4.64) a8.68 (±1.61) b13.18 (±2.85) a9.54 (±5.45) 11.52 (±1.13) 25.67 (±4.33) 1,2186.04 (±49.41) 1188.35 (±37.14) 1465.33 (±96.92) 2
Area 20.93 (±0.2) A1.08 (±0.25) A2.07 (±0.47) B11.65 (±0.87) a,b7.73 (±1.56) b11.11 (±2.72) a,b9.88 (±4.63) 11.28 (±0.34) 27.02 (±2.79) 1,2175.03 (±40.5) 1175.32 (±29.78) 1453.79 (±92.69) 2
Area 30.95 (±0.16) A1.1 (±0.28) A2.18 (±0.45) B12.79 (±1.15) a,b8.05 (±4.23) b12.05 (±3.38) a,b11.28 (±10.79) 11.36 (±0.38) 27.3 (±5.18) 1,2201.85 (±66.76) 1227.09 (±54.47) 1567.72 (±95.73) 3
Table 4. TE concentration in the aerial part (shoots and flower, µg g−1 DW) and bioconcentration factor (BCF) of M. sylvestris L. cultivated in the three areas and TE concentration in the aerial part and flower of M. sylvestris L. cultivated in the uncontaminated site (control). With the exception of the M. sylvestris control flower (n = 1), the results are reported as means ± standard deviations (SD) (n = 10 for shoots from the 3 areas and corresponding BCF; n = 3 for shoots of M. sylvestris control). Significant differences between areas are indicated by different letters or numbers at the level of α = 0.05 (lowercase for BCF tot; uppercase for BCF ext, number for shoots).
CdCuPb Zn
Area 1 (Shoots)1.54 (0.27)11.6 (2.06)4.37 (2.9)315.38 (72.98) 1
BCF tot0.246 (0.044) A0.133 (0.024) A0.006 (0.004)0.047 (0.011)
BCF ext50.62 (12.32) a22.49 (5.13) a70.47 (45.41)66.31 (14.96)
Area 2 (Shoots)1.55 (0.35)9.63 (1.52)4.72 (1.72)310.43 (61.08) 1
BCF tot0.297 (0.068) B0.126 (0.02) A0.008 (0.003)0.051 (0.01)
BCF ext45.04 (13.2) a17.49 (4.28) b78.53 (45.44)53.91 (11.35)
Area 3 (Shoots)1.6 (0.27)10.40 (2.94)5.16 (3.43)386.37 (56.51) 2
BCF tot0.181 (0.03) C0.103 (0.029) B0.005 (0.003)0.043 (0.004)
BCF ext33.54 (8.78) b16.74 (4.49) b93.52 (69.51)58.54 (17.56)
M. sylvestris control(Shoots)0.25 (0.07)14.1 (3.3)0.42 (0.09)84 (29)
(Flower)0.447.80.2247
BCF ext = [TE] shoots/[TE] sediment extractable, BCF tot = [TE] shoots/[TE] sediment total.
Table 5. TE concentration in the dye extract solution (µg L−1 and µg g−1 of dye extract solution; n = 1).
Dye
Extract
Area 1
Dye
Extract
Area 2
Dye
Extract
Area 3
Dye
Extract
RT *
Dye
Extract
10 °C
Usual Concentration
in Dye **
Eco Passport
Threshold
Value ***
Cdµg L−10.960.870.881.080.66--
µg g−10.00010.00090.00090.0010.0007120
Cuµg L−1105.369.874.745.147.3--
µg g−10.1050.070.0750.0450.04733–110250
Pbµg L−13.994.866.363.022.81--
µg g−10.0040.0050.0060.0030.0036–5290
Znµg L−1110819601945584683
µg g−11.11.961.950.580.683–321500
* RT: room temperature, reported ** in [55], *** Eco passport by OEKO-Tex [56].
Table 6. TE concentration (µg g−1) in the fabrics (cotton and silk) before and after dyeing according to the area and the pretreatment modalities (n = 1).
CdCuPbZn
Before dyeingCotton unpretreated0.01 *0.160.042.67
Silk unpretreated0.01 *0.590.115.80
Cotton alum treated0.01 *1.080.061.67
Silk alum treated0.01 *4.180.112.60
Cotton iron treated0.01 *1.140.103.02
Silk iron treated0.01 *8.720.198.71
After dyeing
Area 1
Cotton untreated0.01 *1.670.2010.28
Cotton alum treated0.01 *2.350.106.17
Cotton iron treated0.01 *1.900.1919.98
Silk untreated0.0710.570.1924.75
Silk alum treated0.069.740.3129.27
Silk iron treated0.1012.790.6950.10
After dyeing
Area 2
Cotton untreated0.030.210.456.44
Cotton alum treated0.020.280.385.86
Cotton iron treated0.030.290.568.56
Silk untreated0.100.510.3611.45
Silk alum treated0.080.520.6916.33
Silk iron treated0.091.031.3418.48
After dyeing
Area 3
Cotton untreated0.01 *1.440.179.57
Cotton alum treated0.01 *1.110.073.64
Cotton iron treated0.031.960.2617.40
Silk untreated0.0710.330.2221.30
Silk alum treated0.078.650.4330.10
Silk iron treated0.0810.090.8932.19
* Limit of Quantification (LoQ).
Publisher’s Note: MDPI stays neutral with regard to jurisdictional claims in published maps and institutional affiliations.

