Article

Determining the Print Quality Due to Deformation of the Halftone Dots in Flexography

1
Department of Art Studies, University North, Trg dr. Žarka Dolinara 1, 48000 Koprivnica, Croatia
2
Department for Packaging, Recycling and Environmental Protection, University North, Trg dr. Žarka Dolinara 1, 48000 Koprivnica, Croatia
3
HON-ING d.o.o., Vrankovec bb, 49231 Sveti Križ Začretje, Croatia
4
Department of Multimedia, University North, 104. Brigade 3, 42000 Varaždin, Croatia
*
Author to whom correspondence should be addressed.
Appl. Sci. 2021, 11(22), 10601; https://doi.org/10.3390/app112210601
Submission received: 10 October 2021 / Revised: 31 October 2021 / Accepted: 9 November 2021 / Published: 11 November 2021

Abstract

:
This paper researches the issues related to the print quality in flexography, especially the influence of the print run and inadequate printing settings on dot deformation. Dot deformation can lead to inconsistencies in print quality, such as a loss of highlight tones or an unpredictable increase in tonal value. This research was conducted on two concrete examples of flexible packaging printed on transparent films. All significant parameters of dot deformation were evaluated, including dot coverage, dot sharpness and the uniformity of the ink density. The increase in the coverage values in the midtones was linear throughout the entire print run, while in the light tones, it was more logarithmic. The overall percentage deviations from the reference value were 6.3% in the midtones and 52.6% in the light area. The increase in dot coverage was due to the wear of the polymer plate, which caused the side shoulders of the dot to become a part of the printing surface. An analysis of the ink density showed a much more homogeneous shape of the dot at the beginning of the print run. The correct ratio of the anilox roller line screen to the line ruling of the printing plate is important in order to ensure a minimum dot size in print.

1. Introduction

The development and progress of flexography is constantly increasing, and it can be said that the developments and trends in food packaging are responsible for such great expansion of this printing technique. Flexography is based on a simple concept of ink transfer, but a closer look at the process can reveal many variables that affect the transfer of ink and, of course, the final quality of the reproduction [1]. The quality of the reproduction is conditioned by a combination of various parameters concerning the properties of the plates [2] and the processing of photopolymer printing plates [3], anilox rollers, printing pressure and the properties of the printing substrates [4]. Therefore, in flexography, it is necessary to define the entire process or at least a larger part of the process as precisely as possible [5]. The most common, and at the same time most efficient mode, of achieving the best print quality is coordination with the goal values in the ISO 12647-6 standard [6].
Due to the elastic printing plates, this printing technique makes it possible to print on a variety of absorbent and non-absorbent printing media, such as thin films, flexible and rigid foils, almost all papers, cardboards of various thicknesses and weights and rough surface packaging materials [7]. PLA films, as non-absorbent materials, require modification of the surface before the printing process in order to improve the wettability of the substrate and to obtain proper ink adhesion to the substrate [8]. Dot deformation is a term that refers to the quality of halftone dots, such as dot sharpness, edge smoothness and the uniformity of the density across dots, as influenced by different characteristics of the printing process [9].
Digital technologies for the production of polymer plates pay great attention to the dot geometry, although recently, the emphasis has been on the shape of the top of the dot. The shoulders of the dot serve as a support for the printing surface, and the shoulder angle itself plays a significant role during printing [10]. One of the most widespread printing plate manufacturing processes is based on the Laser Ablative Mask System (LAMS) technology, and its characteristic is the rounded top of the dot [11]. Printing plates come into contact and interact with various liquid media during their processing and operation, resulting in plate swelling [12]. Swelling alters the plate deformation properties and thus has an effect on increasing the tonal values in the print.
The development of flexographic printing machines and the application of advanced technologies for making polymer plates has enabled a considerable increase in print quality. The print consists of finer dots which ultimately create the image on the print. Various anomalies in dots result in reduced print quality (e.g., more or less visible errors like excessive dot gain, halo effect, the doughnuts or hollow dots effect, dot bridging, filling-in effect and dirty print). This paper is a continuation of previous research aimed at defining the optimal qualitative parameters in the flexographic printing process with the aim of increasing the print quality primarily for the highlight tones.

2. Tone Reproduction in Flexography

Dot coverage is expressed as a percentage and typically varies from 1% up to 100%. Low coverages less than 10% are commonly called highlight areas; coverages between 10% and 25% are referred to as light tones; coverages between 25% and 60% are referred to as midtones; and high coverages between 60% and 100% are referred to as shadows [13]. The reproduction of highlight tones at low line rulings is a great challenge for the flexographic printing process, and that is exactly what will be the subject of this research. The flexo break effect creates a visible rough transition due to the loss of dots at lower tonal values [14]. The ratio of the dot size on the polymer plate to the cell size of the anilox roller has a direct impact on the quality of a reproduction [15]. Depending on the type of screening technologies, line rulings, the ability of the printing process and the type of material, the minimum dot size that can be maintained on the polymer plate and in the printing process is determined [16]. The minimum isolated dot size indicates what the ability of the plate system to reproduce a self-sustaining single printing dot without the presence of surrounding dots that help sustain it with their shoulders is [17].
The relationship between the plate dot size and the anilox roller line screen can be shown through three specific situations [18] shown in Figure 1. The ink film thickness is more homogeneous when a larger number of cells support one dot (situation 1). When the dot is supported by the cell wall of a single anilox cell, it is wetted by a maximum amount of ink (situation 2), and when the dot is smaller than the cell, it sinks into the cell and is covered with too much ink (situation 3), which is the so-called “dot dipping” effect [19].
There are several options for solving the problem of the “dot dipping” effect by manipulation with the prepress and printing settings:
  • Decrease the line ruling on the printing plate. This increases the minimum dot size on the printing plate and thus optimizes the ratio to the cell size of the anilox roller. The print quality is generally reduced;
  • Use an anilox roller of a higher line count, if available. This leads to a smaller cell opening size and hence a better adjustment to the minimum size of the dot;
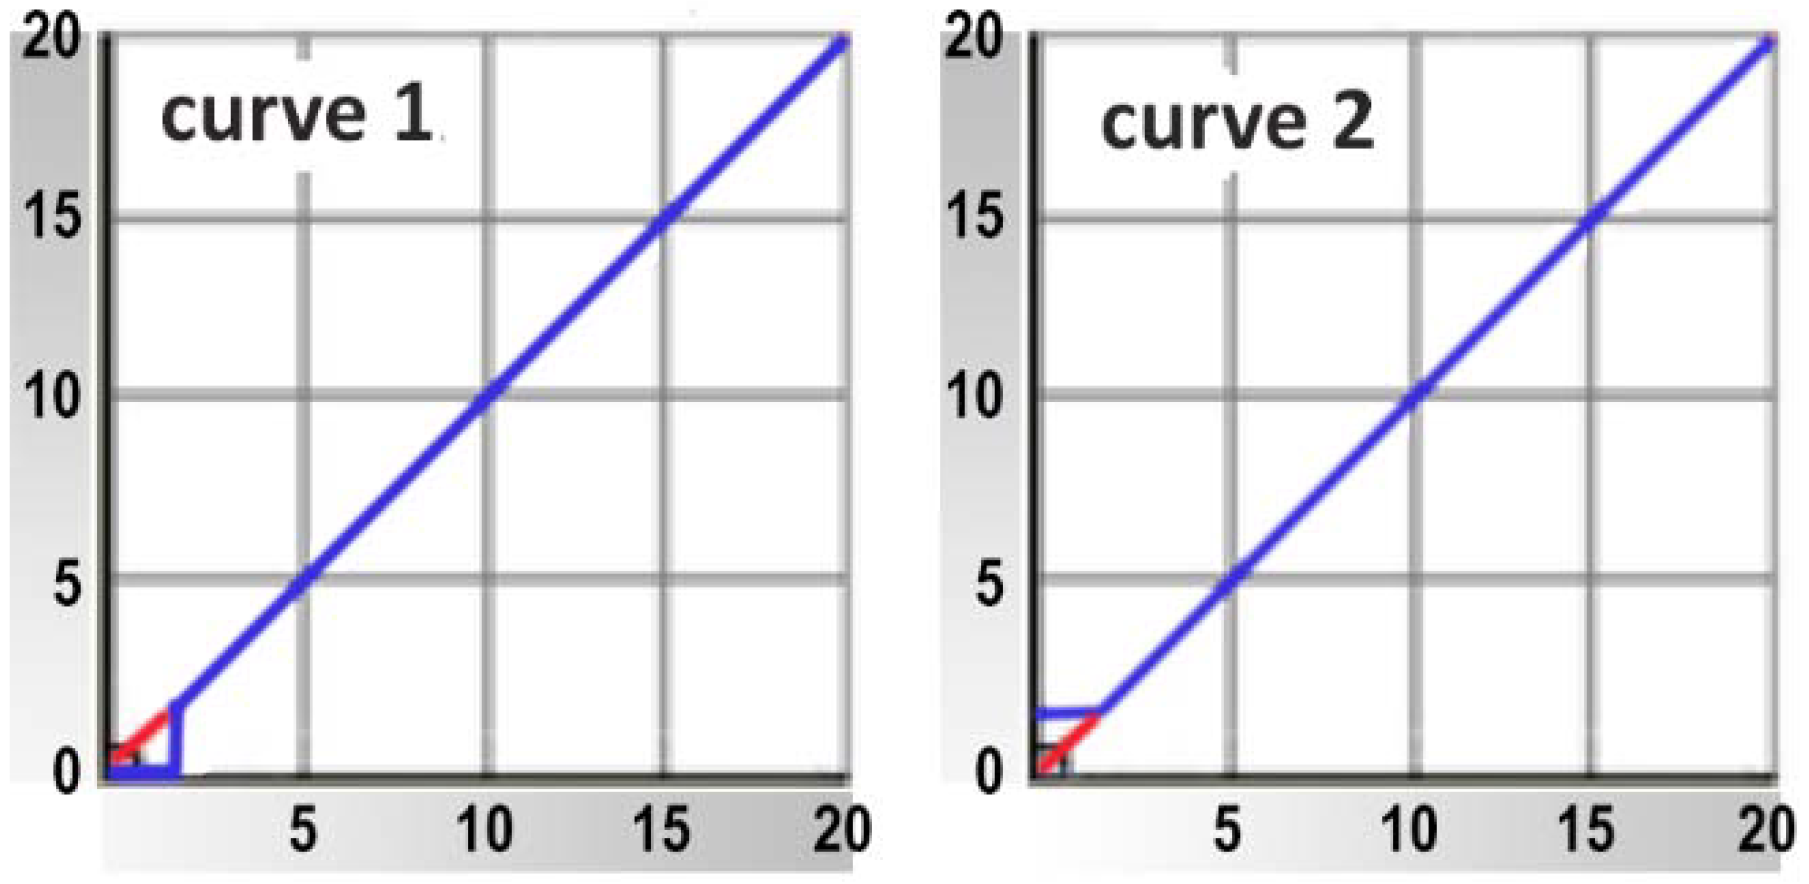
  • Increase the size of the minimum dot by using a “bump-up” curve in the prepress. This means keeping the same line ruling of the polymer plate, which also reduces the tonal range on printouts;
  • Apply advanced hybrid screening technologies that, via a different approach, allow better reproduction of highlight tones [20].
Pressure in printing is a parameter that significantly affects ink transfer, and that will also be a subject of research in this paper. The printing pressure can be adjusted at three points: (1) between the doctor blade and the anilox roller, (2) between the anilox roller and the printing plate and (3) between the printing plate and the printing cylinder (Figure 2). A change in the pressure between the printing plate and the printing cylinder has the greatest impact on the tonal value increase and thus on the print quality [21].
Research of the influence of the printing pressure has shown that the percentage of ink transfer increases with an increase in the printing pressure [22], and once the ink transfer reaches its maximum, there is no further increase in ink transfer regardless of a further increase in the printing pressure [23]. Light (also known as kiss) pressure is very important for quality reproduction because it prevents the “halo” effect and optimizes the tonal value increase (TVI). Light pressure is the lowest possible pressure at which the ink is transferred from all printing surfaces to the printing substrate [24]. Very often, it is not easy to print with light pressure, primarily due to the characteristics of the surface of the printing substrate, the uneven height of the printing elements or the type of work that is to be printed (e.g., solid tone printing, combined printing or process printing). On the other hand, if the pressure is too high (nip engagement > 150 µm), the dots will be squeezed more, and deformities can occur [25]. The surface of the plate will be outside the print diameter, so a slurring effect will occur at the places of contact between the plate and the printing substrate due to the faster circumferential speed of the plate surface. Otherwise, if the compression is too low (nip engagement < 20 µm), slurring also occurs due to the lower circumferential speed of the plate surface. There are many potential parameters from the domain of prepress and printing that affect the deformation of dots directly or indirectly. The prepress parameters are related to the settings of the halftone screening, specifications of polymer plate, geometry of the plate dot and type of plate surface pattern. The printing parameters are related to the printing pressure settings, type of substrate, print run size, printing speed, anilox roller specification and also mounting adhesive tape specifications.

3. Methods

The main goal of this research was to determine the print quality caused by the deformation of dots in flexography. To achieve the given goal, it was necessary to analyze the causes of certain types of deformations of dots on the printouts, determine the acceptability of the quality of the printouts thus obtained and find a solution to eliminate the problem. According to the characteristics of the flexographic printing process, it can be determined that there are many variable parameters that can disrupt the harmony of the dots and thus affect the visual impression of the reproduction. The research was based on the analysis of the imprints of two types of flexible labels in a roll, and the aim was to determine the most common dot deformations when printing this type of packaging.
A Nilpeter FB4200 8-color flexo in-line printing machine with a max printing width of 450 mm was used for printing. Printing was performed using the principle “from roll to roll”, with a printing speed of 120 m/min and UV ink applied. The optimal anilox line count for printing defined in cells per inch (cpi) or cells per centimeter (c/cm) was determined in line with the halftone screen and minimum dot size [26]. The anilox roller line count for the black color was smaller than for the other process colors. A smaller line count signified that a larger amount of ink could be transferred, which was determined by the volume of the anilox roller. This allows for a thicker ink film, which achieves a higher color density. This is especially important if higher coverage of a particular color in the print is required. The printing substrate is transparent, which means that the opaque white color is also used in printing. In order to achieve a higher opacity level of white color, an anilox roller of a larger volume and smaller line count is used [27]. Printing was performed on the back of a transparent printing substrate. Such printing is called reverse-side printing or back printing, and the order of colors in the print was reversed in relation to the printing on the front side, with the white color at the end. After printing, the graphic was legible on the front side of the printing substrate and not on the side of the printing substrate where the inks were printed. Table 1 shows the technical specifications of the entire printing process used in both experiments.
Many deformations of dots occur during the plate-making process [28] and the preparation of the printing machine. Some of them can be very easily spotted and effectively eliminated. However, when the dot deformation occurs during the printing process, often the error is not noticed in time. It is possible that non-compliant products are not registered and that such a final product reaches the customer. This research deals precisely with such examples. Very often, it is a variation of certain parameters of the printing process that change during printing, especially during the printing of large print runs.
In order to analyze the deformation of the dot on the print, it was necessary to capture the selected areas on the printouts. For this purpose, the Dino-Lite AM4000 digital microscope was used, with a 1.3-megapixel resolution and a built-in LED light that enabled a better view of the tiny elements. The ability to enlarge the image was in the range of 10, 50, 100, 200 and 250 times. This type of microscope is used in a variety of research in order to view tiny dots that are not visible to the naked eye. The Dino Capture 2.0 software was used to measure the physical dot size on the captured images, and ImageJ software was used for image analysis. The need for objective image quality analysis still exists [29], and it can be a critical component in process control and failure analysis [30].

4. Results

This chapter presents an analysis of the results and a discussion related to the two types of the deformation of dots caused by the print run size and incorrect printing settings formed in the process of flexible packaging printing.

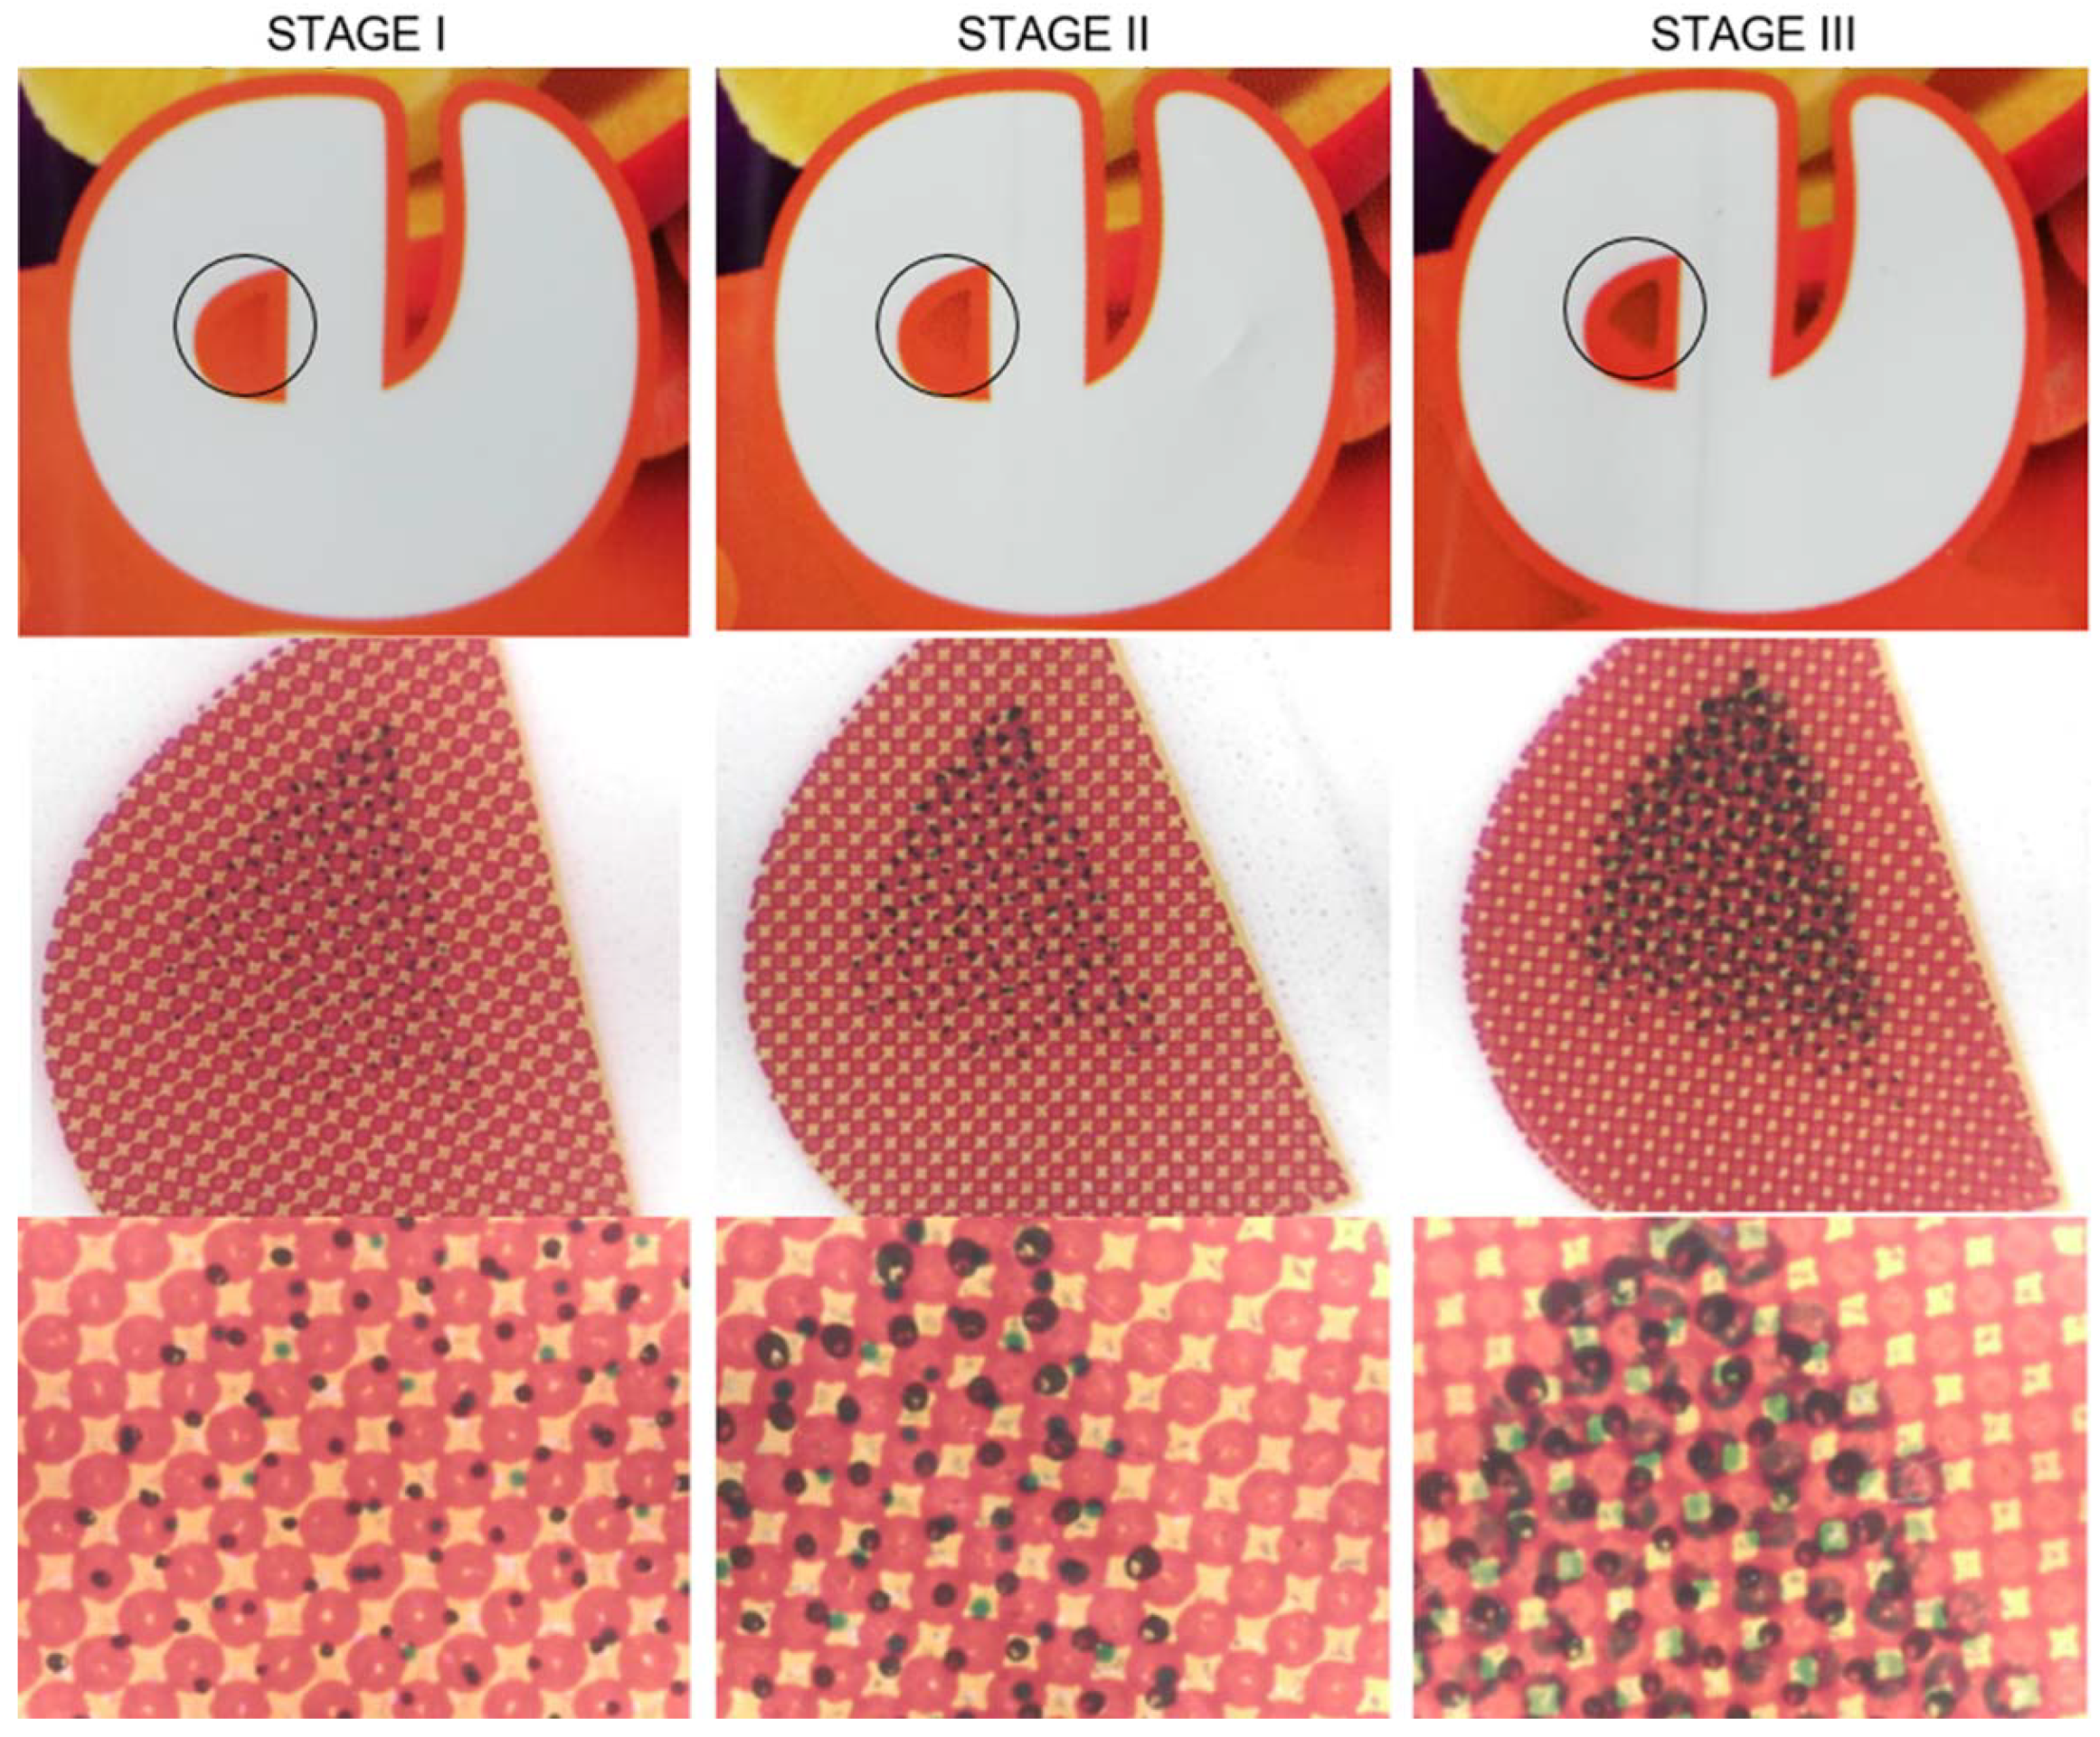
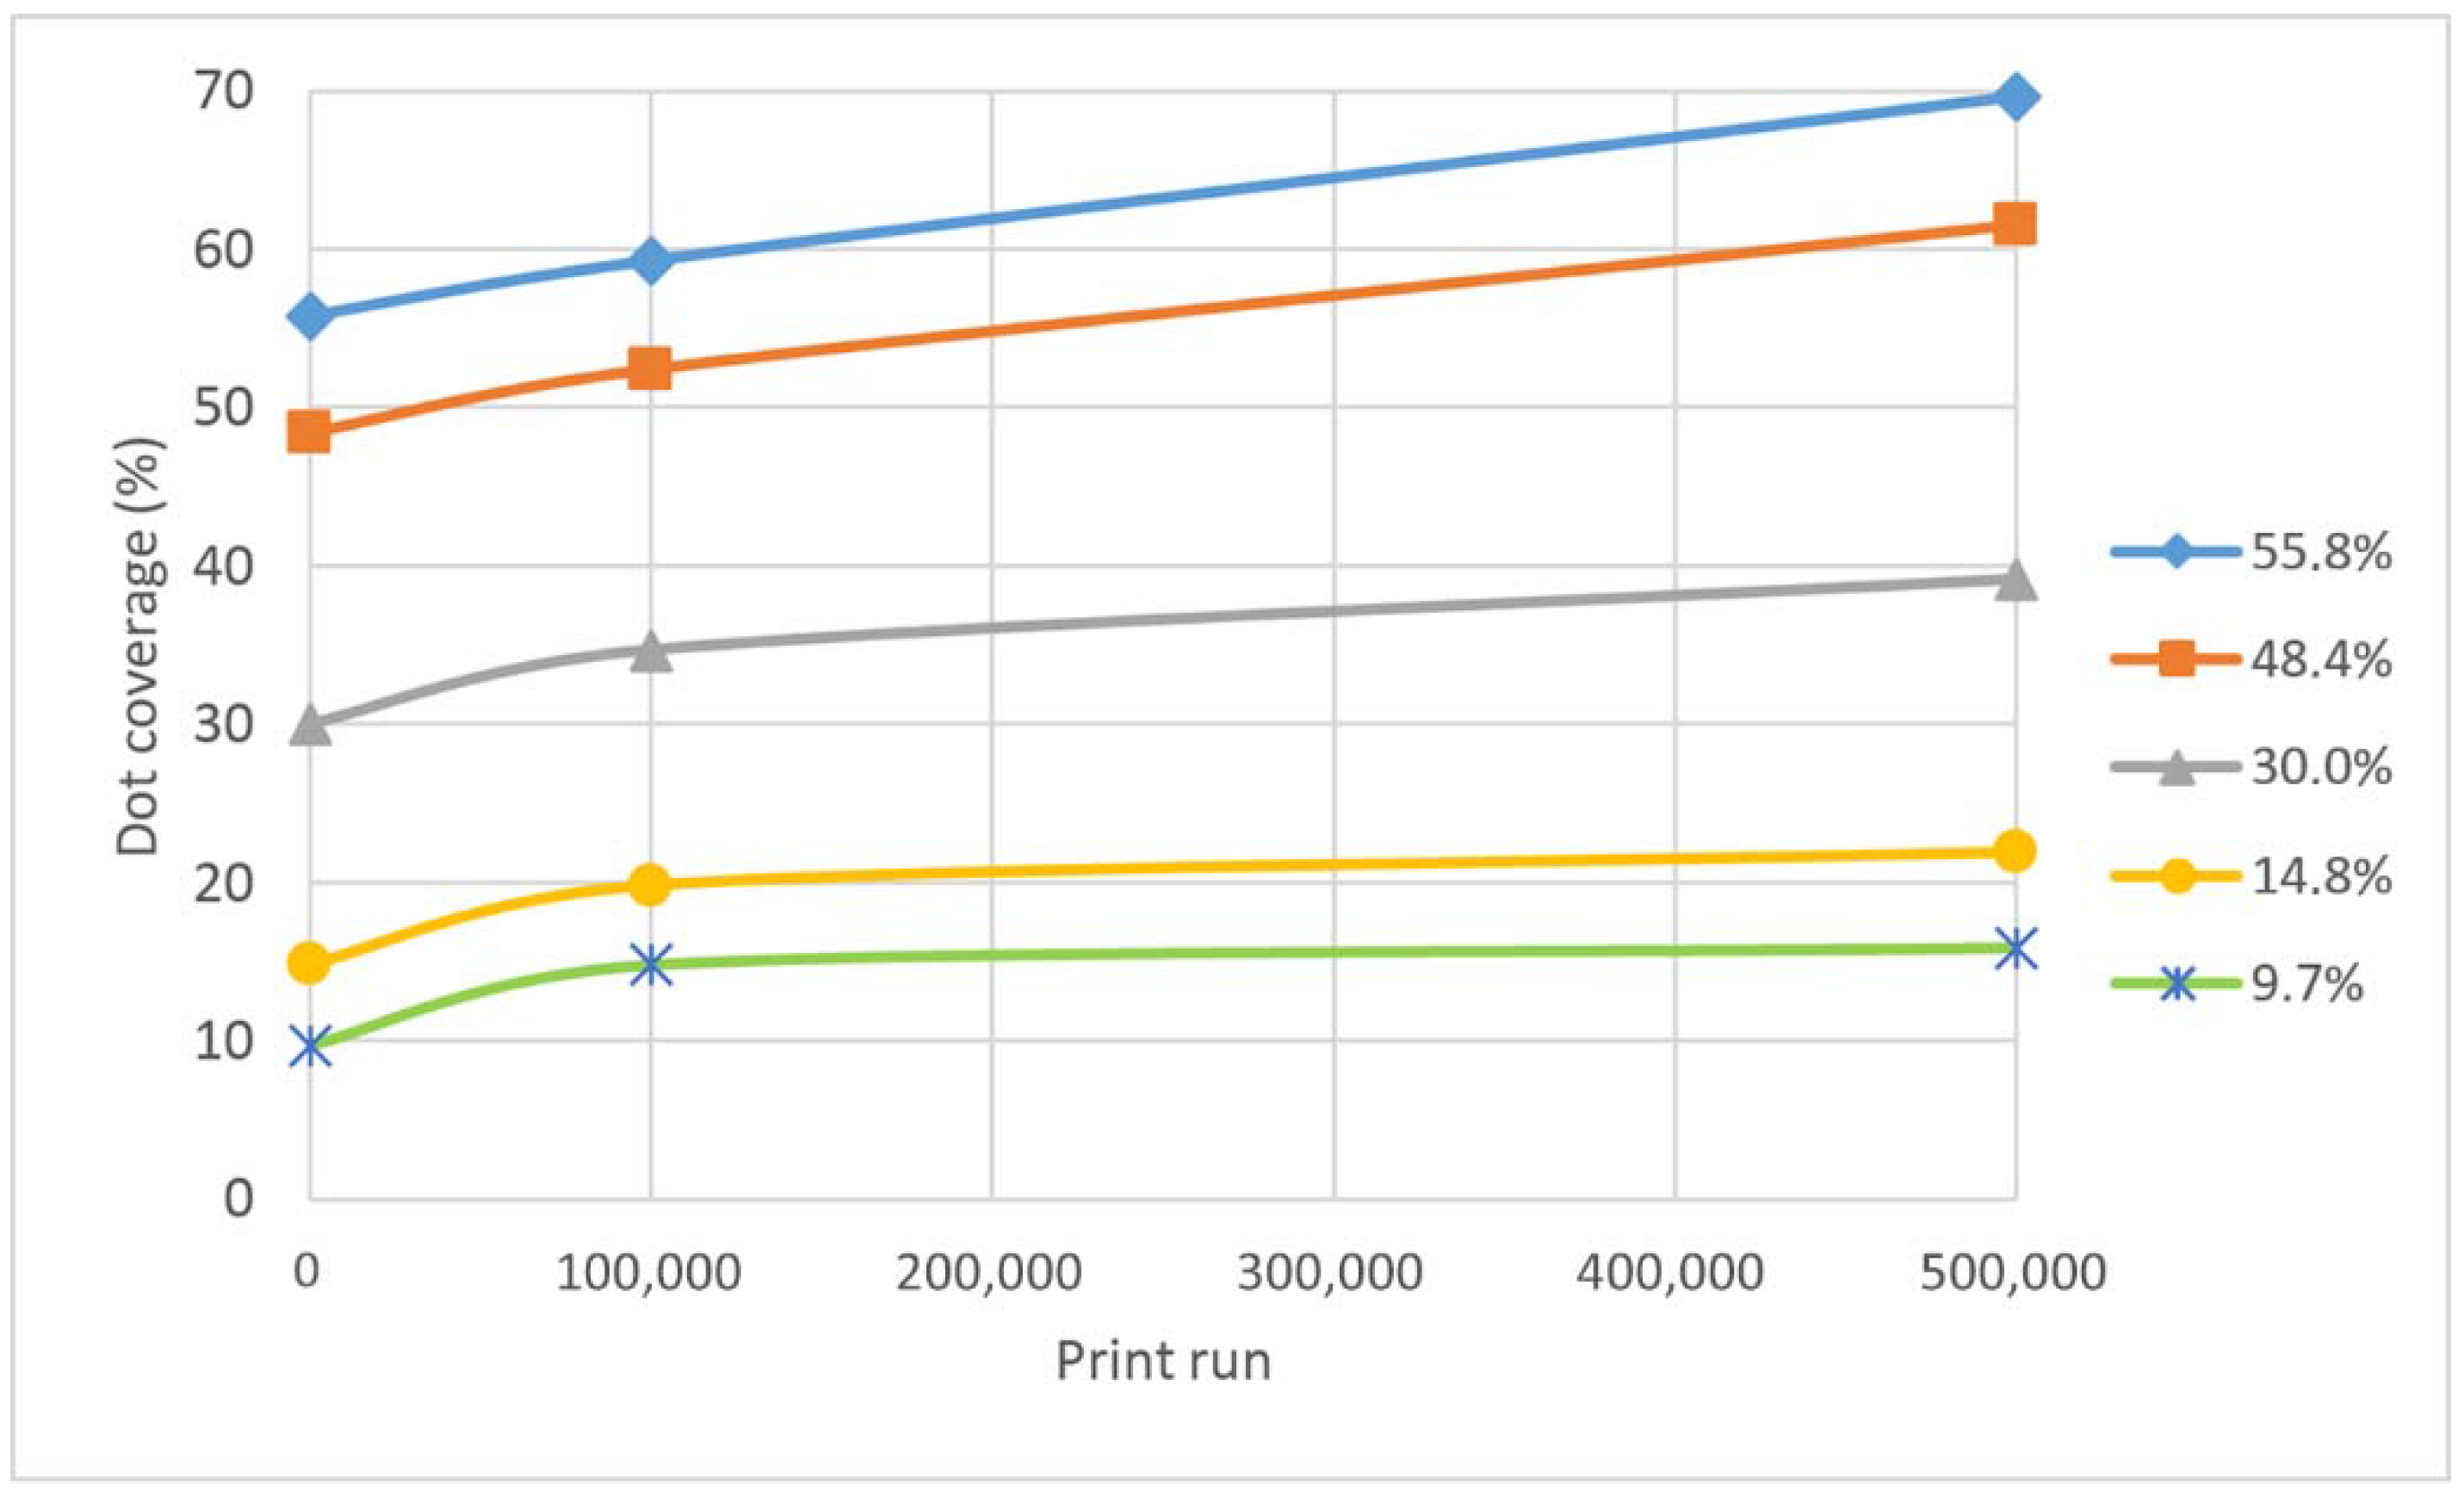
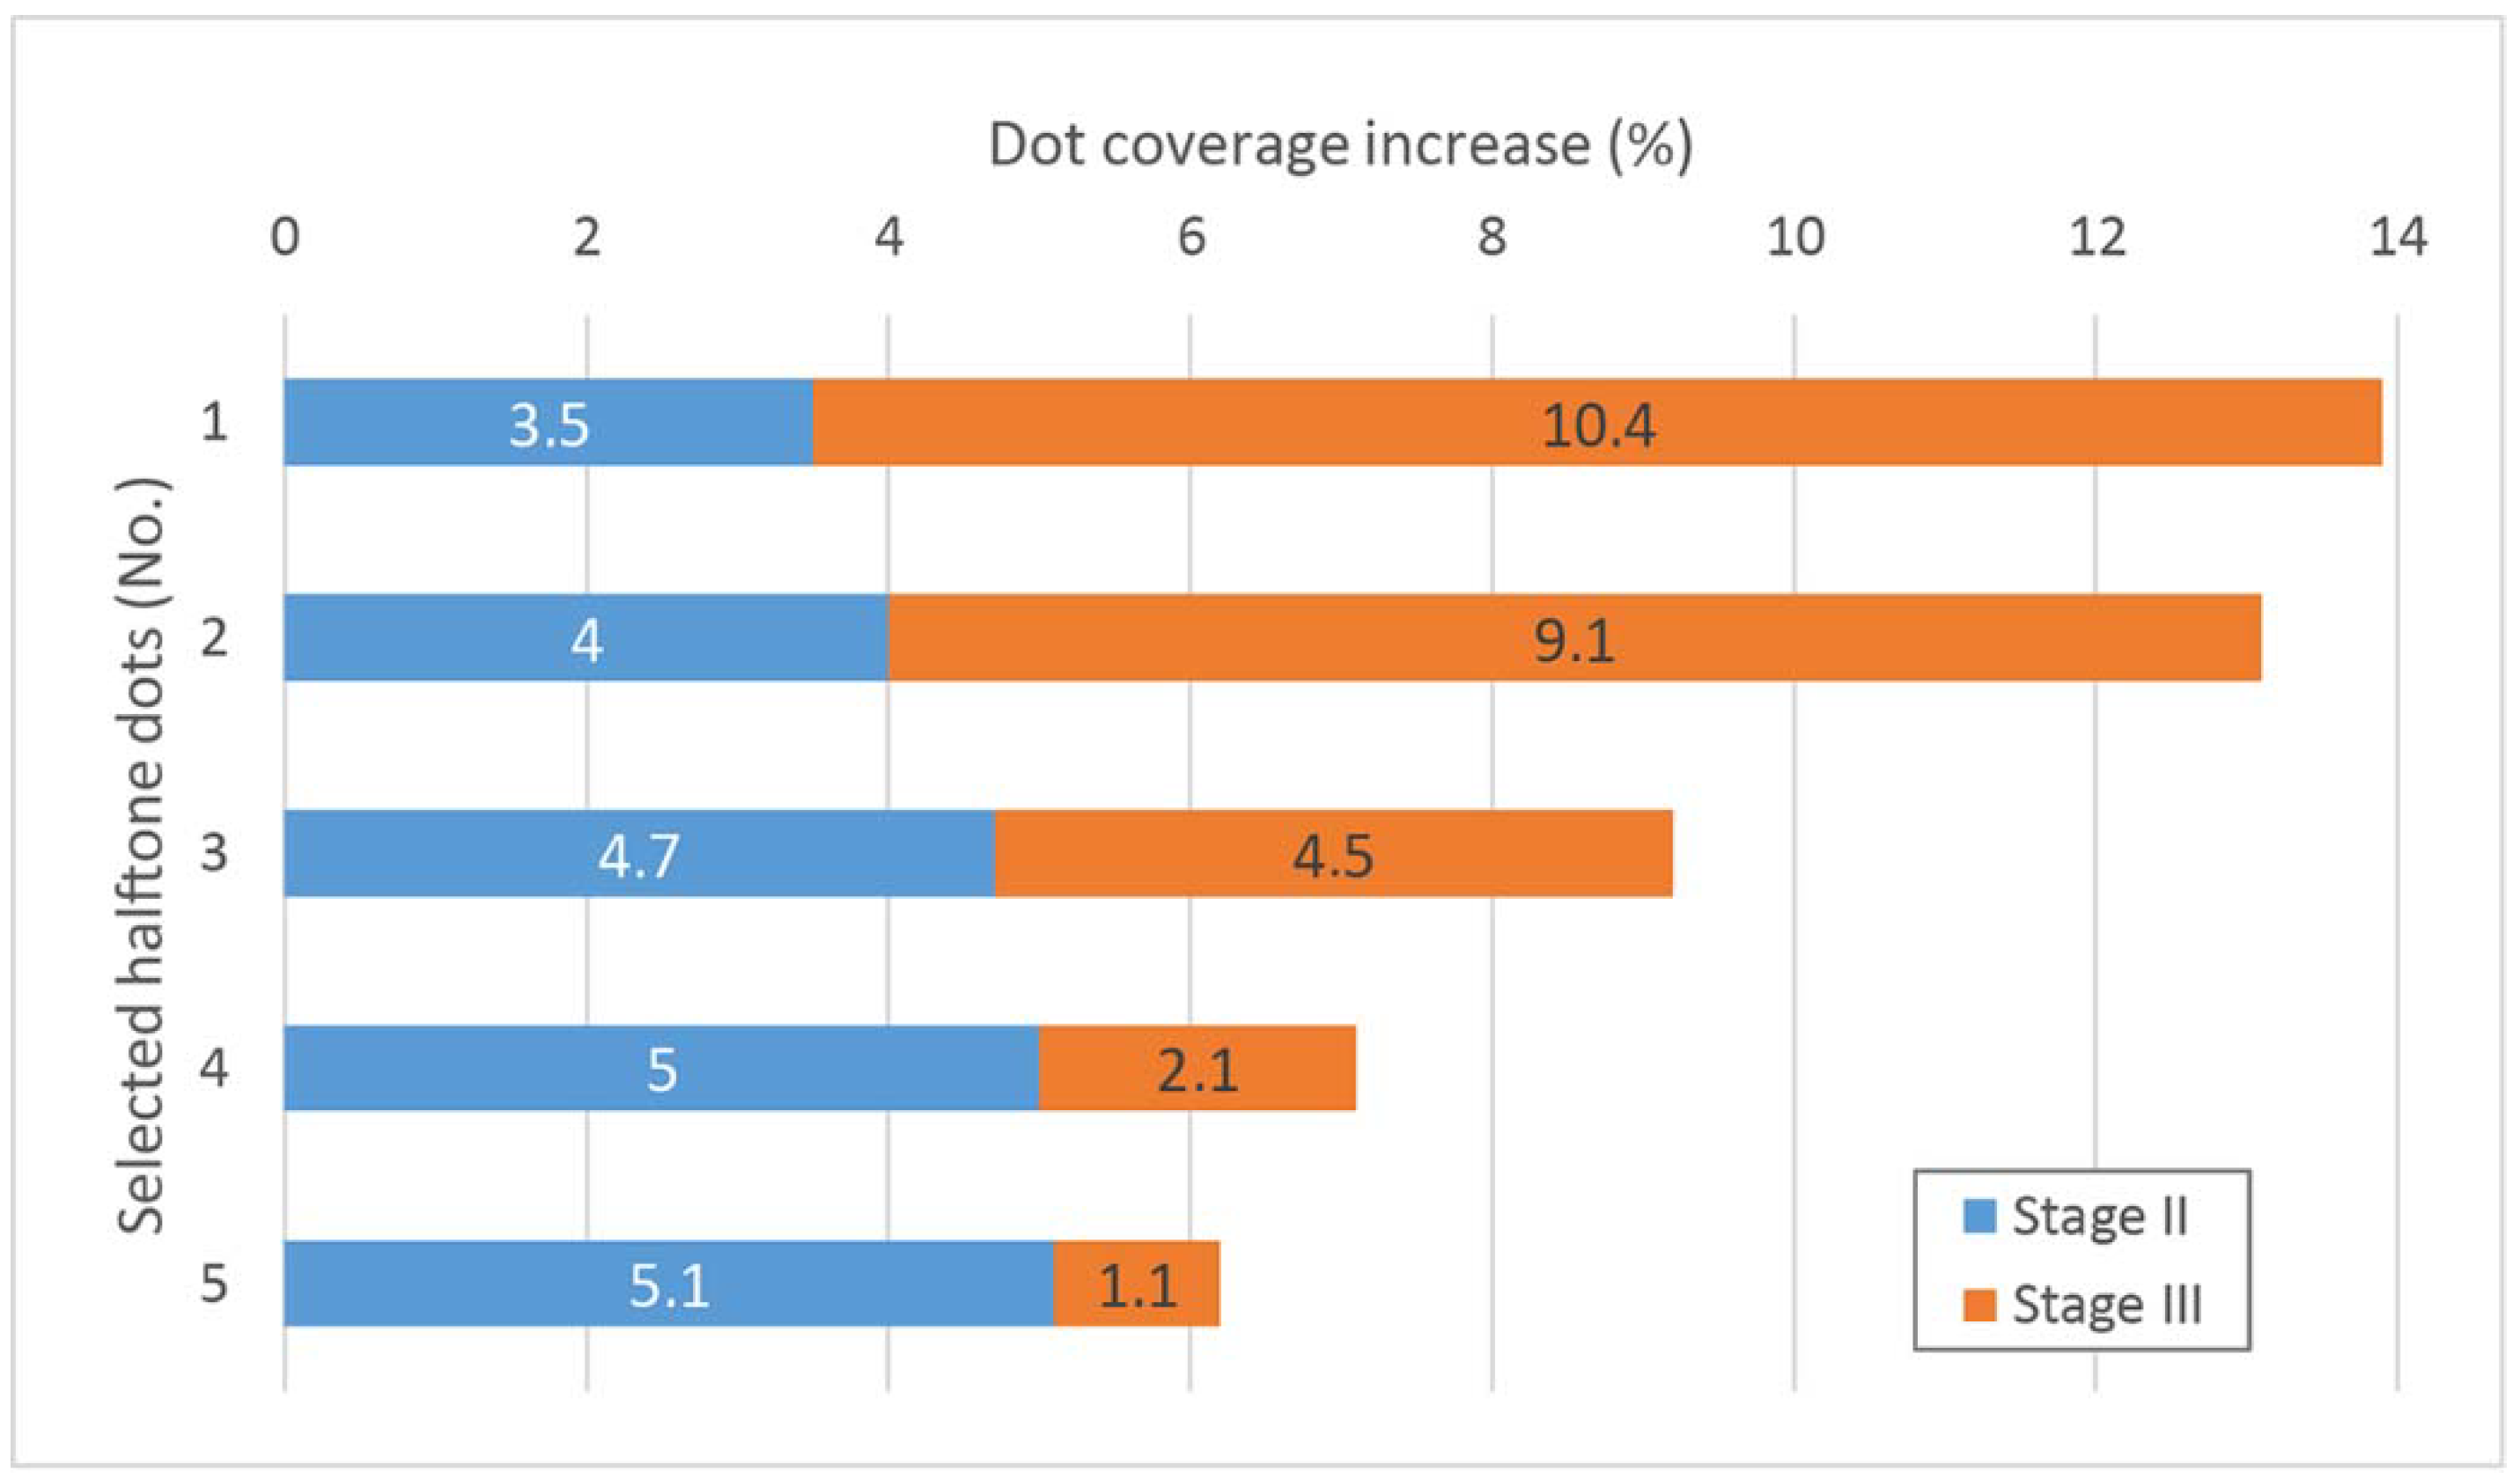
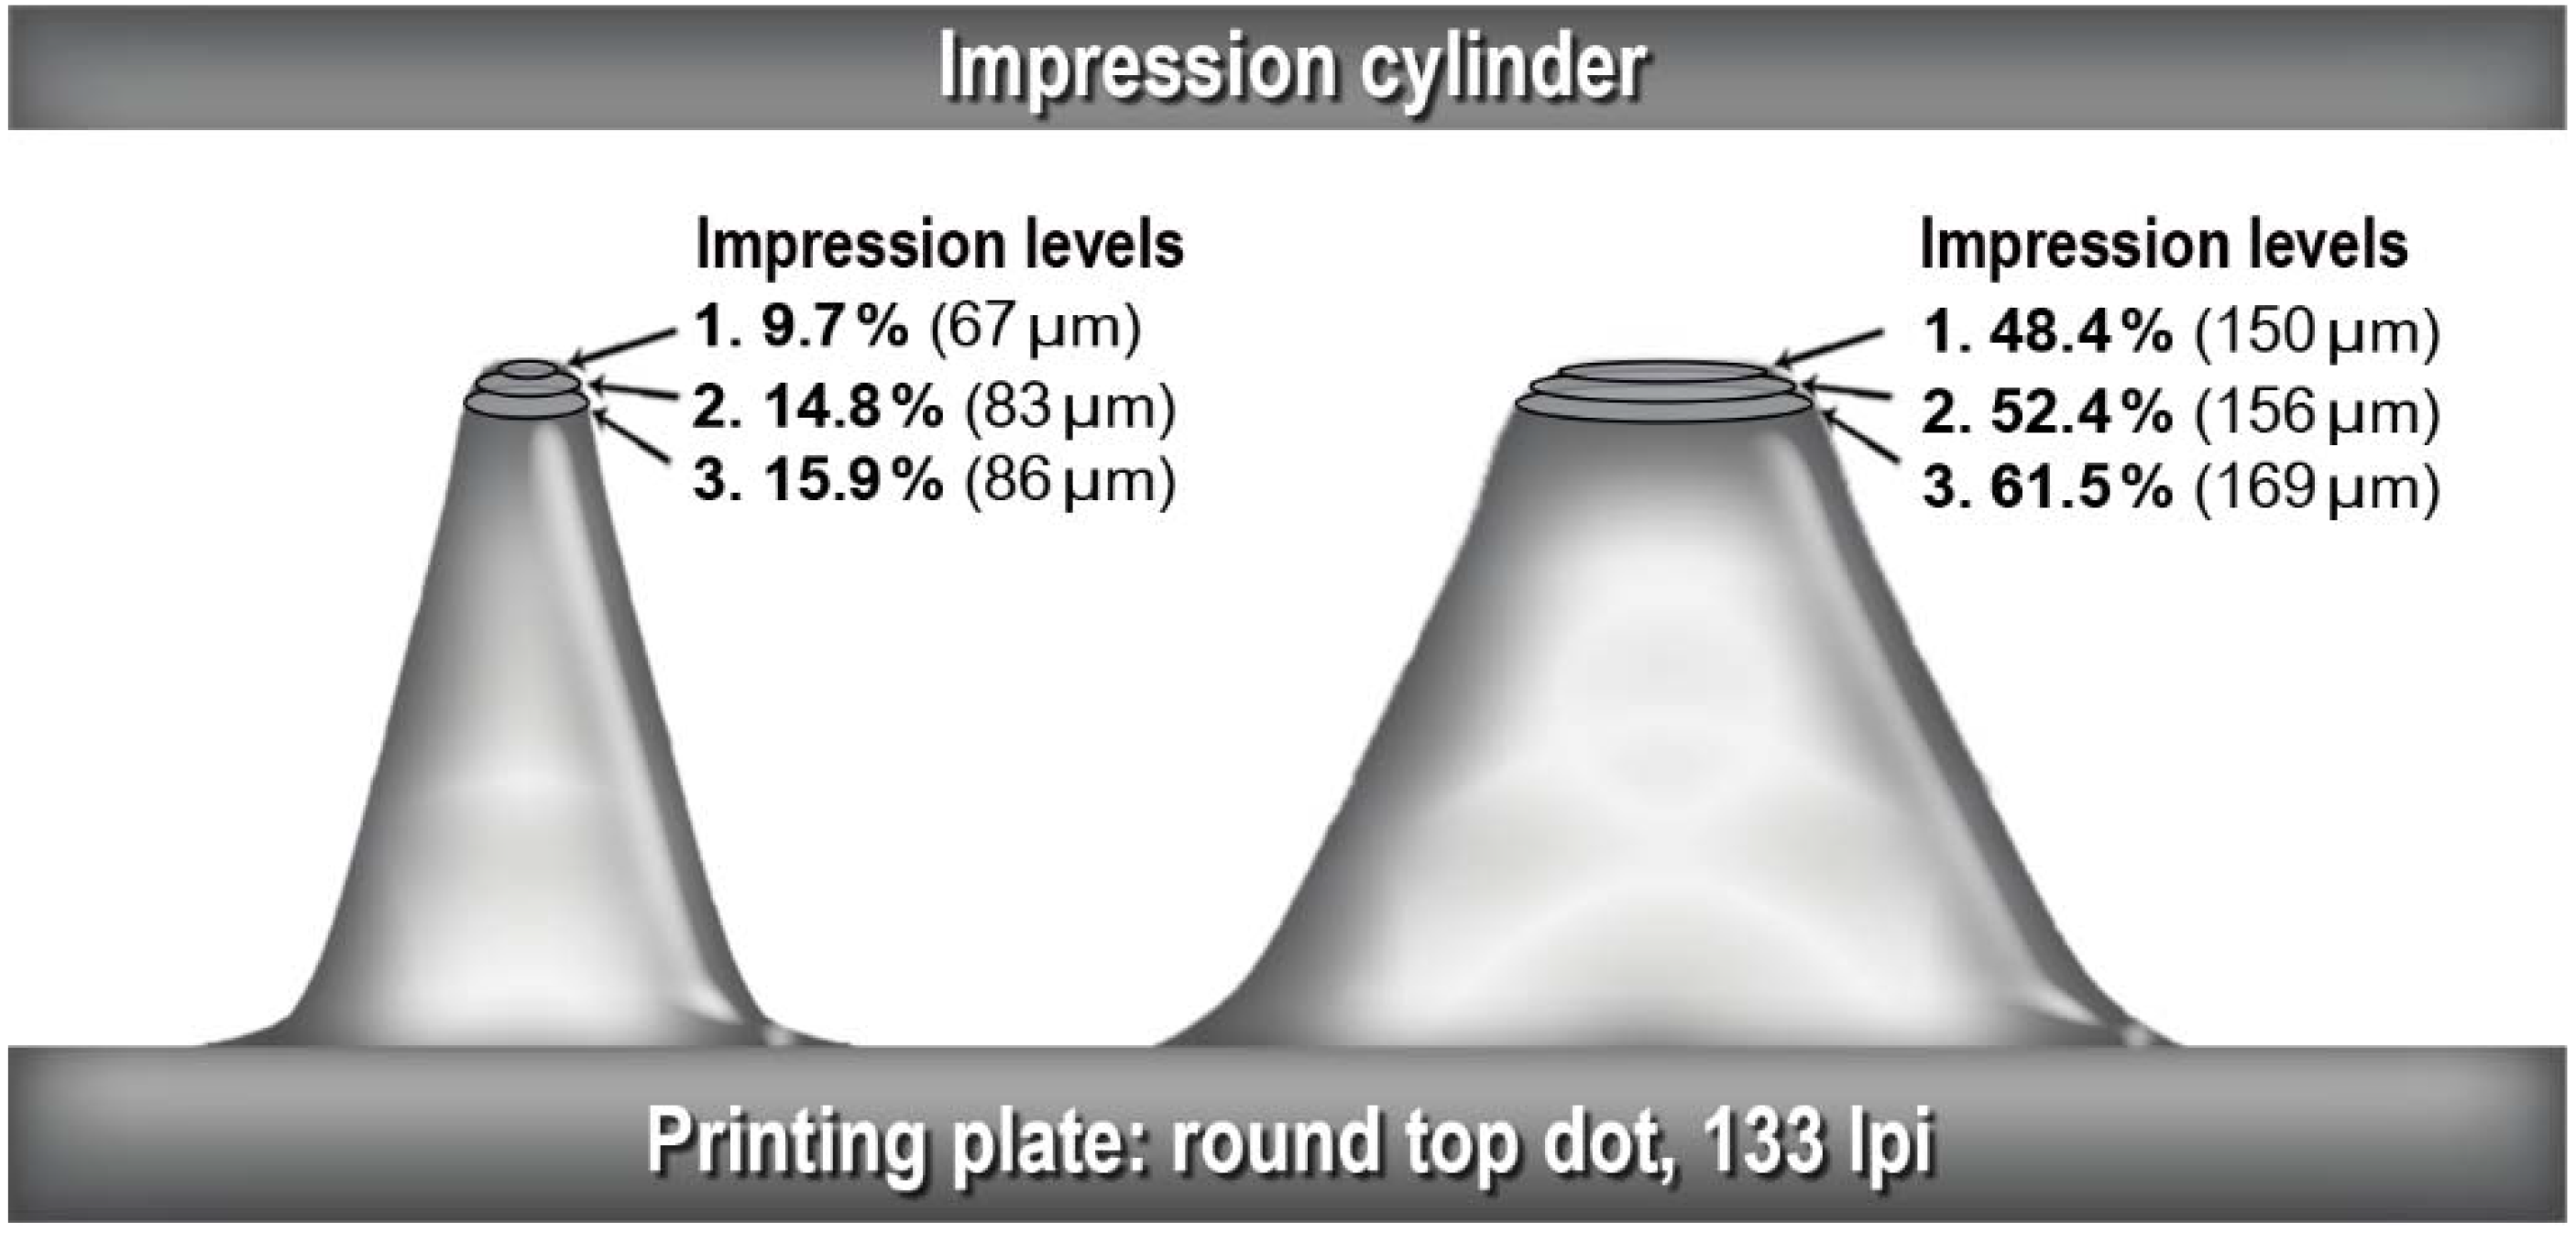
4.1. The Influence of a Print Run on the Dot Deformation

Dot deformation caused by a worn polymer plate surface can indirectly be researched by measuring the dot diameter or percentage of the coverage of the dots on the prints at the third stage of printing. Dot deformation in the printing process due to wear of the photopolymer printing plates is a very common occurrence. Because of the soft and flexible material, the wear effect is much more pronounced in large print runs. Due to the wear of the tops of the dots, their shape changes, and the tonal value increases. Figure 3 shows three samples captured in the same area of the print through three stages of printing. The first sample is a view of the dots on the first good print obtained with new printing plates (Stage I). The second sample was obtained after a print run of 100,000 labels (Stage II), and the third sample was from after a print run of 500,000 labels (Stage III). The entire print run was printed under the same conditions of the printing process, which included the settings of the printing machine, anilox rollers, pressure during printing and printing plates. Images for evaluation were captured on one characteristic area of the printed label where the deformation was most visible so that the results of the analysis of the individual stages could be compared with each other.
The area of the label that was chosen for capturing and visual evaluation was the shadow next to the letter “e”, and it was characteristic because the deformation could be easily noticed due to the transition realized in a dark color on a flat tone (Figure 3).
The first sample was captured on a first good print, and it showed a linear gradient in black and cyan colors with relative tiny dots, while the background was made of two colors: magenta and yellow. The dots in the magenta color touched each other at particular points, and this situation was taken as a reference. This was the initial state for further visual evaluation and showed the actual dot area on the print, including the TVI. At the second printing stage, after the print run of 100,000 prints, it can be seen that the selected area was slightly darker than the reference. The dot deformation was easily visible in the enlarged images, and the gradient transition in a black color was much sharper. The majority of the dots in the magenta color were joined. Namely, dots in the midtone areas, which should normally be printed separately, were irregularly connected with each other, causing the dot bridging effect on the prints. At the third printing stage, after the print run of 500,000 prints, the dot deformations were clearly visible, and the entire label was significantly darker. The dots had a significant increase in tonal value, and they were joined so that they gave the impression of a dirty print. Additionally, the filling in effect could be noticed. The ink accumulated at the edges and filled in spaces that were not intended to be printed, and the effect was especially visible on printouts with tiny elements or highlighted halftone areas.

4.1.1. Analysis of Dot Coverages

Five areas with flat tones in highlights and midtones on the prints were selected, and the dot diameters were determined by measurements through three stages of printing. The area below 5% coverage was not analyzed, because a different mechanism of dot deformation occurred in this area. The measurement was performed on images and captured on prints at 200× magnification and a 1280 × 1024 resolution. A Dino-Lite AM4000 digital microscope with a resolution of 1.3 megapixels and in-built LED light was used for this purpose. ImageJ 1.47 software was used for processing and analysis of the microscopic images. It was necessary to set a correspondent size ratio before measuring, based on known values at the same magnification. A ratio of 500:1 was set for image analysis (i.e., 500 pixels amounted to 1 mm), which gave the image a size of 2.56 × 5.12 mm. The measurement results of the dot diameters at three stages of printing are shown in Table 2, and they were obtained as the average values of five measurements. For the needs of a more detailed analysis and comparison, the corresponding values of the dot coverages in percentages for all cases were calculated.
Based on the measured values of the dot diameters at the line ruling of 133 lpi, the corresponding value of the surface coverage as a percentage was calculated according to the following formula [31]:
A D = 25 π ( d D × L ) 2
where A D is the dot area as a percentage, d D is the diameter of the dot in microns and L is the plate line screen in lines per millimeter.
To convert the screen frequency from lines per inch to lines per millimeter for the output resolution of 2540 dpi, the following formula was used:
L = l p i 25.4
where l p i is the plate line screen in lines per inch.
After the printing of the entire print run, there was an increase in the dot diameter in all five selected areas. The increase in the dot diameter in relation to the reference value was to amount of 12% in the midtones and up to 28% in the light tones (Table 2). However, to determine the deformation of the dot through the entire print run, it was necessary to analyze the changes in coverage by the stages of printing.
The graph shows that the changes in coverage in the midtones were linear throughout the entire print run, while in the light tones, it was more logarithmic (Figure 4). That means a significant change in the light tones occurred from the beginning of the print to one-fifth of the print run (Stage II of printing). However, the changes in coverage in the third stage of printing (print run from 100,000 to 500,000 prints) was higher in the midtones compared with the light tones.
Figure 5 shows the absolute increase in dot coverage for the second and third stages relative to the initial state on the first good print. However, the absolute values of coverage did not provide relevant data on how to change the coverage in the individual observed areas. Therefore, Figure 6 shows the percentage deviations from which a relative change was visible for each observed stage of printing.
Analysis of the increase in coverage in the second and third stages of printing would show the actual deformations of the halftone dots in the midtones and light tones.
The initial positions of the bars in the graphs indicate Stage I (i.e., the reference state that refers to the first good print). The first part of the graph (blue bar), which indicates a print run of 100,000 prints (Stage II), showed an increase in the coverage value by 3.5% in the midtones and up to 5.1% in the light tones (Figure 5). There was no significant difference in the absolute values between the midtones and light tones as the coverage increased. However, the percentage deviations (Figure 6) from the reference value measured on the first good print were 6.3% (for 55.8% coverage) and up to 52.6% (for 9.7% coverage). It can be seen that the relative increase shown in the percentage after 100,000 prints was much higher in the light tones compared with the midtones.
The second part of the graph (orange bar), which indicates a print run of 100,000–500,000 prints, shows results opposite to those for the first part of the graph. Namely, a slightly larger increase in coverage in the midtones was recorded compared with the light tones (from 10.4% in the midtones to 1.1% in the light tones) (Figure 6). The percentage deviation of the coverage value at Stage III compared with Stage II was 17.5% in the midtones and up to 7.4% in the light tones.
In the first part of the print run (100,000 prints), a significant increase in coverage occurred in the light tones. The halftone dots in the light areas were isolated from each other and thus more susceptible to wear compared with the midtone areas, where the dots were connected on all sides. In the second part of the print run (from 100,000 to 500,000 prints), there was a slightly larger increase in coverage in the middle tones. However, it is very interesting to look at the percentage distribution within the entire increase in coverage. At 9.7% of the surface coverage (halftone dot No. 5), 82% of the increase occurred by the second stage of printing, and the remaining 18% happened by the end of the print run. At 55.8% of the surface coverage (halftone dot No. 1), this value was 25% in the second stage of printing, and the remaining 75% occurred by the end of printing.
In the entire printing process, the total coverage increase for halftone dot 1 in the midtones was 13.9% (percentage deviation was 23.5%), and for halftone dot 5 in the light tones, it was 6.2% (percentage deviation was 63.9%). The percentage deviation values indicated a significantly greater influence from the print run size on tone reproduction in the light areas. The effect that occurred in printing can be interpreted as follows. The result of the application of the standard digital Computer to Plate (CtP) plate-making process based on the LAMS technology was a dot with a rounded top shape in the form of a bullet. Therefore, the edge of the dot could not be accurately determined, especially in the highlight tones. Based on the analysis of the print in three stages of printing, due to the wear of the photopolymer plates, it was found that the impression level of the printing elements changed (i.e., the dot diameter at the printing plate increased (Figure 7)). The increase in the halftone dot was due to the wear of the polymer plate, which caused the side shoulders of the dot to become a part of the printing surface.

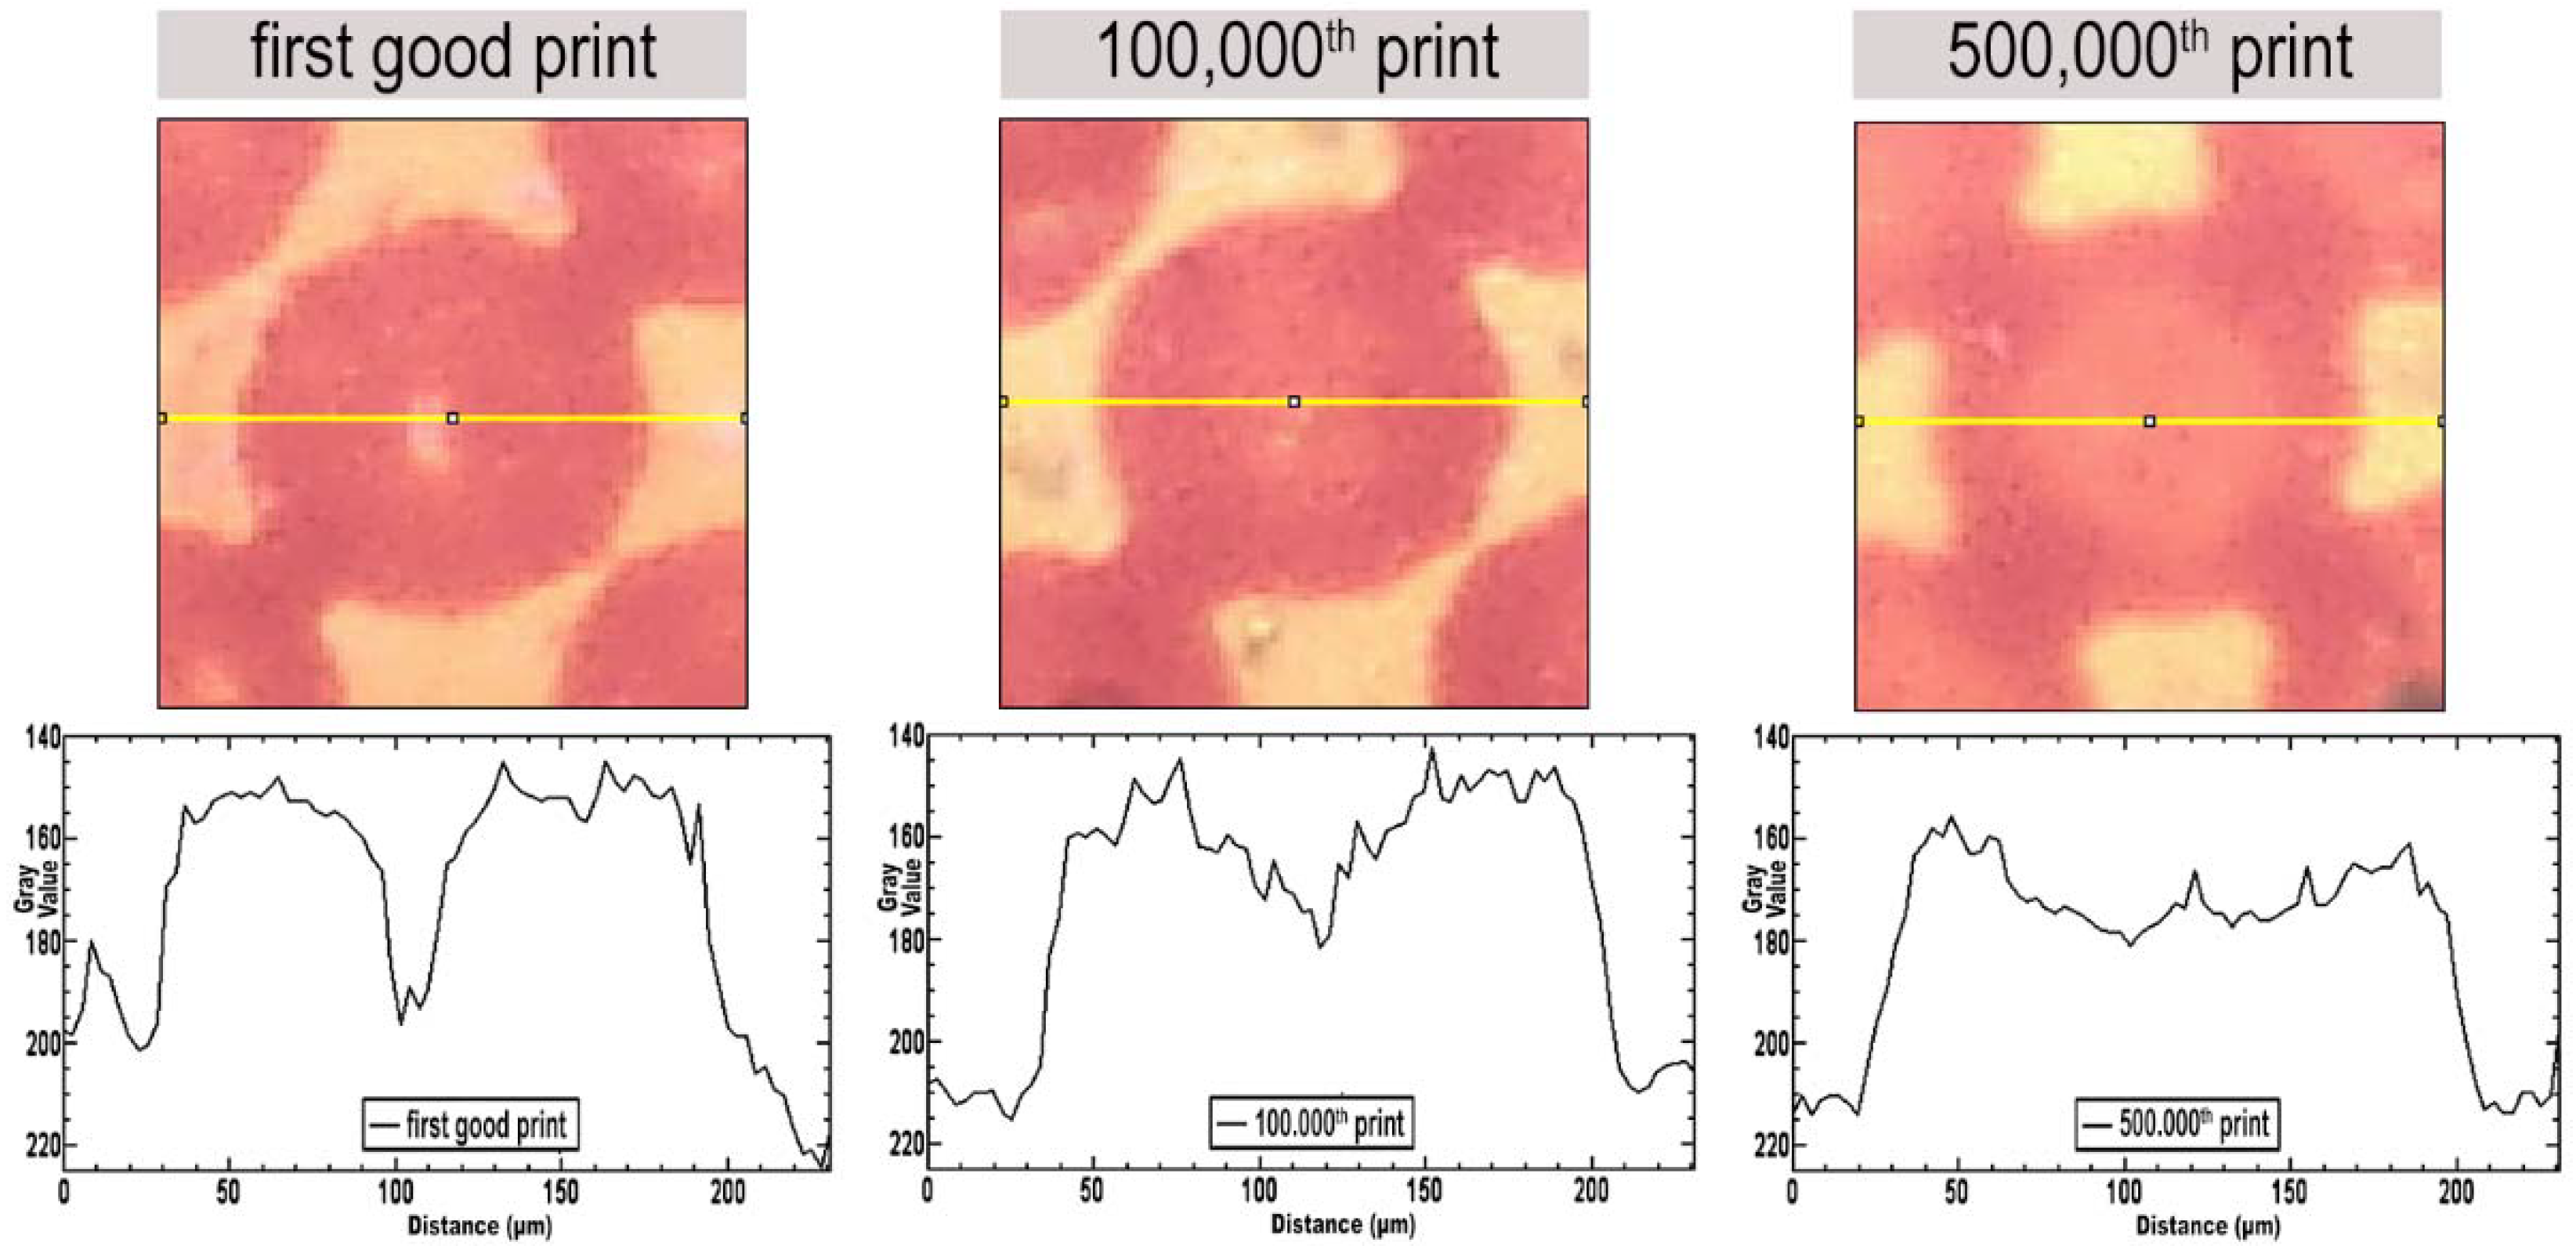
4.1.2. Analysis of the Uniformity of the Ink Density and Dot Sharpness

ImageJ software (Plot Profile tool) was used to analyze the homogeneity and sharpness of the dot, since it generates a 2D profile of the dot based on microscopic images through all three stages of printing. First, a line was drawn through the center of the dot in order to mark the area that would be analyzed (Figure 8, upper images), and then a 2D dot profile (Figure 8, lower images) was created based on the surface coverage. The graph curve shows gray values (gray levels of 140–225) along the entire length of the measurement, which was the same for all three cases, and the measurement equaled 230 μm.
The graph for the third stage of printing (after 500,000 prints) showed a significantly higher inhomogeneity in the dot compared with the previous two stages of printing. This inhomogeneity was characterized by a significantly larger surface area with a lower color density in the middle of the dot (i.e., the accumulation of ink at the edges of the dot). The area with a lower color density was very small at the beginning of printing (Figure 8, left image), and it increased toward the end of the print run.
The dot sharpness is actually an estimate of the sharpness or smoothness of the dot edge [32]. The dot sharpness was greatest at the beginning of printing, which is visible in the graph in terms of a steep transition from the darkest to the lightest level of the dot. At the beginning of printing, that transition was 10 μm, while at the end of printing, it was 20 microns. The edge sharpness is very important for line elements, especially for line codes, because it directly affects the speed of reading.
Based on the analysis, it can be concluded that when printing large print runs, the flexible printing plate changes its properties, and a larger amount of ink is transferred, which generally causes a darker print, and in the highlight tones, the impression of a dirty print is created. Due to the wear of the printing plate, the top of the dot wears out, which results in a larger printing area. Namely, the shoulders of the dot become part of the printing surface that also participates in the printing process. Therefore, for large print runs, the printing plates are made in several sets so that they do not deviate from the given certified print. Although the dot coverage increases and affects the reduction of print contrast [33], prints are most commonly within the tolerance limits when measuring the color density.

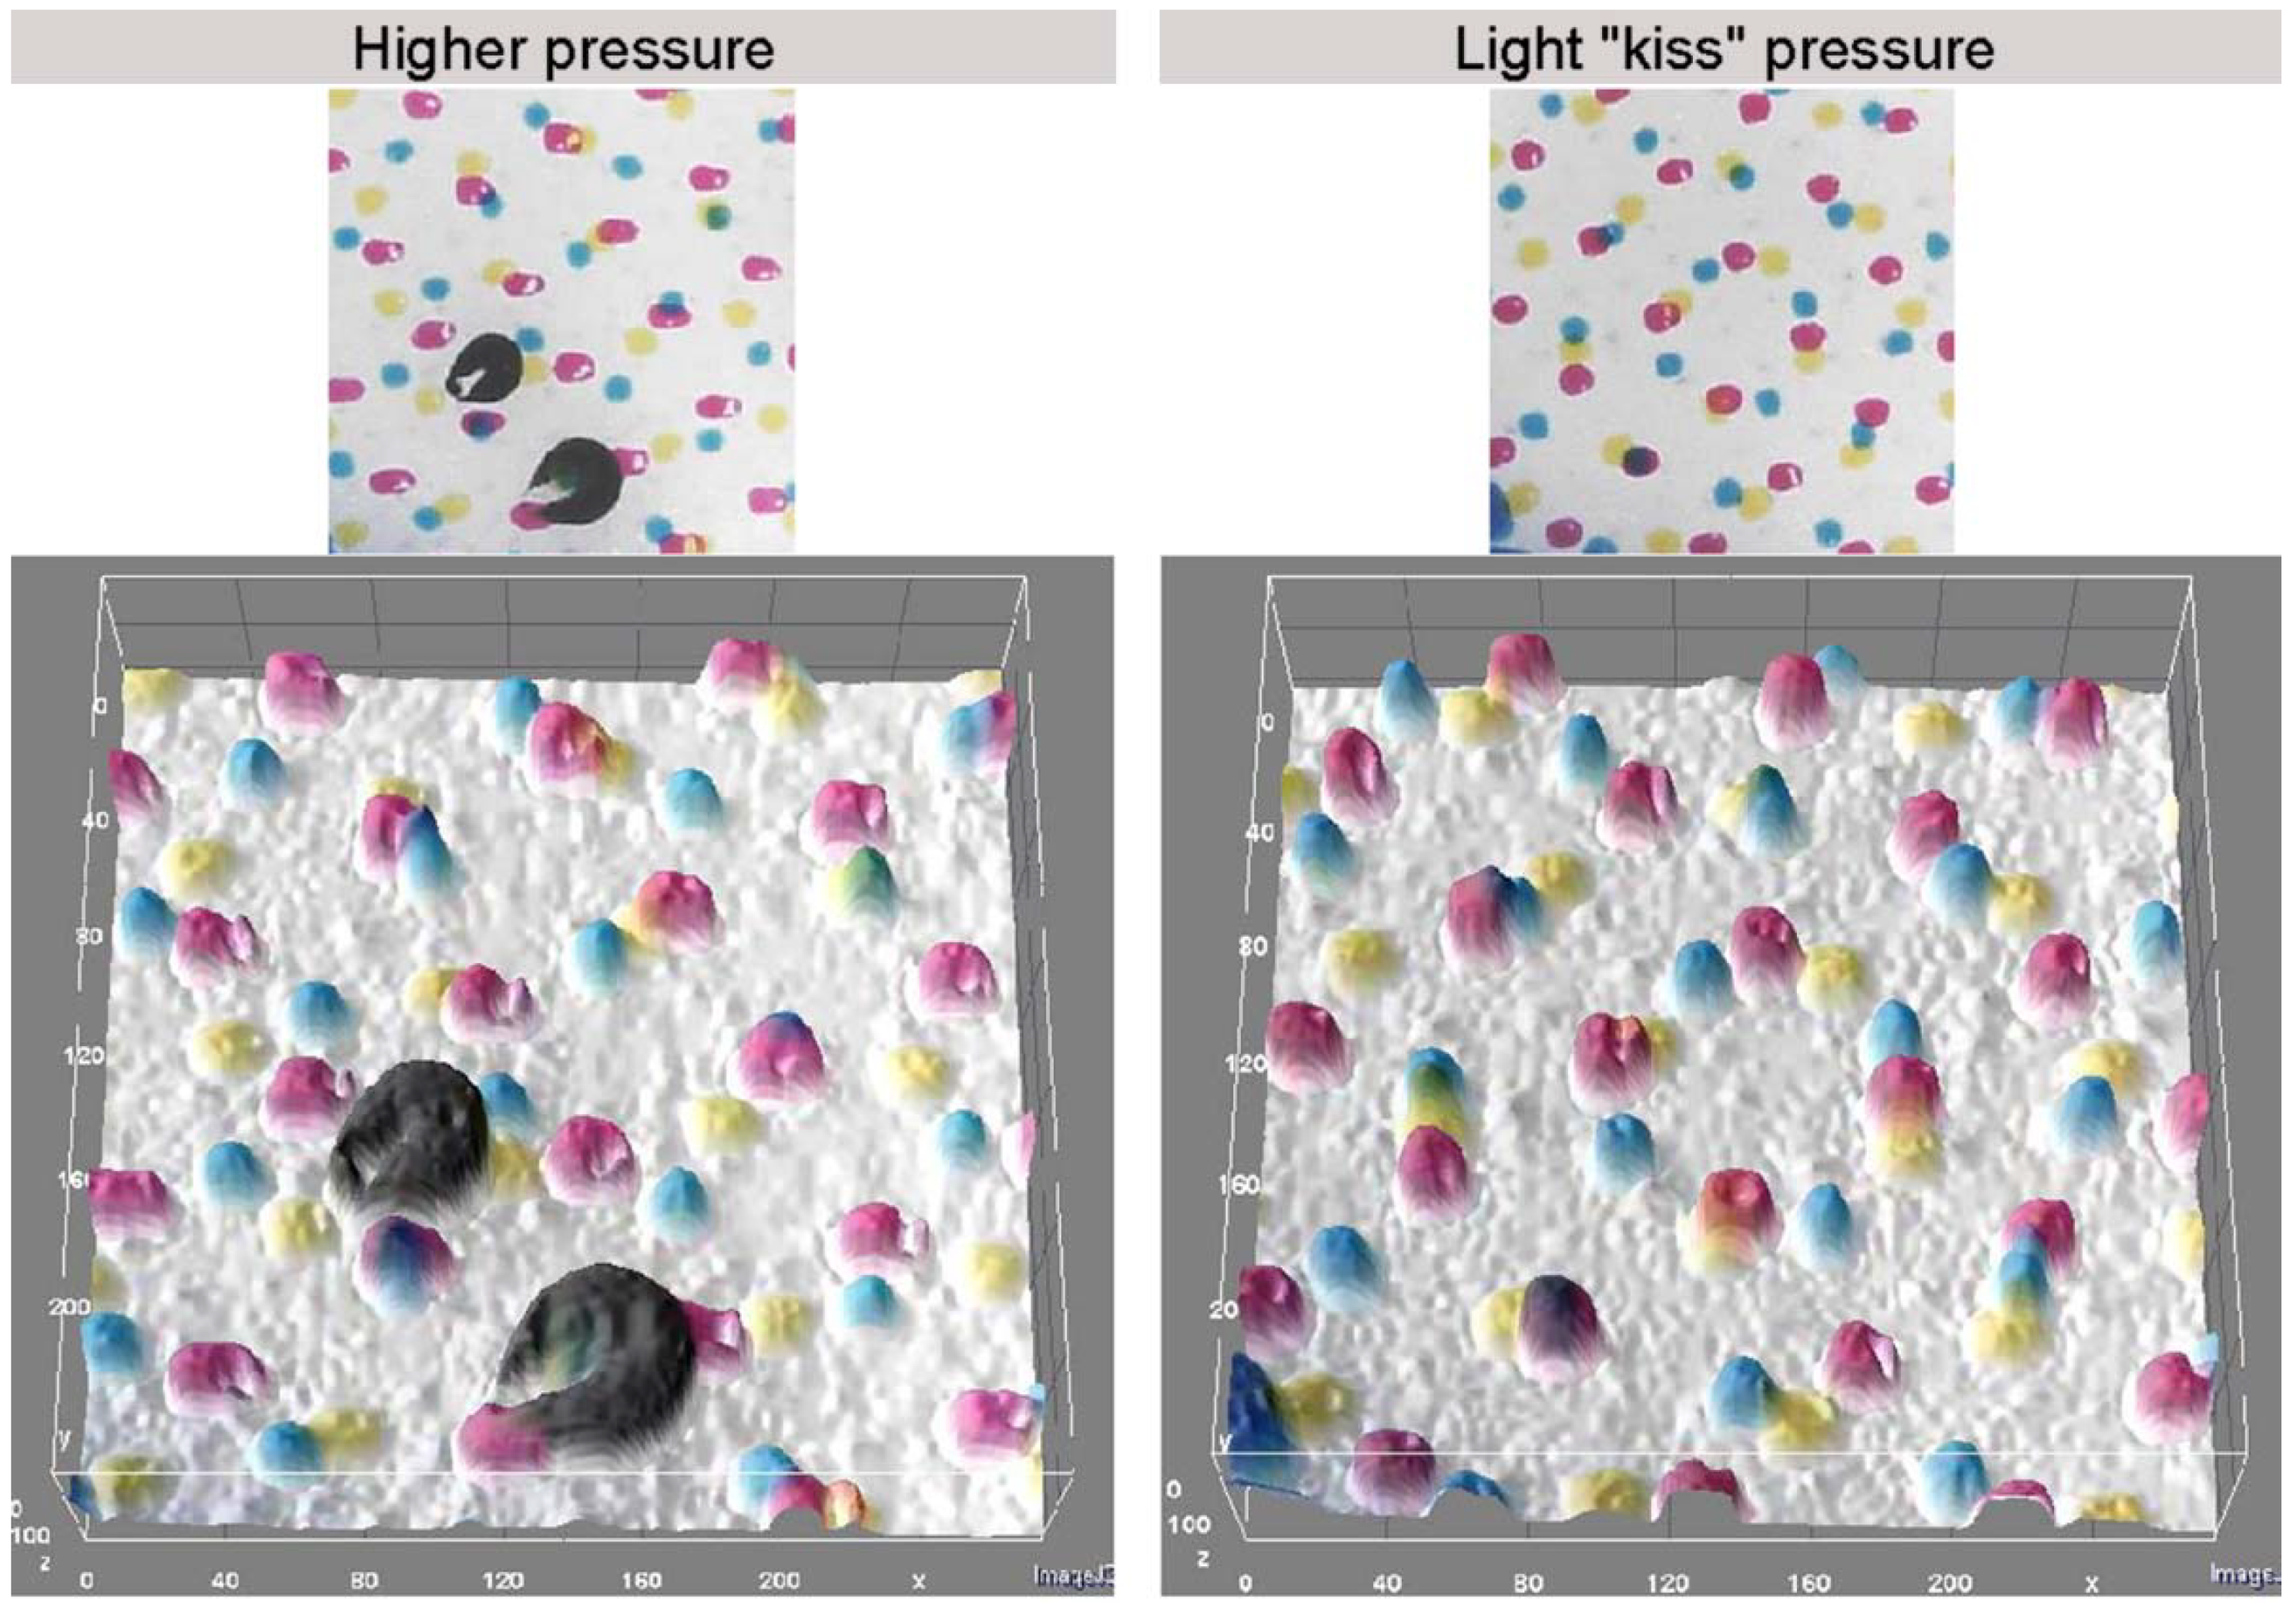
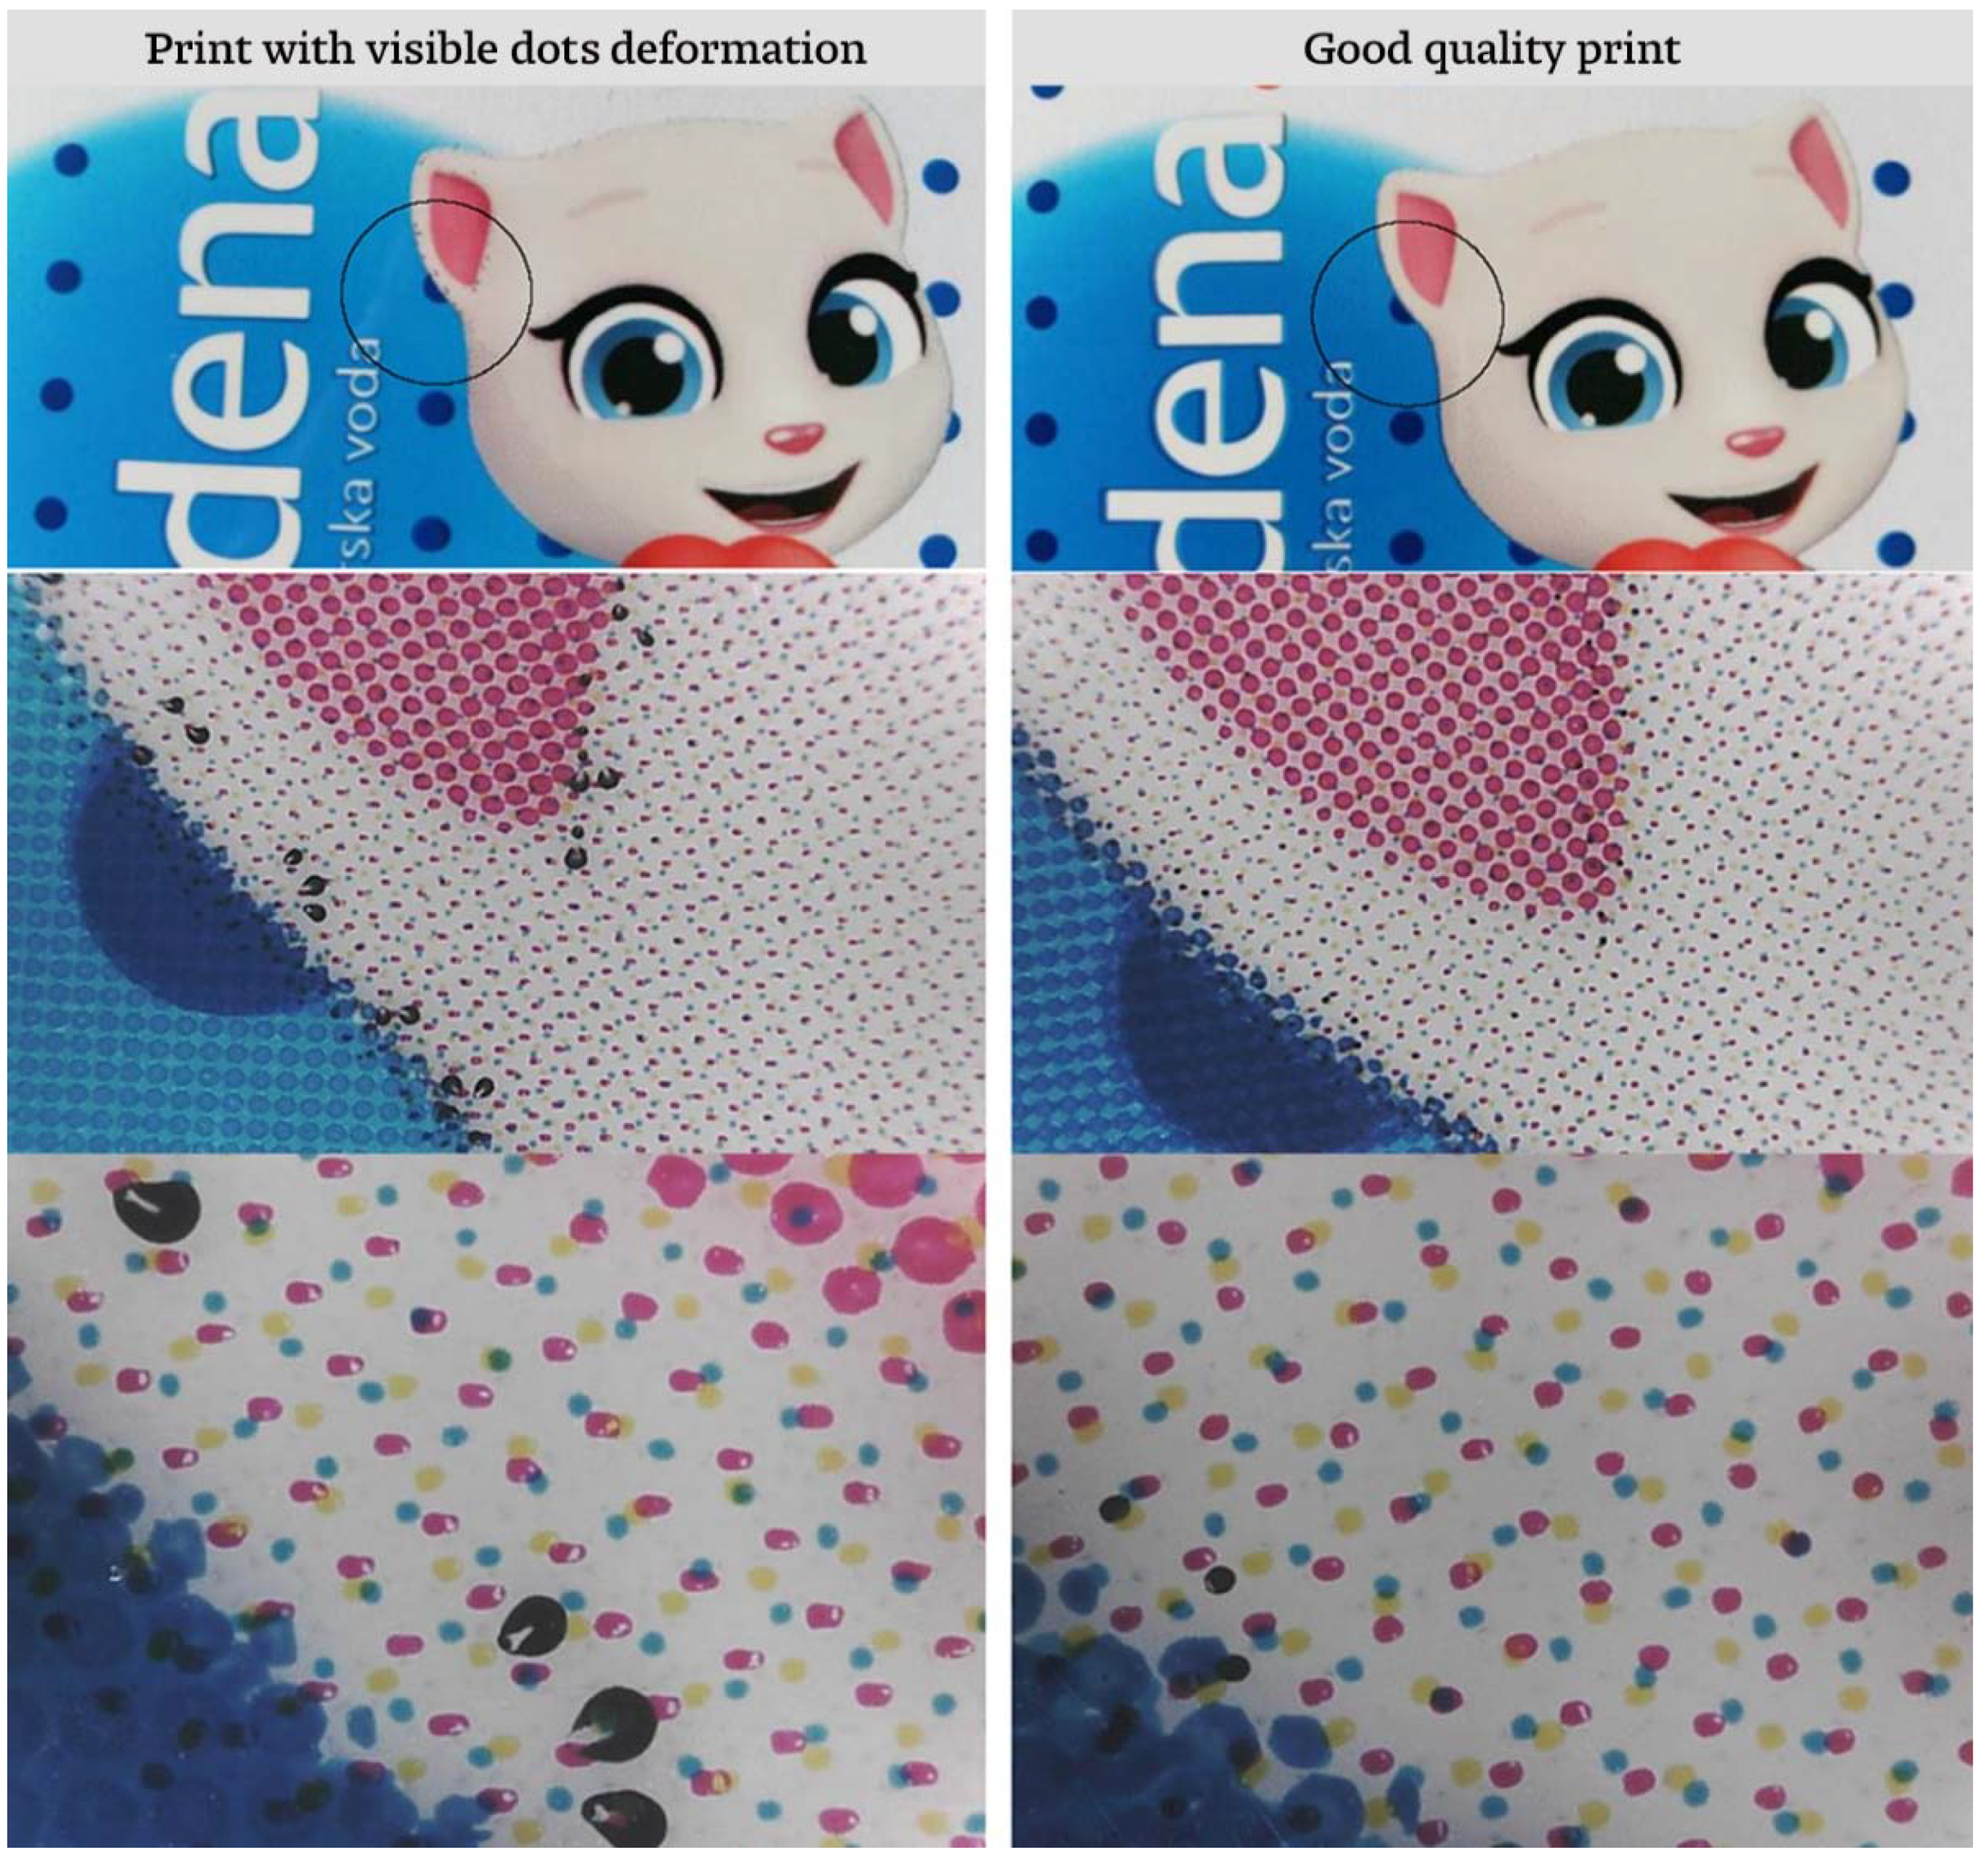
4.2. Dot Deformation Caused by Incorrect Printing Settings

In this chapter, the dot deformation in the highlight tones caused by the use of an inappropriate anilox roller and inadequate printing pressure is analyzed. For the analysis of this, microscopic images were used that showed two states: a print with visible deformations of the dot (Figure 9, left images) and a good quality print or correct reproduction (Figure 9, right images).
On microscopic images, dot deformations in a black color, visible as a dirty print, can be easily detected. However, the cause is related to defining the anilox roller line screen, (i.e., defining the minimum dot in the print). The minimum dot is the smallest dot that can be well reproduced in a defined printing process [34].
Using the data from Table 1, which shows the technical characteristics of the printing process, it is possible to determine the relationship between the dot size on the printing plate and the cell size of the anilox roller, which is very important for the reproduction of highlight tones. Based on a line ruling of 133 lpi and an output resolution of 2540 dpi, the dot size in the highlight tones up to 5% coverage was calculated by using the following formula [31]:
d D = A D 25 π × L 2 × 10 3 = 1 5 L A D π × 10 3
where A D is the dot area as a percentage, d D is the diameter of the dot in microns, L is the plate line screen in lines per millimeter and 10 3 is the factor for converting millimeters to microns.
The specifications of the anilox roller, in addition to the line screen specification, were defined by the size of the cell opening and the size of the cell wall. There are standard values for the wall thickness, depending on the anilox line screen. The values are inversely proportional (i.e., the higher line screen of the anilox roller, the smaller cell wall thickness). The total cell size in microns is calculated by using the following formula [31]:
Anilox   Cell   Size = 2.54 lpi × 10 4
where lpi is the plate line screen in lines per inch and 10 4 is the factor for converting centimeters to microns.
The values calculated on the basis of the abovementioned formulas are shown in Table 3. The reproduction with the full tonal range must satisfy the values of the anilox line screen for a minimum dot of 1% coverage. The table shows that at all the tonal values of 1–5% coverage, the dot diameter on the printing plate was larger than the size of the cell opening. Otherwise, there was an effect whereby the dots on a flexo plate dipped into the cells of the anilox roller (dot dipping effect), and an increased transfer of ink onto the printing substrate took place.
Furthermore, the characteristics of the printing process should be compared with the values from Table 3. It was noticed that only the line screen of the anilox roller for the black color was too low, while other anilox rollers were in accordance with the specifications. According to the data listed in Table 3, the anilox roller line screen for the black color of 340 cells/cm (860 cpi) was sufficient for quality reproduction of the minimum dot of 2% coverage. A dot of 1% coverage at 133 lpi (22 μm) was smaller than the anilox cell opening at 340 c/cm (26 μm). The dot was dipped in the cell and too much ink was transferred onto the printing substrate. In addition, with the top of the dot, the ink was also transferred with the side parts of the dot (dot shoulders), thus creating very pronounced black spots on the print in the highlight tones (Figure 9, left). The quality of the reproduction was significantly reduced and unacceptable, which was visible in the form of a darker halo around the dot. By applying an adequate anilox roller line screen, the printing error could be corrected very quickly, as shown in Figure 9 on the right.
Another way to solve this problem requires much more commitment, and it also costs more. The quality of the print is greatly determined by the preparatory work in the prepress and printing processes [35]. Image processing in prepress should be made again by using a “bump-up” curve that sets 2% as the minimum value, thus ensuring the correct ratio between the anilox line screen and the plate line ruling. In some situations, it is better to remove the tones of 1% coverage (Figure 10, curve 1) and to increase all tones up to 2% coverage to a value of 2% in some others (Figure 10, curve 2). In this case, the optimal line screen of the anilox roller for a minimum dot size of 2% coverage was 315 c/cm (800 cpi). Of course, in the end, the printing plates also need to be made again.
The described deformation of the dot in the black color, in addition to an inadequate anilox roller, was also affected by an incorrect printing pressure. In addition to the obvious accumulation of ink at the edges of the dot, a deformation in the form of an ink shift in one direction is also visible. The same deformation is also visible for the magenta color (Figure 11, upper left).
Dot formation on a printing substrate depending on the printing pressure can be best seen from topographic views produced on the basis of microscopic images by using the “Interactive 3D Surface Plot” tool from the ImageJ software for image analysis. Topographic views show the absolute color density that is directly related to the thickness of the ink film and the characteristics of the printing substrate. The color density projection, performed with the help of the proportional height of the element in the 3D view, clearly shows the inhomogeneity of the dots due to the excessive printing pressure (Figure 11, down left).
Higher printing pressure in all areas of reproduction due to the transfer of a large amount of ink creates an inhomogeneous dot, characterized by the appearance of a “halo”, or higher color density at the edges. This phenomenon, combined with the ink shift to one side, is clearly seen in the color black and much less so in the color magenta. The dots were less compact compared with the printout with light pressure applied in printing. However, in the highlight tones where small dots are present, excessive pressure in the printing can lead to permanent damage to the printing elements. The printing plate is flexible, and the printing surfaces of the dots are very tiny and cannot withstand the high pressure of the printing cylinder. Due to the small base of the dots in the highlight area on the printing plate, their bending occurs, which then causes visible spots on the print, as in the case of the magenta color. Those spots had a characteristic shift to one side as a result of the dot deformation in the direction of the movement of the web during printing due to excessive pressure. Such reproduction quality is not acceptable. In order to prevent such deformations of dots, it is important to apply light pressure in the printing process.

5. Conclusions

Through this research, the problem of dot deformation on concrete examples was presented. Experiment 1 involved the influence of a print run size on the dot deformation in the print. The measurements from experiment 1 showed that the dot coverages on the polymer plate were changing during the printing process, and these changes influenced the transfer of the ink on the substrate. The dot diameter was measured in five selected halftone areas in the midtones and light tones, and based on them, the coverage as a percentage was calculated. The measurement results showed that the changes in dot coverages in the midtones were linear throughout the entire print run, while in the light tones, they were more logarithmic. In the first fifth of the print run, the relative percentage deviation related to Stage I was 6.3% in the midtones and up to 52.6% in the light tones. In the remaining part of the print run, the percentage deviation in relation to Stage II was 17.5% in the midtones and up to 7.4% in the light tones. Therefore, significantly higher dot deformation appeared in the light tones (82%) in the first fifth of the print run in relation to the midtones (25%). An analysis of a graph of the ink density showed a much more homogeneous shape of the dot and greater dot sharpness at the beginning of the print run.
The main problem with flexography is the loss of tones on the print in the highlight and shadow areas. While the loss of tones in shadows results in a reduced print contrast, the loss of tones in highlights results in a sudden interruption of the tones below the minimum printable dot value (cut-off tones effect). Deformations are much more noticeable on flat tones and gradients in relation to colorful visuals and images. The goal of every packaging manufacturer is to eliminate such anomalies or at least to minimize them. By analyzing the topographic view of the dots from experiment 2, it can be concluded that it is important to determine and maintain the minimum size of the dot and choose the right anilox line count accordingly. The smallest dot on the printing plate must be larger than the cell of the anilox roller. Based on the analysis of the results, in accordance with the sizes of the minimum dot, the optimal ratio of the anilox line screen and plate line screen was defined and amounted to 5:1 for 3%, 6:1 for 2% and 8.5:1 for 1% dot coverages.
When processing an image for flexography, it is often necessary to compromise on the method of prepress for 1% coverage. Inadequate specification of the printing process for 1% coverage can make a dirty print that looks much darker than that at 2% coverage. This is the most common problem with the black channel. Therefore, a “bump-up” curve is applied in prepress, which ensures a minimum dot on the printing plate and also in printing. In practice, the 2% coverage is often set as the minimum dot, thus significantly reducing the requirements for a high line count int the anilox roller while still keeping the plate line screen unchanged.
These results are of great interest for graphic reproduction, as they provide insight into the stability and endurance of the polymer plates during the printing process, as well as defining the size of the print run with the optimal print quality.

Author Contributions

Data curation, D.V.; Investigation, L.V.; Methodology, K.H.; Visualization, R.G. All authors have read and agreed to the published version of the manuscript.

Funding

This research received no external funding.

Institutional Review Board Statement

Not applicable.

Informed Consent Statement

Not applicable.

Conflicts of Interest

The authors declare no conflict of interest.

References

  1. Crouch, J.P. Flexography Primer; Graphic Arts Technical Foundation: Pittsburgh, PA, USA, 1998. [Google Scholar]
  2. Johnson, J.; Andersson, C.; Lestelius, M.; Jarnstrom, L.; Ratto, P.; Blohm, E. Some properties of flexographic printing plates and aspects of print quality. Appita Technol. Innov. Manuf. Environ. 2009, 62, 371–378. [Google Scholar]
  3. Liu, X.; Guthrie, J.; Bryant, C. A study of the processing of flexographic solid-sheet photopolymer printing plates. Surf. Coat. Int. Part B Coat. Trans. 2002, 85, 313–319. [Google Scholar] [CrossRef]
  4. Theohari, S.; Fraggedakis, E.; Tsimis, D.; Mandis, D. Effect of Paper Properties on Print Quality by Flexographic Method. In Proceedings of the 46th Annual International Conference on Graphic Arts and Media Technology, Athens, Greece, 25–29 May 2014. [Google Scholar]
  5. Laurent, G. Measurement and Prediction Procedures for Printability in Flexography (MP3 Flexo); Royal Institute of Technology: Stockholm, Sweden, 2002. [Google Scholar]
  6. Valdec, D.; Miljković, P.; Auguštin, B. The influence of printing substrate properties on color characterization in flexography according to the ISO specifications. Tech. J. 2017, 11, 73–77. [Google Scholar]
  7. Kipphan, H. Handbook of Print Media: Technologies and Production Methods; Springer Science & Business Media: Berlin/Heidelberg, Germany, 2001. [Google Scholar]
  8. Izdebska-Podsiadły, J. Effect of Plasma Surface Modification on Print Quality of Biodegradable PLA Films. Appl. Sci. 2021, 11, 8245. [Google Scholar] [CrossRef]
  9. Bould, D.; Claypole, T.; Bohan, M.; Gethin, D. Deformation of flexographic printing plates. In Proceedings of the 56th TAGA Technical Conference, TAGA, San Antonio, TX, USA, 18–21 April 2004; pp. 146–162. [Google Scholar]
  10. Anderson, J.; Schlotthauer, E. Kodak’s Flat Top Dots: The Effect of Flexo Dot Shape on Plate Stress and Wear; Eastman Kodak Company Rochester: New York, NY, USA, 2010. [Google Scholar]
  11. Valdec, D.; Zjakić, I.; Milković, M. The influence of variable parameters of flexographic printing on dot geometry of pre-printed printing substrate. Tech. Gaz. 2013, 20, 659–667. [Google Scholar]
  12. Konyukhov, V.Y.; Komarova, L.Y.; Rekus, I. The Changing of Deformation Properties of Flexo Plates in the Process of Swelling in Solvents. Trans. Tech. Publ. 2021, 1031, 75–79. [Google Scholar] [CrossRef]
  13. Bould, D.; Claypole, T.; Bohan, M. An investigation into plate deformation in flexographic printing. Proc. Inst. Mech. Eng. Part B J. Eng. Manuf. 2004, 218, 1499–1511. [Google Scholar] [CrossRef]
  14. Gilbert, E.D.; Lee, F. Flexographic plate technology: Conventional solvent plates versus digital solvent plates. J. Ind. Technol. 2008, 24, 1–7. [Google Scholar]
  15. Liu, X.; Guthrie, J. A review of flexographic printing plate development. Surf. Coat. Int. Part B Coat. Trans. 2003, 86, 91–99. [Google Scholar] [CrossRef]
  16. Gooran, S. Hybrid Halftoning, a useful method for flexography. J. Imaging Sci. Technol. 2005, 49, 85–95. [Google Scholar]
  17. Mahovic Poljacek, S.; Tomasegovic, T.; Cigula, T.; Gojo, M.; Milcic, D. Formation of the printing elements in the photopolymer material used in flexography. Trans. Tech. Publ. 2014, 611, 883–891. [Google Scholar] [CrossRef]
  18. Valdec, D.; Miljković, P.; Čerepinko, D. The Impact of Top Dot Shapes of the Printing Plate on Dot Formation in Flexography. Tech. Gaz. 2018, 25, 596–602. [Google Scholar]
  19. Havenko, S.; Ohirko, M.; Ryvak, P.; Kotmalova, O. Determining the Factors That Affect the Quality of Test Prints at Flexographic Printing. East.-Eur. J. Enterp. Technol. 2020, 2, 53–63. [Google Scholar] [CrossRef]
  20. Yung-Cheng, H.; Hui-Wen, C.; Yuan-Hao, C.; Shu-Yu, C.; Sing, N.V. Flexible Hybrid Screening Solutions for Flexography. IEEE 2008, 6, 393–397. [Google Scholar]
  21. Bohan, M.; Townsend, P.; Hamblyn, S.; Claypole, T.; Gethin, D. Evaluation of pressures in flexographic printing. TAGA 2003, 1998, 311–321. [Google Scholar]
  22. Fetsko, J.M.; Walker, W.C. Measurements of ink transfer in printing coated paper. Am. Ink. Maker 1955, 33, 38–42. [Google Scholar]
  23. Yusof, M.; Claypole, T.; Gethin, D.; Zaidi, A.A. Application of finite elements on non-linear deformation of flexographic photopolymer printing plate. In Proceedings of the World Congress on Engineering, London, UK, 2–4 July 2008; Volume 2, pp. 1–5. [Google Scholar]
  24. Bould, D.; Claypole, T.; Bohan, M. An experimental investigation into flexographic printing plates. J. Graph. Technol. 2004, 1, 1–8. [Google Scholar]
  25. Bould, D.C.; Hamblyn, S.M.; Gethin, D.T.; Claypole, T.C. Effect of impression pressure and anilox specification on solid and halftone density. Proc. Inst. Mech. Eng. Part B J. Eng. Manuf. 2011, 225, 699–709. [Google Scholar] [CrossRef]
  26. Harper, C. Aniloks line screen–stabilizer of the ink film. Flexo Grav. Asia 2005, 4, 14–15. [Google Scholar]
  27. Valdec, D.; Hajdek, K.; Majnarić, I.; Čerepinko, D. Influence of Printing Substrate on Quality of Line and Text Reproduction in Flexography. Appl. Sci. 2021, 11, 7827. [Google Scholar] [CrossRef]
  28. Novaković, D.; Dedijer, S.; Mahović Poljaček, S. A model for improving the flexographic printing plate making process. Tech. Gaz. 2010, 17, 403–410. [Google Scholar]
  29. Tse, M.-K. PIAS-IITM–A High-Performance Portable Tool for Print Quality Analysis Anytime, Anywhere; Quality Engineering Associates (QEA), Inc.: Billerica, MA, USA, 2007; pp. 1–4. [Google Scholar]
  30. Wolin, D.; Johnson, K.; Kipman, Y. The importance of objective analysis in image quality evaluation. In NIP & Digital Fabrication Conference, 1998 International Conference on Digital Printing Technologie; Society for Imaging Science and Technology: Springfield, VA, USA, 1998; pp. 603–606. [Google Scholar]
  31. Valdec, D.; Čerepinko, D.; Tomiša, M. An analytical approach for determining the mechanical dot gain of AM and FM screen technology. Tech. J. 2015, 9, 446–450. [Google Scholar]
  32. Fleming, P.D.; Cawthorne, J.E.; Mehta, F.; Halwawala, S.; Joyce, M.K. Interpretation of dot fidelity of ink jet dots based on image analysis. J. Imaging Sci. Technol. 2003, 47, 394–399. [Google Scholar]
  33. Galton, D. A study of the effects of the process parameters on the flexographic printing problem “dot bridging”—Part II: Experimental design and print contrast/density. Pigment Resin Technol. 2005, 34, 94–100. [Google Scholar] [CrossRef]
  34. Miljković, P.; Valdec, D.; Matijević, M. The impact of printing substrate on dot deformation in flexography. Tech. Gaz. 2018, 25, 509–515. [Google Scholar]
  35. Żołek-Tryznowska, Z.; Rombel, M.; Petriaszwili, G.; Dedijer, S.; Kašiković, N. Influence of Some Flexographic Printing Process Conditions on the Optical Density and Tonal Value Increase of Overprinted Plastic Films. Coatings 2020, 10, 816. [Google Scholar] [CrossRef]
Figure 1. Three specific situations of the relationship between the plate halftone dot and the anilox cell size.
Applsci 11 10601 g001
Figure 2. Printing pressure adjustment points in the flexo inking system.
Applsci 11 10601 g002
Figure 3. Appearance of dot deformations in specific stages (no. of print runs).
Applsci 11 10601 g003
Figure 4. Dot coverage values of five selected halftone dots at three stages of printing.
Applsci 11 10601 g004
Figure 5. Absolute increase of dot coverage values for five selected halftone dots at Stage II and Stage III.
Applsci 11 10601 g005
Figure 6. Relative percentage deviation for five selected halftone dots at Stage II and Stage III.
Applsci 11 10601 g006
Figure 7. Schematic view of the variation of the impression level at three stages of printing for two characteristic halftone dots.
Applsci 11 10601 g007
Figure 8. 2D dot profile in three stages of printing.
Applsci 11 10601 g008
Figure 9. Display of the deformation of dots on the print at two states of printing.
Applsci 11 10601 g009
Figure 10. Variations in the application of “bump-up” curves in prepress for printing.
Applsci 11 10601 g010
Figure 11. Topographic view of dots at different settings for the printing pressure.
Applsci 11 10601 g011
Table 1. Technical specifications of the prepress and printing process.
Plate-Making Process Specification
Ctp deviceHell HelioFlex F1200 (LAMS technology)
Resolution2540 dpi
Photopolymer typeFlint nyloflex ACE, 62 shore A
Plate thickness1.14 mm
Base layer thickness0.125 mm
Line ruling133 lines per inch (lpi)
Screening typeConventional AM, round dot shape
Printing Specifications
Flexo printing machineNilpeter FA-17
Printing speed120 m/min
Process flexo inksUV FoilStar LM yellow, magenta, cyan, black
White flexo inkLightStar UV Opaque White Foil FCM ED405700
UV curingUV Lamp-Mercury Wavelength, 600 WPI output power (watts per inch)
Printing width450 mm
Plate mounting tape3M E315, 0.38 mm thickness
Print run500,000 labels (experiment 1); 200,000 labels (experiment 2)
Anilox Roller Specifications
Cyan440 c/cm (1020 cpi); 4.0 cm3/m2
Magenta440 c/cm (1020 cpi); 3.0 cm3/m2
Yellow440 c/cm (1020 cpi); 3.0 cm3/m2
Black340 c/cm (860 cpi); 5.7 cm3/m2
White120 c/cm (300 cpi); 8.6 cm3/m2
Printing Substrate Specifications
Experiment 1High shrinkage 45 μm transparency Polyvinyl Chloride (PVC) shrink film for label printing; thickness: 45 μm; hardness: soft; shrinkage: 45–53%
Experiment 2Transparent 40 μm Biaxially Oriented Polypropylene (BOPP) film; thickness: 40 μm
Table 2. Dot diameter ( d D ) and dot area ( A D ) of the selected dots at three stages of printing.
Halftone Dots
No.
First Good Print100,000th Print500,000th Print
d D   ( µ m ) A D   ( % ) d D   ( µ m ) A D   ( % ) d D   ( µ m ) A D   ( % )
116155.816659.318069.7
215048.415652.416961.5
31183012734.713539.2
48314.89619.810121.9
5679.78314.88615.9
Table 3. Proper ratio between the anilox line count and the plate dot size for dot coverages from 1% to 5%.
Plate Line Screen 133 lpi (52 L/cm)
Plate Dot (%)1%2%3%4%5%
Plate Dot Diameter (μm)2230374348
Anilox Roller Praxair Proline 60°
Anilox Line Count (cpi)1120800650600500
Anilox Line Count (c/cm)440315260240200
Anilox Cell Size (μm)2133394250
Anilox Cell Opening (μm)1829353845
Anilox Cell Wall (μm)34445
Publisher’s Note: MDPI stays neutral with regard to jurisdictional claims in published maps and institutional affiliations.

