Article

Automatic Asbestos Control Using Deep Learning Based Computer Vision System †

1
Institute of Radioelectronics and Information Technology, Ural Federal University (UrFU), 620000 Yekaterinburg, Russia
2
N.N. Krasovskii Institute of Mathematics and Mechanics of the Ural Branch of the Russian Academy of Sciences, 620002 Yekaterinburg, Russia
*
Author to whom correspondence should be addressed.
This paper is an extended version of our paper published in BIG DATA & AI CONFERENCE 2020 (http://ai-conf.org/).
Appl. Sci. 2021, 11(22), 10532; https://doi.org/10.3390/app112210532
Submission received: 30 August 2021 / Revised: 14 October 2021 / Accepted: 20 October 2021 / Published: 9 November 2021
(This article belongs to the Special Issue Big Data: Advanced Methods, Interdisciplinary Study and Applications)

Abstract

:

Featured Application

Results of the work are applied to the design of the fully automatic computer vision system for online asbestos fiber content (productivity) estimation in veins of rock chunks in an open pit.

Abstract

The paper discusses the results of the research and development of an innovative deep learning-based computer vision system for the fully automatic asbestos content (productivity) estimation in rock chunk (stone) veins in an open pit and within the time comparable with the work of specialists (about 10 min per one open pit processing place). The discussed system is based on the applying of instance and semantic segmentation of artificial neural networks. The Mask R-CNN-based network architecture is applied to the asbestos-containing rock chunks searching images of an open pit. The U-Net-based network architecture is applied to the segmentation of asbestos veins in the images of selected rock chunks. The designed system allows an automatic search and takes images of the asbestos rocks in an open pit in the near-infrared range (NIR) and processes the obtained images. The result of the system work is the average asbestos content (productivity) estimation for each controlled open pit. It is validated to estimate asbestos content as the graduated average ratio of the vein area value to the selected rock chunk area value, both determined by the trained neural network. For both neural network training tasks the training, validation, and test datasets are collected. The designed system demonstrates an error of about 0.4% under different weather conditions in an open pit when the asbestos content is about 1.5–4%. The obtained accuracy is sufficient to use the system as a geological service tool instead of currently applied visual-based estimations.

1. Introduction

The analysis and evaluation of performance and productivity of valuable rock resources mining, in particular, asbestos mining in an open pit, is one of the priority tasks in the mining industry [1,2,3,4,5,6]. As a rule, the estimation of performance (productivity) in an open pit is carried out either visually or in the stationary laboratory. Visual control is the immediate one that is carried out by specialists of the geological service almost online but with comparatively low accuracy. The stationary laboratory control provides high accuracy but it is time-consuming [1]. The additional investigation of the other specificity of the laboratory-based asbestos content estimation is described in [7]. The discussion of the performance evaluation issue with the leading specialists of the LLC “UralAsbest” (Russia, Bazhenovskoye field) leads to the conclusion that effective manufacturing control requires operational information about the current productivity of asbestos in an open pit. At the time the laboratory analysis provides the precision evaluation of productivity, but is expensive and requires almost one day, thus it can be only considered as an average estimation of the asbestos output within a time shift (about 8 h). The results of the evaluation made by the geological service (visual analysis) could be very subjective. In most cases, these results differ from the laboratory ones. Moreover, the estimations made by different experts may vary significantly [7].
As a rule, geological service specialists cannot describe formally their algorithms or criterion how they make estimations of asbestos content in an open pit. Such estimation techniques are difficult to describe scientifically. Moreover, it requires much time and is rather expensive to train these specialists.
The reasons mentioned above lead to the conclusion that there is the rationale of automatic system design for the operative productivity evaluation of valuable rocks resources mining, particularly, the asbestos mining in the open pit.
It is necessary to clarify the meaning of the productivity of asbestos mining that is the relative content of asbestos fiber in the veins of rock chunks obtained after blasting of some wall in an open pit. The typical photos of an open pit, rock, and asbestos veins there are shown in Figure 1a,b.
The discussed rock chunks are collected and moved to the processing factory where the asbestos fibre is produced. For the effective management of an open pit and factory, it is necessary to evaluate and control the current productivity of asbestos fibre.
The analysis of the known engineering solutions in the mining industry has shown that contemporary computer vision systems allow the automation of such mining processes as coal and rocks classification on the conveyor [2]; the rocks and coal sorting by size [1] and types [3]; the ore size determination [4]; the fossil identification and classification in ore [8]; the asbestos fiber size estimation under microscopy [9]; and other tasks.
In most denoted and other cases, the computer vision systems for automating the mining industry are based on image processing using artificial neural networks, namely convolution neural networks (CNN) [1,2,3,4,8,9]. Moreover, in most cases, the image processing task is the object detection one [1,2,4].
Our previous work [6] referred to the development of the computer vision system for asbestos content estimation on the conveyor at the asbestos processing factory where the CNN was also successfully applied to semantic segmentation of the asbestos veins in the factory workshops [6].
The main advantages of the CNN-based approaches are the automation of the image feature extraction, selection, and transformation that are most relevant for the task. The specific choice of features is determined by the training with the relevant examples. However, the well-training requires a large size of the input data instances [10].
The result of the current task analysis encouraged the research and design of the computer vision CNN-based system for asbestos productivity (content) estimation in an open pit. The discussed system needs to solve two tasks. The first is the fully automatic asbestos-containing rock chunks detection under open pit conditions. The second one is the asbestos productivity (content) estimation for each of the automatically detected rock chunks.
Preliminary analysis of the discussed tasks supposes that the neural network framework should be considered firstly as an object detection or instance segmentation problem and the second one as a semantic segmentation problem.
One of the most popular classes of the artificial neural network for semantic segmentation is based on the so-called U-Net architecture [11]. The U-Net is the CNN-based architecture that was initially proposed for the image analysis in medical applications where it shows high accuracy, in particular, for small objects [12,13]. However, nowadays the U-Net-based approach is also popular in many of non-medical applications, in particular, the mining industry [1,2,3,4,8]. For instance, in [1], the U-Net was applied for automatization of sorting gangue from the raw coal with the training only with 60 images (54 for training and 6 for the test). In [4] U-Net was applied for the automation of ore size distribution estimation by conveyor operation images. The same U-Net-based architectures can be applied even to the analyses of small size features with rare allocation on images, for instance, paper [14] apply the U-Net to segmentation of plant roots in the soil.
One of the most popular classes of the artificial neural network for object detection is based on the Faster-R-CNN architecture [15] (including the Mask-R-CNN [16]). For instance, in [5] those architectures were applied to the rock chunks size estimation after blasting in an open pit. In addition, we recommend the following work in the tasks of the real-time scale object detection [17,18,19].
The analysis discussed above shows the feasibility of researching both the Mask-R-CNN-based architecture for instance segmentation and the U-Net-based one for semantic segmentation in the considered task.
The aim of the paper is the discussion of the experience of research and design of the computer vision system for the automatic estimation of the asbestos productivity (content) in the chunks of rocks after blasting in the open pit of the LLC “Ural Asbest” (city Asbest, Sverdlovsk region, Russia) The mentioned open pit can be considered as one of the case studies. The obtained results are scaled to any other similar cases.
It is necessary to note that this work is a continuation of the work described in [6]. However, the current task is more complex due to large distances from the camera to rock chunks, a high influence of the weather conditions (precipitation, natural light, seasons) and other factors. The novelty and contributions of this paper are the following. The paper proposed the first computer-vision-based approach to asbestos content estimation in a typical open pit and with the accuracy and time consumption values comparable with the work of geological specialists. Moreover, the U-Net-based neural network approach is applied to asbestos veins segmentation in the mentioned conditions. Moreover, it is proposed and validated to estimate average asbestos content in the rock chunks as the graduated ratio of asbestos veins areas to the corresponding rock chunks areas. All the mentioned results are validated in the conducted experiments.

2. Description of the Experimental System and Algorithm of Its Work

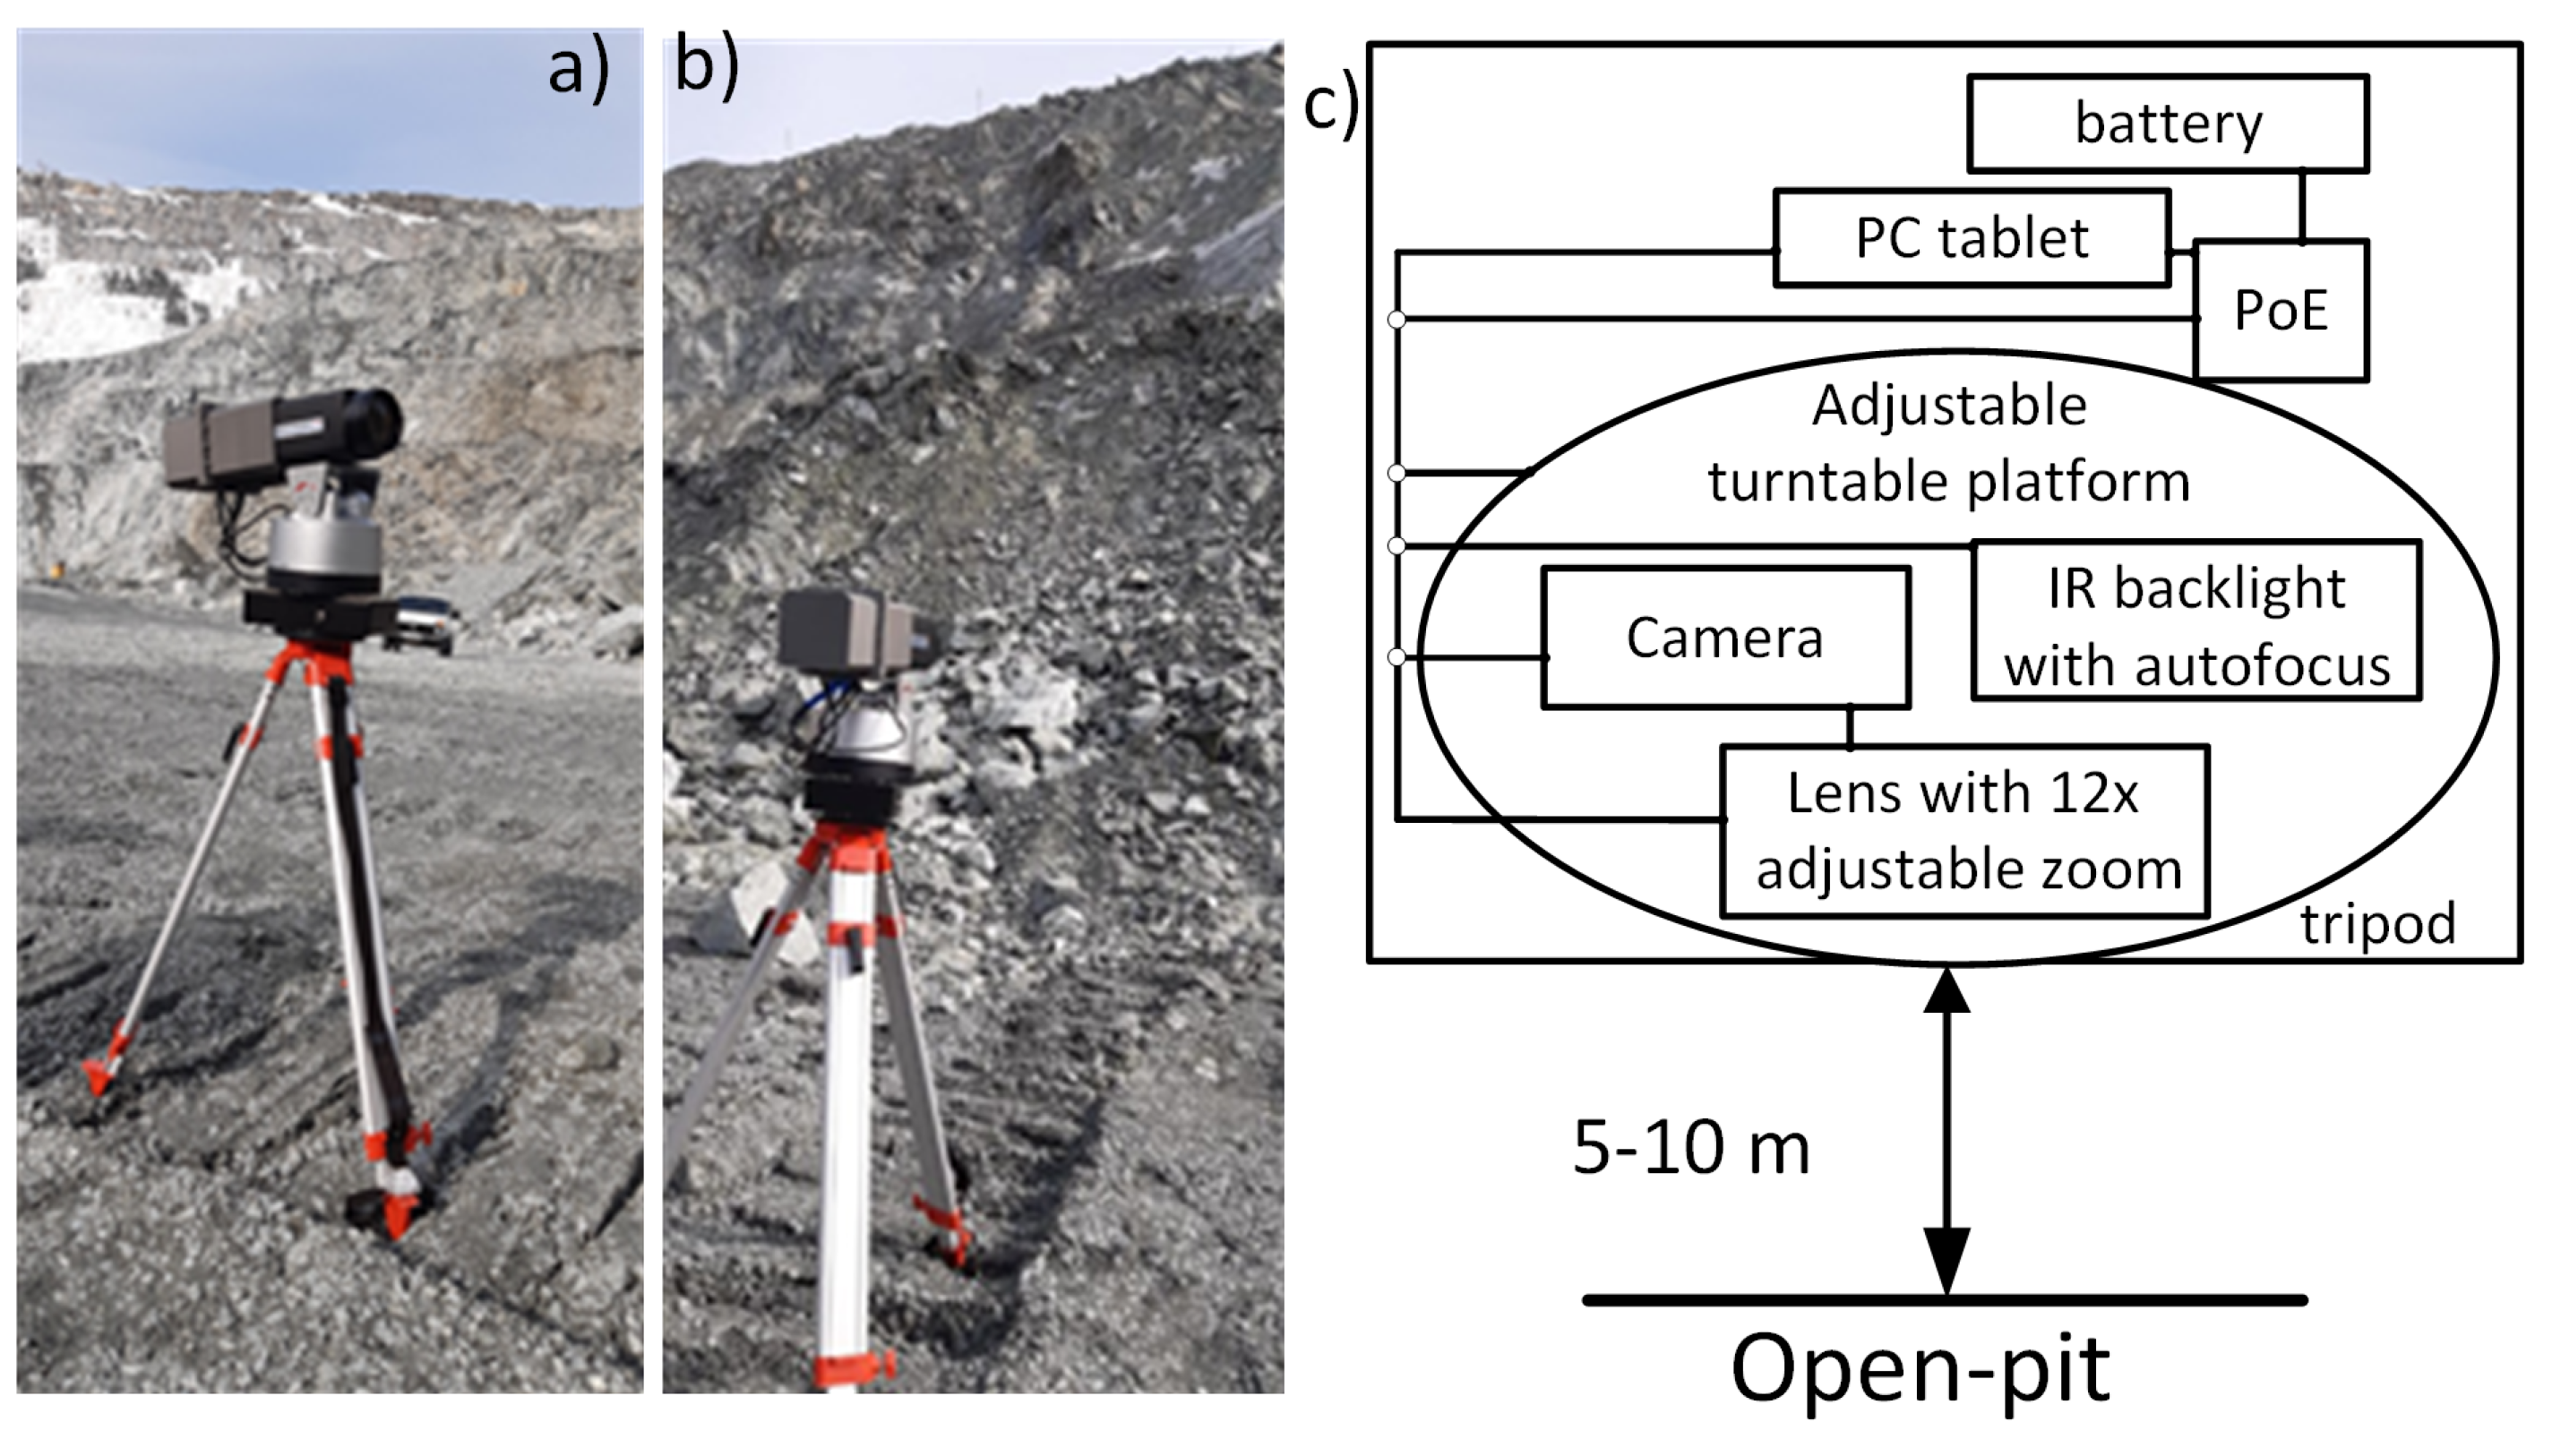
2.1. Description of the Designed Experimental System

Figure 2a–c shows the photo of the designed experimental computer vision system (a), the system photo on the background of the open pit (b) and the system scheme (c). The system in Figure 2 consists of the following components:
  • tripod as a base;
  • electrically adjustable turntable platform maintained on the tripod;
  • camera for computer vision “Dalsa Genie Nano M2590NIR” with the gray-scale matrix 1 inch and resolution 2590 × 2048 pixels (5MP), and enhanced sensitivity in the near-infrared range [20];
  • lens “LMZ25300M3P-IR” with electrically adjustable 12× zoom and enhanced sensitivity in the near-infrared range [21].
  • PC tablet for control and image processing ( Intel Core i5 3427U, Intel HD Graphics 4000, 4 GB RAM);
  • infrared backlight with wavelength 850 nm and with the manually adjustable zoom set within the distance 5–10 m with lighting angle of 30 degrees;
  • supply battery for autonomous work and PoE system (Power over Ethernet) for camera supply.
The selected camera and lens allow obtaining a resolution of about 4 pixels in 1 mm at a distance of 5 m that is assumed to be enough in comparison with the typical asbestos vein width (about 4–12 mm). Moreover, the resolution is assumed to be enough for such neural networks as the U-Net-based ones. Additionally, both the camera and lens are selected to have enhanced sensitivity in the near-infrared range. It is known that the maximum radiation of asbestos is in the near-infrared range [6,22]. The supplied battery provides 4 h of work. The control of the platform and lens is carried out automatically using the designed algorithm and its scheme described below. The full measurement time taken by the system for one open pit with 50 processed rock chunks takes about 10 minutes. The measurement time is comparable with the work of a specialist.

2.2. Algorithm of the System Work

The general principle of work of the whole computer vision system for asbestos productivity estimation in the open pit is shown in Figure 3.
The scheme in Figure 3 assumes the following stages of the general measurement Algorithm 1.
Algorithm 1:General algorithm of the system work
Input:
  • A I = W I × H I ;    # A I is the camera resolution;
  • z = f ( a R / A I ) ;    # graduation relation between rock chunks area ( a R ) and required zoom of lens (z); grading relation taken with step of zoom 5%;
  • e = g ( a v / a R ) ;    # e is the grading relation for asbestos content estimation and the veins and rock chunks areas a v and a R correspondingly;
  • s c o n f = 0.7 ;    # s c o n f is the confidence threshold for instance segmentation results;
  • K;    # K is the number of steps to fine search of rock chunks;
  • trained neural networks for instance and semantic segmentation.
Output:
  • e;    # is the estimation of the asbestos content in the open pit place.
1:
Obtaining I p ;    # image of the open pit place.
2:
Obtaining R = { R i } i = 0 N 1 ;    # Instance segmentation results of I p ; where R i = { x i , y i , w i , h i , s i , a i } ; and x i , y i w i , h i are the rock chunk coordinates, width and height correspondingly; s i is the confidence score for rock chunk i; a i is the rock chunk area (in pixels); i = 0 , , N 1 , N is the amount of the detected rock chunks.
3:
R = N o n e ;
4:
fori in N do:
5:
    if  s i > s c o n f  then
6:
         R . a p p e n d ( R i ) ;    # Rest only rock chunks with confidence higher than a threshold one.
7:
    end if
8:
end for
9:
;    # Fetch the selected rock chunks images
10:
fori in range( R . s i z e ) do:
11:
    moving the system platform to have x i , y i in the center of image;    # Coarse camera moving;
12:
     z = f ( a i / A I ) ;    # Calculate the required zoom of lens;
13:
    zoom of lens;
14:
    if  w i > h i  then:    # Select direction of the fine search
15:
         d = h o r i z o n ;
16:
    else
17:
         d = v e r t i c a l ;
18:
    end if
19:
     k m a x = 0 ; # The best camera position for the rock chunk i.
20:
     u m a x = 0 ; # Auxiliary variable.
21:
    In the direction d do:    # Search the best camera position
22:
    for k in [ − K ; K ] do:
23:
        move camera to the position k;    # To x i + k ; or to y i + k depends on the d.
24:
        take image I R ;    # Image of the rock chunk.
25:
         u = s u m ( I R * L ) ;    # * is the convolution operation;
26:
            # L = [ [ 0 , 1 , 0 ] , [ 1 , 4 , 1 ] , [ 0 , 1 , 0 ] ] is the 2 D Laplace operator.
27:
        if  u > u max  then:
28:
            u m a x = u ; k m a x = k ;
29:
        end if
30:
    end for
31:
    moving the system platform to the position x i + k or to y i + k depends on the d;
32:
    taking image I v ;    # Image of the selected rock chunk i;
33:
    obtaining a v with semantic segmentation network;    # a v is the sum of veins area in the image I v .
34:
end for
35:
calculating e = g ( i = 0 N 1 ( a v / a R ) i ) ;    # Asbestos content value calculated by the all selected rock chunks and asbestos veins inside them.
The Algorithm 1 requires preliminary graduations. The relation of the lens zoom to the ratio between rock chunk area and image area was taken in the laboratory condition to eliminate the non-linearity in the lens zoom parameters. The relation of the asbestos content estimation to the ratio between the veins areas and corresponding rock chunk areas is the subject of the investigation which is discussed below.

3. The Collected Datasets Description

The training and testing of the developed system were conducted by two datasets that were collected and partially labelled during the previous work [6] and 3 datasets that were collected specially for the presented work. All training data was labelled for the object detection and segmentation tasks.
The dataset №1 consists of 46 images of alone stones obtained in the laboratory conditions. The image size is 5184 × 3456 . The typical image and its labelled mask of rock and veins are shown in Figure 4a–c, correspondingly.
For the dataset №2 134 images of rock chunks were taken on the fixed conveyor belt of the asbestos processing factory under the fixed artificial lighting [6]. The image size is 2592 × 2048 . Each image contains about 10–20 rock chunks. Images are taken for 50 selected samples with the laboratory-measured asbestos content value. For each sample, 2–3 pictures were taken with the random shuffled position of stones (134 images in total). The typical images and their labelled mask of rock and veins are shown in Figure 5a–c, correspondingly.
The dataset №3 consists of 69 images that were taken for 6 open pits with manual aiming in sunny weather in autumn. The image size is 2592 × 2048. Each image contains one rock chunk selected by a geological specialist as typical corresponding to open pits. Typical images and their labelled mask of rock and veins are shown in Figure 6a–c, correspondingly.
The dataset №4 consists of 984 images that were taken for 10 open pits selected by the geological specialist. The image size is 2592 × 2048 . Some of the places were too long for one picture and thus were divided into parts (with taken separate images for each of the parts). There were 22 such parts in the dataset №4 at all. Each image contains one rock chunk selected by the automatic-aiming algorithm. The images were obtained in different weather in autumn and winter including sunny, cloudy, rainy and snowy weather. Typical image and its labelled mask of rock and veins are shown in Figure 7a–c, correspondingly.
The dataset №5 consists of 56 images of the whole open pit. The image size is 2592 × 2048 . The dataset was collected for solving the rock chunks detection problem. A typical image with the ground truth mask of rock chunks is shown in Figure 8.
The summary of information about collected datasets and their features is shown in Table 1.

4. CNN Architectures and Training Details

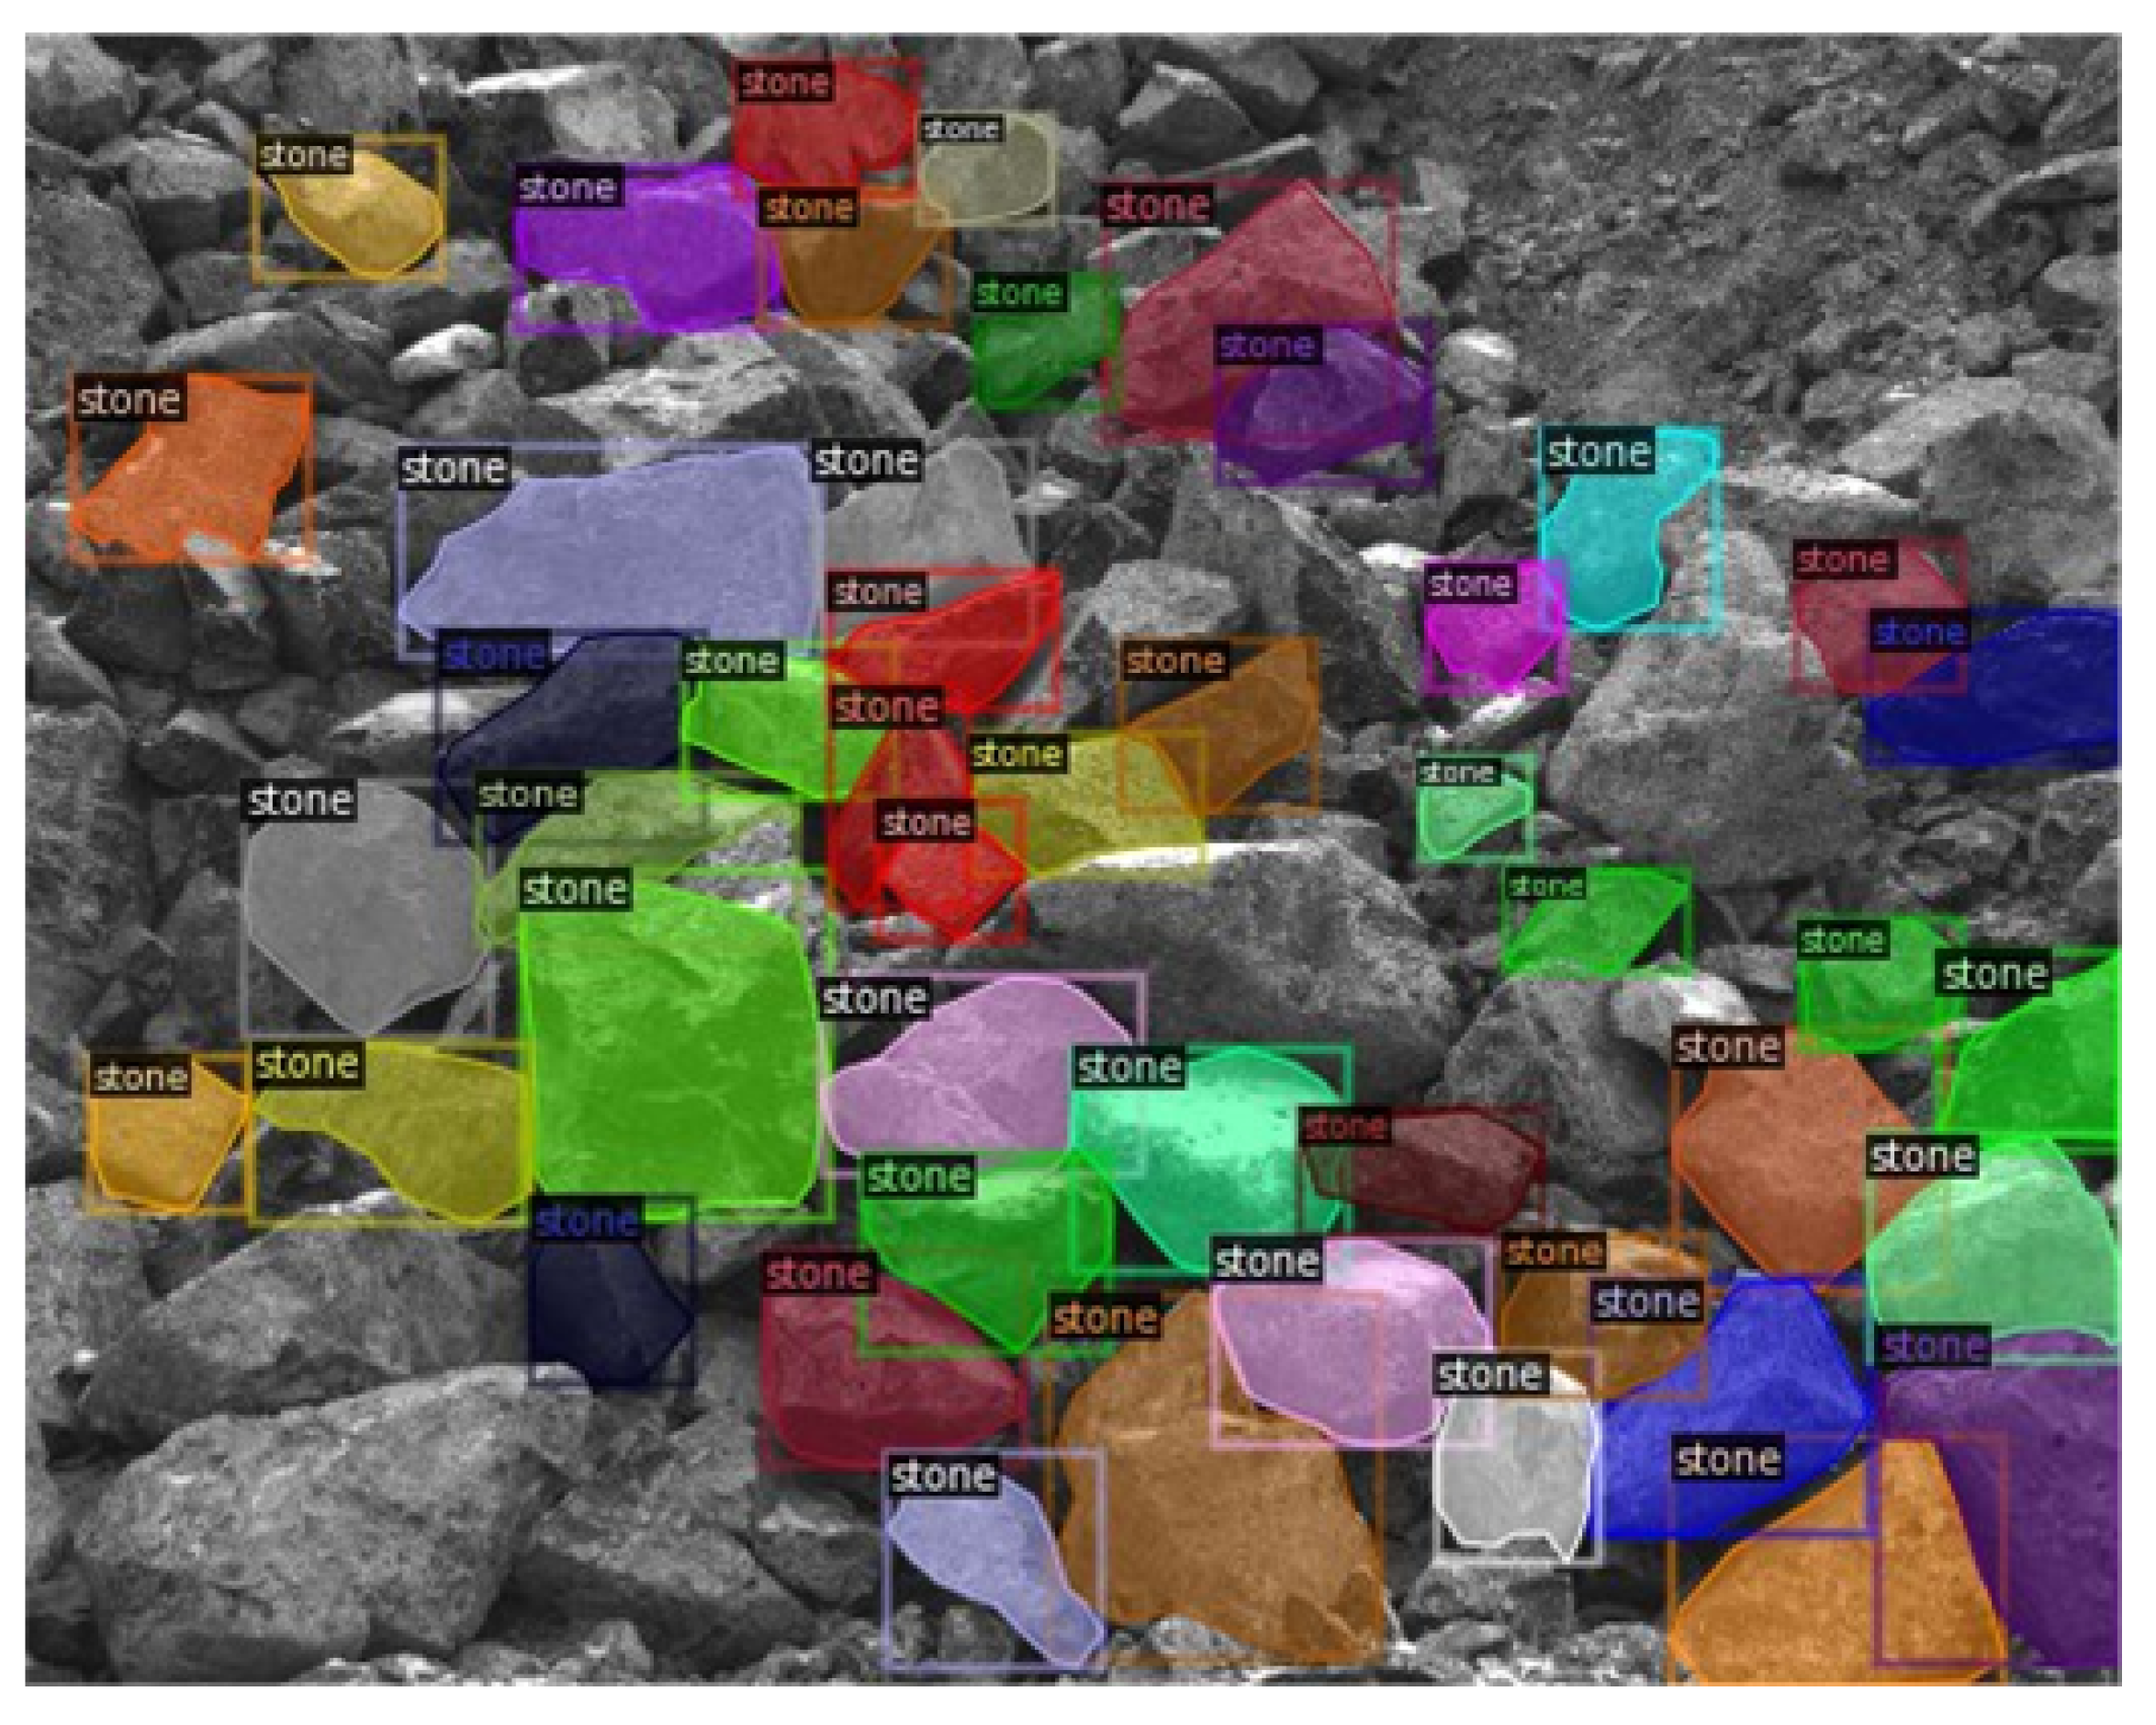
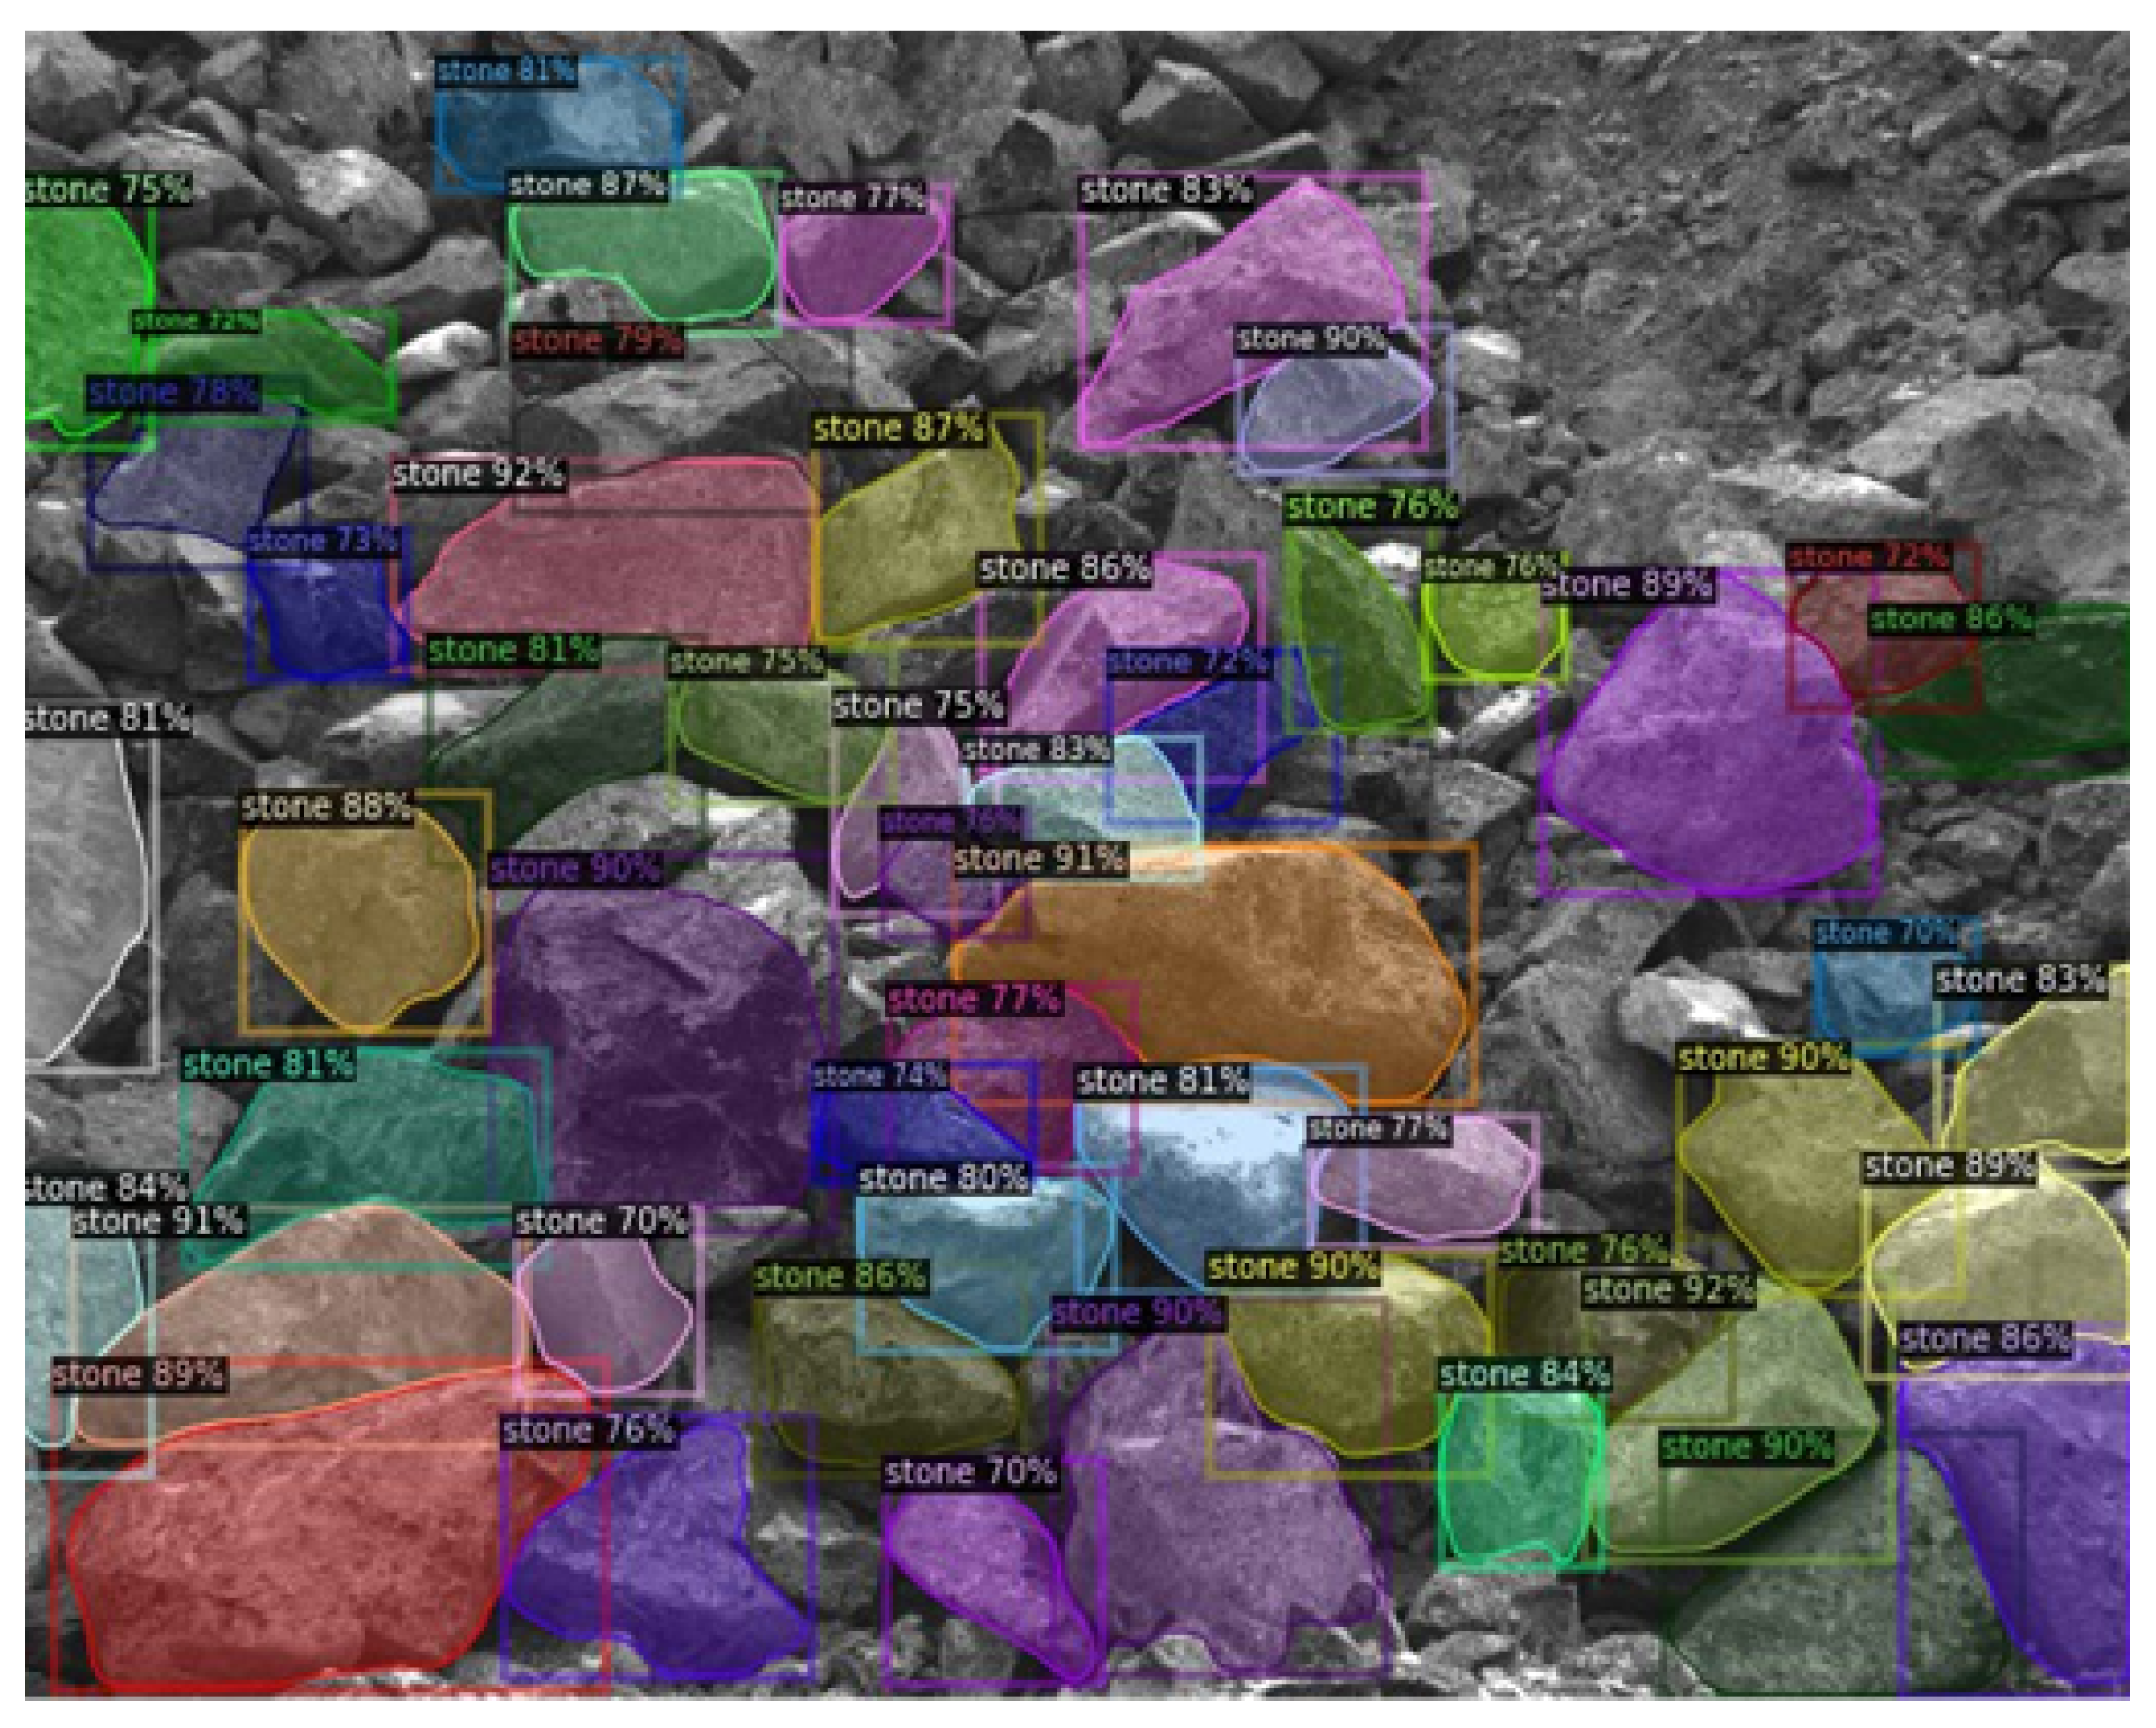
4.1. Rock Chunks Detection

The problem of the rock chunks detection on the open pit picture was solved as the instance segmentation task. The first reason for this is to evaluate the area of each stone for stage 4 of the presented scheme of the system work. In addition, it was necessary to estimate both coordinates of chunks and their area distribution by the requirement of the geological service. The Mask-R-CNN [16] based network was applied for this. The Mask-R-CNN was implemented using the ResNet-50 architecture [23] as the feature encoder (backbone) in combination with the feature pyramid network [24]. The connections of the ResNet-50 with the feature pyramid network were implemented by the so-called lateral connection [24] for blocks with 256 , 512 , 1024 , 2048 feature maps. After the feature encoder, the convolution layer with the kernel 3 × 3 was applied to reduce the aliasing effect of upsampling and to reduce the feature map number to 256 for each block. Thus, it was possible to make decisions about each point based on 256 features. For classification, the region proposal network (RPN) was applied consistently [23]. The training and inference were selected to be the same as in the original work [23]. The Mask-R-CNN network was trained with dataset №5 (rock chunks detection and instance segmentation), which was divided into the training part with 50 images and the validation part with 6 images. All images were resized to 1333 × 800 . During the inference, the ruck chunks selection was performed with the confidence threshold of 0.75 .
The typical result of the rock chunks in the open pit detection with obtained masks is shown in Figure 9. The obtained instance masks correspond to the ground truth one that is shown in Figure 8. There is an interesting detail that in the obtained mask there are more detected chunks than in the ground truth mask. This is due to the similarity between the rock chunks form (and features) in different images which allows the network to select such regular instances everywhere. This phenomenon also could be considered as an indicator of well-training (the lack of overfitting).

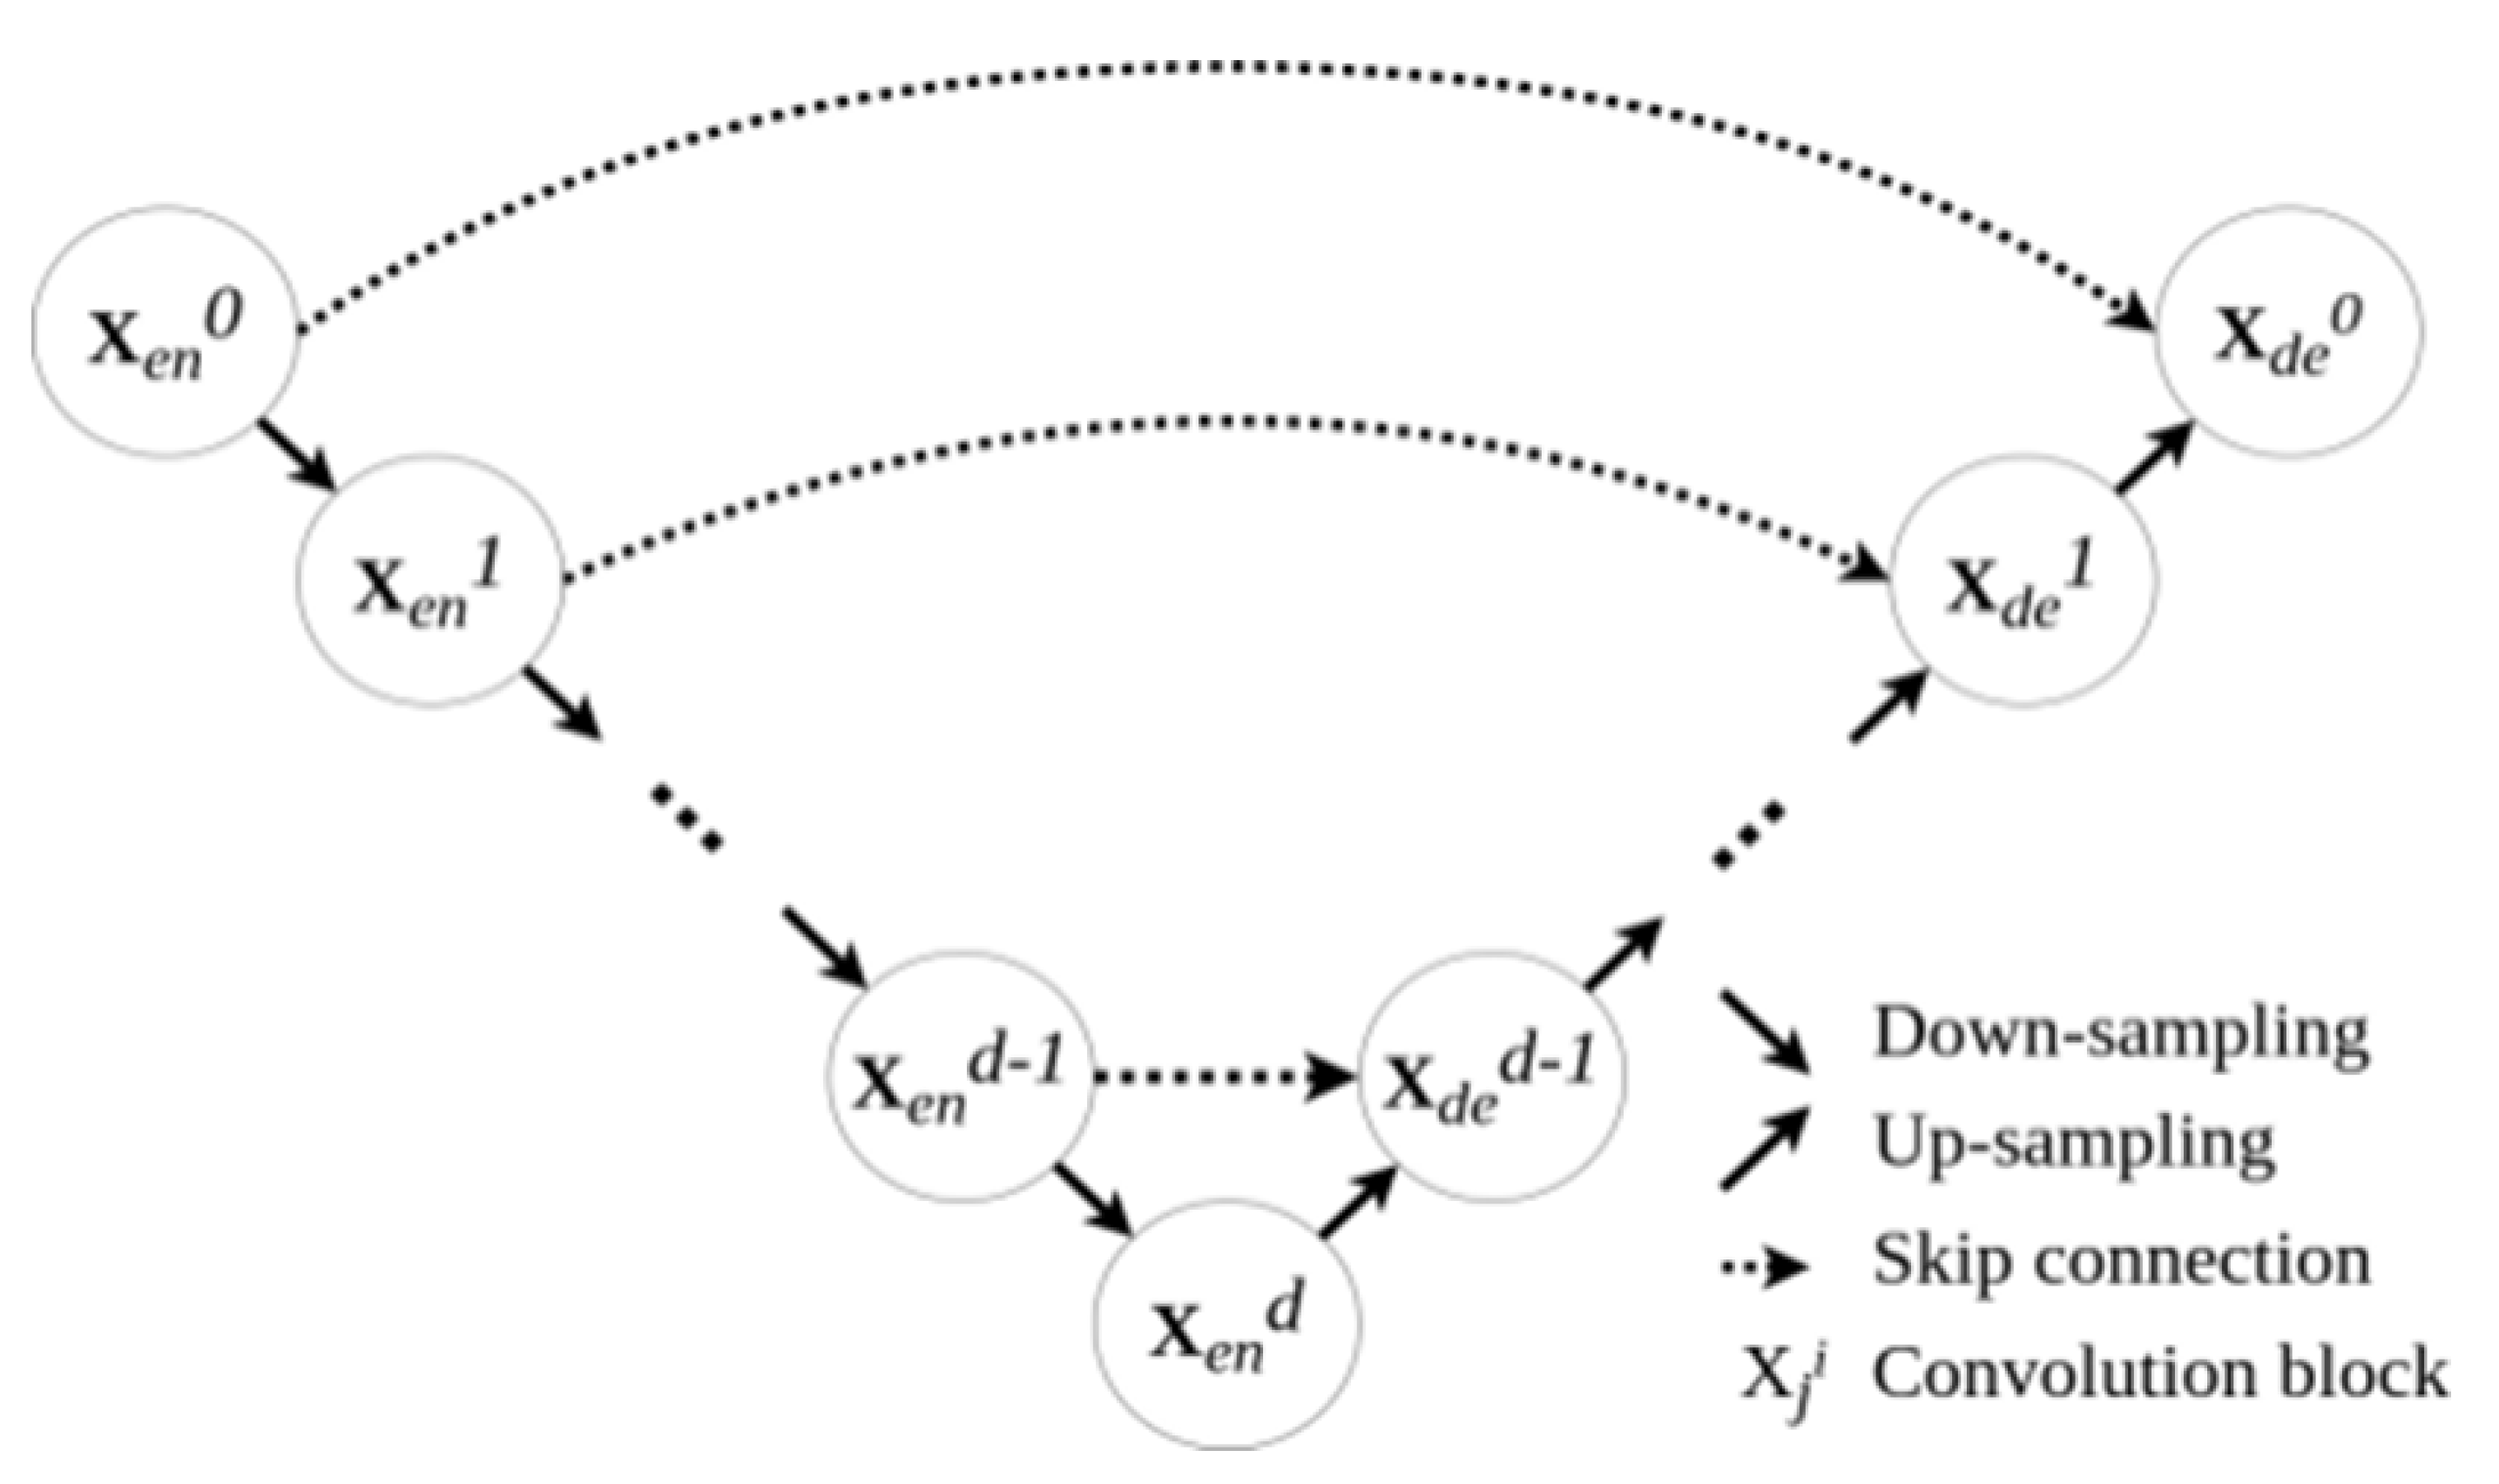
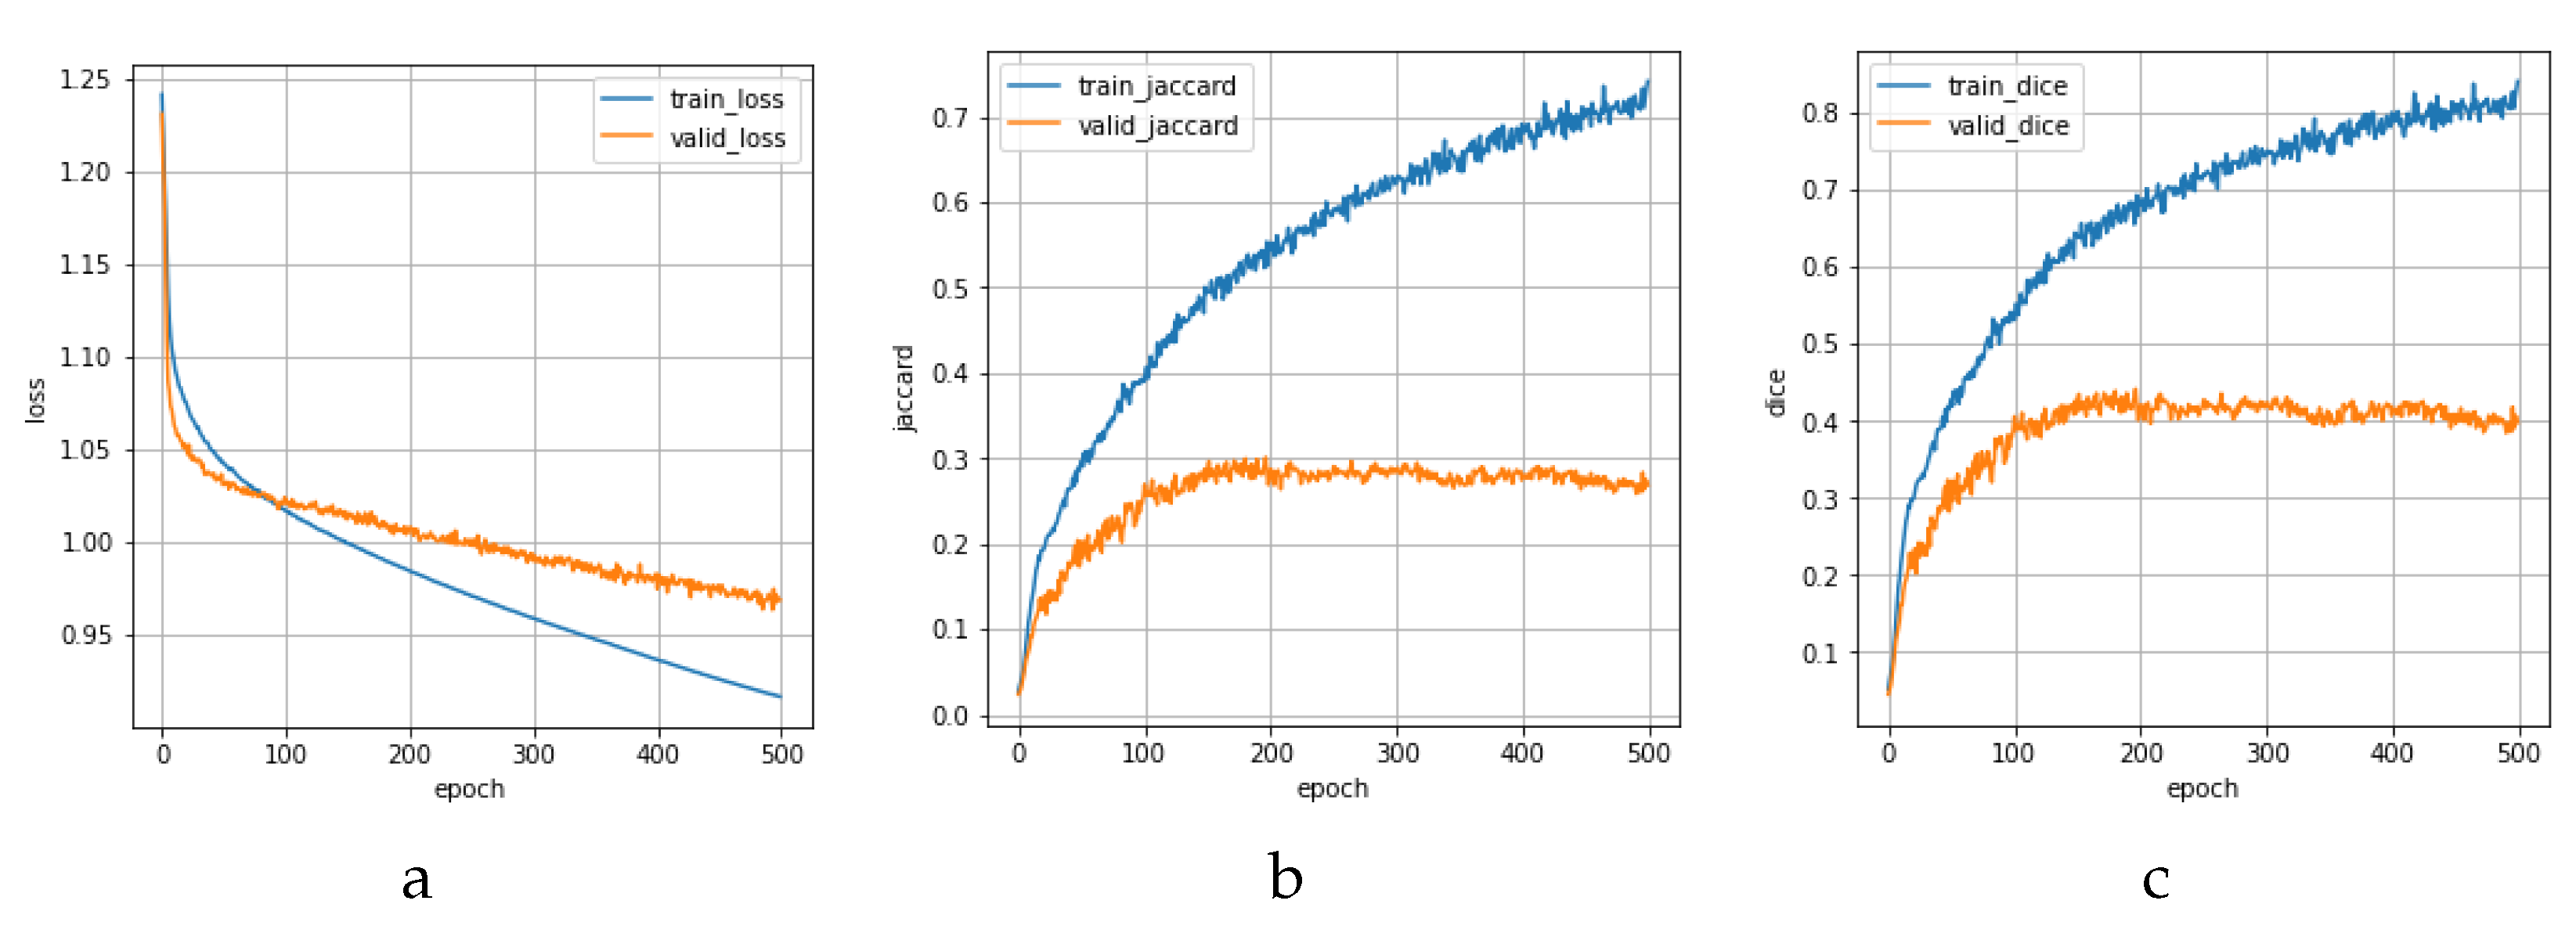
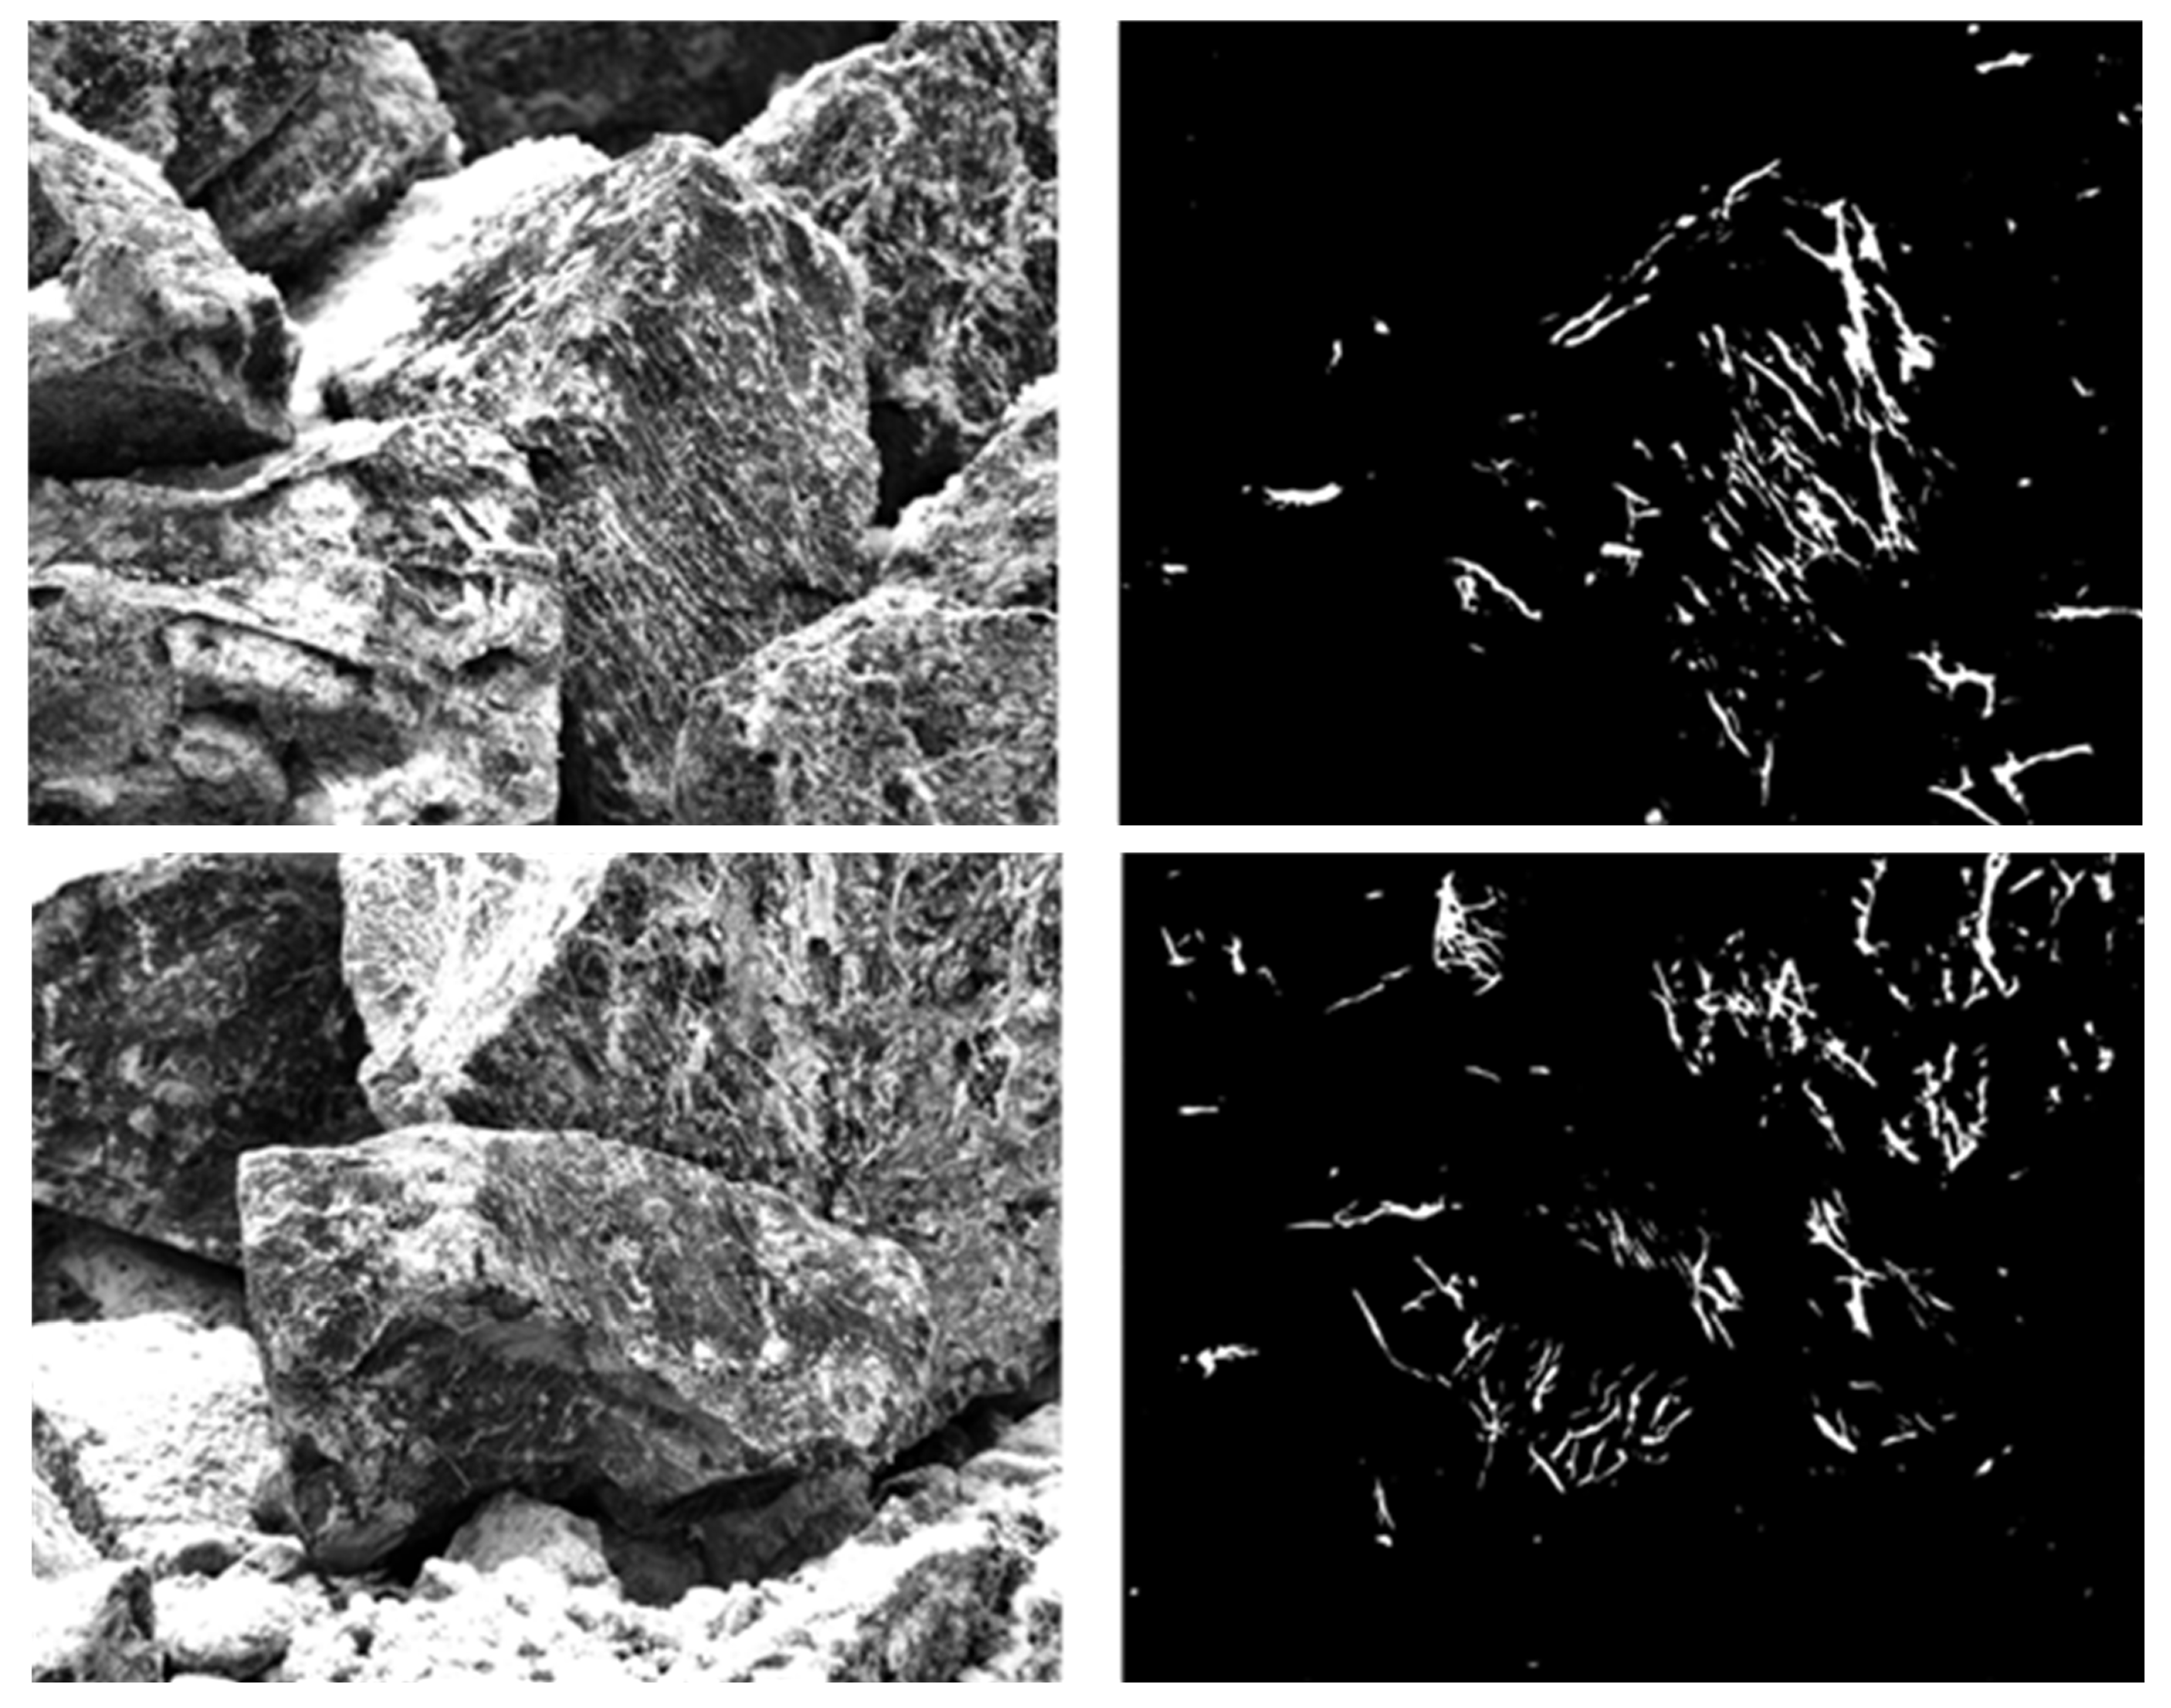
4.2. Asbestos Veins Segmentation

The U-Net-based semantic segmentation artificial neural network architecture [11] was applied to the evaluation of the asbestos content for each chunk (stage 32 of the Algorithm 1). The U-Net architecture was trained only for the segmentation of veins inside the aimed rock chunks. It is necessary to note that training rock area and veins segmentation could dramatically reduce the accuracy. We suppose that it is due to the specificity of the collected data. In the typical image, there are some vein instances much large than the number of rock chunks and the typical sum area of all veins for one chunk is only 1–4% of its area. Due to this, each stone area was determined using the Mask-RCNN (on the open pit image) as was mentioned above. The U-Net architecture is shown in Figure 10.
The standard U-Net scheme consists of the encoder part (convolution part) and decoder part (deconvolution part). At the same time, each block of the decoder of the U-Net network is implemented from the so-called pairwise convolutional layers with joint activation [11]. This provides (in contrast to the feedforward-based architectures) features to transfer from the encoder block to the corresponding decoder block. Moreover, there is no loss of small reconstructed (segmented) objects details in the decoder part. In the carried-out investigation, the standard encoder block was replaced with the EfficientNet-B3 block which implementation was taken the same as in the original paper [25]. Note that the initial weights of the EfficientNet-B3 block were taken as weights obtained by its pre-training on the ImageNet dataset [26]. For the training routine, the Adam optimizer was taken [27] with the learning rate of 10 5 and betas parameters ( 0.99 , 0.99 ) . The loss function was the binary-cross-entropy [10]. The D i c e coefficient was used as a quality metric in the training for the model evaluation [10].
The U-net model was pre-trained with datasets №1 and 2 described above. After that, the model was fine-tuned with datasets №3 and 4 described above. The fine-tuned data was divided into the test and train parts. Then the train part was mixed and divided into train and validation parts with a proportion of 50 to 50%. The test part was taken as dataset №3 and part of the dataset № 4: Six open pits, 611 images. The test part of dataset № 4 was taken under hard-winter conditions (January and February). The training part includes 442 images taken from 4 open pits; most of them were taken in autumn conditions. Such division of the data is supposed to be the most representative in the generalization ability. During the training, all images were randomly cropped to size 1024 × 1024 from the original images. The training curves are shown in Figure 11.
Figure 11 shows that the U-Net model achieves the best results at the 150th training epoch. We used the weights of the 150th epoch as the final model. The obtained measure results Dice coefficient and intersection over union (IoU) are shown in Table 2. The std and average values in Table 2 are calculated by the measure values for each instance in the dataset.
Table 2 shows some deterioration of validation results compared to the training one. However, the obtained results appear to be sufficient for the system work as shown below. Typical results of U-Net inference for the test data with confidence threshold 50 % are shown in Figure 12.

5. Asbestos Content Estimation

5.1. Method of Asbestos Productivity (Content) Estimation

The overall productivity of an open pit is determined by the average function of the estimated asbestos productivity for each of the selected rock chunks. The productivity for each rock chunk was evaluated as follows:
y ^ i = k A v A R + b 100 % ,
where y ^ i is the asbestos content for one i-th image i = 1 , , N is the number of images taken from one open pit; A v , A R are the areas of veins ( A v ) and rock chunks ( A R ) for each image; k and b are the graduation multiplicative and additive coefficients.
For determining A v , the results of segmentation were rounded to binary mask with the confidence threshold of 0.5. Then the value A v was taken as the sum of pixels.
The estimation of the overall productivity of an open pit was taken as an average value among all estimated y ^ i due to the high variation of asbestos content values between different rock chunks. For a more precise average value, the calculation was made by the approximation of the y ^ i histogram (i.e., distribution). The distribution of estimated y ^ i was approximated using the Parzen-Rosenblatt method with the normal kernel [28].
The graduation coefficients k and b in (1) were determined as the linear mean-square approximation of average measured value ( average i ( y ^ i ) ) for each open pit to its value estimated by geological specialists.

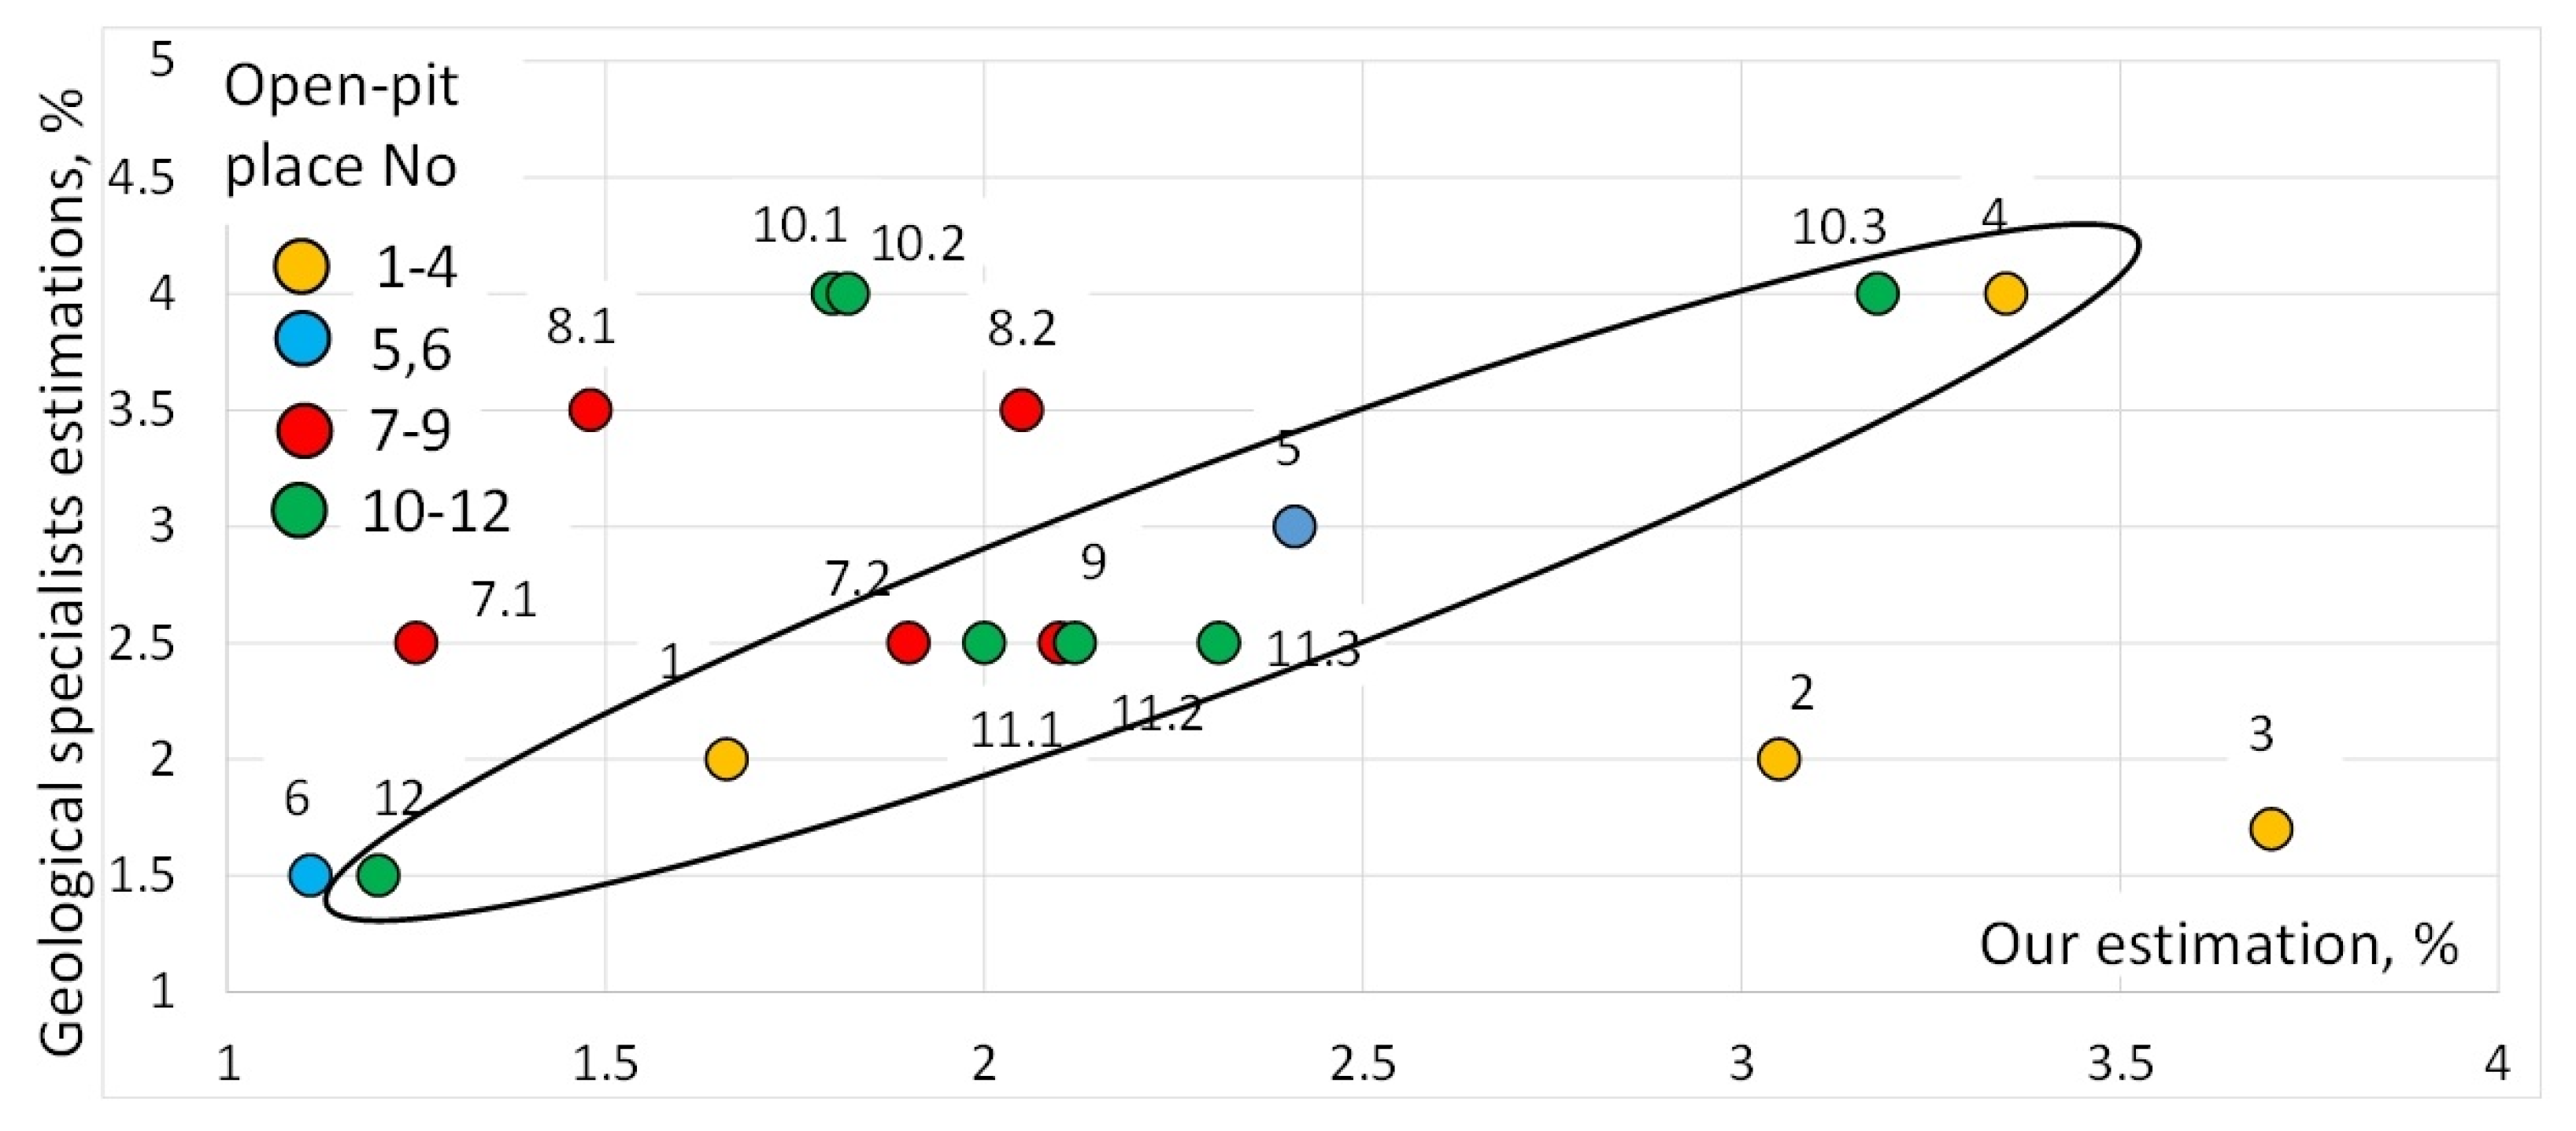
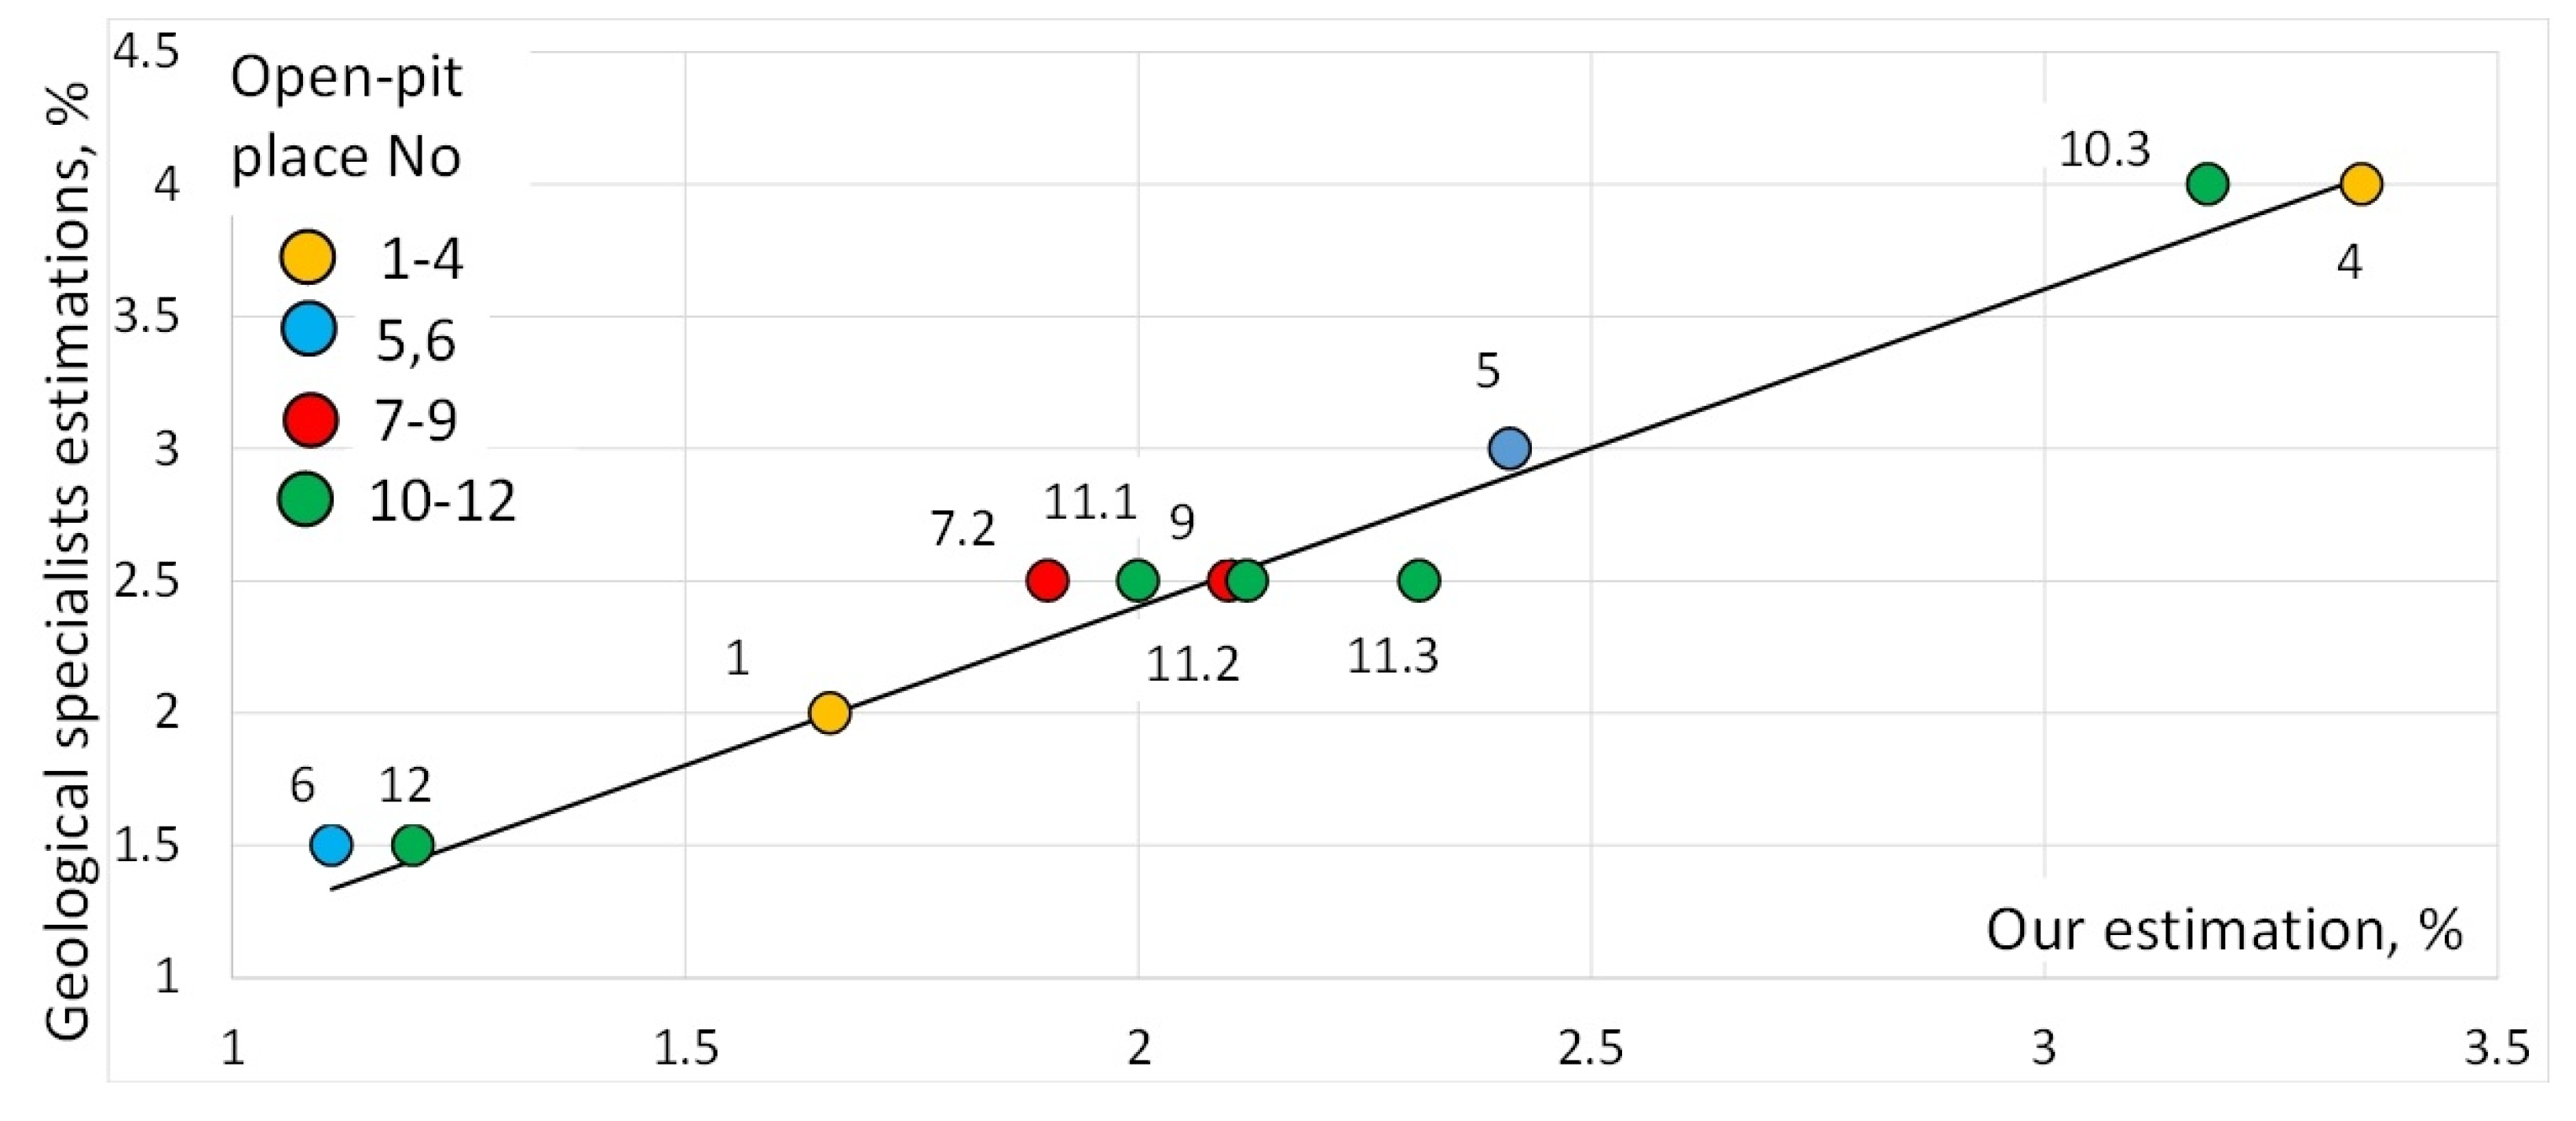
5.2. Results Discussion

The results of the average asbestos content estimation for each open pit correspond to dataset №3 are shown in Table 3, where the asbestos content means its volume relative to the corresponding rock chunk volume.
Table 3 shows the expert estimations, our estimations before the graduation ( k = 1 , b = 1 ) (column 3), the variance of our estimation, and the number of chunks taken into account. Similar results for dataset №4 are shown in Table 4, where in addition some data places are divided into parts (however, we had joint expert estimation value for the entire place). Each expert estimation was taken for the entire place. The estimation was done as a common solution of two or three experts to make it less subjective. This kind of estimation was chosen due to the lack of another way to obtain some ground truth asbestos content values.
The comparison of Table 3 and Table 4 shows that dataset №3 with manual rock chunks selection has higher estimation results in comparison with the experts’ ones for dataset №4 with the automatic-aiming. This can be explained by the specificity of the automatic-aiming algorithm. In dataset №4, there is a high number of images with empty rock chunks or invisible veins. This fact reduces the average value discussed above. Table 5 shows the test data results with bad images excluding (images with asbestos content lower than the threshold).
The results of Table 5 were taken for the graduation following the Equation (1). The visualization of the results is shown in Figure 13. The ellipse in Figure 13 is presented to show normal and abnormal results inside and outside it correspondingly. The ellipse was obtained manually only for demonstration purposes.
Most results in Table 5 and Figure 13 (11 from 18 open pit parts) can be considered as normal ones (parts of the places № 1, 3–6, 7.1, 9, 10.1, 11, 12—inside the ellipse in the Figure 13). However, the open pits 7.2, 8, 10.2, 10.3 (parts 2 and 3 of place №10) have a large deviation from the line that can be explained by the small amount of data (1 image with a rock chunk). The open pits 2 and 3 have a large deviation from the line due to the specificity of manual stone selection in those experiments (only asbestos-rich images). The results of the graduation without anomalies are shown in Figure 14.
The graduation (approximation) line in Figure 14 is obtained using the method of least squares. The line coefficients are: k = 1.2 , b = 0.003 , with R 2 = 0.973 . The results are depicted on the graduation line with scatter up to 0.4%.

6. Conclusions

The investigation is carried out for the designed computer vision system for asbestos productivity (content) estimation under open pit conditions based on the deep learning neural network approach.
During the work, the dataset of the open pits images and asbestos-containing rock chunks was collected. The dataset size is sufficient for training and testing the neural network both for the detection of rock chunks and asbestos veins inside them. The data was collected in the Ural Asbest open pit (Russia).
The scheme for asbestos content (productivity) estimation was proposed and tested. The designed algorithm allows arranging fully automatical work (with auto-aiming). The Mask-RCNN-based architecture was applied to solve the instance segmentation problem for rock chunks detection in the open pit images. The U-Net-based network was applied to solve the semantic segmentation problem for the asbestos veins area and parameters estimation using the D i c e coefficient achieved 0.43 on the validation subest and 0.35 on the test data. The possibility of linear graduation between our estimations and geological service asbestos content estimations was shown. The error of about 0.4% after graduation was obtained for the test data (asbestos content about 1.5–4%).
The results of the work have been discussed by the specialists of the LLC “UralAsbest”, where the designed system was considered as a valuable tool for geological specialists instead of current visual-based asbestos content estimations. The system allows estimation of the current (prompt) overall asbestos content (productivity) for each separate open pit and without waiting for laboratory test results. The accuracy of its work is enough for the effective management of open pit and processing factories. The system measurement time is comparable with the one of specialist work.
The presented work has some limitations, for instance, the dataset includes only images in the daytime. Such weather conditions as foggy or poor light in the early morning or late afternoon and other similar sorts have not been considered due to the lack of practical requirements, i.e., all the images were taken under similar conditions with the work of geological specialists. Moreover, this research considers only the Mask-R-CNN-based and U-Net-based architectures of the neural networks. Other types of architectures can be investigated further. However, the choice of these architectures can be explained by their popularity and high quality of the results in similar studies. In addition, we should mention the use of the specific camera only and in the distance range 5–10 m due to the requirement of vein resolution; in some other cases these results should be additionally investigated. Despite the mentioned limitation, the obtained results satisfy the practical requirements.
The comparison of the obtained results with those previously obtained in the processing-factory conditions ones shows some deterioration in Neural Network measures. This can be explained by the influence of the outer conditions, like the diversity of weather and increasing the distance to objects under control. However, the overall accuracy of asbestos content estimation remains high enough, comparable with the work of specialists. Therefore, the system improvement, should be the object of further investigation of the described problem. The next investigation can be directed to the new neural network architecture testing and its training improvement in the semantic and instance segmentation. In addition, the dataset size and its diversity will be increased.

Author Contributions

Conceptualization V.Z. and A.K.; methodology, V.Z., M.R., S.P., A.K.; investigation V.Z., M.R., S.P.; formal analysis S.P.; data curation M.R., V.Z. and A.K.; writing M.R.; supervision S.P. and A.K.; project administration A.K.; All authors have read and agreed to the published version of the manuscript.

Funding

This research received no external funding.

Institutional Review Board Statement

Not applicable.

Informed Consent Statement

Not applicable.

Data Availability Statement

The data presented in this study could be provided by request.

Conflicts of Interest

The authors declare no conflict of interest.

References

  1. Gao, R.; Sun, Z.; Li, W.; Pei, L.; Hu, Y.; Xiao, L. Automatic coal and gangue segmentation using u-net based fully convolutional networks. Energies 2020, 13, 829. [Google Scholar] [CrossRef] [Green Version]
  2. Si, L.; Xiong, X.; Wang, Z.; Tan, C. A deep convolutional neural network model for intelligent discrimination between coal and rocks in coal mining face. Math. Probl. Eng. 2020, 12, 2616510. [Google Scholar] [CrossRef]
  3. Su, C.; Xu, S.J.; Zhu, K.Y.; Zhang, X.C. Rock classification in petrographic thin section images based on concatenated convolutional neural networks. Earth Sci. Inform. 2020, 13, 1477–1484. [Google Scholar] [CrossRef]
  4. Liu, X.; Zhang, Y.; Jing, H.; Wang, L.; Zhao, S. Ore image segmentation method using U-Net and Res_Unet convolutional networks. RSC Adv. 2020, 10, 9396–9406. [Google Scholar] [CrossRef] [Green Version]
  5. Vu, T.; Bao, T.; Hoang, Q.V.; Drebenstetd, C.; Hoa, P.V.; Thang, H.H. Measuring blast fragmentation at Nui Phao open-pit mine. Vietnam using the Mask R-CNN deep learning model. Min. Technol. 2021, 1–12. [Google Scholar] [CrossRef]
  6. Zyuzin, V.; Ronkin, M.; Porshnev, S.; Kalmykov, A. Computer vision system for the automatic asbestos content control in stones. J. Phys. Conf. Ser. 2021, 1727, 012014. [Google Scholar] [CrossRef]
  7. Luzin, V.P. Complex Investigation of the Longitudinal fiber Chrisolit-Asbestos Field (In Russian) [Kompleksnye Issledovaniya Prodol’novoloknistogo Hrizotilasbesta Bazhenovskogo Mestorozhdeniya]. Available online: http://resources.krc.karelia.ru/krc/doc/publ2011/miner_tech_ocenka_118-126.pdf (accessed on 8 October 2021).
  8. Rehn, E.; Rehn, A.; Possemiers, A. Fossil charcoal particle identification and classification by two convolutional neural networks. Quat. Sci. Rev. 2019, 226, 106038. [Google Scholar] [CrossRef]
  9. Cai, C.; Nishimura, T.; Hwang, J.; Hu, X.M.; Kuroda, A. Asbestos Detection with Fluorescence Microscopy Images and Deep Learning. Sensors 2021, 21, 4582. [Google Scholar] [CrossRef] [PubMed]
  10. Goodfellow, I.; Bengio, Y.; Courville, A. Deep Learning, 2nd ed.; MIT Press: Cambridge, MA, USA, 2016. [Google Scholar]
  11. Ronneberger, O.; Fischer, P.; Brox, T. U-net: Convolutional networks for biomedical image segmentation. In Proceedings of the International Conference on Medical Image Computing and Computer-Assisted Intervention, Munich, Germany, 5–9 October 2015; pp. 234–241. [Google Scholar]
  12. Guan, S.; Khan, A.A.; Sikdar, S.; Chitnis, P.V. Fully dense UNet for 2-D sparse photoacoustic tomography artifact removal. IEEE J. Biomed. Health Inform. 2019, 24, 568–576. [Google Scholar] [CrossRef] [PubMed] [Green Version]
  13. Du, G.; Cao, X.; Liang, J.; Chen, X.; Zhan, Y. Medical image segmentation based on u-net: A review. J. Imaging Sci. Technol. 2020, 64, 20508–20510. [Google Scholar] [CrossRef]
  14. Smith, A.G.; Petersen, J.; Selvan, R.; Rasmussen, C.R. Segmentation of roots in soil with U-Net. Plant Methods 2020, 16, 1–15. [Google Scholar] [CrossRef] [PubMed] [Green Version]
  15. Ren, S.; He, K.; Girshick, R.; Sun, J. Faster r-cnn: Towards real-time object detection with region proposal networks. Adv. Neural Inf. Process. Syst. 2015, 28, 91–99. [Google Scholar] [CrossRef] [PubMed] [Green Version]
  16. He, K.; Gkioxari, G.; Dollár, P.; Girshick, R. Mask r-cnn. In Proceedings of the IEEE International Conference on Computer Vision (ICCV), Venice, Italy, 22–29 October 2017; pp. 2961–2969. [Google Scholar]
  17. Khan, W.; Ansell, D.; Kuru, K.; Bilal, M. Flight guardian: autonomous flight safety improvement by monitoring aircraft cockpit instruments. J. Aerosp. Inf. Syst. 2018, 15, 203–214. [Google Scholar] [CrossRef]
  18. Khan, W.; Crockett, K.; O’Shea, J.; Hussain, A.; Khan, B.M. Deception in the eyes of deceiver: A computer vision and machine learning based automated deception detection. Expert Syst. Appl. 2021, 169, 114341. [Google Scholar] [CrossRef]
  19. Khan, W.; Hussain, A.; Kuru, K.; Al-Askar, H. Pupil localisation and eye centre estimation using machine learning and computer vision. Sensors 2020, 20, 3785. [Google Scholar] [CrossRef] [PubMed]
  20. DALSA Genie Nano Series Manual. Available online: https://www.stemmer-imaging.com/media/uploads/cameras/dalsa/12/122239-Teledyne-DALSA-Genie-Nano-Series-Manual.pdf (accessed on 24 August 2021).
  21. Kowa LMZ25300M3P-IR. Available online: https://www.rmaelectronics.com/kowa-lmz25300m3p-ir/ (accessed on 24 August 2021).
  22. Raspution, N.V. Primenenie Opticheskikh Metodov dlia Otcenki Kachestva Asbestovykh Rud. Ph.D. Thesis, VNII Proekt Asbest, Yekaterinburg, Russia, 1984. [Google Scholar]
  23. He, K.; Zhang, X.; Ren, S.; Sun, J. Deep residual learning for image recognition. In Proceedings of the IEEE Conference on Computer Vision and Pattern Recognition (CVPR), Las Vegas, NV, USA, 27–30 June 2016; pp. 770–778. [Google Scholar]
  24. Lin, T.Y.; Dollár, P.; Girshick, R.; He, K.; Hariharan, B.; Belongie, S. Feature pyramid networks for object detection. In Proceedings of the IEEE International Conference on Computer Vision (ICCV), Venice, Italy, 22–29 October 2017; pp. 2117–2125. [Google Scholar]
  25. Tan, M.; Le, Q. Efficientnet: Rethinking model scaling for convolutional neural networks. Int. Conf. Mach. Learn. 2019, 6105–6114. Available online: https://proceedings.mlr.press/v97/tan19a/tan19a.pdf (accessed on 24 August 2021).
  26. Deng, J.; Dong, W.; Socher, R.; Li, L.J.; Li, K.; Fei-Fei, L. Imagenet: A large-scale hierarchical image database. In Proceedings of the IEEE Conference on Computer Vision and Pattern Recognition, Long Beach, CA, USA, 16–17 June 2019; pp. 248–255. [Google Scholar]
  27. Kingma, D.P.; Ba, J. Adam: A method for stochastic optimization. arXiv 2014, arXiv:1412.6980. [Google Scholar]
  28. Shields, M. Research Methodology and Statistical Methods; Scientific e-Resources: New Delhi, India, 2019. [Google Scholar]
Figure 1. Typical photos of an open pit (a), rock, and asbestos veins there (b).
Applsci 11 10532 g001
Figure 2. Photo of the developed system (a); image of system at the open pit background (b) and scheme of the system (c).
Applsci 11 10532 g002
Figure 3. The scheme of the asbestos productivity estimation in the open pit.
Applsci 11 10532 g003
Figure 4. The typical image (a) and labelled mask of alone rock chunks boundaries (b) and veins (c) for the dataset № 1.
Applsci 11 10532 g004
Figure 5. The typical image (a), its labelled mask of stone boundaries (b), and veins (c) for the dataset № 2.
Applsci 11 10532 g005
Figure 6. The typical image (a), its labelled mask of alone rock chunks boundaries (b), and veins (c) for the dataset № 3.
Applsci 11 10532 g006
Figure 7. The typical image (a), its labelled mask of alone rock chunks boundaries (b), and veins (c) for the dataset № 4.
Applsci 11 10532 g007
Figure 8. Typical image with the ground truth mask of rock chunks.
Applsci 11 10532 g008
Figure 9. The typical result of the rock chunks in the open pit detection with obtained masks. The result corresponds to the ground truth one in Figure 8.
Applsci 11 10532 g009
Figure 10. The U-Net architecture ( X e n is the encoder block, X d e is the decoder block).
Applsci 11 10532 g010
Figure 11. Training curves of the U-Net ((a) is the loss function, (b) is the J a c c a r d coefficient, (c) is the D i c e coefficient).
Applsci 11 10532 g011
Figure 12. Typical: Ground truth image (left column) and results of the U-Net inference for the test data asbestos veins (right column).
Applsci 11 10532 g012
Figure 13. Relation of our and experts estimated asbestos content values (in correspondence with Table 5); the ellipse shows normal and abnormal results inside and outside it correspondingly.
Applsci 11 10532 g013
Figure 14. The graduation curve of our and experts estimated asbestos content values
Applsci 11 10532 g014
Table 1. Datasets description.
Dataset
Part
SamplesSpecifityWeather ConditionsAim
146Alone
stones.
laboratory conditionPretraining,
semantic
segmentation
of veins.
213410–20
rock
chunks.
Conveyor
belt of the
processing factory.
Pretraining,
semantic
segmentation
of veins.
369Rock chunk
in the
open pit
with the
manual
aiming.
6 open pit,
sunny weather
in autumn.
Test,
semantic
segmentation
of veins.
4984Rock chunk
in the
open pit
with auto
aiming.
12 open pits
(22 parts), sunny,
cloudy, rainy,
and snowy
weather in the
Autumn and Winter.
Train,
test semantic
segmentation
of veins.
556Open pit
places.
Sunny, cloudy, rainy,
and snowy weather
in Autumn and Winter.
Train, test
instance
segmentation
of rock chunks.
Table 2. U-Net model train and test results (Dice coefficient).
DiceIoU
TrainValidationTrainValidation
mean0.540.430.420.27
std0.290.170.250.13
Table 3. Asbestos productivity estimation before the graduation for dataset №3.
Expert EstimationsOur EstimationsVarianceNumber of Images
12.0 %1.51%0.05%8
22.0 %2.80%1.15%10
31.7 %3.71%1.50%5
44.0 %3.19%0.82%12
53.0 %1.9%1.01%26
61.5 %1.17%0.26%8
Table 4. Asbestos productivity estimation before the for dataset №4.
Expert EstimationsOur EstimationsVarianceNumber of Images
Test part, 542 images
72.5 %0.69%0.16%48
0.65%0.88%49
83.5%0.70%0.09%35
0.84%0.17%45
92.5%0.98%0.31%49
104.0%0.61%0.68%45
0.73%0.18%39
0.49%0.14%58
112.5%1.31%1.25%28
1.94%2.13%39
2.35%3.46%44
121.5%0.63%0.16%63
Train and validation part, 442 images
131.5%0.69%0.14%55
0.74%0.11%49
142.5%1.16%0.36%45
1.11%0.37%50
0.72%0.21%45
154.0%0.91%0.25%47
0.97%0.18%43
0.82%0.39%41
162.5%1.33%0.46%35
1.25%0.56%32
Table 5. Asbestos productivity estimation for test data with threshold.
NoExpert
Estimations
Our Estimations
After Threshold
Effective Number
of Chunks
Number
of Images
12.0%1.66%78
22.0%3.05%1010
31.7%3.7%55
44.0%3.35%1112
53.0%2.41%1826
61.5%1.11%88
72.5%1.9%148
1.25%149
83.5%1.48%135
2.05%145
92.5%2.0%1049
104.0%1.8%345
1.82%139
3.18%158
112.5%2.0%2328
2.12%3939
2.31%4444
121.5%1.2%1863
Publisher’s Note: MDPI stays neutral with regard to jurisdictional claims in published maps and institutional affiliations.

