Abstract
The addition of surfactants to pesticide spray applications is an important method to improve the spray atomization and the coverage of droplets on the target. The effects of different types of surfactants on spraying have been extensively studied, but there have been few studies on the commonly used surfactant polyethylene glycol so far. This article compares the effect of polyethylene glycol 20,000 on the atomization and deposition characteristics by measuring the droplet size and the deposition on the polyethylene collection line when spraying different concentrations of polyethylene glycol 20,000 solution. The results show that the volume medium diameter DV0.5 of spraying different concentrations of polyethylene glycol 20,000 solution is larger than that of clear water, and that as the concentration increases, the volume medium diameter DV0.5 gradually increases but ΦVol < 150 μm decreases. Spraying different concentrations of polyethylene glycol 20,000 solution at a horizontal distance of 2–7 m from the nozzle and at a distance of 0.1–0.2 m from the bottom of the floor, the depositions are all less than that of clear water, and as the concentration increases, the deposition becomes smaller. This article can provide theoretical support for the use and concentration ratio of polyethylene glycol 20,000 in field application.
1. Introduction
The use of chemical pesticides is currently one of the main methods in plant protection operations to control crop diseases and insect pests. Surfactants have been utilized in order to achieve the reduction of pesticides and to increase efficiency, improve pesticide application equipment and minimize pesticide drift [1,2], as well as to optimize atomization effects [3]. Surfactant is a substance added in the pesticide spraying process, which can improve the physical properties and atomization performance of the pesticide liquid, thereby increasing the deposition of droplets on the target and the utilization rate of the pesticide.
The degree of pesticide atomization directly affects the deposition effect of the chemical solution on the target and the drift of the non-target area [4,5,6,7], which in turn affects the control effect of pesticides on pests and diseases [8,9,10]. Larger droplets can reach the target faster and are not easy to drift, however, too large droplets can easily cause uneven coverage and liquid loss [11]. Smaller droplets are more likely to evaporate and drift due to their low mass and large air resistance [12,13], but small droplets help to improve the coverage and uniformity of the pesticide solution on the target.
Because of the existence of the above phenomenon, it is of great significance to study the influence of the addition of surfactants on the atomization effect and deposition characteristics of the pesticide liquid and to discern the most appropriate amount.
Wang et al., Fritz et al. [14,15] believed that adding surfactants of different components to the spray solution could improve the droplet size distribution and have a significant effect on reducing droplet drift. Yu et al. [16] added surfactants to the spray mixture containing water and pesticides and found that 343 μm droplets were formed on the leaves of Begonia at 60% RH, the evaporation time was greatly reduced, and the maximum coverage area was increased. Gimenes et al. [17] studied the dispersion and evaporation of a single droplet with a diameter of 300 μm on the surface of four soybean plants (front and back leaf surface, petiole, basal stem) and found that the adjuvants can improve the homogeneity of spraying pesticides, increase coverage and effectively slow down the evaporation of droplets. Sundaram et al. [18] used a rotating disc atomizer to study the effects of two surfactants on the droplet size and deposition characteristics of nine sprays in the laboratory and found that the low deposition of small droplets on the sampling device was recovered, but the droplet size of formulations containing non-ionic surfactants increased; thereby very high spray deposits were recovered on the sampling device. Celen [19] studied the spray with drift control adjuvants, collected the deposition and downwind drift of vineyard canopy on filter paper, and concluded that the deposition was highly correlated with drift distance and concentration of adjuvants. Additionally, in the treatment with adjuvants, almost no deposition was found on the filter paper within the range of 2–4 m. It can be seen that extensive studies have shown that different types of surfactants have significant effects on the atomization and deposition characteristics of spray droplets. As a surfactant commonly used in pesticide sprays, polyethylene glycol (PEG) should be taken seriously for its effect on the atomization effect of pesticide liquids and the deposition characteristics on the target, because this determines whether the pesticide liquids can be effectively atomized and get good coverage on the target. However, the research on the surfactant polyethylene glycol is so far poorly investigated and related studies need to be expanded.
The particle size distribution of the droplets is the main detection index for the degree of pesticide atomization [20,21,22]. The main means to study the particle size distribution of spray droplets are field paper card measurement and indoor instrument measurement [23]. At the same time, indoor wind tunnel tests are often used to study the deposition characteristics of spray droplets under specific conditions. This is because during the field trials, the uncontrollability of environmental temperature, humidity, wind speed and other factors leads to poor test repeatability [24]. Spray parameters and environmental parameters can be accurately controlled in the in-door spray test, making the test repeatable [25,26].
The aim of this work is to explore the influence of PEG-20,000 concentration on the atomization effect and deposition characteristics of the pesticide and compare how much concentration ratio can get a relatively good effect. In this paper, a standard fan-shaped nozzle TEEJET 80-03 VP was used in the NJS-1 plant protection wind tunnel laboratory to spray different concentrations of surfactant PEG-20,000 solution with clear water as a contrast. Then, a spray droplet deposition test bench was built to measure the deposition characteristics of the nozzle under various spray parameters. This study can provide a reference for the selection of spray parameters and the formulation of PEG-20,000 in practical operation.
2. Materials and Methods
The research of Fritz et al. [27] shows that the test results of droplet size at low air velocity will have a large spatial deviation. When the air velocity is 6.7 m/s and the distance between the nozzle and the laser is 30.5 cm, the spatial deviation of the droplet size results can be controlled within 5%, so this setting is used to measure the particle size of the droplets in this study, and the spray surface of the nozzle is parallel to the wind speed of the wind tunnel. The test device is shown in Figure 1. The device is composed of a laser particle size analyzer, spray system and lifting device. The laser particle size analyzer is a DP-02 spray laser particle size analyzer produced by Zhuhai Omega Company (Zhuhai, China). The distance between the transmitter and the receiver is adjustable. In this experiment, the distance between the transmitter and the receiver is 1200 mm. The particle size measurement range is 0.5~1500 μm, and the repeatability error is less than 3%.
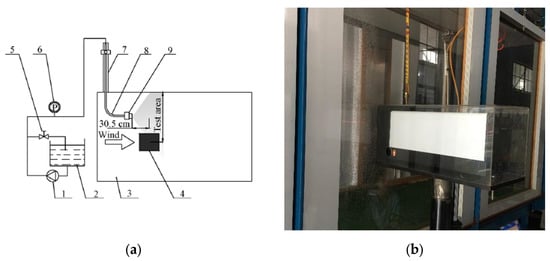
Figure 1.
Droplet size test system.1. Liquid pump 2. Water tank 3. NJS-1 wind tunnel 4. DP-02 laser particle size analyzer 5. Pressure regulating valve 6. Pressure gauge 7. Lifting rail 8. Spray boom 9. Nozzle. (a) Schematic diagram of test system; (b) Physical map of the test system.
The test was completed in the NJS-1 Plant Protection Wind Tunnel Laboratory of Nanjing Institute of Agricultural Mechanization, Ministry of Agriculture and Rural Affairs in November 2020 [28] at room temperature of 14 ± 2 °C and relative humidity of air of 60 ± 5%.
2.1. Experimental Material
The spray sample was a mixture of surfactant PEG-20,000 (Xilong Science Co., Ltd., Shantou, China) and tap water in a certain proportion, and it is compared with the clear water used in the laboratory. PEG-20,000 is a non-ionic adjuvant with a waxy solid shape. It can be mixed with pesticides after being diluted a certain number of times. Its function is to reduce the surface tension and increase the adhesion of the liquid.
The test nozzle is the fan nozzle Teejet 80-03 VP produced by TEEJET Company (Springfield, IL, USA). Three conventional spray pressures are used in the test, and the specific design is shown in Table 1.

Table 1.
Spray parameters.
In the following table, for convenience, serial number 1 represents clear water, serial number 2 represents 10 g/L PEG-20,000 solution, serial number 3 represents 20 g/L PEG-20,000 solution, and serial number 4 represents 30 g/L PEG-20,000 solution.
2.2. Experimental Design
2.2.1. Droplet Size Experiment
The particle size of a spray droplet is usually analyzed by the characteristic points on the droplet diameter distribution curve, which is generally called the characteristic dia-meter of a droplet. It represents the percentage of the volume of all droplets below a certain diameter in the total volume of all droplets, and this ratio is marked in the form of a symbolic subscript, and the subscript values of the characteristic diameter are all less than 1. Typical characteristic diameters include DV0.1, DV0.5, and DV0.9.
The divergence is also an important indicator to describe the size of a droplet [29], which is generally evaluated by uniformity, relative size range, divergence and divergence boundary, etc. According to the American Society of Agricultural and Biological Engineering (ASABE) and the American National Bureau of Standards (ANSI) 572.1 standard, the size uniformity of agricultural spray drops was evaluated by the Relative droplet spectrum width (RS), which is defined as Equation (1) and represents the range of droplet diameter relative to the medium diameter of volume. Generally speaking, the larger the RS value, the larger the droplet size range and the worse the uniformity.
In this paper, the typical characteristic diameters of droplets DV0.1, DV0.5, DV0.9 and the relative span of droplet distribution RS are used as the evaluation parameters to evaluate the degree of spray atomization.
2.2.2. Deposition and Distribution Experiment
The test device is composed of three parts: the NJS-1 plant protection wind tunnel, spray system, and collection system developed by Nanjing Institute of Agricultural Mechanization, Ministry of Agriculture and Rural Affairs (Nanjing, China). The test device is shown in Figure 1. The speed of the axial fan in the wind tunnel is controlled by changing the frequency of the frequency converter, so as to obtain different stable wind speed. The size of the test section of the wind tunnel is 1.2 × 1.8 × 10 m (width × height × length), and the wind speed adjustment range is 0.5~10 m/s; The spray system is composed of the motor, liquid pump, water tank, pressure gauge, pressure regulating valve, nozzle, solenoid valve, timing relay, etc. The collection system mainly includes collection racks of different heights and distances. The height of the nozzle from the ground is fixed at 0.5 m, and the direction of the nozzle is determined to be vertical downward, on the basis of the principle is: the long axis of the spray plume and the wind direction are perpendicular to each other, and the deposition is collected by a polyethylene wire with a diameter of 2 mm. Five polyethylene lines with an interval of 0.1 m were placed from 0.1 to 0.5 m above the ground at 2 m in the horizontal direction of the nozzle, and artificial grass was laid on the ground to prevent droplets from splashing on the ground and polluting the collection line. These collection lines are used to collect droplets passing through the vertical plane air, named V1, V2, V3, V4 and V5 from bottom to top; in addition, 6 collection lines are placed at a height of 0.1 m from the ground along the horizontal direction and separated by 1 m to collect the horizontal drift of the spray from 2~7 m, named H1, H2, H3, H4, H5 and H6 from the inside to the outside (where V1 = H1). The whole measurement system is shown in Figure 2, and the deposition collection system is shown in Figure 3.
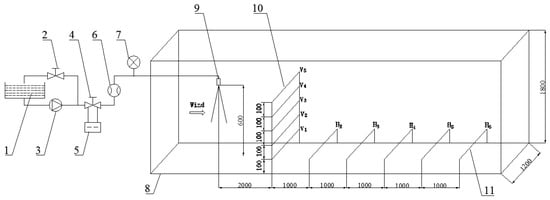
Figure 2.
Measurement system of deposition distribution. 1. Water tank; 2. Return water pressure regulating valve; 3. Liquid pump; 4. Spray pressure regulating valve; 5. Timing relay; 6. Flowmeter; 7. Pressure gauge; 8. Wind tunnel; 9. Nozzle; 10. Vertical collection rack; 11. Horizontal collection rack.
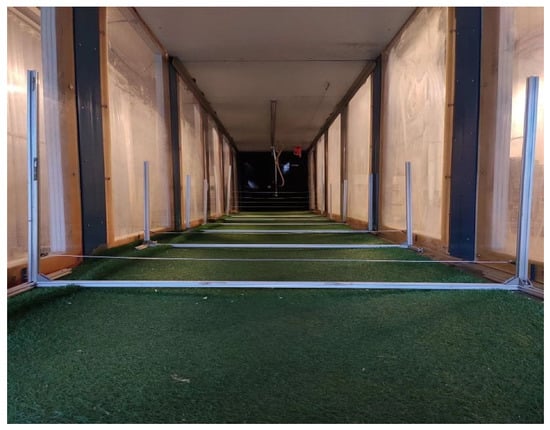
Figure 3.
The deposition collection system.
In daily plant protection operations, when the environmental wind speed is ≥4 m/s, the plant protection UAV cannot perform effective operations. Therefore, the wind speed is set to 3 m/s when the deposition experiment is carried out. Taking into account the saturation of the deposition on the sampling line, the flow of the nozzle is controlled by an electronic timer to control the opening and closing of the solenoid valve to ensure that the spray time of each test is maintained at 10 s. Fluorescent tracer BSF was added to the spraying medium in the proportion of 0.3 g/L to clear water. After each spray, 10 min are needed to ensure that the droplets on the polyethylene wire are solidified, and then tweezers are used to remove the polyethylene wire from the collection rack. After that put the polyethylene wire into a U-shaped tube with 30 mL distilled water and wash it with full oscillation through an ultrasonic cleaner. The eluent of each test is poured into the prepared test tube, and then brought back to the laboratory to determine the concentration of the fluorescent by a calibrated fluorescence spectrophotometer. At the same time, in order to ensure the consistency of the test, at the beginning and end of each test, calibration is carried out under the conditions of spray pressure 0.3 MPa and wind speed 3 m/s. If the results of two tests are within a 90% confidence interval, then they would be considered acceptable; otherwise, the test parameters should be recalibrated. Each experiment was repeated 3 times, and the average value was taken as the final data.
2.2.3. Calculation Method of Drift Potential
In order to better illustrate the deposition characteristics of the nozzle under different spray conditions, this article will calculate the DP (drift potential) of the nozzle under different spray parameters, which represents the relative value of drift deposition compared with nozzle spray volume. It uses numerical integration calculation methods to study the DP in the vertical and horizontal directions, which are DPV and DPH values respectively.
The calculation method of DPV on the vertical plane at 2 m down the nozzle is shown in Equations (2) and (3). This method was proposed by Miller et al. [30], and Herbst et al. [31] also used this method for statistical analysis.
DPV is the potential performance of spatial drift based on numerical integration on the plane at a distance of 2 m from the nozzle, μL/mL; PVi is the relative drift deposition on the i-th vertical collection line for each 1 L of solution sprayed from the nozzle, μL/L; Δhi is the height interval corresponding to each collection line, respectively 0.05, 0.1, 0.1, 0.1 and 0.05 m; AVi is the drift deposition on the i-th vertical collection line, mg/L; W is the volume of eluted water, 30 mL; K is the tracer concentration, 300 mg/L; Q is the nozzle flow rate, L/min.
The DPH calculation method of the nozzle on the horizontal settlement surface is shown in Equations (4) and (5). Nilars [32] used this method for statistical analysis.
DPH represents the potential performance of ground drift based on numerical integration, μL/mL; PHi is the relative drift deposition on the i-th horizontal collection line for every 1 L of solution sprayed from the nozzle, μL/L; AHi is the drift deposition on the i-th horizontal collection line, mg/L; Δxi is the distance interval corresponding to each horizontal collection line, respectively 0.5, 1, 1, 1, 1 and 0.5 m.
On the basis of the above calculation of the DP, when the spray pressure is 0.3 MPa, the value of spraying water is set as the reference. The values under all other spray conditions are compared with it to calculate the DPRP (Drift Potential Reduction Percentages), as shown in Equation (6):
DPRP represents the drift potential reduction percentages, %; DPrs represents the drift performance under the reference spray, μL/mL; DPos represents the drift performance under other spray conditions, μL/mL.
3. Results
3.1. Analysis of the Test Results of the Droplet Size Distribution of the Teejet 80-03 Nozzle
Table 2 shows the test results of droplet size under different pressures and spraying medium conditions. The droplet size distribution is shown in Figure 4.
Table 2.
Changes of nozzle droplet size distribution and relative droplet spectrum width under different spraying parameters.
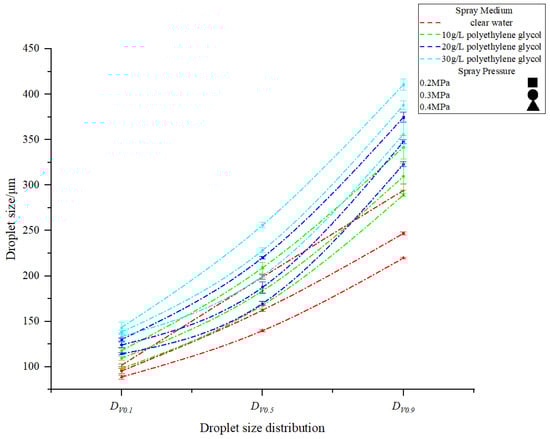
Figure 4.
Droplet size distribution under different spray conditions.
It can be seen from Table 2 that under the same spraying medium, as the pressure increases, DV0.1, DV0.5 and DV0.9 will become smaller, the value of ΦVol < 150 μm will increase accordingly, but the relative droplet spectrum width RS change little; When the spray pressure increases by 100% (from 0.2 MPa to 0.4 MPa), the volume medium diameter DV0.5 of the four spraying media decreases by 29.7%, 19.7%, 22.9% and 21.9%, respectively, ΦVol < 150 μm increased by 42.2%, 24.6%, 29.7% and 83.2%. Spraying 10 g/L PEG-20,000 solution under three pressures, the volume medium diameter DV0.5 increased by 5.2%, 13% and 20% compared with clear water, and ΦVol < 150 μm decreased by 4.9%, 11.5% and 16.7%; in the same way, spraying 20 g/L PEG-20,000 solution under three pressures, the volume medium diameter DV0.5 increased by 10.8%, 15.5% and 21.3%, ΦVol < 150 μm reduced by 9.7%, 13.4% and 17.6%; spraying 30 g/L PEG-20,000 solution under three pressures, the volume medium diameter DV0.5 increased by 28.8%, 40.5% and 43%, and ΦVol < 150 μm reduced by 67.4%, 65.6% and 58%.
Thus, under the same pressure, the volume medium diameter DV0.5 of the PEG-20,000 solution of different concentrations is larger than that of water, and as the concentration of the PEG-20,000 solution gradually increases, its volume medium diameter DV0.5 is gradually increasing compared with clear water under various pressures, and the proportion of ΦVol < 150 μm gradually decreases. Under the condition of the same concentration of PEG-20,000 solution, as the pressure gradually increases, the difference between its DV0.5 and the DV0.5 of water also gradually increases, and the proportion of ΦVol < 150 μm increases gradually at the concentration of 10 g/L and 20 g/L but gradually decreased at the concentration of 30 g/L. The relative droplet spectrum width RS has no obvious change trend with the pressure or spraying medium.
The test results show that the droplet size under the same spraying medium is proportional to the pressure, and ΦVol < 150 μm gradually increases, increasing the risk of droplets drift; under the same pressure, the volume medium diameter DV0.5 of different concentrations of PEG-20,000 solutions are all larger than that of water, and its size is proportional to the concentration. The proportion of large droplets gradually increases which can effectively reduce the possibility of drift. Under the experimental conditions, the volume medium diameter DV0.5 of PEG-20,000 solution at different concentrations is in the range of 167.87~256.07 μm. According to the ASABE S572.1 standard, the spray quality belongs to the fine~medium grade, and the retention capacity on the wet leaf surface is good, the possibility of secondary loss of pesticide is reduced. The results of the droplet size distribution test can provide a basis for the deposition distribution experiment.
3.2. Analysis of the Test Results of the Deposition of the Teejet 80-03 Nozzle
The deposition and its trend on each collection line are shown in Figure 5. It can be clearly seen from Figure 5 that the overall trend is that the drift amount is the highest at the position closest to the nozzle in the horizontal direction, and the drift amount in the vertical direction gradually decreases with the increase in height.
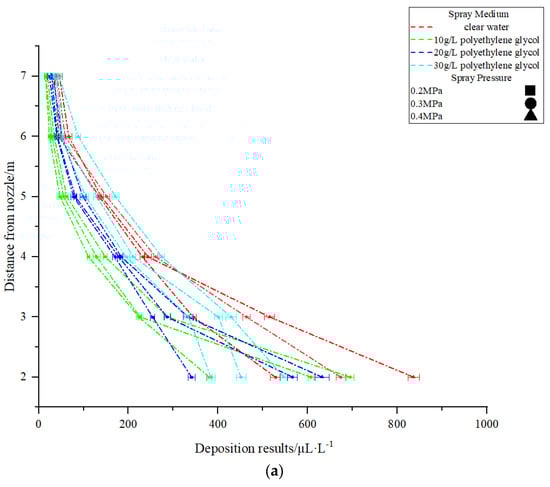
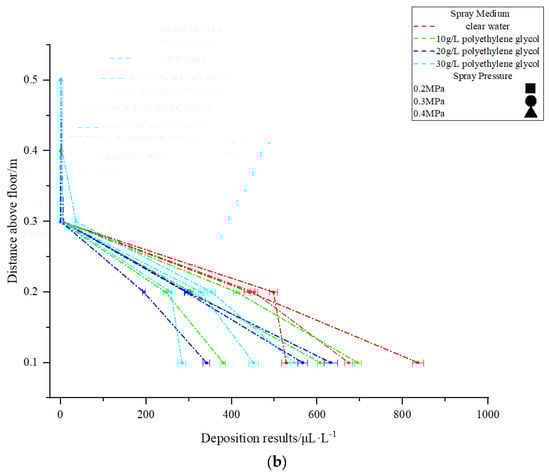
Figure 5.
Deposition distribution under different spray conditions. (a) Distribution of deposition in the horizontal direction under different spray conditions. (b) Distribution of vertical deposition under different spray conditions.
The amount and distribution of droplet deposition is shown in Table 3. First, we studied the influence of the spray pressure on droplet deposition. Under the same spraying medium, in the horizontal spray direction, 2~7 m away from the nozzle, the pressure increases, and the deposition also increases. Because the pressure increases, the proportion of small droplets (ΦVol < 150 μm) increases. These smaller droplets are more easily carried by the airflow and deposited at a longer distance; in the vertical spray direction, the deposition is the largest at a distance of 0.1~0.2 m from the ground and is proportional to the pressure. When the distance from the ground is ≥0.3 m, the deposition decreases sharply until there is no deposition at all. The main reason is that as the pressure increases, the flow rate of the nozzle and the number of small droplets (ΦVol < 150 μm) increase significantly, the initial velocity of the droplets at the nozzle outlet also increases, the crosswind has a reduced impact on the high-speed small droplets, and the high-speed droplets can settle quickly compared to low-speed droplets. This results in the high-speed small droplets becoming mostly deposited near the nozzle in the horizontal direction, and most of them are deposited near the bottom of the wind tunnel in the vertical direction, but the low-speed droplets will drift to a far distance under the influence of crosswinds before they begin to deposit.
Table 3.
Deposition distribution under different spray conditions along vertical and horizontal direction.
Secondly, we studied the influence of the spraying medium on deposition. Under the same pressure, in the horizontal spray direction, the deposition of spraying clear water at a distance of 2–7 m from the nozzle is greater than that of the PEG-20,000 solution at different concentrations, and as the concentration of the PEG-20,000 solution increases, the overall deposition shows a decreasing trend. This is mainly because as the concentration of PEG-20,000 solution increases, the droplet size increases and the proportion of small droplets (ΦVol < 150 μm) decreases, therefore, both the probability of the droplet drift and the distance of the droplet drift reduced; in the vertical spray direction, when spraying clear water at a distance of 0.1~0.2 m from the bottom of the wind tunnel, the deposition is greater than that of PEG-20,000 solution at different concentrations, and with the increase of the concentration of PEG-20,000 solution, the deposition gradually decreases; when the distance from the bottom of the wind tunnel is ≥0.3 m, the vertical deposition of spraying clear water is less than that of spraying PEG-20,000, and as the concentration of the solution increases, the deposition gradually increases. It can be seen that the addition of PEG-20,000 can effectively reduce the droplet loss at horizontal distance and low altitude.
3.3. Result Analysis of Drift Potential Reduction Percentage of Teejet 80-03 Nozzle
The drift potential reduction percentage under different spray conditions is shown in Figure 6. It can be seen from the figure that the DPRPV and DPRPH of most spray conditions are greater than 0, indicating that these spray parameters effectively reduce the probability of droplets drift in the vertical and horizontal directions compared with the reference spray parameters.
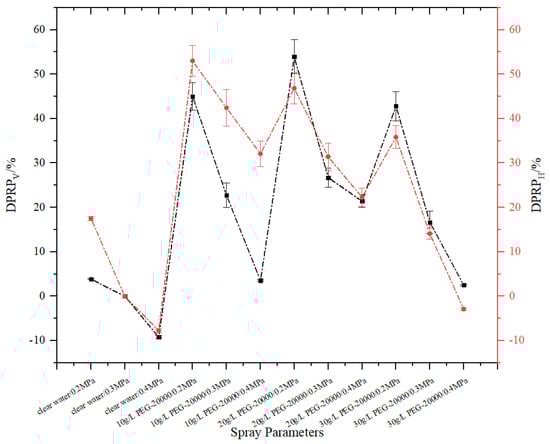
Figure 6.
Drift potential reduction percentage under different spray conditions.
In the case of the same spraying medium, both DPRPV and DPRPH decrease with the increase of pressure, because it has been found that the increase in pressure leads to an increase in the proportion of small droplets and an increase in the probability of drift.
Under the same spray pressure, the DPRPV and DPRPH of different concentrations of PEG-20,000 solution are greater than that of clear water. When the spraying medium is PEG-20,000 solution, DPRPV and DPRPH have no obvious change trend with the increase of concentration. The DPRPV at a concentration of 20 g/L is greater than that of 10 g/L, but the DPRPH is less than that of 10 g/L, while the DPRPV and DPRPH at a concentration of 30 g/L are both less than those of 10 and 20 g/L polyethylene glycol respectively. This shows that, although the droplet size increases with the increase of concentrations of the PEG-20,000 solution, the deposition decreases at a horizontal distance of 2–3 m from the nozzle and decreases at a vertical distance of 0.1–0.2 m from the ground of the wind tunnel, but the deposition at a horizontal distance of 4–7 m is still sufficient to affect the final drift potential reduction percentage.
4. Discussion
The present work tested the atomization and deposition characteristics of surfactant polyethylene glycol 20,000 solution at three concentration levels to compare the effects of the concentration on them. There are few reports about this kind of surfactant, but a lot of experiments on other kinds of surfactants have been done.
Chen et al. [33] compared and analyzed the droplet size distribution of ST110-01 and ST110-03 nozzles before and after adding different adjuvants and found that most of the adjuvants improved the uniformity of the droplet size and reduced the droplets drift to a certain extent. The results in this paper are similar to this. When adding different concentrations of polyethylene glycol 20,000, the amount of drift and deposition of droplets in the horizontal and vertical directions is reduced. Xia et al. [34] added polyethylene glycol 300 (PEG-300) to the pesticide solution and found that the surface tension decreased by 5 N/m on average, and the volume median diameter decreased by 12 μm on average. The adhesion of the pesticide solution under indoor conditions without wind was improved nearly 2 times. The results of this study are contrary to this article. Generally speaking, the addition of surfactants can reduce the surface tension of the liquid, enhance the degree of atomization, and the droplet size should become smaller. However, it can be seen from the above research that when the spraying medium is a mixture of PEG-20,000 with different concentrations and clear water, the droplet size increases significantly and is directly proportional to the concentration. The main physical properties that affect the droplet size of the liquid droplet are viscosity and surface tension, both of which hinder the atomization of the liquid [35,36,37], among them, some studies have also proposed that the effect of viscosity on the droplet size is greater than that of the surface tension. Therefore, the following research can focus on the viscosity and surface tension of PEG-20,000 solution at different concentrations and explore whether the reason for the increase in the droplet size of PEG-20,000 solution is that the viscosity plays a leading role.
In general, the results of this article show that as the concentration of polyethylene glycol 20,000 increases, the size of the spray droplets increases and the amount of drift in the vertical and horizontal directions decreases overall. In plant protection spraying operations, minimizing the drift of droplets is the ultimate goal and it is proved in this paper that the addition of polyethylene glycol 20,000 can help reduce drift. For specific diseases, combining the theory of optimal biological particle size and the meteorological conditions during actual spraying can determine the appropriate operating particle size range. After knowing the appropriate particle size range guided by the biological optimal particle size theory, the droplet size range can be appropriately adjusted and reduced according to the actual spraying environment. For example, when the wind speed or the temperature is high, the evaporation and drift of small droplets are serious, the addition amount of polyethylene glycol 20,000 should be appropriately increased.
5. Conclusions
This article comprehensively compares the effects of spraying clear water and different concentrations of PEG-20,000 solution on the droplet size, distribution and deposition characteristics of the fan nozzle Teejet 80-03 VP. The conclusions are as follows:
- (1)
- Under the same spraying medium condition, when the pressure increased from 0.2 MPa to 0.4 MPa, the DV0.5 of four spraying media respectively decreased by 29.7%, 19.7%, 22.9%, and 21.9%, and the ΦVol<150μm increased by 42.2%, 24.6%, 29.7% and 83.2%.
- (2)
- Under the same pressure, the DV0.5 of spraying 10 g/L PEG-20,000 solution increased by 5.2%, 13% and 20% compared with clear water at three pressures, and the ΦVol<150μm decreased by 4.9%, 11.5% and 16.7%; In the same way, the DV0.5 of spraying 20 g/L PEG-20,000 solution increased by 10.8%, 15.5% and 21.3% and the ΦVol<150μm decreased by 9.7%, 13.4% and 17.6%; The DV0.5 of spraying 30 g/L PEG-20,000 solution increased by 28.8%, 40.5% and 43% and the ΦVol<150μm decreased by 67.4%, 65.6% and 58%.
- (3)
- Under the same spraying medium condition, in the horizontal and vertical spray direction, the deposition increases with the increase of pressure. Both DPRPV and DPRPH of each spraying medium decrease with the increase of pressure.
- (4)
- Under the same pressure, spraying clear water in the horizontal and vertical spray direction, the total deposition is greater than that of spraying PEG-20,000 solution at three concentrations. As the concentration of PEG-20,000 solution increases, the amount of droplets decreases overall. The DPRPV and DPRPH of three concentrations of PEG-20,000 solution are greater than that of clear water.
- (5)
- When the external wind speed or temperature is high, in order to reduce the drift and evaporation of the droplets in the air, low pressure and large droplets could be selected for spraying operation, and the PEG-20,000 could be appropriately added.
Author Contributions
Data curation, Y.J.; formal analysis, Y.J.; investigation, Y.J., Q.Z., Y.T., X.L. and S.W.; methodology, X.X. and S.D.; supervision, X.X. and S.D.; writing—original draft, Y.J.; writing—review & editing, Y.J. All authors have read and agreed to the published version of the manuscript.
Funding
This research was funded by the National Key Research and Development Program of China (Grant No. 2017YFD0701000).
Institutional Review Board Statement
Not applicable.
Informed Consent Statement
Not applicable.
Data Availability Statement
The data used to support the findings of this study are available from the first author or the corresponding author upon request.
Acknowledgments
The author are very grateful to my tutors X.X. and S.D., and also to the help of teacher Xu Yang and classmates Y.T., X.L. and S.W. during the tests.
Conflicts of Interest
The authors declare no conflict of interest.
References
- Piché, M.; Panneton, B.; Thériault, R. Reduced drift from air-assisted spraying. Can. Agric. Eng. 2000, 42, 117–122. [Google Scholar]
- Cunha, J.; Teixeira, M.M.; Coury, J.R.; Ferreira, L.R. Evaluation of strategies to reduce pesticide spray drift. Planta Daninha 2003, 21, 325–332. [Google Scholar] [CrossRef]
- Ellis, M.B.; Tuck, C. How adjuvants influence spray formation with different hydraulic nozzles. Crop. Prot. 1999, 18, 101–109. [Google Scholar] [CrossRef]
- Khavkin, Y. Controlling droplet size distribution in swirl atomizers. At. Sprays 2002, 12, 641–650. [Google Scholar] [CrossRef]
- Hewitt, A.J. Droplet size and agricultural spraying, part i: Atomization, spray transport, deposition, drift, and droplet size measurement techniques. At. Sprays 1997, 7, 235–244. [Google Scholar] [CrossRef]
- Miller, P.; Tuck, C. Factors Influencing the Performance of Spray Delivery Systems: A Review of Recent Developments. J. ASTM Int. 2005, 2, 13. [Google Scholar] [CrossRef]
- Wang, X.N. Study on Spray Drift and Anti-Drift Method. Ph.D. Thesis, China Agricultural University, Beijing, China, 2017. (In Chinese). [Google Scholar]
- Symmons, P.; Dobson, H.; Sissoko, M. Pesticide droplet size and efficacy: A series of trials on grasshoppers. Crop. Prot. 1991, 10, 136–144. [Google Scholar] [CrossRef]
- Masaaki, S.; Yoshihiro, H.; Hitoshi, K.; Masahiro, T. Effect of different droplet size on the knockdown efficacy of directly sprayed insecticides. Pest Manage. Sci. 2011, 67, 1115–1123. [Google Scholar] [CrossRef]
- Payne, N.J.; Frankenhuyzen, K.V. Effect of spray droplet size and density on efficacy of Bacillus Thuringiensis berliner against the spruce budworm, Choristoneura fumiferana (Clem.) (Lepidoptera: Tortricidae). Can. Entomol. 1995, 127, 15–23. [Google Scholar] [CrossRef]
- Zhang, H.; Zheng, J.; Zhou, H.; Dorr, G.J. Droplet deposition distribution and off-target drift during pesticide spraying operation. Trans. Chin. Soc. Agric. Mach. 2017, 48, 114–122. (In Chinese) [Google Scholar] [CrossRef]
- Duyang, Z.; Sujata, T.; Yuri, Y.T.; Moutushi, D.C.; Tapati, D. Evaporation of a droplet: From physics to applications. Phys. Rep. 2019, 804, 1–56. [Google Scholar] [CrossRef]
- Zazueta, F.S. Evaporation Loss during Sprinkler Irrigation; IFAS Extension: Gainsville, FL, USA, 2018. [Google Scholar]
- Wang, X.; He, X.; Song, J.; Herbst, A. Effect of adjuvant types and concentration on spray drift potential of different nozzles. Trans. Chin. Soc. Agric. Eng. 2015, 31, 49–55. (In Chinese) [Google Scholar] [CrossRef]
- Fritz, B.K.; Kirk, I.W.; Hoffmann, W.C.; Martin, D.E.; Hofman, V.L.; Hollingsworth, C.; McMullen, M.; Halley, S. Aerial application methods for increasing spray deposition on wheat heads. Appl. Eng. Agric. 2006, 22, 357–364. [Google Scholar] [CrossRef]
- Yu, Y.; Zhu, H.; Ozkan, H.E.; Derksen, R.C.; Krause, C.R. Evaporation and Deposition Coverage Area of Droplets Containing Insecticides and Spray Additives on Hydrophilic, Hydrophobic, and Crabapple Leaf Surfaces. Trans. ASABE 2009, 52, 39–49. [Google Scholar] [CrossRef]
- Gimenes, M.; Zhu, H.; Raetano, C.; Oliveira, R. Dispersion and evaporation of droplets amended with adjuvants on soybeans. Crop. Prot. 2013, 44, 84–90. [Google Scholar] [CrossRef]
- Sundaram, A.; Kotlyar, L.; Sparks, B.D. Influence of surfactants and polymeric adjuvants on physicochemical properties, droplet size spectra and deposition of fenitrothion and bacillus-thuringiensis formulations under laboratory conditions. J. Environ. Sci. Health Part B 1987, 22, 691–720. [Google Scholar] [CrossRef]
- Celen, I.H. The effect of spray mix adjuvants on spray drift. Bulg. J. Agric. Sci. 2010, 16, 105–110. [Google Scholar]
- Heymsfield, A.J. Encyclopedia of Physical Science and Technology, 3rd ed.; Academic Press: Pittsburgh, PA, USA, 2003; pp. 15–31. [Google Scholar]
- Ewan, B.C.R.; Swithenbank, J.; Sorusbay, C. Measurement of Transient Spray Size Distributions. Opt. Eng. 1984, 23, 235620. [Google Scholar] [CrossRef]
- Gu, J.; Zhu, H.; Ding, W.; Jeon, H.Y. Droplet size distributions of adjuvant-amended sprays from an air-assisted five-port pwm nozzle. At. Sprays 2011, 21, 263–274. [Google Scholar] [CrossRef] [Green Version]
- He, Y.; Xiao, S.; Fang, H.; Dong, T.; Tang, Y.; Nie, P.; Wu, J.; Luo, S. Development situation and spraying decision of spray nozzle for plant protection UAV. Trans. Chin. Soc. Agric. Eng. 2018, 34, 113–124. (In Chinese) [Google Scholar]
- Fritz, B.K.; Hoffmann, W.C.; Martin, D.E.; Thomson, S.J. Aerial Application Methods for Increasing Spray Deposition on Wheat Heads. Appl. Eng. Agric. 2007, 23, 709–715. [Google Scholar] [CrossRef]
- Nuyttens, D.; Taylor, W.; De Schampheleire, M.; Verboven, P.; Dekeyser, D. Influence of nozzle type and size on drift potential by means of different wind tunnel evaluation methods. Biosyst. Eng. 2009, 103, 271–280. [Google Scholar] [CrossRef]
- Herbst, A. A Method to Determine Spray Drift Potential from Nozzles and its Link to Buffer Zone Restrictions. In Proceedings of the 2001 ASAE Annual Meeting, Sacramento, CA, USA, 28 July–1 August 2001. [Google Scholar] [CrossRef]
- Fritz, B.K.; Hoffmann, W.C.; Kruger, G.R.; Henry, R.S.; Hewitt, A.; Czaczyk, Z. Comparison of drop size data from ground and aerial application nozzles at three testing laboratories. At. Sprays 2014, 24, 181–192. [Google Scholar] [CrossRef] [Green Version]
- Ding, S.; Xue, X.; Lan, Y.; Cai, C.; Zhang, L.; Qin, W.; Zhang, S. Design and experiment of NJS-1 type open-circuit closed wind tunnel for plant protection. Trans. Chin. Soc. Agric. Eng. 2015, 31, 76–84. (In Chinese) [Google Scholar]
- Cao, J. Liquid Atomization; Peking University Press: Beijing, China, 2013; pp. 204–205. (In Chinese) [Google Scholar]
- Miller, P.; Mawer, C.J.; Merritt, C.R. Wind tunnel studies of the spray drift from two types of agricultural spray nozzle. Asp. Appl. Biol. 1989, 21, 237–238. [Google Scholar]
- Herbst, A.; Ganzelmeier, H. Classification of sprayers according to drift risk—A German approach. Asp. Appl. Biol. 2000, 57, 35–40. [Google Scholar]
- Nilars, M.S. Some nozzle performance considerations when using wide booms at higher spraying speeds. Asp. Appl. Biol. 2002, 66, 95–105. [Google Scholar]
- Chen, X.; Gong, Y.; Liu, D.; Wang, G.; Zhang, X. Effect of additives on atomization of pesticides and nozzles. In Proceedings of the 2019 ASABE Annual International Meeting, Boston, MA, USA, 7–10 July 2019. [Google Scholar] [CrossRef]
- Xia, Z. The Research and Development of a Kind of Fertilizer that Suitable for Plant Protection Drone Use. Master’s Thesis, Anhui Agricultural University, Anhui, China, 2019. (In Chinese). [Google Scholar]
- Chen, J.; Zhang, Z.; Wang, C.; Song, J. Effects of fluid viscosity and surface tension on the size of atomized droplets. J. Northeast. Univ. 2010, 31, 1023–1025. (In Chinese) [Google Scholar] [CrossRef] [Green Version]
- Zhao, Y. Experimental Research on the Influence of Viscosity and Surface Tension on Atomizing. Master’s Thesis, Northeastern University, Liaoning, China, 2012. (In Chinese). [Google Scholar]
- Ejim, C.; Rahman, M.; Amirfazli, A.; Fleck, B. Effects of liquid viscosity and surface tension on atomization in two-phase, gas/liquid fluid coker nozzles. Fuel 2010, 89, 1872–1882. [Google Scholar] [CrossRef]
Publisher’s Note: MDPI stays neutral with regard to jurisdictional claims in published maps and institutional affiliations. |
© 2021 by the authors. Licensee MDPI, Basel, Switzerland. This article is an open access article distributed under the terms and conditions of the Creative Commons Attribution (CC BY) license (https://creativecommons.org/licenses/by/4.0/).