Article

Reduced Reference Quality Assessment for Image Retargeting by Earth Mover’s Distance

1
School of Automation, China University of Geosciences, Wuhan 430074, China
2
Key Laboratory of Geological Survey and Evaluation of Ministry of Education, Wuhan 430074, China
3
Hubei Key Laboratory of Advanced Control and Intelligent Automation for Complex Systems, Wuhan 430074, China
*
Author to whom correspondence should be addressed.
Appl. Sci. 2021, 11(20), 9776; https://doi.org/10.3390/app11209776
Submission received: 8 September 2021 / Revised: 15 October 2021 / Accepted: 16 October 2021 / Published: 19 October 2021
(This article belongs to the Section Computing and Artificial Intelligence)

Abstract

:
A reduced reference quality assessment algorithm for image retargeting by earth mover’s distance is proposed in this paper. In the reference image, all the feature points are extracted using scale invariant feature transform. Let the histograms of image patch around each feature point be local information, and the histograms of saliency feature as global information. Those feature information is extracted at the sender side and transmitted to the receiver side. After that, the same feature information extraction process is performed for the retargeted image at the receiver side. Finally, all feature information of the reference and retargeted images is used collectively to compute the quality of the retargeted image. An overall quality score is calculated from the local and global similarity measure using earth mover’s distance between reference and retargeted images. The key step in our algorithm is to provide an earth mover’s distance metric in a manner that indicates how the local and global information in the reference image is preserved in corresponding retargeted image. Experimental results show that the proposed algorithm can improve the image quality scores on four common criteria in the retargeted image quality assessment community.

1. Introduction

Image quality is a basic concept in many image processing and computer vision applications, such as acquisition, transmission, and display. With advances in information technology and visual communication, assessing image quality has become a fundamental and challenging problem. Image Quality Assessment (IQA) automatically measures the image visual quality by effective computational models [1]. The image quality assessment (IQA) approach attempts to estimate the image quality based on human visual perception in an objective manner. Most IQA models based on full reference (FR) and achieved very good results, while most no reference (NR) IQA methods are designed for some predefined specific distortion types. Reduced reference (RR) IQA algorithms provide a proper compromise between FR and NR approaches, and they estimate the image quality with limited access to the reference image [2].
Recently, multimedia retargeting has attracted much attention in a graph and vision research. Retargeting techniques for image and video utilize the original visual scene to display that scene at different sizes or aspect ratios on different display screens. Many retargeting models have been proposed, such as multi-operator (MO), cropping (CR), streaming video (SV), shift-map (SM), seam carving (SC), scaling (SCL), scale-and-stretch (SNS), and warping (WARP) [3]. These models are either pixel-based or patch-based. Nevertheless, the FR image is not often available in time of retargeted IQA, but the reference image may be briefly described through partial information. Thus, an RR quality assessment criterion is needed to employ. Therefore, how to effectually assess the quality of the RR retargeted images is an important and challenging problem.
However, general IQA approaches, such as peak signal-to-noise ratio (PSNR) and structural similarity (SSIM), are not applied to the retargeted images because those algorithms require the coupled images have the same sizes. The existing retargeted IQA algorithms mainly based on full reference, such as color layout descriptor (CL), edge histogram (EH), bidirectional warping (BDW), bidirectional similarity (BDS), and scale invariant feature transform (SIFT) Flow [3]. Those algorithms have been used to evaluate retargeted images quality, although their results are not always consistent with subjective image evaluations. Since humans are the final evaluators of image quality, the goal must be to develop an automatic method that can evaluate image quality in a way that will be in agreement with subjective evaluation. RR algorithms often assess image quality by comparing the same features between reference and retargeted images, such as discrete cosine transform (DCT) [4], visual information fidelity (VIF) [5], divisive normalization transformation (DNT) [6], reduced reference entropic difference (RRED) [7], and reduced-reference SSIM (RRSSIM) [8]. Bampis et al. [9] proposed Gaussian scale mixture models to assess a RR image by computing the weighted entropies between reference and retargeted images. According to different types and levels of degradation, which could strongly influence saliency detection, a saliency-induced RR IQA method was introduced by Min et al. [10]. However, when the image is retargeted, some features may also change, so it is hard to compare our proposed algorithm with them directly. Thus, this paper proposes a useful method to estimate the visual quality for RR retargeted images.
Since the size of the reference image is inconsistent with that of the retargeted image, this paper extracts the corresponding feature points of the two images and calculates the EMD between the image blocks corresponding to the feature points as local information. Meanwhile, this paper extracts the visual saliency features of the two images and calculates the EMD between the corresponding features as global information. Finally, local and global information are combined to generate a final quality score. Our proposed algorithm can obtain high quality prediction accuracy with the limited amount of RR features. This algorithm is illustrated in Figure 1.

2. EMD between Two Histograms

When the sizes of the reference image and the retargeted image are different, we cannot compare the two images directly. However, the histogram of image is independent of the size of the image, so we can use EMD to compute the similarity between reference image and retargeted image. We introduce the EMD metric between two given normalized histograms with the same number of bins in this part.

2.1. Basic EMD

Rubner et al. [11] first introduced EMD for measuring the difference between texture and color, in which the EMD was applied to the distributed signatures instead of histograms directly. As a matter of fact, a histogram can also be considered to be a special kind of signatures.
The classical EMD between two histograms is the lowest cost of transporting one histogram into another, in which the cost is usually defined as that the amount of weight multiplies the ground distance between two histograms. This formalization is easily generalized to two normalized histograms with the same number of bins [12].
Given two n-bin histograms, H 1 = { h i 1 , i = 1 , 2 , 3 , , n } and H 2 = { h j 2 , j = 1 , 2 , 3 , , n } , H 1 is transformed into H 2 by moving “mass” from h i 1 to h j 2 for every pair of ( i , j ) , such that the difference of two histograms is minimized. Let another -bin all-zero histogram be T, and we denote the flow f i j as the amount, which is moved from the i-th bin in H 1 to the j-th bin in T. Then, we can define the EMD metric between H 1 and H 2 to be the minimum amount flow that is demanded to make the histogram of T to be identical with H 2 . Therefore, the EMD between H 1 and H 2 is expressed in mathematically as follows:
EMD ( H 1 , H 2 ) = min { f i , j , i , j = 1 , 2 , 3 , , n } i = 1 n j = 1 n f i , j d i , j ,
subject to j = 1 n f i , j = h i 1 , i = 1 n f i , j = h j 2 , f i , j 0 and i , j = 1 , 2 , 3 , , n , where d i , j is the ground distance between bin i and bin j. Let d i , j = | i j | to be the L 1 distance in this section.

2.2. Weighted EMD

For each given reference and retargeted images, we obtain all the matching point pairs. We take an image patch around each matching point in the point pairs.
If we use the above EMD as the distance measure in two histograms of image patch directly, we do not consider the spatial information of pixels in the patch. In fact, pixels near the center of matching point are more important than the others for computing similarity [13]. To solve this problem, we bring the weight to the pixels of different locations, and then we can calculate the EMD between the weighted histograms.
Because the importance of the pixel is inversely proportional to the distance between the pixel and center point, we define the normalized weight value w ( . ) for every pixel in the image patch by
w ( i ) = 1 d ( i ) 1 d ( i ) j S 1 d ( j ) j S 1 d ( j ) o t h e r w i s e 1 i i s t h e c e n t e r ,
where d ( i ) is the ground distance from the pixel i to center matching point in the patch S. By using the weight value as the pixel’s contribution to their histogram bins, we construct weighted histograms, and, by applying those weighted histograms to EMD, we can more accurately calculate the distance between the two image patches.
In order to speed up the calculation, we choose the L 1 -based distance as the ground distance d i , j . With this choice, Levina has proven that the EMD between normalized weighted histograms equals to linear Wasserstein distance [14]. Under those conditions, the EMD can be written as:
EMD ( I H 1 , I H 2 ) = i = 1 n j = 1 i I H 1 ( j ) j = 1 i I H 2 ( j ) ,
where I H 1 and I H 2 are two normalized weighted histograms.

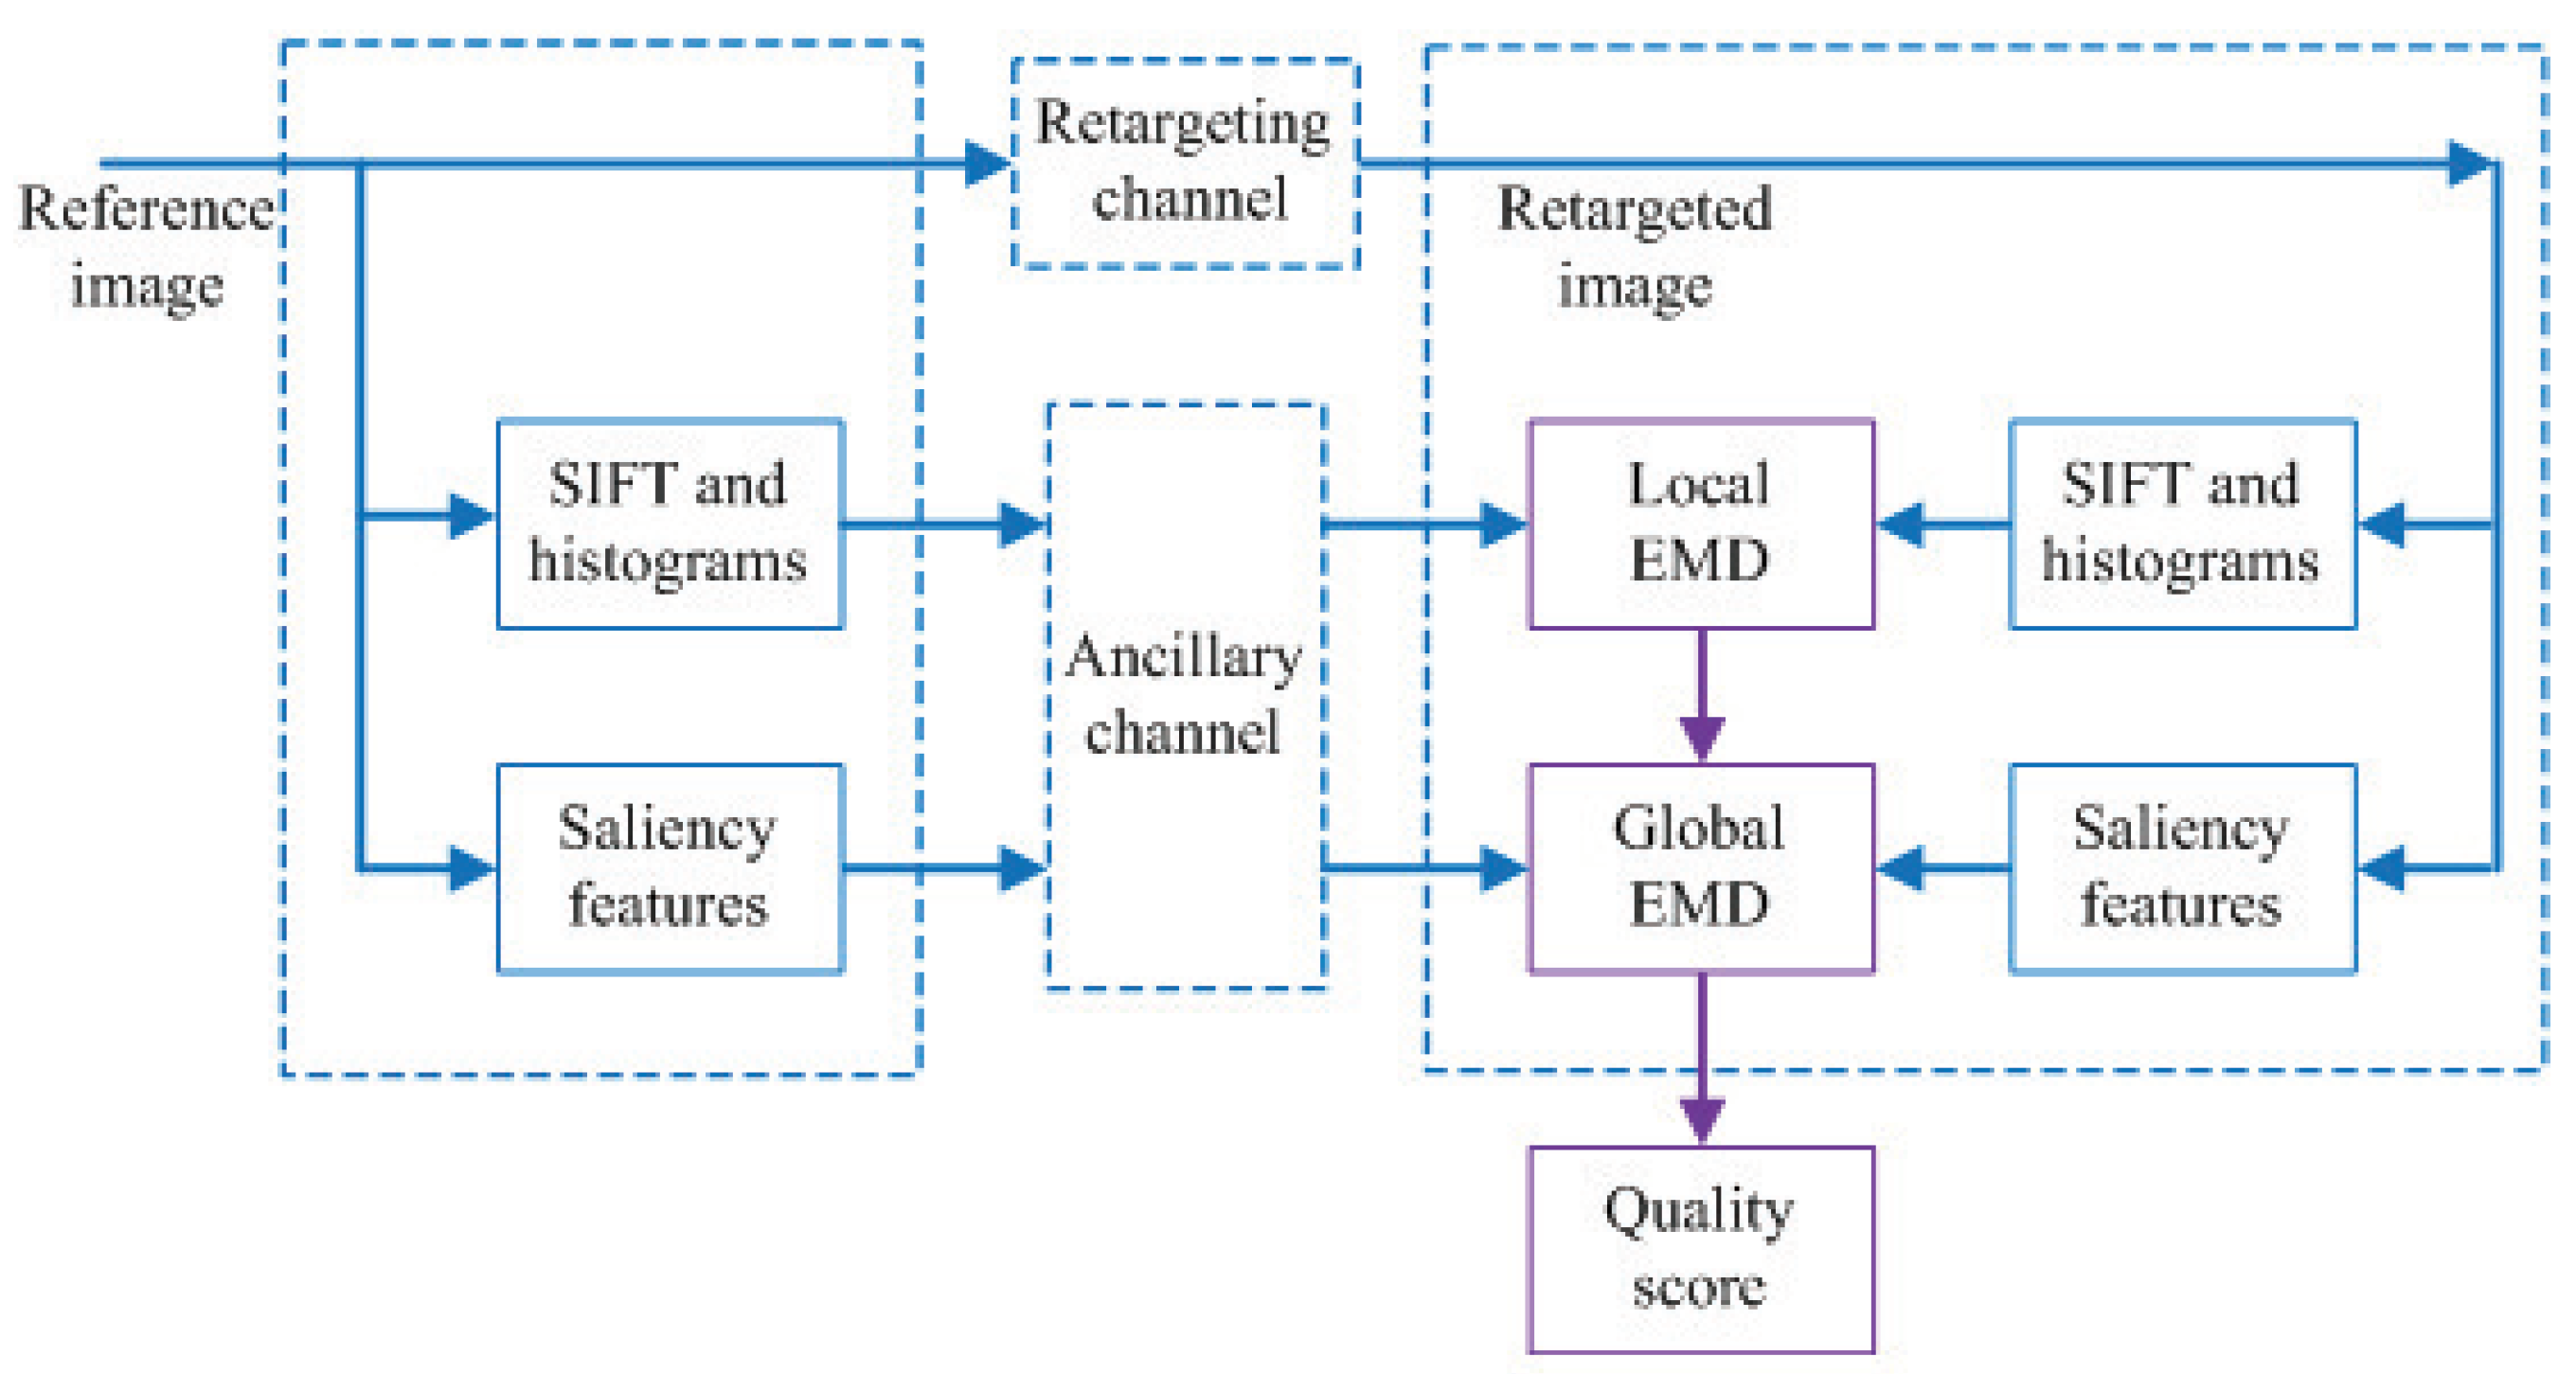
3. Quality Assessment Using EMD

In this section, the SIFT and saliency features are extracted from reference and retargeted images, respectively. Then, the local and global similarity measures are computed by those features. Last, the overall quality score is obtained by fusing the local and global EMD.

3.1. Local EMD Based on SIFT Features

People usually hope that retargeted images can accurately preserve the local structural information in corresponding regions in the reference images. If we establish the pixel correspondence, we can compare the structural information in corresponding local regions between two images. Thus, implementation of this pixel correspondence between images is a key factor in quality assessment.
Therefore, we should build a matching algorithm between pixels in the reference image and retargeted image. The SIFT descriptor is widely used in pixel matching between different size scenes [15], and it has been verified to be very effective in matching areas of corresponding dense in images [16]. As in optical flow algorithms, SIFT flow utilizes SIFT descriptors, rather than original pixels, to match image densities.
Firstly, in the reference image, we extract all SIFT feature points and their eigenvalues; then, we get an image patch around each feature point, and transform the image patch into a histogram. Secondly, we transfer all the eigenvalues and corresponding image patch histograms through an ancillary channel. Thirdly, in the retargeted image, we also extract all SIFT feature points and their eigenvalues; then, we find all matching points by the feature matching, and we can easily get image patch histograms around each matching point. Lastly, we use above EMD to calculate these two histograms centered on feature points. In fact, we do not match these points directly; rather, we just find the corresponding SIFT feature points in the retargeted image from reference image.
The local image quality can be expressed by all the matching image patches, so we calculate the local image quality score using EMD (LEMD) by average strategy:
LEMD = 1 M i = 1 M EMD ( I H p , i r e f , I H p , i r e t ) ,
where M is the total number of matching points, and EMD ( I H p , i r e f and I H p , i r e t ) are the i-th matching image patch normalized weighted histogram for reference and retargeted images, respectively.

3.2. Global EMD Based on Saliency Features

Although the image patches are well-evaluated for local quality, the quality of the image includes not only local quality but also global quality. Previous studies show that people can use the eye tracking data to promote the effect of IQA metrics [17], while humans are the ultimate evaluators of image quality, so it is reasonable to introduce principles of human visual saliency features into image evaluation as the global measurement. This can make objective image evaluation more consistent with subjective image evaluation.
In Itti’s model [18], color, intensity, and orientation are extracted for visual saliency features. Since human vision is sensitive to image texture information, texture feature is added in this section. In this section, we extract ten visual saliency features from reference image, including two color contrasts (red-green and blue-yellow), two intensity contrasts (light to dark and dark to light), four orientation features (0°, 45°, 90°, 135°), and two texture features (original and extended LBP) [19].
In the reference image, we extract ten saliency features, and we turn each feature map into a histogram. We transfer all the histograms. In the retargeted image, we also extract ten saliency features and turn each feature map into a histogram. Since the center of the image is the center of human vision, we make the center of each feature map as the center of the histogram. Therefore, we obtain global image quality score using EMD (GEMD) by average strategy:
GEMD = 1 N j = 1 N EMD ( I H f , j r e f , I H f , j r e t ) ,
where N is the total number of saliency features, and I H f , j r e f and I H f , j r e t are the j-th saliency features normalized weighted histogram for reference and retargeted images, respectively.

3.3. The Overall Quality Score Based on Local and Global EMD

The LEMD proposes a local metric about how much of the structure information is preserved in corresponding image patches, and the GEMD suggests a global method about how similarity of visual saliency features between reference and retargeted images. Therefore, we define an overall quality score (QS) based on local and global EMD as follows:
QS = LEMD + GEMD = 1 M i = 1 M EMD ( I H p , i r e f , I H p , i r e t ) + 1 N j = 1 N EMD ( I H f , j r e f , I H f , j r e t ) .
According to the above EMD calculation process, we can find that the value of EMD is the distance between two image patches. The smaller value of QS, the closer the distance, and the more similarities between the two images.

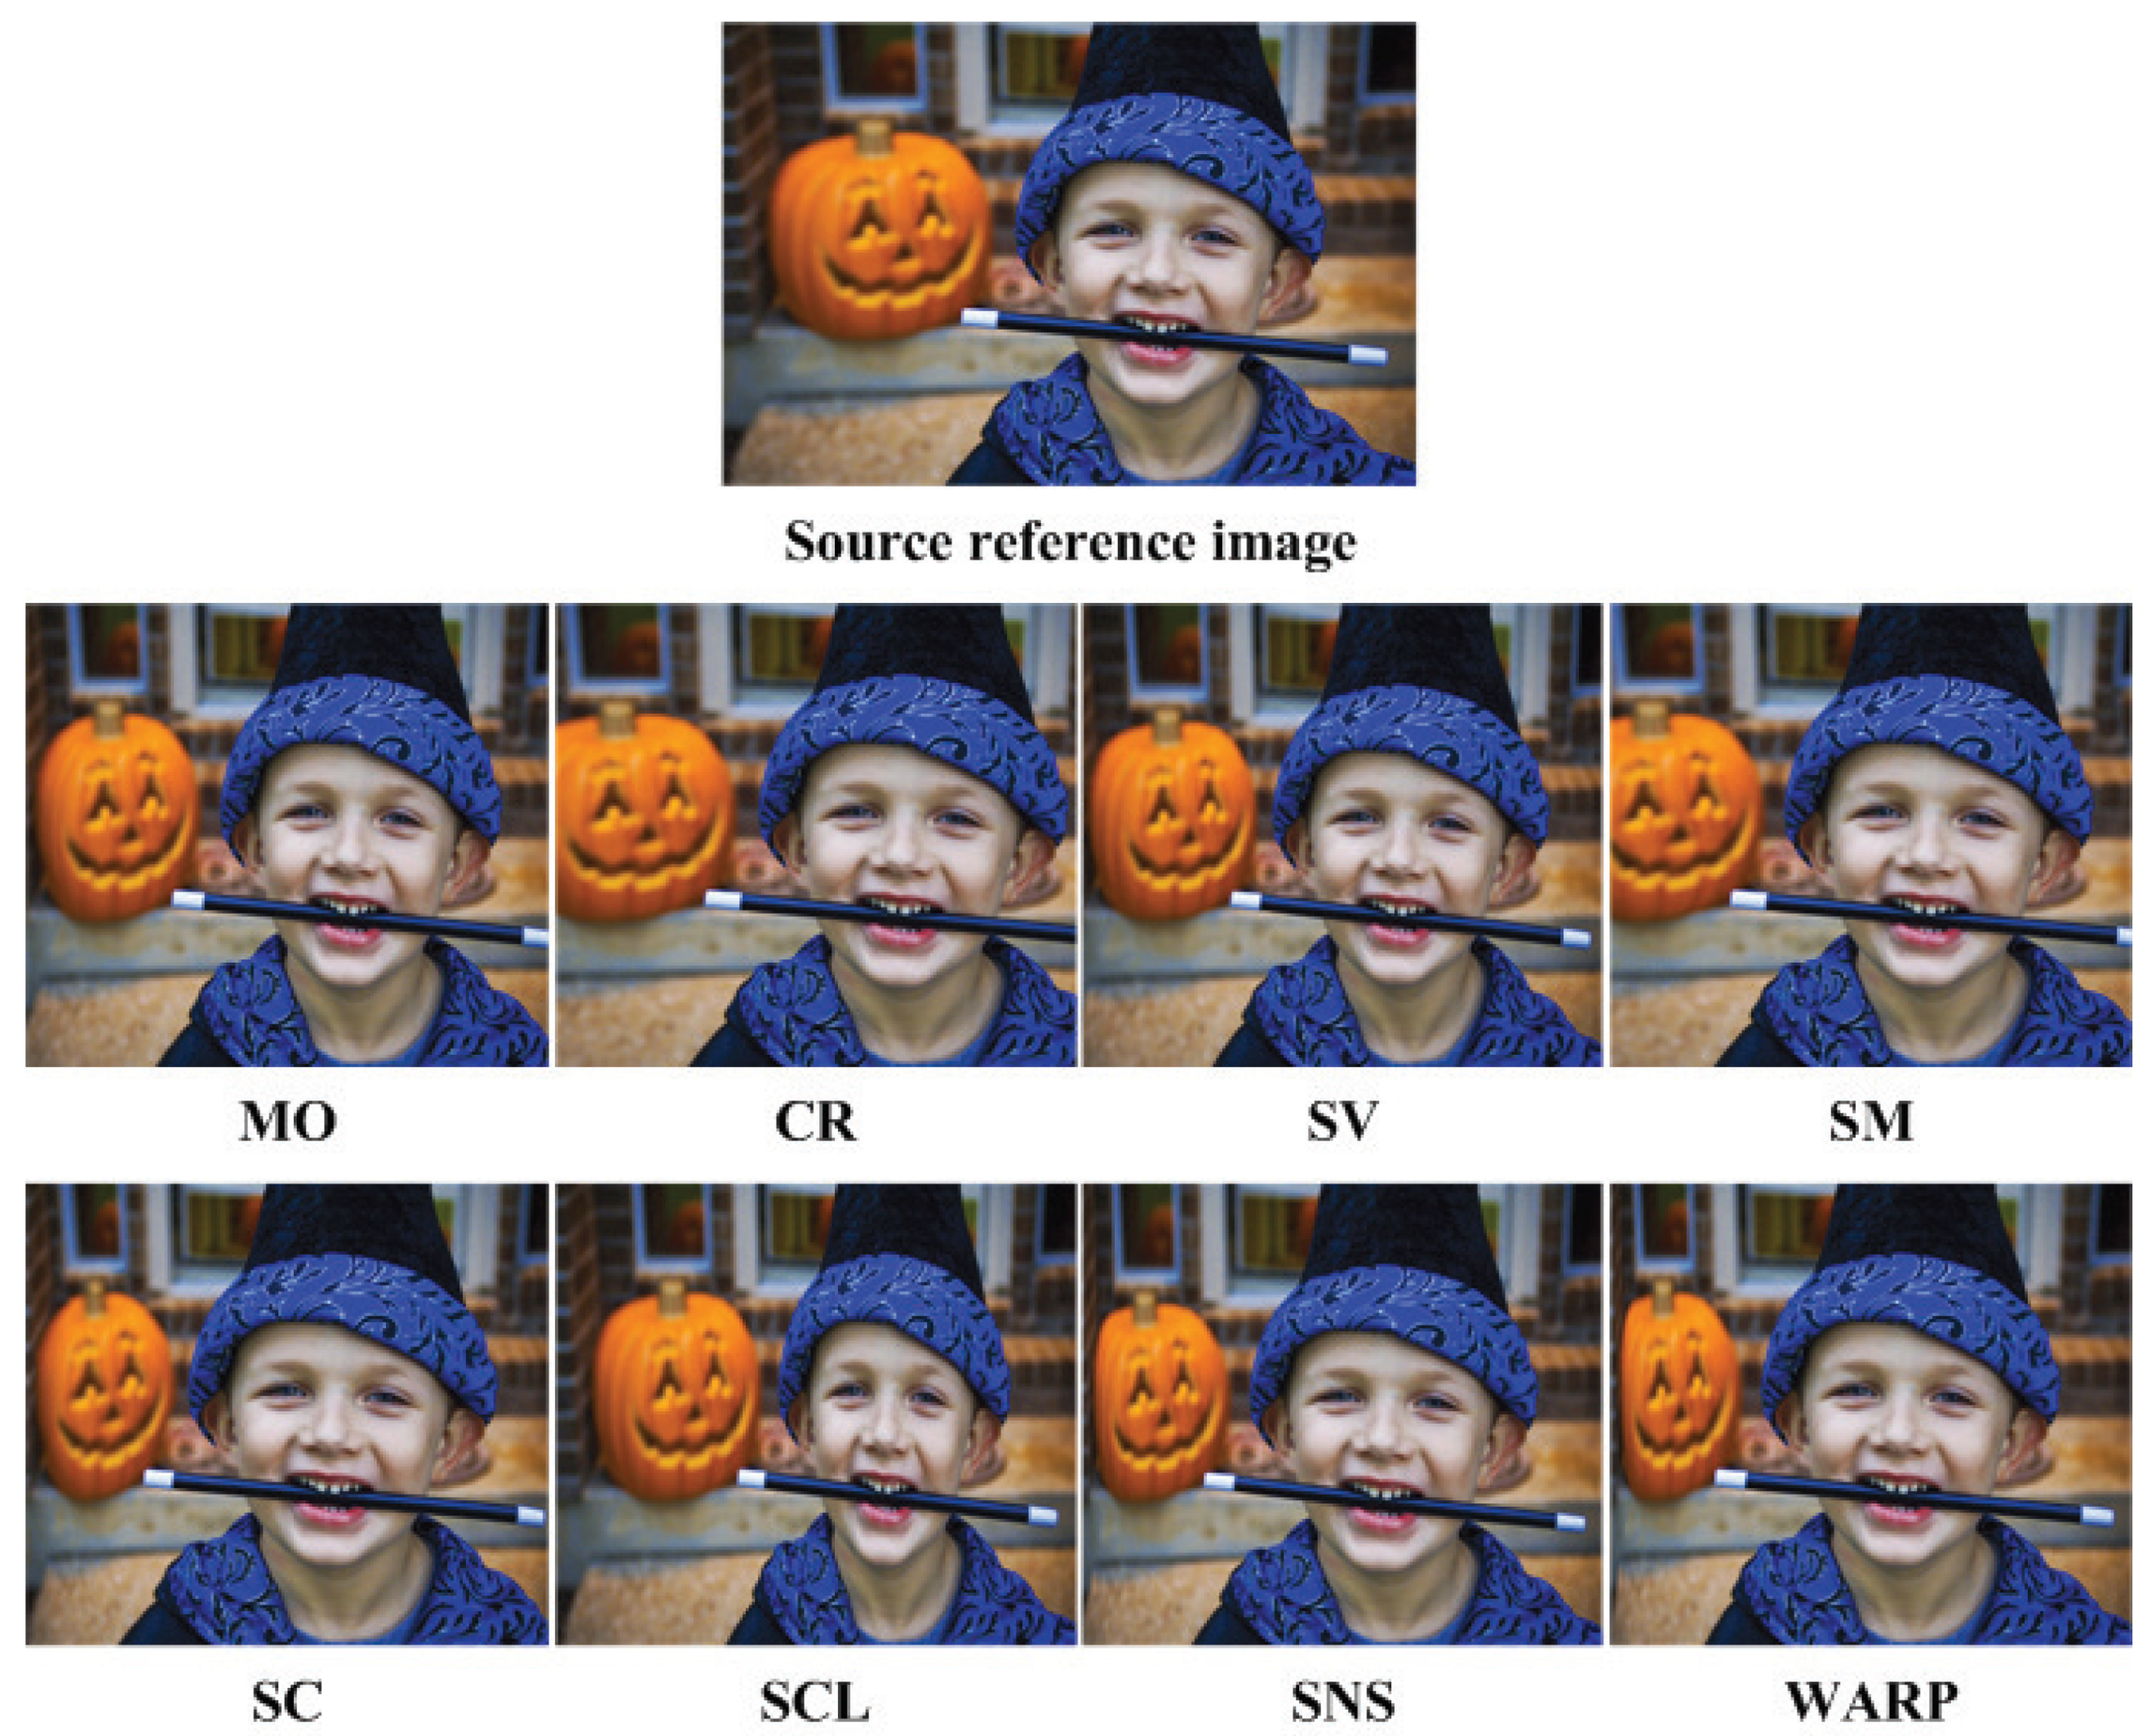
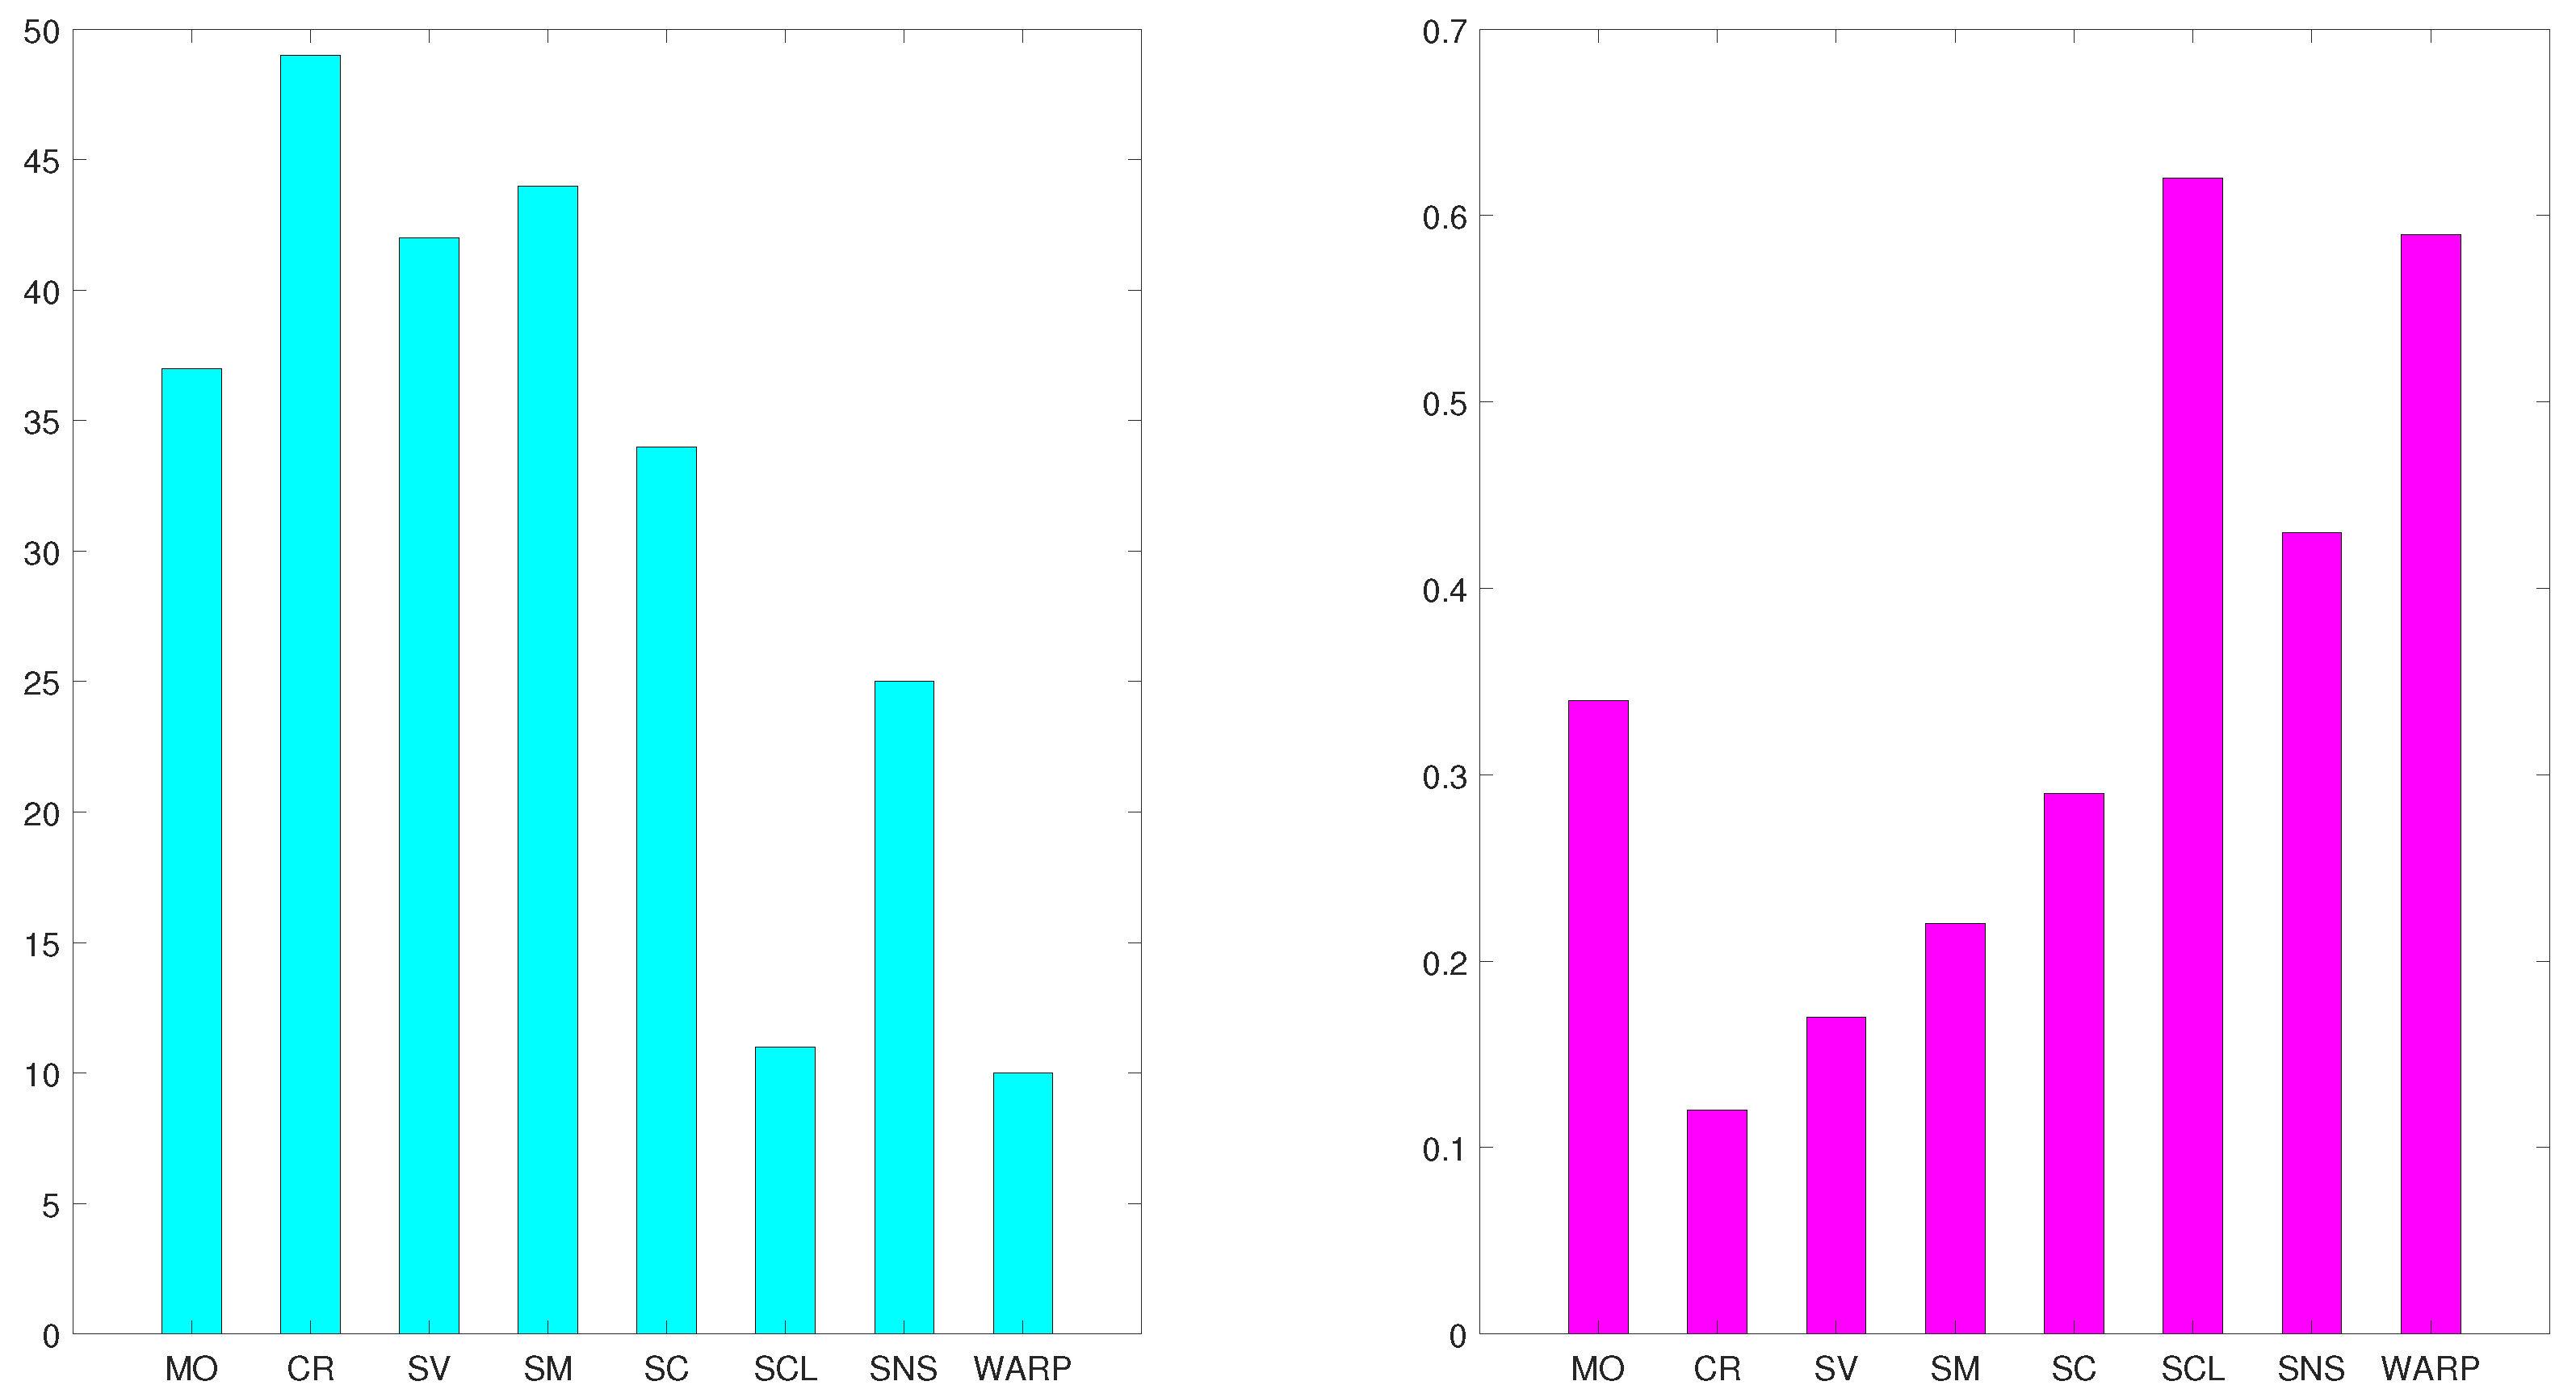
4. Experimental Results

In the field of IQA, indeed, there are many public databases, such as TID2013 [20] and KADID-10K [21], CID2013 [22], LIVE challenge [23], and KonIQ-10K [24]. However, these databases are either synthetically or authentically distorted IQA databases. We aim at assessing the retargeted images database in this paper, so we choose a popular public database [3] for retargeted images to validate the proposed algorithm. The database contains 37 source reference images and corresponding retargeted images. Two hundred and ten participants take part in the assessment of subjective image quality. All the data constitute this database. Every source reference image has been retargeted by eight different models, including MO, CR, SV, SM, SC, SCL, SNS, and WARP. Furthermore, subjective image evaluation results, for all retargeted images using above models, are also provided in this database. Figure 2 shows an example of child image about a source reference image and eight retargeted images with different models.
Figure 3 shows the histogram of subjective and objective assessment. The left is the subjective votes for the child image in Figure 2 by participants, and the right is objective results by our proposed algorithm on the same image. For the image obtained by each retargeted model, every participant gives a score by observing the image itself, and the score range is [0, 100]. Then, the subjective score is the mean value of all participants’ scores. The objective score is calculated by our proposed algorithm in Equation (6). There is no specific objective score range, and the score is the sum of local EMD and global EMD. Therefore, both histograms are in different scales. Because our algorithm is based on EMD, which is the distance between two image patches, the smaller value of objective result, the closer the distance, and the more similarities between the two images. When calculating the correlation, we only calculate the consistency of subjective and objective scores, and we do not evaluate the values of the two scores.
The existing retargeted IQA algorithms mainly based on full reference, while existing RR IQA algorithms are often used for some special distorted images, such as noise, blur, and JPG, not for retargeted images, so it is hard to compare our proposed algorithm with them directly. Therefore, we separate all the compared IQA algorithms into two types in the experiment. One is full reference IQA algorithms for retargeted images, including CL, EH, BDW, BDS, and SIFT Flow; the other is RR IQA algorithms for non-retargeted images, including MA, VIF, DNT, RRED, and RRSSIM.
Four criteria [8] are used to assess how well the objective quality scores can predict the subjective quality scores: (1) Pearson linear correlation coefficient (PLCC), (2) Spearman’s rank correlation coefficient (SRCC), (3) Kendall’s rank correlation coefficient (KRCC), and (4) Root mean squared (RMS) error.
In the experiment, for each reference image and a series of retargeted images, the subjective rankings can be obtained from the database, and the different objective rankings can be computed by different IQA algorithms, so those algorithms can be compared by the subjective and objective correlation.
To better analyze the effectiveness of all the algorithms for different types of image assessment, 37 images in the database are divided into 6 types according to the selected attributes: 25 lines or edges images, 15 faces or people images, 6 texture images, 18 foreground objects images, 16 geometric structures images, and 6 symmetry images. Note that one image may belong to several different types, since it can contain several attributes, such as faces and people, which often belong to the foreground objects images.
Table 1 presents these correlation scores of subjective and objective measures for the KRCC according to image attributes. As expected, the FR IQA for retargeted images algorithms show smaller scores correspondence with the subjective assessment, although SIFT Flow and EH achieves higher scores for images classified as containing apparent texture and geometric structures. RR IQA for non-retargeted images algorithms show some better than FR IQA for retargeted images. The near-zero correlation for nearly all image types suggests they cannot predict well the subjective assessment. Their unsatisfying performance has to do with both the image features they use for measuring the distance, and with the way they construct correspondence between the images.
The performance comparison with different IQA algorithms is given in Table 2. It is easy to find that our method is better than the given FR IQA for retargeted images and the given RR IQA for non-retargeted images in Table 2.
PLCC is linear correlation metric, SRCC and KRCC are nonparametric rank correlation metric, and the agreement range is [ 1 , 1]. In this way, higher correlation coefficient predicates higher sequences agreement. RMS is an error metric, so lower error value represents higher agreement.
By comparing the image patches around SIFT feature points between reference and retargeted images, EMD provided a more robust metric of their similarity. As a result, our algorithm was able to obtain high quality prediction accuracy with the limited amount of RR features, and our algorithm could achieve good results in experiment.

5. Discussion

We can find the overall result of correlation is between 0.331 and 0.370 in Table 2. There are three main reasons why the correlation is so low.
(1) The retargeted image database is complex. This database includes lots of irregularly-textured areas, such as grass, water, or trees, and the images in database are retargeted by removing, inserting, or optimizing pixels (or patches) to preserve image content, so the size of the retargeted image is very different from the original image. By this way, the images contains either dense information or global and local structures that may be damaged during resizing.
(2) PLCC, SRCC, and KRCC are three main statistical correlation coefficients, which describe the linear or rank correlation between subjective score and algorithm score. However, the subjective score of retargeted images is obtained by averaging many scores according to 210 participants, which affects the linearity or rank of subjective score and algorithm score.
(3) This paper uses a reduced reference retargeted image quality assessment algorithm, which only uses part of the reference image information, rather than all the information, so the correlation is relatively low.
We could find that our algorithm was better than all the given FR IQA algorithms for retargeted images. The reason was that our algorithm not only considered the local metric (Local EMD) but also considered the global saliency features (Global EMD), while the FR IQA algorithms for retargeted images only used the local metrics. We also found that our algorithm was better than all the given RR IQA for non-retargeted images algorithms. That was because our algorithm did not depend on the same size between reference image and retargeted image, while the compared RR IQA algorithms often need the same sizes between two images. When the two sizes were different, the non-retargeted algorithms would compare their common regions directly. As a matter of fact, they only evaluated a part of images.
Because GEMD just used ten visual saliency features, its evaluation results were not better than many other algorithms. However, it provided a good complement to LEMD and improved the overall evaluation results.

6. Conclusions

In this paper, we have proposed an RR retargeted IQA algorithm using EMD. Each reference image is retargeted through a retargeting channel, and the local and global information, which usually has fewer data than reference image, is transferred through a specific ancillary channel. We extracted SIFT, image block histograms, and saliency feature histograms for corresponding reference and retargeted images, respectively. The overall quality score is calculated from those feature information using EMD between reference and retargeted images. Experimental results demonstrated that the comparison indexes of the proposed algorithm were better than the indexes of given algorithms.
The key step in our algorithm is to provide an EMD metric in a manner that indicates how the local and global information in the reference image is preserved in the corresponding retargeted image. In future works, multi-scale EMD method will be added to extend the RR retargeted IQA approach.

Author Contributions

Conceptualization, L.W. and J.P.; methodology, L.W.; software, L.Z.; validation, L.Z. and L.W.; formal analysis, L.Z.; investigation, L.W.; resources, J.P.; data curation, L.W. and J.P.; writing—original draft preparation, L.W.; writing—review and editing, L.Z.; visualization, L.Z.; supervision, J.P.; project administration, L.W. and J.P.; funding acquisition, L.W. and J.P. All authors have read and agreed to the published version of the manuscript.

Funding

This work was supported by the Opening Fund of Key Laboratory of Geological Survey and Evaluation of Ministry of Education (GLAB2020 ZR06) and the Fundamental Research Funds for the Central Universities, the Joint Foundation of China Aerospace Science and Industry for Equipment Pre-Research 2020, and the National Natural Science Foundation of China under contracts on 61603357.

Institutional Review Board Statement

Not applicable.

Informed Consent Statement

Not applicable.

Data Availability Statement

Not applicable.

Conflicts of Interest

The authors declare no conflict of interest.

Abbreviations

The following abbreviations are used in this manuscript:
AbbreviationFull Name
RRReduced Reference
EMDEarth Mover’s Distance
SIFTScale Invariant Feature Transform
IQAImage Quality Assessment
FRFull Reference
NRNo Reference
MOMulti-operator
CRCropping
SVStreaming Video
SMShift-map
SCSeam Carving
SCLScaling
SNSScale-and-stretch
WARPWarping
PSNRPeak Signal-to-noise Ratio
SSIMStructural Similarity
CLLayout Descriptor
EHEdge Histogram
BDWBidirectional Warping
BDSBidirectional Similarity
VIFInformation Fidelity
DNTDivisive Normalization Transformation
RREDReduced Reference Entropic Differencing
RRSSIMReduced-Reference SSIM
LEMDLocal Image Quality Score using EMD
GEMDGlobal Image Quality Score using EMD
QSQuality Score
PLCCPearson Linear Correlation Coefficient
SRCCSpearman’s Rank Correlation Coefficient
KRCCKendall’s Rank Correlation Coefficient
RMSRoot Mean Squared

References

  1. Zhou, Z.; Li, J.; Quan, Y.; Xu, R. Image Quality Assessment Using Kernel Sparse Coding. IEEE Trans. Multimed. 2021, 23, 1592–1604. [Google Scholar] [CrossRef]
  2. Liu, Y.; Zhai, G.; Gu, K.; Liu, X.; Zhao, D.; Gao, W. Reduced-Reference Image Quality Assessment in Free-Energy Principle and Sparse Representation. IEEE Trans. Multimed. 2018, 20, 379–391. [Google Scholar] [CrossRef]
  3. Rubinstein, M.; Gutiérrez, D.; Sorkine, O.; Shamir, A. A Comparative Study of Image Retargeting. ACM Trans. Graph. 2010, 29, 1–9. [Google Scholar] [CrossRef] [Green Version]
  4. Ma, L.; Li, S.; Zhang, F.; Ngan, K.N. Reduced-Reference Image Quality Assessment Using Reorganized DCT-Based Image Representation. IEEE Trans. Multimed. 2011, 13, 824–829. [Google Scholar] [CrossRef]
  5. Wu, J.; Lin, W.; Shi, G.; Liu, A. Reduced-Reference Image Quality Assessment With Visual Information Fidelity. IEEE Trans. Multimed. 2013, 15, 1700–1705. [Google Scholar] [CrossRef]
  6. Li, Q.; Wang, Z. Reduced-Reference Image Quality Assessment Using Divisive Normalization-Based Image Representation. IEEE J. Sel. Top. Signal Process. 2009, 3, 202–211. [Google Scholar] [CrossRef]
  7. Soundararajan, R.; Bovik, A.C. RRED Indices: Reduced Reference Entropic Differencing for Image Quality Assessment. IEEE Trans. Image Process. 2012, 21, 517–526. [Google Scholar] [CrossRef] [PubMed] [Green Version]
  8. Rehman, A.; Wang, Z. Reduced-Reference Image Quality Assessment by Structural Similarity Estimation. IEEE Trans. Image Process. 2012, 21, 3378–3389. [Google Scholar] [CrossRef] [PubMed]
  9. Bampis, C.G.; Gupta, P.; Soundararajan, R.; Bovik, A.C. SpEED-QA: Spatial Efficient Entropic Differencing for Image and Video Quality. IEEE Signal Process. Lett. 2017, 24, 1333–1337. [Google Scholar] [CrossRef]
  10. Min, X.; Gu, K.; Zhai, G.; Hu, M.; Yang, X. Saliency-induced reduced-reference quality index for natural scene and screen content images. Signal Process 2018, 145, 127–136. [Google Scholar] [CrossRef]
  11. Rubner, Y.; Tomasi, C.; Guibas, L.J. The Earth Mover’s Distance as a Metric for Image Retrieval. Int. J. Comput. Vis. 2000, 40, 99–121. [Google Scholar] [CrossRef]
  12. Ling, H.; Okada, K. An Efficient Earth Mover’s Distance Algorithm for Robust Histogram Comparison. IEEE Trans. Pattern Anal. Mach. Intell. 2007, 29, 840–853. [Google Scholar] [CrossRef] [PubMed]
  13. Lin, Y.; Tang, Y.Y.; Fang, B.; Shang, Z.; Huang, Y.; Wang, S. A Visual-Attention Model Using Earth Mover’s Distance-Based Saliency Measurement and Nonlinear Feature Combination. IEEE Trans. Pattern Anal. Mach. Intell. 2013, 35, 314–328. [Google Scholar] [CrossRef] [PubMed] [Green Version]
  14. Levina, E.; Bickel, P. The Earth Mover’s distance is the Mallows distance: Some insights from statistics. In Proceedings of the Eighth IEEE International Conference on Computer Vision (ICCV), Vancouver, BC, Canada, 7–14 July 2001; Volume 2, pp. 251–256. [Google Scholar] [CrossRef] [Green Version]
  15. Ma, J.; Qiu, W.; Zhao, J.; Ma, Y.; Yuille, A.L.; Tu, Z. Robust L2E Estimation of Transformation for Non-Rigid Registration. IEEE Trans. Signal Process. 2015, 63, 1115–1129. [Google Scholar] [CrossRef]
  16. Liu, C.; Yuen, J.; Torralba, A. SIFT Flow: Dense Correspondence across Scenes and Its Applications. IEEE Trans. Pattern Anal. Mach. Intell. 2011, 33, 978–994. [Google Scholar] [CrossRef] [PubMed] [Green Version]
  17. Xue, W.; Zhang, L.; Mou, X.; Bovik, A.C. Gradient Magnitude Similarity Deviation: A Highly Efficient Perceptual Image Quality Index. IEEE Trans. Image Process. 2014, 23, 684–695. [Google Scholar] [CrossRef] [PubMed] [Green Version]
  18. Baluch, F.; Itti, L. Mining videos for features that drive attention. In Multimedia Data Mining and Analytics; Springer: Berlin, Germany, 2015; pp. 311–326. [Google Scholar]
  19. Wei, L.; Luo, D. A biologically inspired computational approach to model top-down and bottom-up visual attention. Opt. Int. J. Light Electron. Opt. 2015, 126, 522–529. [Google Scholar] [CrossRef]
  20. Ponomarenko, N.; Jin, L.; Ieremeiev, O.; Lukin, V.; Egiazarian, K.; Astola, J.; Vozel, B.; Chehdi, K.; Carli, M.; Battisti, F. Image database TID2013: Peculiarities, results and perspectives. In Proceedings of the Signal Processing: Image Communication, Bellingham, WA, USA, 31 July–4 August 2005; Volume 32, pp. 57–77. [Google Scholar] [CrossRef] [Green Version]
  21. Lin, H.; Hosu, V.; Saupe, D. KADID-10k: A Large-scale Artificially Distorted IQA Database. In Proceedings of the 2019 Eleventh International Conference on Quality of Multimedia Experience (QoMEX), Berlin, Germany, 5–7 June 2019; pp. 1–3. [Google Scholar] [CrossRef]
  22. Virtanen, T.; Nuutinen, M.; Vaahteranoksa, M.; Oittinen, P.; Häkkinen, J. CID2013: A database for evaluating noreference image quality assessment algorithms. IEEE Trans. Image Process. 2015, 24, 390–402. [Google Scholar] [CrossRef] [PubMed]
  23. Ghadiyaram, D.; Bovik, A.C. Massive Online Crowdsourced Study of Subjective and Objective Picture Quality. IEEE Trans. Image Process. 2016, 25, 372–387. [Google Scholar] [CrossRef] [PubMed] [Green Version]
  24. Lin, H.; Hosu, V.; Saupe, D. Koniq-10k: Towards an ecologically valid and large-scale iqa database, Pittsburgh, Pennsylvania. arXiv 2018, arXiv:1803.08489. [Google Scholar]
Figure 1. The framework of RR retargeted IQA by EMD.
Applsci 11 09776 g001
Figure 2. An example of a source reference image and eight retargeted images with different models.
Applsci 11 09776 g002
Figure 3. Histogram of subjective and objective assessment. (left) Subjective votes for the child image by participants. (right) Objective results by our proposed algorithm on the same image.
Applsci 11 09776 g003
Table 1. Correlation scores of subjective and objective measures for the KRCC according to image attributes. Highest score in each column appears in bold.
AlgorithmLines/EdgesFaces/PeopleTextureForeground ObjectsGeometric StructuresSymmetry
FR IQA for retargeted imagesEL0.043−0.076−0.060−0.0790.1030.298
CL−0.023−0.181−0.071−0.183−0.0090.214
BDW0.0310.048−0.0480.0600.0040.119
BDS0.0400.1900.0600.167−0.004−0.012
SIFT Flow0.0970.2520.1190.2180.0850.071
RR IQA for nonretargeted imagesDCT0.124-0.0020.0510.2010.0350.103
VIF0.2100.2330.0780.2300.101−0.004
DNT0.1420.248−0.0250.1850.0460.151
RRED−0.0310.3410.0750.284−0.0030.293
RRSSIM0.1790.3280.0200.2570.2370.226
RR IQA for retargeted imagesLEMD0.2360.4320.0680.3790.0260.332
GEMD0.1250.4520.0250.4200.0120.150
QS0.2620.4610.0730.4380.0340.357
Table 2. The performance comparison with different IQA algorithms.
AlgorithmPLCCSRCCKRCCRMS
FR IQA for retargeted imagesEL0.0480.0250.0040.324
CL0.0190.013−0.0680.457
BDW0.0620.0500.0460.274
BDS0.0910.0970.0830.262
SIFT Flow0.1490.1510.1450.238
RR IQA for nonretargeted imagesDCT0.0730.0690.0560.266
VIF0.1850.1870.1680.232
DNT0.1610.1530.1370.241
RRED0.2530.2470.2340.225
RRSSIM0.2600.2660.2590.221
RR IQA for retargeted imagesLEMD0.3250.3220.2940.172
GEMD0.1290.1260.1200.236
QS0.3700.3650.3310.164
Publisher’s Note: MDPI stays neutral with regard to jurisdictional claims in published maps and institutional affiliations.

