
Emerging and Persistent Pollutants in the Aquatic Ecosystems of the Lower Danube Basin and North West Black Sea Region—A Review


 ,
,  ,
, 
Abstract
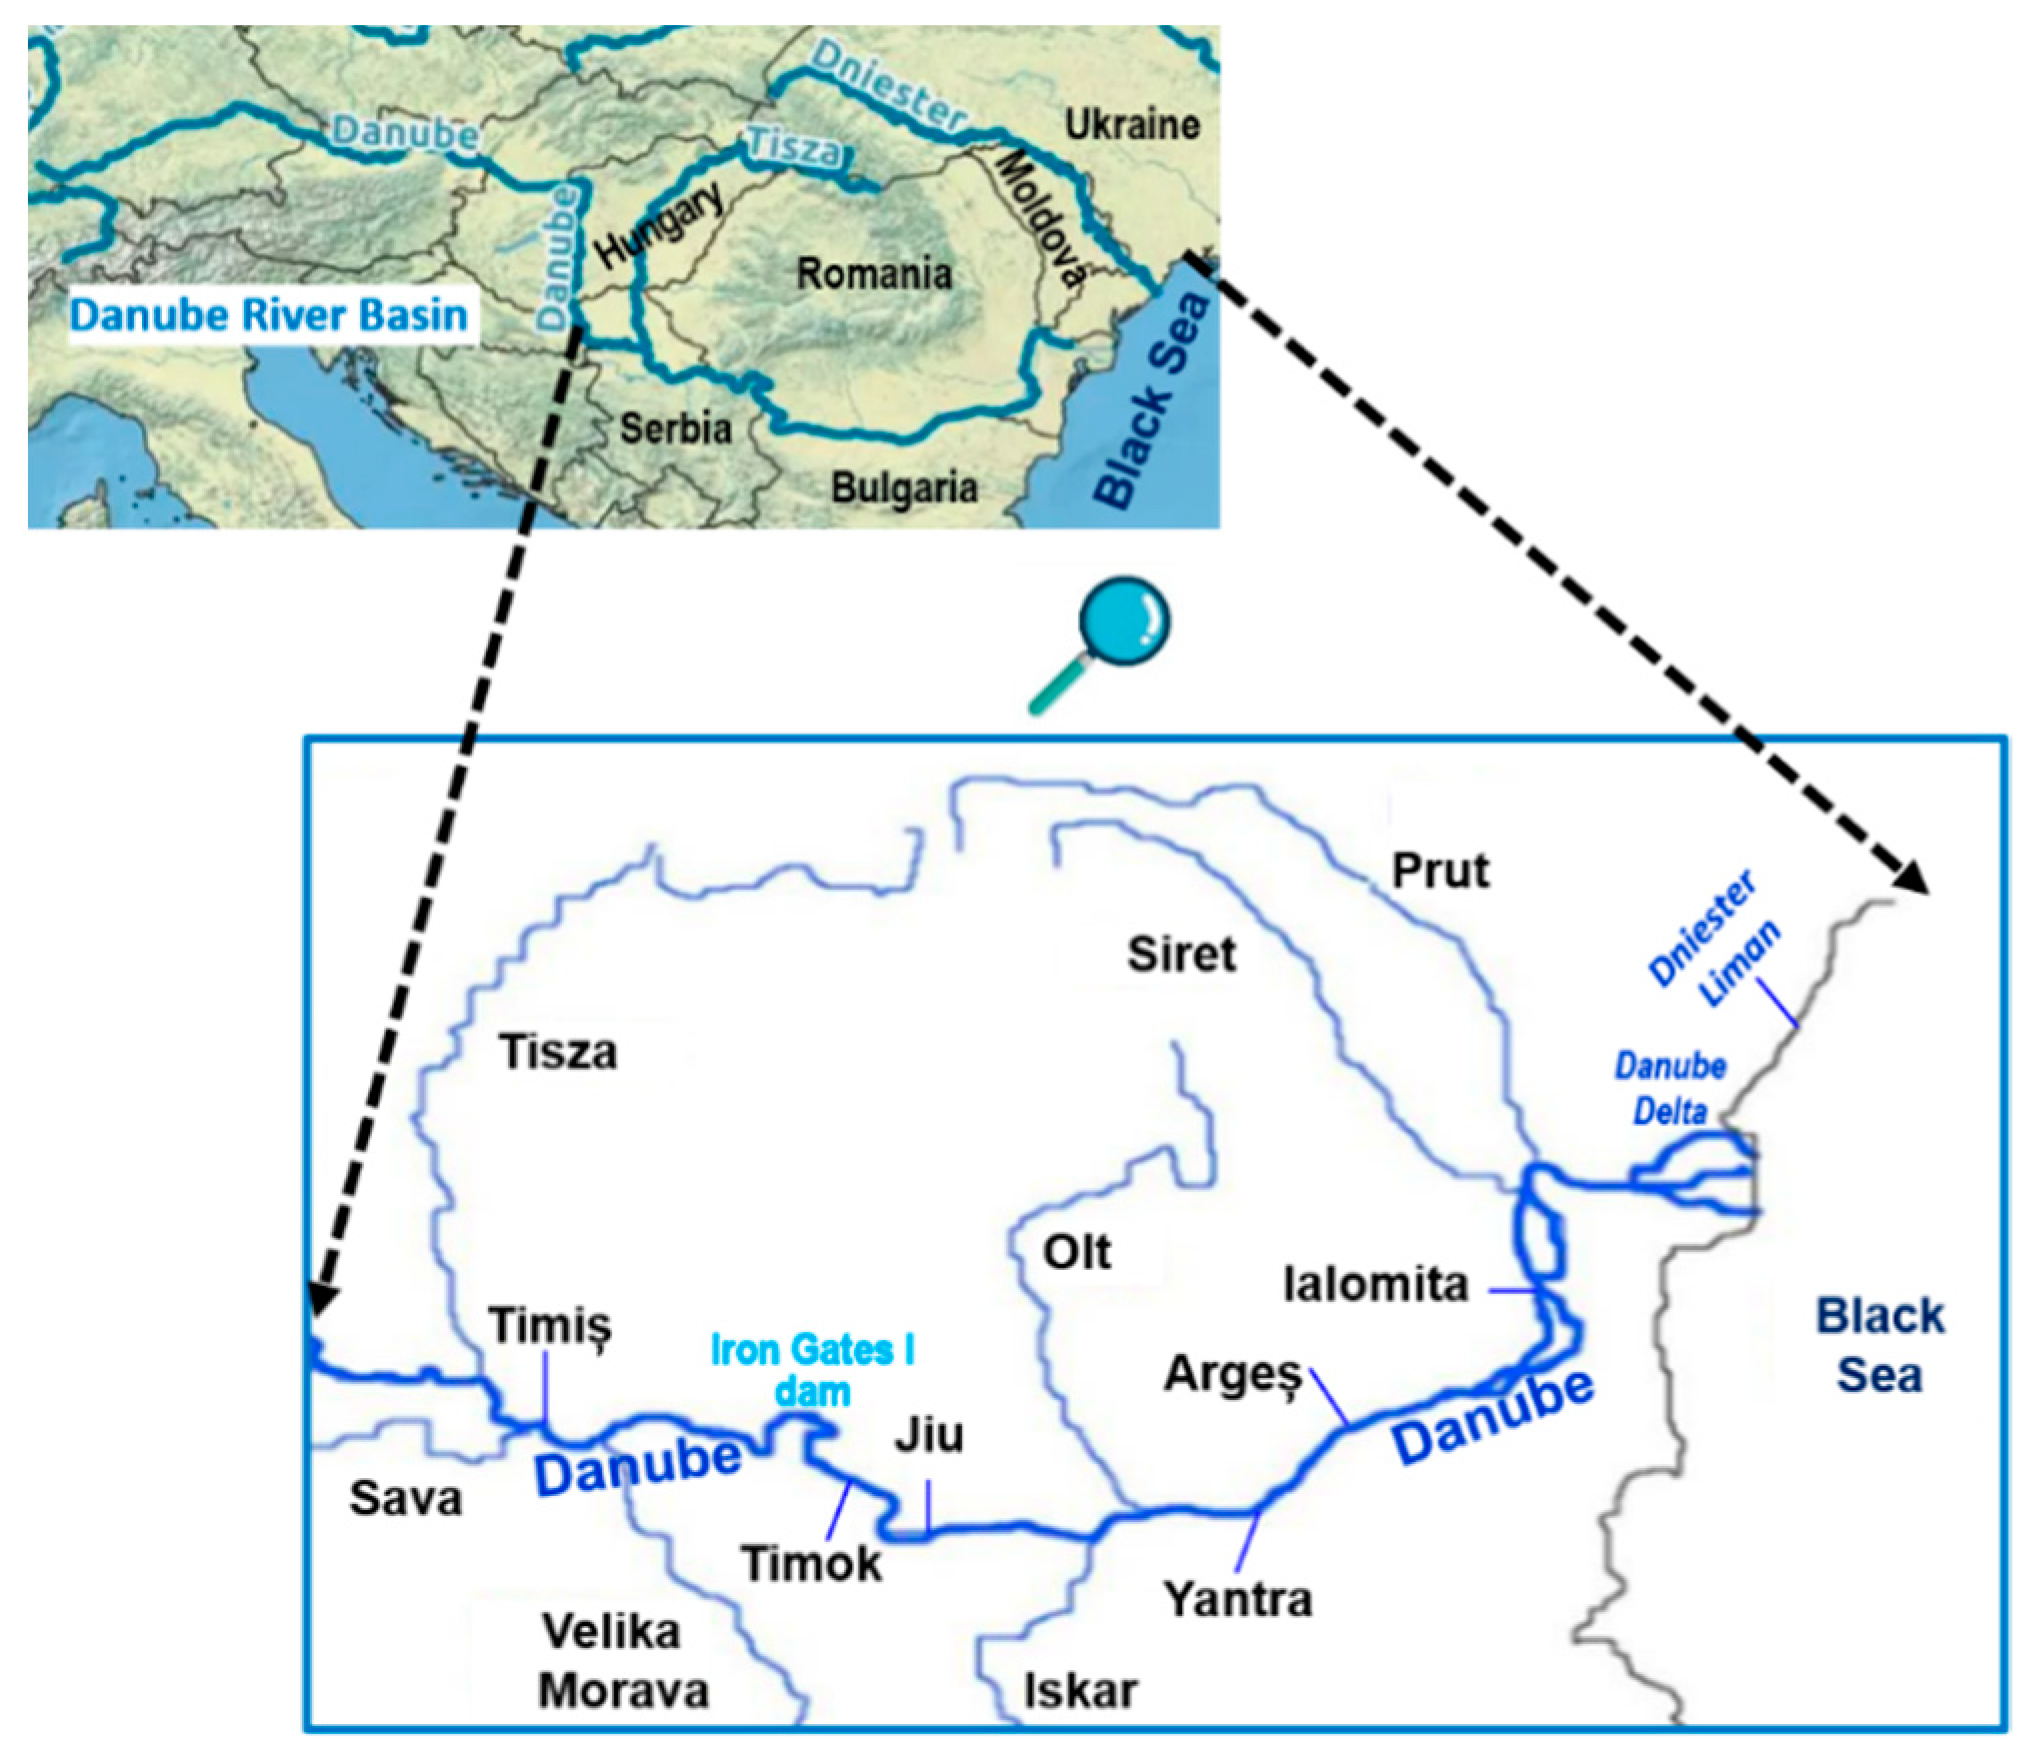
1. Introduction
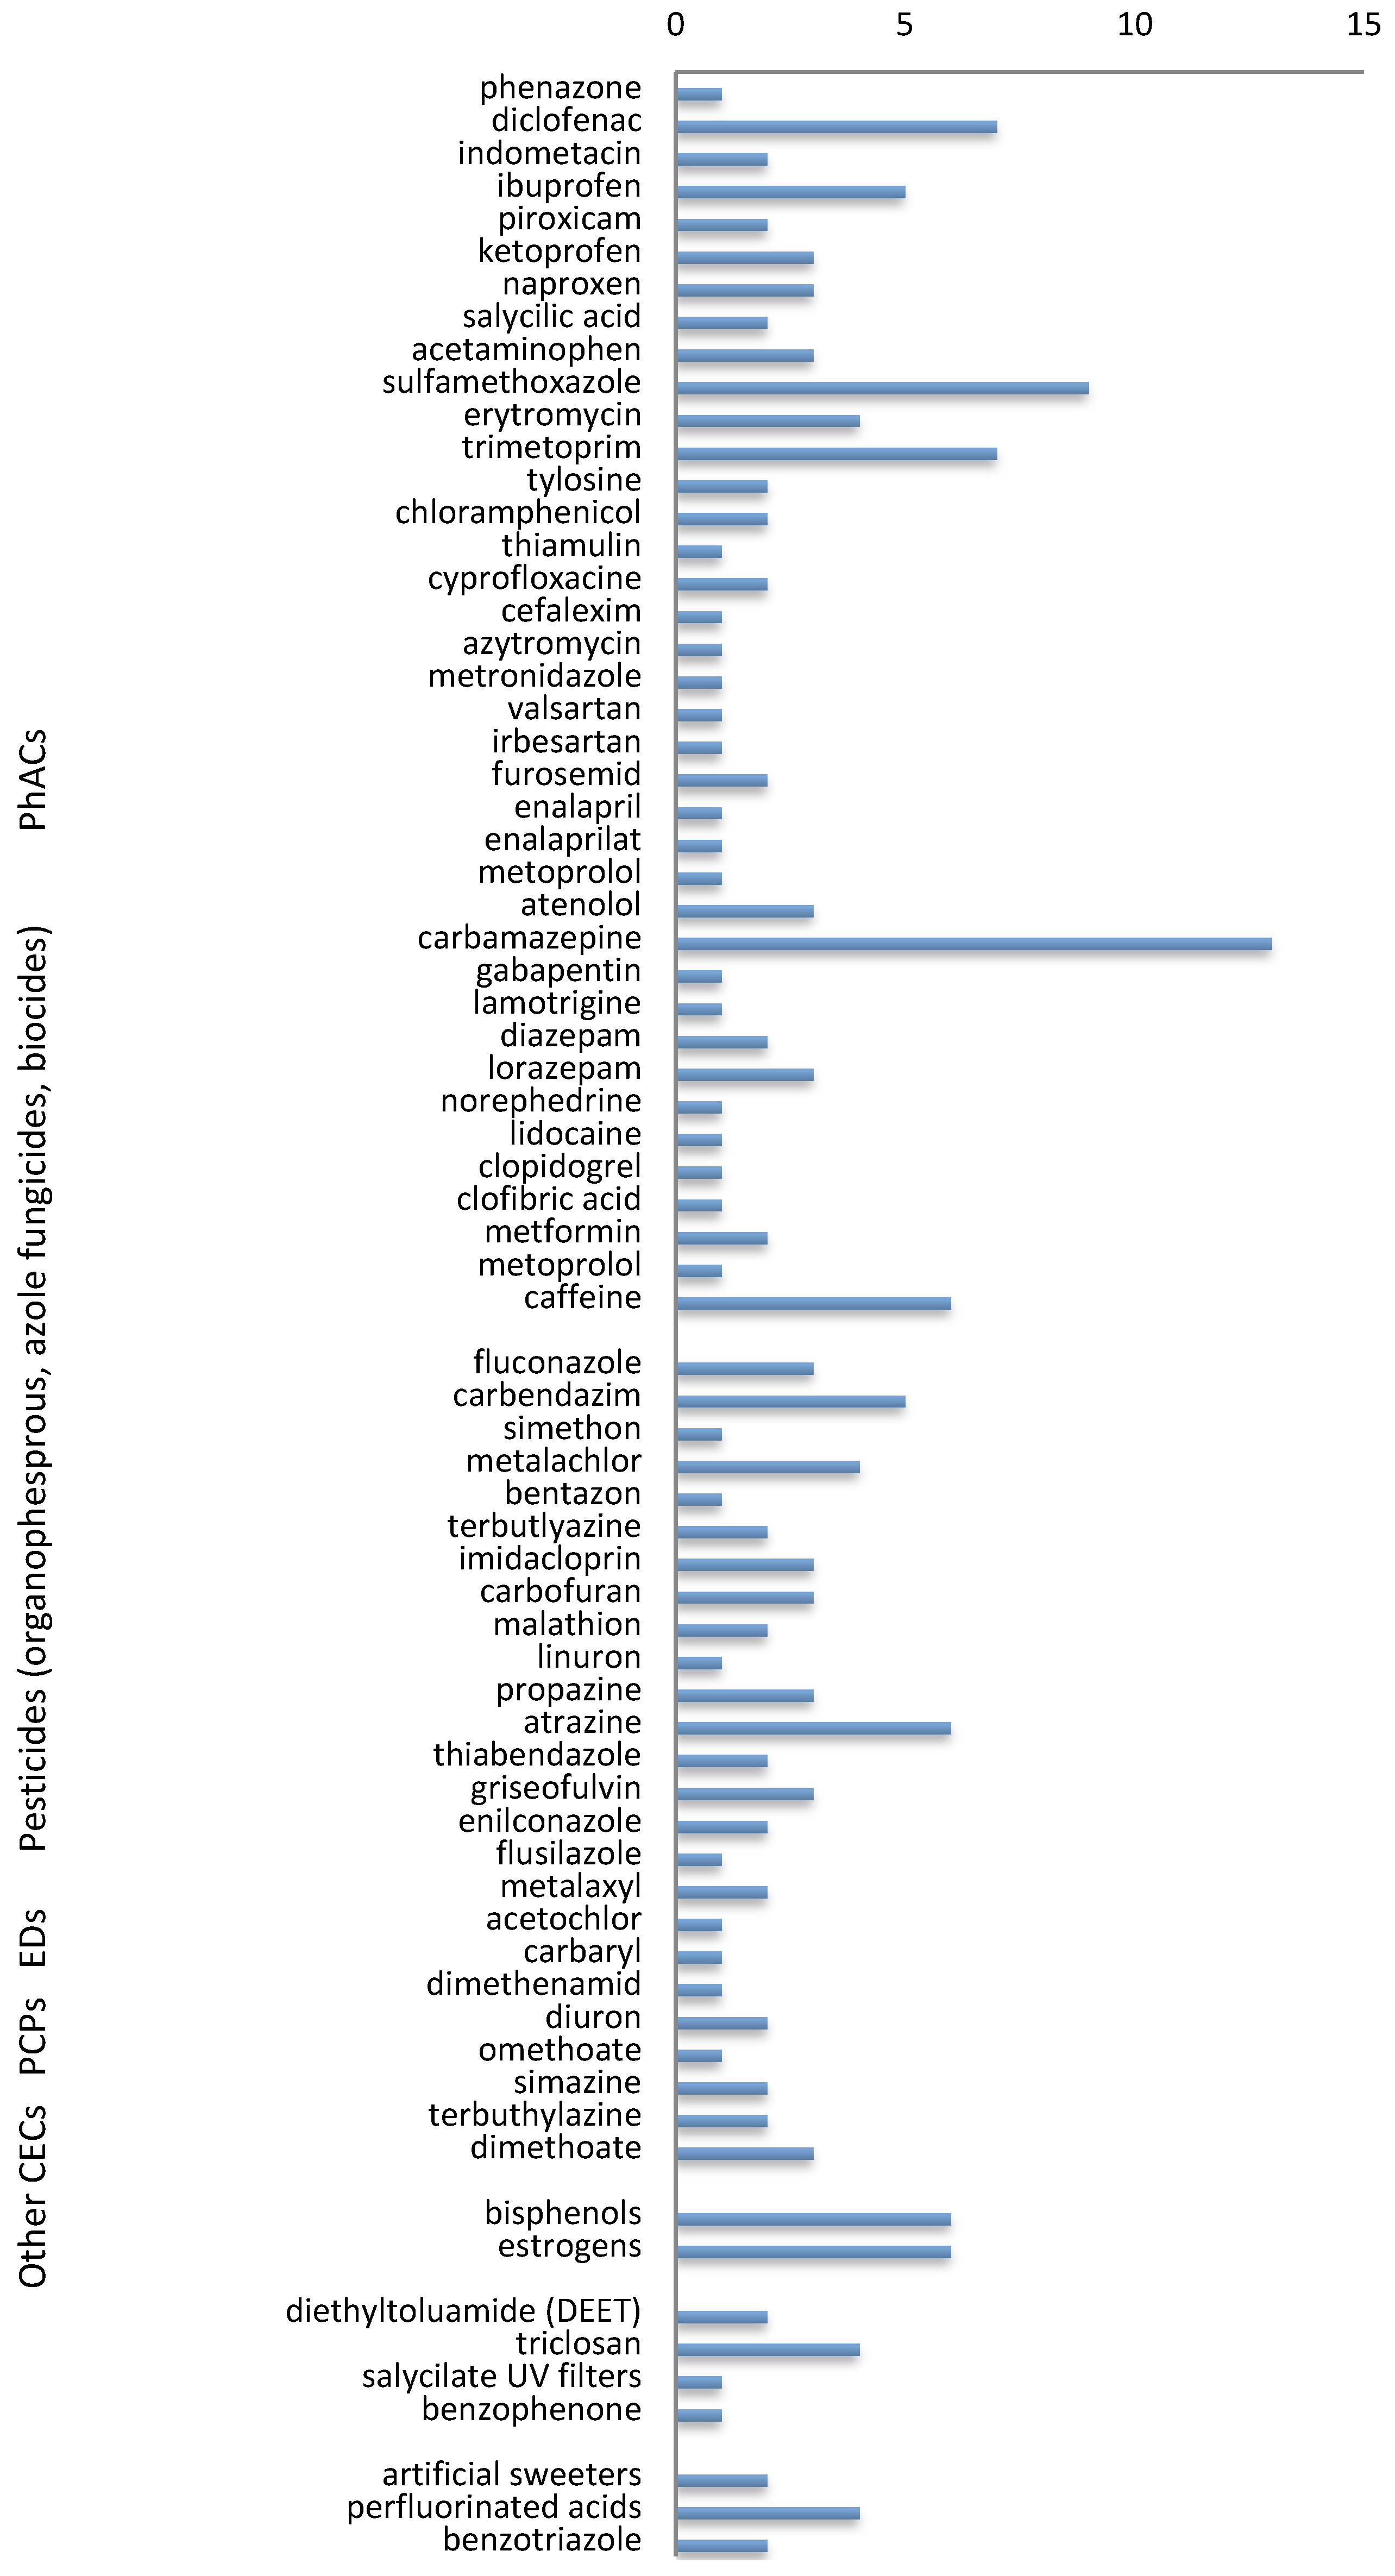
2. Contaminants of Emerging Concern (CECs)
2.1. Pharmaceuticals (PhACs)
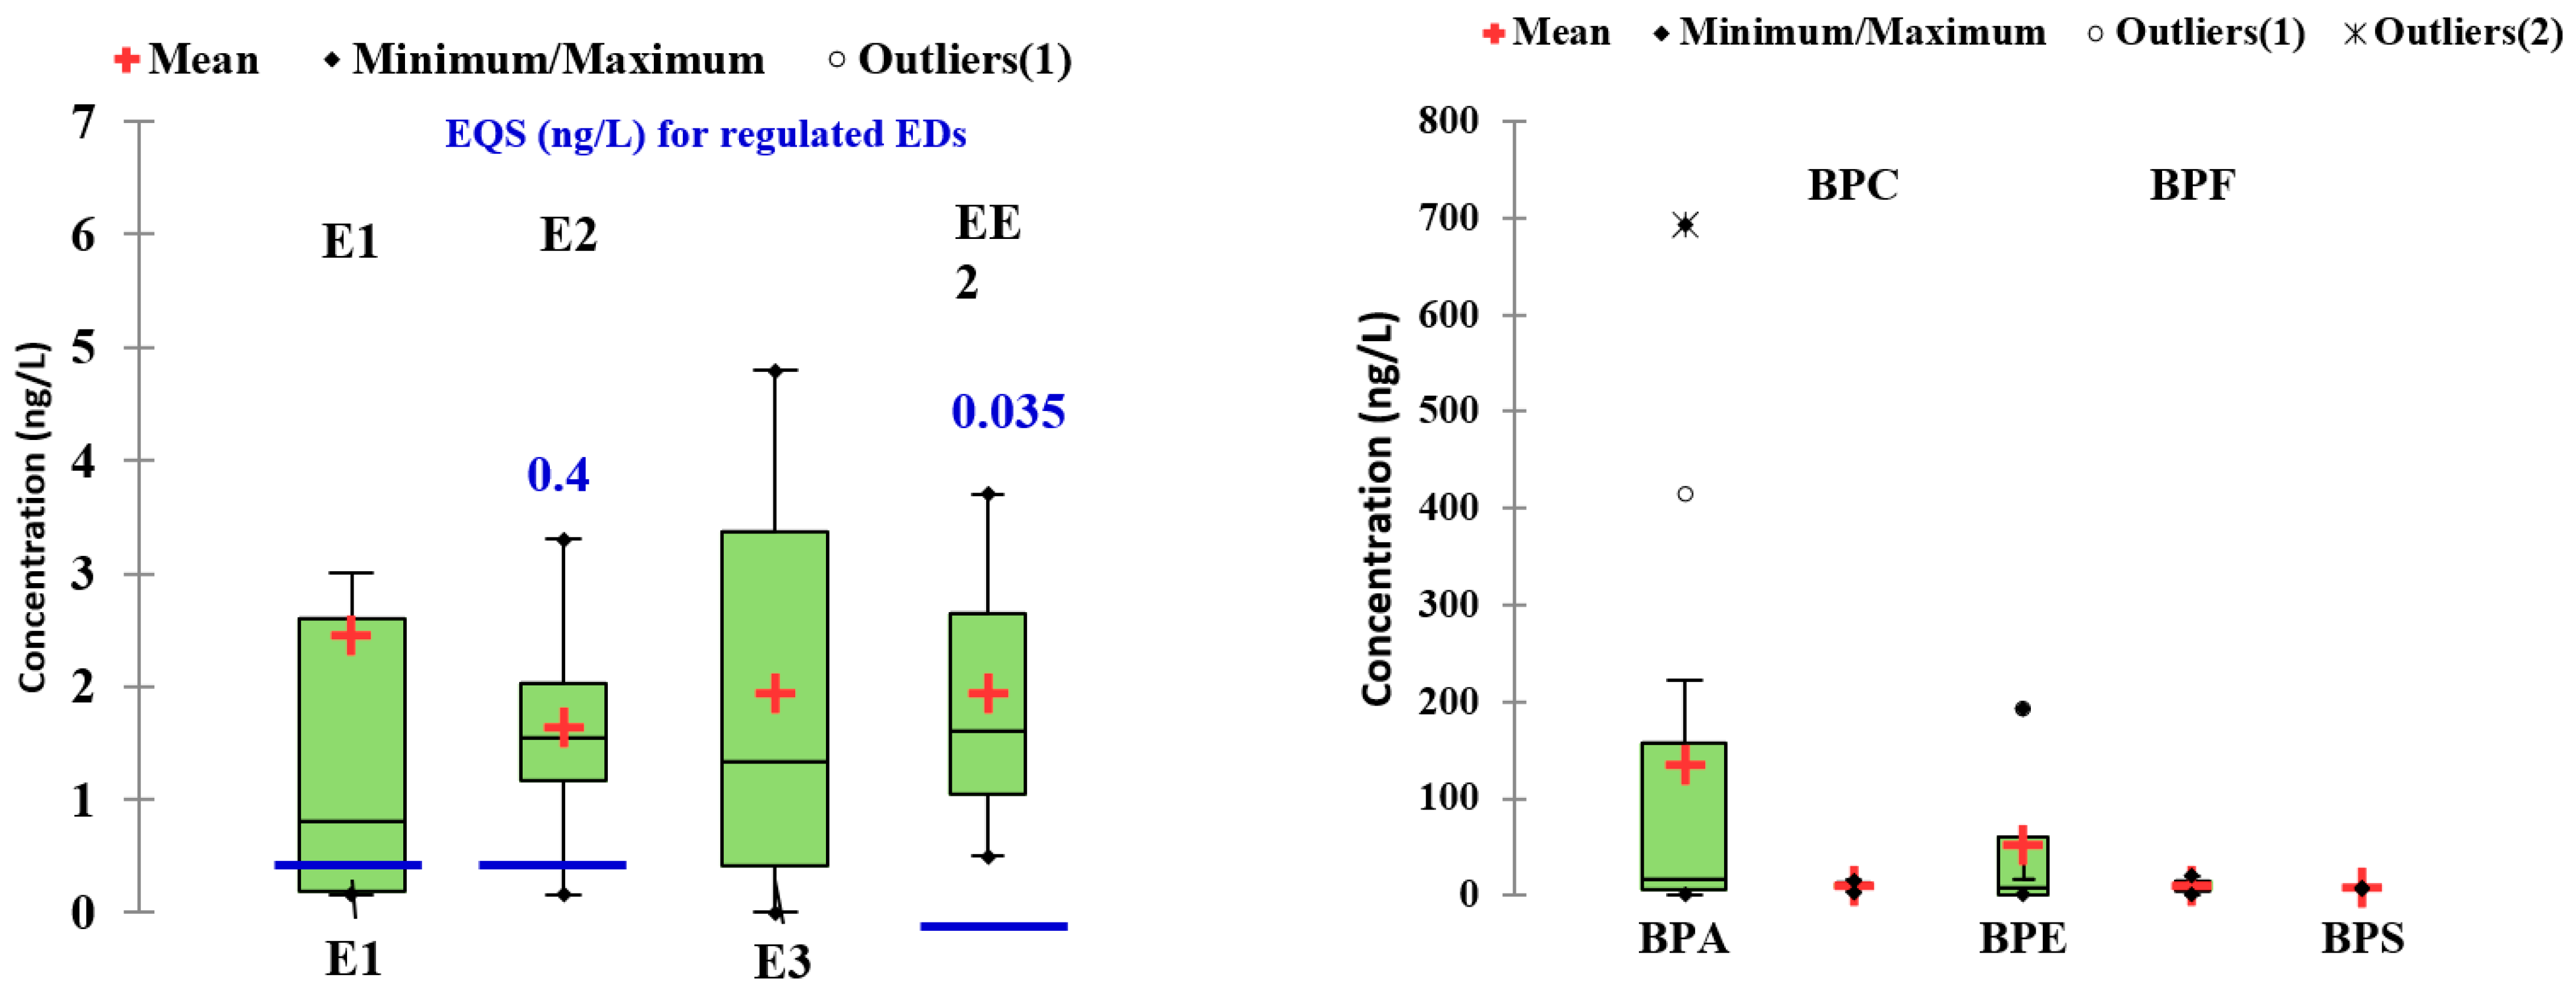
2.2. Endocrine Disruptors (EDs)
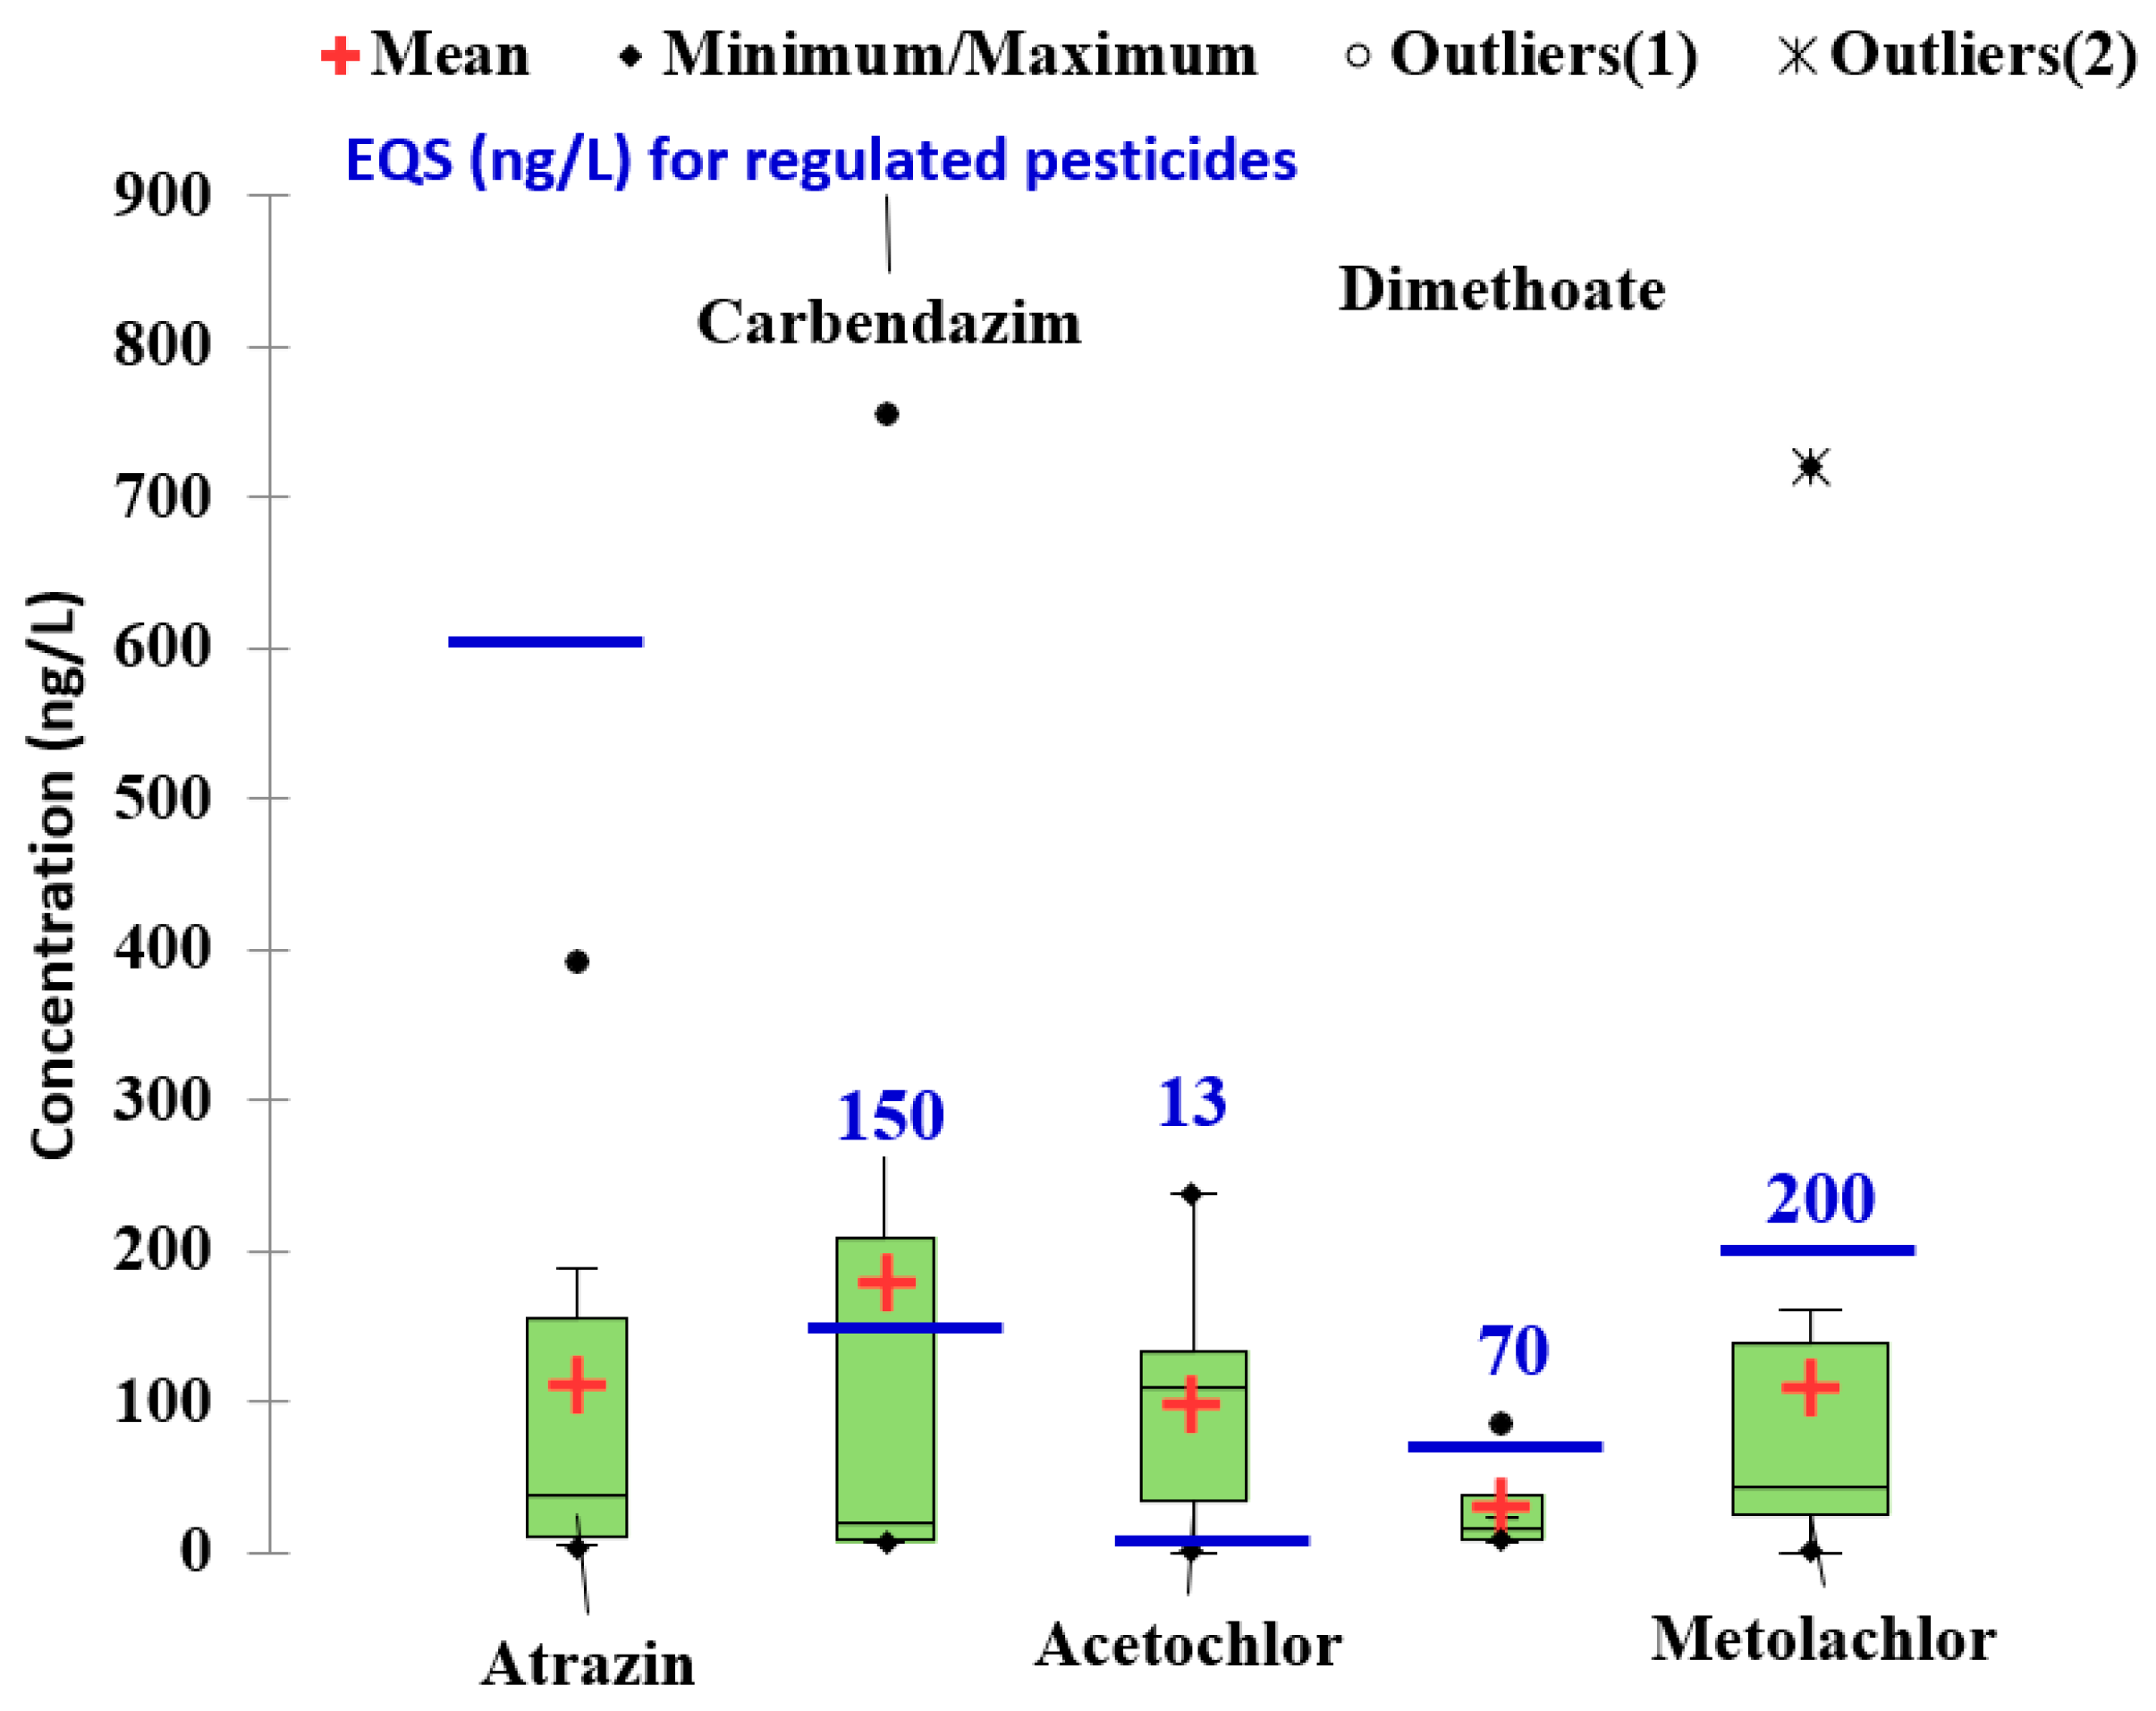
2.3. Pesticides (Other Than Organochlorine)

| Sampling Site/Sampling Moment (Data) | Analytical Approach | Relevant Environmental Concentrations Range for the Detected Compounds in Analyzed Matrices | Ref. |
|---|---|---|---|
| Two sampling points on the Danube River (Novi Sad and Kovin, Serbia) and three sampling sites from tributaries: the Tisa River, the Sava River, the Morava River/Not mentioned | SPE LC-QqQ quadrupole ion trap mass spectrometer, SRM mode | Sediments (ng/g): Dimethoate (79–1222 in Tisa river); Carbofuran (7–21 in sediment in Morava river); Propazine (8–72 in sediment in Morava river) Ground water ng/L): Carbendazim (3–88 in, Danube); Surface waters (ng/L): Atrazine (4–392 in Morava river); Malathion (67–69 in in Morava river) | [39] |
| 16 sampling sites on the Danube river including also major tributary Sava, Morava and Tisa/June and October of 2009, February, April, May, June, September, October of 2010, and June and September of 2011. | SPE-LC-MS/MS and GC-MS | Surface waters (ng/L): Carbendazim (8–269 in Morava river); Atrazine (20–188 in Morava river); Terbuthylazine(130–200 in the Danube river); Acetochlor (40–110 in Morava river); Metolachlor (80–150 in the Danube); Dimethoate (7–23 in the Danube); Propazine (8–18 in Morava river) | [77] |
| Iron Gate I Reservoir on the Danube River/ August–September 2007, JDS2 | UAE and SPE-LC-ion trap LTQ ESI | Sediments (ng/g): Carbendazim (0.6–2.4); Imidacloprid(0.8–3.5); Carbofunan (0.3–3.2); Atrazine (0.4–5.8); Propazine (0.3–1.7); Linuron (2.2–8.7); Malathion (1.4–2.9) | [44] |
| Middle and low of the Danube River and its tributaries/ August to September 201 (JDS3) | GC-MS SIM mode | Surface waters (ng/L): Tris(2-chloroethyl)-phosphate TCEP (41 in Iskar River); Metolachlor (39) 2,4-D (22) | [45] |
| 16 samples from Danube river and from three of the main affluents: Siret, Olt, Arges; 4 samples from Danube Delta/ May, June, August, and October 2014 | SPE-LC-HR Orbitrap MS–MS, Targeted analysis in SIM mode | Surface waters (ng/L): Enilconazole (2.5–80 in the Danube); Griseofulvin (2.1–57 in the Danube Delta); Carbendazim (6–30 in the Arges river); Thiabendazole (ND-53 in the Danube); Metalaxil (65 in the Siret river) | [10] |
| Three sampling campaigns along the 250-km-long stretch of the Prut River/May and November 2011, and June 2012 | SPE-GC-MS SPE-LC-HRMS, full MS and DDA MS/MS | Surface waters (ng/L): Bentazone (9.1–65); Atrazine (5.1–9.5); Terbutlyazine (ND-41, 4); Acetochlor (ND-28); Metalachlor(ND-33); 4-phenylbenzo-phenone (ND-323); 2,4 D (5.4–8.9) | [53] |
| Dniester River Basin (Ukraine and Republic of Moldova)/May 2019 | LC-ESI-QTOF-HRMS in DIA and DDA acquisition modes | Surface waters (ng/L): Acetochlor (<28.6–238); Atrazine (<7.82–55.2); Carbaryl (<55.8–1353) Carbendazim (<7.1–755) ; 2-aminobenzimidazole (<5.39–311); Dimethenamid (<0.84–1189); Dimethoate (<9.13–85.2); Diuron (<10.9–1197); Imidacloprid (<14.6–107); Metolachlor (<3.41–4612); Nicosulfuron (<2.24–32.5); 2, 4, D amine (5.4–8.9); Simazine (70.4–2010); Tebuconazole (3.3–11.2); Maximum values, were reported in the central part of the basin, Moldova theritory | [26] |
2.4. Personal Care Products (PCPs)
2.5. Other CECs
3. Persistent Organic Pollutants
| Sampling Site/Sampling Moment (Data) | Monitored Contaminants | Analytical Approach | Relevant Environmental Concentrations Range for the Detected Compounds in Analyzed Matrices | Ref. |
|---|---|---|---|---|
| Four points in Tisza River on Serbian territory/2018 | 20 OPCs (4HCH, 3DDTs, aldrin, dieldrin, endrin, heptachlor, etc) | USEPA Soxhlet extraction method (3540S), GC with electron capture detector | Sediments (μg/kg): Aldrin (0.10–0.96); Heptachlor (0.08–0.96); Endrin (0.03–0.28); α-HCH (1.38–3.76); Σ3DDTs 1.38–3.55; Σ4HCH (1.98–7.59); ΣOCPs: 11.6–21.34 | [93] |
| 10 sampling sites along Danube (1401 Km–1103 km)/October 2012 | 7PCBs and OCPs | Solid-liquid extraction, GC-MS-MS | Bottom sediments (μg/kg): Ʃ 7PCBs (0.25–3.54); Σ6DDTs (0.70–16.65); Σ 5HCH (0.04–2.28) | [94] |
| 200-km-long Danube segment on Serbian territory and the main tributary/September 2014 | 50 PAHs, 90 PCBs, OPCs (6 DDTs and 4 HCH) | GC-MS-MS (full scan and SIM mode) | Sediments (μg/kg): Σ16PAHs (170–1047); Total PAHs (43.5–1396); Σ6PCB (0.3–6.1); Total PCB (0.928–32.1) Σ11OPCs (0.564–61.6); Σ DDTs (0.45–61.17) | [95] |
| Tisza River on the Romanian territory/November 2014 to September 2015 | 16 PAHs | HPLC, detection based on different emission/excitation wavelength | Surface waters (µg/L): Ʃ 16PAHs (0.0122–0.) Sediments (μg/kg): Ʃ 16PAHs (4.94–10.62) | [96] |
| 120 sites on the Begej canal, at the border between Romania and Serbia/ 2008–2016, annually monitoring | 16 PAHs | GC-MS according to USEPA method 8270C | Sediments (sludge layer) (µg/kg): Ʃ 16PAHs (34.9–23600) | [84] |
| Iron Gate I Reservoir on the Danube River/2007 (JDS2) | 16 PAHs | GC-MS for PAHs, SIM mode | Sediments (μg/kg): Σ16PAHs (700–1200) Σ total PAHs (1500–3000) | [97] |
| 10 monitoring sites in the Lower Danube River between Calarasi and Braila (km 375–km 175)/September 2011–August 2017 | 16 PAHs and 6PCBs | GC-MS | Surface sediments (μg/kg):Σ16PAHs (70–300) Σ6PCBs (5–20) | [85] |
| SE Romania: Lower Prut Meadow, Siret River proximity, Danube River proximity/April 2009 | 16 PAHs and OCPs | Extraction EPAMethod 8081B; GC-ECD for OCP analysis; GC-MS in SIM mode for PAH and confirmation of OCP | Top-soils (µg/kg): α-HCH (6–1875); β-HCH (18–4273); γ-HCH (1.0–670); p,p′-DDE (27–4395); heptachlor (108–873); Σ total OCPs)6–12,644) Σ HCHs (6–6818); Σ DDTs (27–5826); Σ 16PAH (9–25,352) | [98] |
| Eight sites along Prut River/ March 2016 | 17 OPCs (3 HCH, 3 DDTs, Heptachlor, Aldrin, Dieldrin, Endrin) | GC-ECD | Surface water(µg/L): γ-BHC (0.116–0.144); 4.4’-DDE (0.129–0.187); 4.4’-DDE 0.362 | [99] |
| Six sites on Prut River eight sites on Dniester River/ campaigns in 2017 and 2018 | HCHs, DDTs | Extraction method 3540C USEPA, 1996; GC-MS-MS (SRM mode) | River sediment (µg/kg): Dniester River: Ʃ4HCH (0.10–1.2); Ʃ6DDTs (6.2–36); Prut river: Ʃ4HCH (0.093–1.0); Ʃ6DDTs (2.6–38) | [100] |
| 50 sites in Low Danube basin and Dniester basin, Romania and Republic of Moldova/2011 | OCPs, PAHs | GC withECD for OPCs (SMV ISO 10382:2008) GC-MS for PAHs, SIM mode | Top soil (µg/kg): Chlordane (0.28–1084.3); Toxaphene (5.2–3901.2); Heptachlor (1.2–505); total triazine (<1–250); Trifuraline (<1–250); ΣHCHs (0.17–2101,20); ΣDDTs max: 3148; Σ17PAHs max: 367,0 | [101] |
| Saint George branch, the Danube Delta/February 2009–February 2011, monthly monitoring | PAHs, PCBs, OCPs | HPLC andGC with ECD (OPCs and PCBs) | Surface waters (µg/L): DDT (max. of 0.649); Σ 6PCBs (0.003–0.013) Sediments (µg/kg): α-HCH (0.2–11.0); β-HCH (0.3–22.0); δ-HCH (0.3–8.0); Heptachlor (0.7–8.0); Endrin (0.3–11); Lindane (0.2–45.0); Σ 6PCBs (27.3–74, maximum value of 415 in a sampling site near ships pontoon); Σ 3DDTs (0.4–29.1); Σ16 PAHs (100–24570) | [92] |
| Danube River Bulgarian Black Sea coast 2010 | 14 PCBs, DDT and its metabolites DDE and DDD | GC-Ion Trap MS Method US EPA 1668a | Freshwater fish (µg/kg WW): ΣPCBs (0.0062–0.0125); Σ6PCBs (0.0052–0.0097); Σ3DDTs (0.0192–0.03028); Sea fish (µg/kg WW): ΣPCBs (0.0059–0.0478); Σ6PCBs (0.0051–0.0346); Σ3DDTs (0.0541–0.217) | [86] |
| Bulgarian Black Sea coast/2007–2011 | OPCs (DDT, DDE and DDD) | GC-MS | Fish (µg/kg WW): Σ3DDTs (0.0185–0.200 ww) | [86] |
| 12 sampling sites marine areas of the Romanian Black Sea sector/2011–2012 | 16 PAHs | GC-MS | Sediments (µg/kg): Σ16 PAHs (82–6,983) | [102] |
| Romanian part of theBlack Sea/March 2010, May 2011, March–April 2012 October 2012 Ukrainian marine waters near Zmeiny Island, 2010Danube Delta; Danube estuarine coast/2010–2011 | 16 PAHs | GC-MS | Surface water (µg/L): Σ16 PAHs (0.071–1.146 in 2010, 0.190–2.322 2011 and 1.683–28.976 in 2012) Σ16 PAHs (0.649–0.748 in 2010) Sediments (µg/kg): Σ16 PAHs 602.2–1346 in 2010, 321–3045 in 2011 and 304–5611 in 2012) Sediments (µg/kg): Σ16 PAHs (329–1093 in 2010; and 293.8–1001 in 2011) Sediments (µg/kg): Σ 16PAHs (329–1093) | [103] |
4. Metals
5. Microbiological Pollution
6. General Overview
- -
- -
- Studies are repetitive, which is helpful in terms of pollutants dynamics but, on the other hand, not only the most frequently studied substances should be considered but also those with high risk and relevance for the environment;
- -
- Most of the authors reported occurrence of CECs without justifying the selection of compounds. Criteria as ‘’substances that commonly have been detected’’ or ‘’ubiquitous presence’’ were appealed. Priority substances listed by the EU regulations or NORMAN databases were mentioned in four papers [26,44,51,77];
- -
- Insufficient attention was paid to the natural variability of the aquatic environment, leading to inadequate data collection (e.g., substances that are susceptible to degradation caused by sunlight exposer or absorption of the pollutant on suspended particulate matter were rarely discussed). One paper concerning CECs analysis in suspended particulate matter was identified [45];
- -
- The majority of the reviewed studies concerning CECs monitoring were based on ‘grab-sampling’ often with no intra-day repetition. The limitations of such an approach results in snap shots data on pollutant concentration for a specific point in time. Composite sampling that considered flow fluctuations was performed in 1 of 24 studies [15]; furthermore, chemical stability of the target analytes during storage until analysis was investigated in only one study [45];
- -
- Few antibiotics are usually monitored in the studies cited in Table 1 (pharmaceuticals) despite the risk posed to aquatic and terrestrial organisms and possible occurrence of bacteria resistance;
- -
- The analytical approach of targeted screening with low resolution mass spectrometry (e.g., triple quadrupoles) used in the majority of reviewed studies resulted in numerous substances such as metabolites or transformation products going undetected. Among 24 studies concerning CECs monitoring, tentative identification using HRMS-MS was carried out in one publication [26]. Multiresidue methods allowing targeted (quantitative) and non-targeted (qualitative) screening should become standard procedures for CECs analysis as well as combining analytical methods with metabolomics for the identification of uncommon chemicals, metabolites, and degradation product(s);
- -
- To determine and predict trends, multivariate statistical methods (factor analysis of principal component analysis (PCA) were applied as well as indicators of pollution status, as Hazard Quotient (HQ), Enrichment Factor (EF), Geo-accumulation index (Igeo), and Ecological risk index (RI) were determined in several papers concerning persistent pollutants as PAHs, OCPs, and metals [2,46,51,84,100,107,121,144];
- -
- Regarding CECs, the basis for risk assessment was rarely discussed. Risk coefficients (RQ) value based on the ratio of the Predicted/Measured Environmental Concentration (PEC/MEC) and Predicted No-Effect Concentration (PNEC) was performed in three papers for endocrine disruptors [61,68,69] and in one for pharmaceuticals, pesticides, and other CECs [26]; the fate of pesticides in sediments and risk assessment according to their physico-chemical properties was discussed in one paper [44];
- -
- -
- Pollution emission sources were investigated for PAHs [96], OPCs [94], pharmaceuticals [51,53], and heavy metals [106,126,128,156]. Untreated and inadequate treated waste water was demonstrated as being the main source of organic pollution in the low Danube basin. The metals pollution is associated with industrial and municipal sources;
- -
- Seasonal variations were reported for all contaminants classes, probably due to the temperature related processes of biotransformation and absorption. Similar phenomena were reported for pharmaceuticals in Swedish aquatic environment [157] and for herbicide and insecticide in surface waters in Spain [158];
- -
- The Dniester River is one of the less-studied rivers in Europe;
- -
- No report was identified concerning pharmaceuticals residues in seawater or sediments for the North-West Black Sea coast;
- -
- Studies were heterogeneous and, generally, did not allow comparisons;
- -
- -
- Future research should be conducted in the investigation on the effect of emerging pollutants mixtures to different biological systems, on the development of bacterial resistance, and the fate of CECs in the environment (transport, bioaccumulation, degradation). Effective wastewater treatment and reliable fate and toxicity assessment are needed.
7. Conclusions
Author Contributions
Funding
Institutional Review Board Statement
Informed Consent Statement
Data Availability Statement
Acknowledgments
Conflicts of Interest
References
- River Basin | ICPDR—International Commission for the Protection of the Danube River. Available online: https://www.icpdr.org/main/danube-basin/river-basin (accessed on 5 July 2021).
- Covaci, A.; Gheorghe, A.; Hulea, O.; Schepens, P. Levels and Distribution of Organochlorine Pesticides, Polychlorinated Biphenyls and Polybrominated Diphenyl Ethers in Sediments and Biota from the Danube Delta, Romania. Environ. Pollut. 2006, 140, 136–149. [Google Scholar] [CrossRef] [PubMed]
- Rouholahnejad, E.; Abbaspour, K.C.; Srinivasan, R.; Bacu, V.; Lehmann, A. Water resources of the Black Sea Basin at high spatial and temporal resolution. Water Resour. Res. 2014, 50, 5866–5885. [Google Scholar] [CrossRef]
- Bănăduc, D.; Rey, S.; Trichkova, T.; Lenhardt, M.; Curtean-Bănăduc, A. The Lower Danube River–Danube Delta–North West Black Sea: A Pivotal Area of Major Interest for the Past, Present and Future of Its Fish Fauna—A Short Review. Sci. Total Environ. 2016, 545–546, 137–151. [Google Scholar] [CrossRef] [PubMed]
- Gasparotti, C. The Main Factors of Water Pollution in Danube River Basin. EuroEconomica 2014, 1, 91–106. [Google Scholar]
- Convention on Cooperation for the Protection and Sustainable Use of the Danube River (Danube River Protection Convention). ICPDR, Sofia, Bulgaria. 1994. Available online: https://www.icpdr.org/main/icpdr/danube-river-protection-convention (accessed on 5 July 2021).
- Slobodnik, J.; von der Ohe, P.C. Identification of the Danube River Basin Specific Pollutants and Their Retrospective Risk Assessment. In The Danube River Basin; Liska, I., Ed.; The Handbook of Environmental Chemistry; Springer: Berlin/Heidelberg, Germany, 2015; pp. 95–110. ISBN 978-3-662-47739-7. [Google Scholar]
- Chapman, D.V.; Bradley, C.; Gettel, G.M.; Hatvani, I.G.; Hein, T.; Kovács, J.; Liska, I.; Oliver, D.M.; Tanos, P.; Trásy, B.; et al. Developments in Water Quality Monitoring and Management in Large River Catchments Using the Danube River as an Example. Environ. Sci. Policy 2016, 64, 141–154. [Google Scholar] [CrossRef]
- Avar, P.; Zrínyi, Z.; Maász, G.; Takátsy, A.; Lovas, S.; László, G.; Pirger, Z. β-Estradiol and Ethinyl-Estradiol Contamination in the Rivers of the Carpathian Basin. Environ. Sci. Pollut. Res. 2016, 23, 11630–11638. [Google Scholar] [CrossRef]
- Chitescu, C.L.; Kaklamanos, G.; Nicolau, A.I.; Stolker, A.A.M.L. High Sensitive Multiresidue Analysis of Pharmaceuticals and Antifungals in Surface Water Using U-HPLC-Q-Exactive Orbitrap HRMS. Application to the Danube River Basin on the Romanian Territory. Sci. Total Environ. 2015, 532, 501–511. [Google Scholar] [CrossRef]
- Nagy, A.S.; Simon, G.; Szabó, J.; Vass, I. Polycyclic Aromatic Hydrocarbons in Surface Water and Bed Sediments of the Hungarian Upper Section of the Danube River. Environ. Monit. Assess. 2013, 185, 4619–4631. [Google Scholar] [CrossRef]
- Vrana, B.; Klučárová, V.; Benická, E.; Abou-Mrad, N.; Amdany, R.; Horáková, S.; Draxler, A.; Humer, F.; Gans, O. Passive Sampling: An Effective Method for Monitoring Seasonal and Spatial Variability of Dissolved Hydrophobic Organic Contaminants and Metals in the Danube River. Environ. Pollut. 2014, 184, 101–112. [Google Scholar] [CrossRef]
- Kondor, A.C.; Jakab, G.; Vancsik, A.; Filep, T.; Szeberényi, J.; Szabó, L.; Maász, G.; Ferincz, Á.; Dobosy, P.; Szalai, Z. Occurrence of Pharmaceuticals in the Danube and Drinking Water Wells: Efficiency of Riverbank Filtration. Environ. Pollut. 2020, 265, 114893. [Google Scholar] [CrossRef]
- Seitz, W.; Winzenbacher, R. A Survey on Trace Organic Chemicals in a German Water Protection Area and the Proposal of Relevant Indicators for Anthropogenic Influences. Environ. Monit. Assess. 2017, 189, 244. [Google Scholar] [CrossRef] [PubMed]
- Petrović, M.; Škrbić, B.; Živančev, J.; Ferrando-Climent, L.; Barcelo, D. Determination of 81 Pharmaceutical Drugs by High Performance Liquid Chromatography Coupled to Mass Spectrometry with Hybrid Triple Quadrupole–Linear Ion Trap in Different Types of Water in Serbia. Sci. Total Environ. 2014, 468–469, 415–428. [Google Scholar] [CrossRef] [PubMed]
- Varga, R.; Somogyvári, I.; Eke, Z.; Torkos, K. Seasonal Monitoring of Cardiovascular and Antiulcer Agents’ Concentrations in Stream Waters Encompassing a Capital City. J. Pharm. 2013, 2013, 753928. [Google Scholar] [CrossRef] [PubMed]
- Subedi, B.; Du, B.; Chambliss, C.K.; Koschorreck, J.; Rüdel, H.; Quack, M.; Brooks, B.W.; Usenko, S. Occurrence of Pharmaceuticals and Personal Care Products in German Fish Tissue: A National Study. Environ. Sci. Technol. 2012, 46, 9047–9054. [Google Scholar] [CrossRef]
- Ilie, M.; Marinescu, F.; Ghiță, G.; Deák, G.; Tociu, C.; Matei, M.; Holban, E.; Raischi, M.; Zamfir, S.; Cirstinoiu, C. Evaluation of Emerging Contaminants in Drinking Water and Wastewater in South Romania. Int. J. Environ. Sci. 2017, 2, 108–113. [Google Scholar]
- Higley, E.; Grund, S.; Jones, P.D.; Schulze, T.; Seiler, T.-B.; Lübcke-von Varel, U.; Brack, W.; Wölz, J.; Zielke, H.; Giesy, J.P.; et al. Endocrine Disrupting, Mutagenic, and Teratogenic Effects of Upper Danube River Sediments Using Effect-Directed Analysis. Environ. Toxicol. Chem. 2012, 31, 1053–1062. [Google Scholar] [CrossRef]
- Milanović, M.; Sudji, J.; Grujic, N.; Radonic, J.; Turk-Sekulić, M.; Miloradov, M.; Milic, N. Seasonal Variations of Bisphenol A in the Danube by the Novi Sad Municipality, Serbia. J. Serbian Chem. Soc. 2015, 81, 95. [Google Scholar] [CrossRef]
- Grund, S.; Higley, E.; Schönenberger, R.; Suter, M.; Braunbeck, T.; Hecker, M.; Hollert, H. The Endocrine Disrupting Potential of Sediments from the Upper Danube River (Germany) as Revealed by in Vitro Bioassays and Chemical Analysis. Environ. Sci. Pollut. Res. Int. 2011, 18, 446–460. [Google Scholar] [CrossRef]
- Ene, A.; Denga, Y.; Bogdevich, O.; Zubcov, E. (Eds.) Atlas of Maps; Tehnopress: Iasi, Romania, 2015; Available online: https://www.researchgate.net/publication/305317824_Atlas_of_Maps (accessed on 10 June 2021)ISBN 978-606-687-235-5.
- Milić, N.; Sudji, J.; Milanović, M.; Grujić Letić, N.; Radonić, J.; Sekulić, M.T.; Vojinović Miloradov, M.; Mihajlović, I. The determination of bisphenol a in the Danube in the vicinity of Novi-Sad, Serbia. Ann. West Univ. Timis. Ser. Chem. 2012, 22, 7–12. [Google Scholar]
- László, F. Pollution by Heavy Metals in the Danube River Basin. In The Danube River Basin; Liska, I., Ed.; The Handbook of Environmental Chemistry; Springer: Berlin/Heidelberg, Germany, 2015; pp. 85–93. ISBN 978-3-662-47739-7. [Google Scholar]
- Woitke, P.; Wellmitz, J.; Helm, D.; Kube, P.; Lepom, P.; Litheraty, P. Analysis and assessment of heavy metal pollution in suspended solids and sediments of the river Danube. Chemosphere 2003, 51, 633–642. [Google Scholar] [CrossRef]
- Diamanti, K.S.; Alygizakis, N.A.; Nika, M.-C.; Oswaldova, M.; Oswald, P.; Thomaidis, N.S.; Slobodnik, J. Assessment of the Chemical Pollution Status of the Dniester River Basin by Wide-Scope Target and Suspect Screening Using Mass Spectrometric Techniques. Anal. Bioanal. Chem. 2020, 412, 4893–4907. [Google Scholar] [CrossRef]
- Joint Danube Survey 4 (JDS4) Scientific Report. Liška, I.; Wagner, F.; Sengl, M.; Deutsch, K.; Slobodník, J.; Paunović, M. (Eds.) ICPDR—International Commission for the Protection of the Danube River: Vienna, Austria, 2021; ISBN 978-3-200-07450-7. [Google Scholar]
- Abdulrazaq, Y.; Abdulsalam, A.; Rotimi, A.L.; Abdulbasit, A.A.; Clifford, O.; Abdulsalam, O.A.; Racheal, O.N.; Joy, A.A.; Victor, F.O.; Johannes, Z.M.; et al. Classification, Potential Routes and Risk of Emerging Pollutants/Contaminant; IntechOpen: London, UK, 2020; ISBN 978-1-83962-419-3. [Google Scholar]
- Bilal, M.; Adeel, M.; Rasheed, T.; Zhao, Y.; Iqbal, H.M.N. Emerging Contaminants of High Concern and Their Enzyme-Assisted Biodegradation—A Review. Environ. Int. 2019, 124, 336–353. [Google Scholar] [CrossRef]
- Gogoi, A.; Mazumder, P.; Tyagi, V.K.; Tushara Chaminda, G.G.; An, A.K.; Kumar, M. Occurrence and Fate of Emerging Contaminants in Water Environment: A Review. Groundw. Sustain. Dev. 2018, 6, 169–180. [Google Scholar] [CrossRef]
- Caldwell, D.J.; Mastrocco, F.; Margiotta-Casaluci, L.; Brooks, B.W. An Integrated Approach for Prioritizing Pharmaceuticals Found in the Environment for Risk Assessment, Monitoring and Advanced Research. Chemosphere 2014, 115, 4–12. [Google Scholar] [CrossRef]
- Rudén, C.; Hansson, S.O. Registration, Evaluation, and Authorization of Chemicals (REACH) Is but the First Step–How Far Will It Take Us? Six Further Steps to Improve the European Chemicals Legislation. Environ. Health Perspect. 2010, 118, 6–10. [Google Scholar] [CrossRef]
- Dulio, V.; Slobodnik, J. In Response: The NORMAN Perspectives on Prioritization of Emerging Pollutants. Environ. Toxicol. Chem. 2015, 34, 2183–2185. [Google Scholar] [CrossRef] [PubMed]
- Anna, S.; Sofia, B.; Christina, R.; Magnus, B. The Dilemma in Prioritizing Chemicals for Environmental Analysis: Known versus Unknown Hazards. Environ. Sci. Process. Impacts 2016, 18, 1042–1049. [Google Scholar] [CrossRef] [PubMed]
- Directive 2013/39/EU of the European Parliament and of the Council of 12 August 2013 Amending Directives 2000/60/EC and 2008/105/EC as Regards Priority Substances in the Field of Water Policy; OJEU: Aberdeen, UK, 2013.
- Commission Implementing Decision (EU) 2018/840—Of 5 June 2018—Establishing a Watch List of Substances for Union-Wide Monitoring in the Field of Water Policy Pursuant to Directive 2008/105/EC of the European Parliament and of the Council and Repealing Commission Implementing Decision (EU); L 495; OJEU: Aberdeen, UK, 2015.
- Commission Implementing Decision (EU) 2020/1161 of 4 August 2020 Establishing a Watch List of Substances for Union-Wide Monitoring in the Field of Water Policy Pursuant to Directive 2008/105/EC of the European Parliament and of the Council (Notified under Document Number C(2020) 5205); L 257; OJEU: Aberdeen, UK, 2020.
- Summary of the Final Report Joint Danube Survey 1; ICPDR—International Commission for the Protection of the Danube River: Vienna, Austria, 2002.
- Radović, T.; Grujić, S.; Petković, A.; Dimkić, M.; Laušević, M. Determination of Pharmaceuticals and Pesticides in River Sediments and Corresponding Surface and Ground Water in the Danube River and Tributaries in Serbia. Environ. Monit. Assess. 2015, 187, 4092. [Google Scholar] [CrossRef]
- Patel, M.; Kumar, R.; Kishor, K.; Mlsna, T.; Pittman, C.U.; Modan, D. Pharmaceuticals of Emerging Concern in Aquatic Systems: Chemistry, Occurrence, Effects, and Removal Methods. Chem. Rev. 2019, 119, 3510–3673. [Google Scholar] [CrossRef]
- Himmelsbach, M.; Klampfl, C.W.; Buchberger, W. Development of an Analytical Method for the Determination of Antidepressants in Water Samples by Capillary Electrophoresis with Electrospray Ionization Mass Spectrometric Detection. J. Sep. Sci. 2005, 28, 1735–1741. [Google Scholar] [CrossRef] [PubMed]
- Fenz, R.; Blaschke, A.P.; Clara, M.; Kroiss, H.; Mascher, D.; Zessner, M. Monitoring of Carbamazepine Concentrations in Wastewater and Groundwater to Quantify Sewer Leakage. Water Sci. Technol. 2005, 52, 205–213. [Google Scholar] [CrossRef]
- Joint Danube Survey 2, Final Scientific Report; Liška, I., Wagner, F., Eds.; ICPDR—International Commission for the Protection of the Danube River: Vienna, Austria, 2008. [Google Scholar]
- Matić Bujagić, I.; Grujić, S.; Laušević, M.; Hofmann, T.; Micić, V. Emerging Contaminants in Sediment Core from the Iron Gate I Reservoir on the Danube River. Sci. Total Environ. 2019, 662, 77–87. [Google Scholar] [CrossRef]
- Loos, R.; Tavazzi, S.; Mariani, G.; Suurkuusk, G.; Paracchini, B.; Umlauf, G. Analysis of Emerging Organic Contaminants in Water, Fish and Suspended Particulate Matter (SPM) in the Joint Danube Survey Using Solid-Phase Extraction Followed by UHPLC-MS-MS and GC-MS Analysis. Sci. Total Environ. 2017, 607–608, 1201–1212. [Google Scholar] [CrossRef] [PubMed]
- Letić, N.N.G.; Milanović, M.L.; Milić, N.B.; Miloradov, M.B.V.; Radonić, J.R.; Mihajlović, I.J.; Sekulić, M.M.T. Determination of Emerging Substances in the Danube and Potential Risk Evaluation. CLEAN—Soil Air Water 2015, 43, 731–738. [Google Scholar] [CrossRef]
- Milić, N.; Milanović, M.; Radonić, J.; Turk Sekulić, M.; Mandić, A.; Orčić, D.; Mišan, A.; Milovanović, I.; Grujić Letić, N.; Vojinović Miloradov, M. The Occurrence of Selected Xenobiotics in the Danube River via LC-MS/MS. Environ. Sci. Pollut. Res. 2018, 25, 11074–11083. [Google Scholar] [CrossRef] [PubMed]
- Radović, T.; Grujić, S.; Dujaković, N.; Radišić, M.; Vasiljević, T.; Petković, A.; Boreli-Zdravković, Đ.; Dimkić, M.; Laušević, M. Pharmaceutical Residues in the Danube River Basin in Serbia—A Two-Year Survey. Water Sci. Technol. 2012, 66, 659–665. [Google Scholar] [CrossRef]
- Loos, R.; Locoro, G.; Contini, S. Occurrence of Polar Organic Contaminants in the Dissolved Water Phase of the Danube River and Its Major Tributaries Using SPE-LC-MS2 Analysis. Water Res. 2010, 44, 2325–2335. [Google Scholar] [CrossRef]
- Petre, J.; Iancu, V.I.; Galaon, T.; Simion, M.; Niculescu, M.; Vasile, G.G.; Pascu, L.F.; Lehr, C.B.; Cruceru, L.; Calinescu, S.; et al. Occurrence of pharmaceuticals and disinfectants in the dissolved water phase of the Danube river and three major tributaries from Romania. Romanian J. Ecol. Environ. Chem. 2019, 1, 55–65. [Google Scholar] [CrossRef]
- Burcea, A.; Boeraş, I.; Mihuţ, C.-M.; Bănăduc, D.; Matei, C.; Curtean-Bănăduc, A. Adding the Mureş River Basin (Transylvania, Romania) to the List of Hotspots with High Contamination with Pharmaceuticals. Sustainability 2020, 12, 10197. [Google Scholar] [CrossRef]
- Chitescu, C.L.; Nicolau, A. Preliminary Survey of Pharmaceutical Residues in Some Important Romanian Rivers. Toxicol. Environ. Chem. 2015, 96, 1333–1345. [Google Scholar] [CrossRef]
- Moldovan, Z.; Marincas, O.; Povar, I.; Lupascu, T.; Longree, P.; Rota, J.S.; Singer, H.; Alder, A.C. Environmental Exposure of Anthropogenic Micropollutants in the Prut River at the Romanian-Moldavian Border: A Snapshot in the Lower Danube River Basin. Environ. Sci. Pollut. Res. Int. 2018, 25, 31040–31050. [Google Scholar] [CrossRef] [PubMed]
- Fekadu, S.; Alemayehu, E.; Dewil, R.; Van der Bruggen, B. Pharmaceuticals in Freshwater Aquatic Environments: A Comparison of the African and European Challenge. Sci. Total Environ. 2019, 654, 324–337. [Google Scholar] [CrossRef] [PubMed]
- Helenkár, A.; Sebők, Á.; Záray, G.; Molnár-Perl, I.; Vasanits-Zsigrai, A. The Role of the Acquisition Methods in the Analysis of the Non-Steroidal Anti-Inflammatory Drugs in Danube River by Gas Chromatography—Mass Spectrometry. Talanta 2010, 82, 600–607. [Google Scholar] [CrossRef] [PubMed]
- Ivešić, M.; Krivohlavek, A.; Žuntar, I.; Tolić, S.; Šikić, S.; Musić, V.; Pavlić, I.; Bursik, A.; Galić, N. Monitoring of Selected Pharmaceuticals in Surface Waters of Croatia. Environ. Sci. Pollut. Res. 2017, 24, 23389–23400. [Google Scholar] [CrossRef]
- Faust, M.; Backhaus, T.; Altenburger, R.; Dulio, V.; van Gils, J.; Ginebreda, A.; Kortenkamp, A.; Munthe, J.; Posthuma, L.; Slobodnik, J.; et al. Prioritisation of Water Pollutants: The EU Project SOLUTIONS Proposes a Methodological Framework for the Integration of Mixture Risk Assessments into Prioritisation Procedures under the European Water Framework Directive. Environ. Sci. Eur. 2019, 31, 66. [Google Scholar] [CrossRef]
- Joint Danube Survey 3 (JDS3) Scientific Report; Liška, I., Wagner, F., Sengl, M., Deutsch, K., Slobodník, J., Eds.; ICPDR—International Commission for the Protection of the Danube River: Vienna, Austria, 2015. [Google Scholar]
- Graca, B.; Staniszewska, M.; Zakrzewska, D. Reconstruction of the pollution history of alkylphenols (4-tert-octylphenol, 4-nonylphenol) in the Baltic Sea. Environ. Sci. Pollut. Res. 2016, 23, 11598–11610. [Google Scholar] [CrossRef]
- Emerging Substances | NORMAN. Available online: https://www.norman-network.net/?q=node/19 (accessed on 8 July 2021).
- Čelić, M.; Škrbić, B.D.; Insa, S.; Živančev, J.; Gros, M.; Petrović, M. Occurrence and Assessment of Environmental Risks of Endocrine Disrupting Compounds in Drinking, Surface and Wastewaters in Serbia. Environ. Pollut. 2020, 262, 114344. [Google Scholar] [CrossRef]
- Kuch, H.M.; Ballschmiter, K. Determination of Endocrine-Disrupting Phenolic Compounds and Estrogens in Surface and Drinking Water by HRGC-(NCI)-MS in the Picogram per Liter Range. Environ. Sci. Technol. 2001, 35, 3201–3206. [Google Scholar] [CrossRef]
- Steroid Estrogens Profiles along River Stretches Arising from Sewage Treatment Works Discharges | Environmental Science & Technology. Available online: https://pubs.acs.org/doi/10.1021/es0202107 (accessed on 8 July 2021).
- Dorabawila, N.; Gupta, G. Endocrine Disrupter—Estradiol—in Chesapeake Bay Tributaries. J. Hazard. Mater. 2005, 120, 67–71. [Google Scholar] [CrossRef]
- Antonijevic, M.; Arsovic, M.; Cáslavský, J.; Cvetkovic, V.; Dabic, P.; Franko, M.; Ilic, G.; Ivanovic, M.; Ivanovic, N.; Kosovac, M.; et al. Actual Contamination of the Danube and Sava Rivers at Belgrade (2013). J. Serbian Chem. Soc. 2014, 79, 1169–1184. [Google Scholar] [CrossRef]
- Galaon, T.; Petre, J.; Iancu, V.I.; Cruceru, L.; Vasile, G.G.; Pascu, L.F.; Lehr, C.B. Detection of Estrogen Hormones in Danube River and Tributaries Using Liquid Chromatography-Mass Spectrometry. Rev. Chem. 2016, 67, 1474–1478. [Google Scholar]
- Chiriac, F.L.; Paun, I.; Pirvu, F.; Pascu, L.F.; Galaon, T. Occurrence and Fate of Bisphenol A and Its Congeners in Two Wastewater Treatment Plants and Receiving Surface Waters in Romania. Environ. Toxicol. Chem. 2021, 40, 435–446. [Google Scholar] [CrossRef] [PubMed]
- Chiriac, F.L.; Paun, I.; Iancu, V.-I.; Pirvu, F.; Niculescu, M.; Galaon, T. Occurrence of Phenolic Endocrine Disruptors in Danube Delta, Romania. Rev. Chim. 2020, 71, 316–324. [Google Scholar] [CrossRef]
- Chiriac, F.L.; Pirvu, F.; Paun, I. Investigation of Endocrine Disruptor Pollutants and Their Metabolites along the Romanian Black Sea Coast: Occurrence, Distribution and Risk Assessment. Environ. Toxicol. Pharmacol. 2021, 86, 103673. [Google Scholar] [CrossRef] [PubMed]
- Pignotti, E.; Farré, M.; Barceló, D.; Dinelli, E. Occurrence and Distribution of Six Selected Endocrine Disrupting Compounds in Surface- and Groundwaters of the Romagna Area (North Italy). Environ. Sci. Pollut. Res. 2017, 24, 21153–21167. [Google Scholar] [CrossRef]
- Anđelić, I.; Roje-Busatto, R.; Ujević, I.; Vuletić, N.; Matijević, S. Distribution of Bisphenol A in Sediment and Suspended Matter and Its Possible Impact on Marine Life in Kaštela Bay, Adriatic Sea, Croatia. J. Mar. Sci. Eng. 2020, 8, 480. [Google Scholar] [CrossRef]
- Directive 2006/118/EC of the European Parliament and of the Council of 12 December 2006 on the Protection of Groundwater against Pollution and Deterioration; L 327; OJEU: Aberdeen, UK, 2006.
- Council Directive 98/83/EC of 3 November 1998 on the Quality of Water Intended for Human Consumption; L 330; OJEU: Aberdeen, UK, 1998.
- Directive 2000/60/EC of the European Parliament and of the Council of 23 October 2000 Establishing a Framework for Community Action in the Field of Water Policy; L 327; OJEU: Aberdeen, UK, 2000.
- Commission Implementing Decision (EU) 2015/495 of 20 March 2015 Establishing a Watch List of Substances for Union-Wide Monitoring in the Field of Water Policy Pursuant to Directive 2008/105/EC of the European Parliament and of the Council (Notified under Document C(2015) 1756); L 78; OJEU: Aberdeen, UK, 2015.
- Ccanccapa, A.; Masiá, A.; Navarro-Ortega, A.; Picó, Y.; Barceló, D. Pesticides in the Ebro River Basin: Occurrence and Risk Assessment. Environ. Pollut. 2016, 211, 414–424. [Google Scholar] [CrossRef]
- Antić, N.; Radišić, M.; Radović, T.; Vasiljević, T.; Grujić, S.; Petković, A.; Dimkić, M.; Laušević, M. Pesticide Residues in the Danube River Basin in Serbia—A Survey during 2009–2011. CLEAN—Soil Air Water 2015, 43, 197–204. [Google Scholar] [CrossRef]
- Regulation (EC) No 850/2004 of the European Parliament and of the Council of 29 April 2004 on Persistent Organic Pollutants and Amending Directive 79/117/EEC; L 158; OJEU: Aberdeen, UK, 2004.
- Stockholm Convention—Home Page. Available online: http://chm.pops.int/ (accessed on 13 July 2021).
- Directive 2008/105/EC of the European Parliament and of the Council of 16 December 2008 on Environmental Quality Standards in the Field of Water Policy, Amending and Subsequently Repealing Council Directives 82/176/EEC, 83/513/EEC, 84/156/EEC, 84/491/EEC, 86/280/EEC and Amending Directive 2000/60/EC of the European Parliament and of the Council; L 348; OJEU: Aberdeen, UK, 2008.
- U.S. EPA. Provisional Guidance for Quantitative Risk Assessment of Polycyclic Aromatic Hydrocarbons (PAH). Available online: https://cfpub.epa.gov/ncea/risk/recordisplay.cfm?deid=49732 (accessed on 17 July 2021).
- Commission Regulation (EU) No 1259/2011 of 2 December 2011 Amending Regulation (EC) No 1881/2006 as Regards Maximum Levels for Dioxins, Dioxin-like PCBs and Non Dioxin-like PCBs in Foodstuffs Text with EEA Relevance; L 320/18; OJEU: Aberdeen, UK, 2011.
- Stoichev, T.; Makedonski, L.; Trifonova, T.; Stancheva, M.; Ribarova, F. DDT in Fish from the Bulgarian Region of the Black Sea. Chem. Ecol. 2007, 23, 191–200. [Google Scholar] [CrossRef]
- Dubovina, M.; Krčmar, D.; Grba, N.; Watson, M.A.; Rađenović, D.; Tomašević-Pilipović, D.; Dalmacija, B. Distribution and Ecological Risk Assessment of Organic and Inorganic Pollutants in the Sediments of the Transnational Begej Canal (Serbia-Romania). Environ. Pollut. 2018, 236, 773–784. [Google Scholar] [CrossRef]
- Radu, M.; Ionescu, P.; Alexandru Anton, I.; Deak, G.; Marcu, E.; Ciobotaru, I.-E.; Diacu, E.; Pipirigeanu, M. Assessment of Contamination with Hazardous Substances in Surface Sediments in the Lower Danube River. Technium 2020, 1, 37–44. [Google Scholar] [CrossRef]
- Stancheva, M.; Makedonski, L.; Georgieva, S. Organochlorine Pesticides in Fish from Bulgarian Region of Black Sea. Arch. Balk. Med. Union 2011, 46, 209. [Google Scholar]
- Nagy, A.S.; Szabó, J.; Vass, I. Occurrence and Distribution of Polycyclic Aromatic Hydrocarbons in Surface Water and Sediments of the Danube River and Its Tributaries, Hungary. J. Environ. Sci. Health Part A Tox. Hazard. Subst. Environ. Eng. 2014, 49, 1134–1141. [Google Scholar] [CrossRef]
- Patrolecco, L.; Ademollo, N.; Capri, S.; Pagnotta, R.; Polesello, S. Occurrence of Priority Hazardous PAHs in Water, Suspended Particulate Matter, Sediment and Common Eels (Anguilla Anguilla) in the Urban Stretch of the River Tiber (Italy). Chemosphere 2010, 81, 1386–1392. [Google Scholar] [CrossRef]
- Kanzari, F.; Syakti, A.D.; Asia, L.; Malleret, L.; Piram, A.; Mille, G.; Doumenq, P. Distributions and Sources of Persistent Organic Pollutants (Aliphatic Hydrocarbons, PAHs, PCBs and Pesticides) in Surface Sediments of an Industrialized Urban River (Huveaune), France. Sci. Total Environ. 2014, 478, 141–151. [Google Scholar] [CrossRef] [PubMed]
- Liu, Y.; Beckingham, B.; Ruegner, H.; Li, Z.; Ma, L.; Schwientek, M.; Xie, H.; Zhao, J.; Grathwohl, P. Comparison of Sedimentary PAHs in the Rivers of Ammer (Germany) and Liangtan (China): Differences between Early- and Newly-Industrialized Countries. Environ. Sci. Technol. 2013, 47, 701–709. [Google Scholar] [CrossRef] [PubMed]
- Pérez-Fernández, B.; Viñas, L.; Franco, M.Á.; Bargiela, J. PAHs in the Ría de Arousa (NW Spain): A Consideration of PAHs Sources and Abundance. Mar. Pollut. Bull. 2015, 95, 155–165. [Google Scholar] [CrossRef] [PubMed]
- Vosniakos, F.; Pascu, L.; Petre, J.; Cruceru, L.; Vasile, G.; Iancu, V.; Cristina, D.; Niculescu, M.; Niculae, A.; Nicolau, M.; et al. The temporal and spatial monitoring of water and sediment physical-chemical quality from Saint Feorge branch in the period February 2009–February 2011. Fresenius Environ. Bull. 2012, 21, 13. [Google Scholar]
- Strbac, S.; Stojic, N.; Pucarevic, M.; Bajic, B. Organochlorine Pesticides in the Tisza River (Serbia): Distribution and Risk Assessment. Zb. Matice Srp. Prir. Nauke 2019, 113–122. [Google Scholar] [CrossRef]
- Brboric, M.; Radonic, J.; Miloradov, M.; Pap, S.; Turk Sekulić, M. Organochlorine Contamination in Sediments Collected from a Rural-, Urban- and Industrial-Impacted Aquatic System (Danube, Serbia). Holist. Approach Environ. 2020, 10, 41–47. [Google Scholar] [CrossRef]
- Škrbić, B.D.; Kadokami, K.; Antić, I.; Jovanović, G. Micro-Pollutants in Sediment Samples in the Middle Danube Region, Serbia: Occurrence and Risk Assessment. Environ. Sci. Pollut. Res. 2018, 25, 260–273. [Google Scholar] [CrossRef]
- Beldean-Galea, M.; Mihaiescu, R.; Arghius, V.; Croitoru, A.; Horvath, C.; Coman, V. Occurrence and Sources of Polycyclic Aromatic Hydrocarbons in the Tisza River and Its Romanian Tributaries. Water. Air. Soil Pollut. 2016, 227, 377. [Google Scholar] [CrossRef]
- Micić, V.; Kruge, M.A.; Hofmann, T. Variations of Common Riverine Contaminants in Reservoir Sediments. Sci. Total Environ. 2013, 458–460, 90–100. [Google Scholar] [CrossRef]
- Ene, A.; Bogdevich, O.; Sion, A. Levels and Distribution of Organochlorine Pesticides (OCPs) and Polycyclic Aromatic Hydrocarbons (PAHs) in Topsoils from SE Romania. Sci. Total Environ. 2012, 439, 76–86. [Google Scholar] [CrossRef] [PubMed]
- Ciornea, V.; Ivanova, A.; Elena, Z.; Ene, A. Determination of Some Organochlorine Pesticides in the Waters of the Prut River. Ann. Univ. Dunarea Galati Fascicle II 2016, 8, 81–85. [Google Scholar]
- Ivanova, A.; Wiberg, K.; Ahrens, L.; Zubcov, E.; Dahlberg, A.-K. Spatial Distribution of Legacy Pesticides in River Sediment from the Republic of Moldova. Chemosphere 2021, 279, 130923. [Google Scholar] [CrossRef]
- Bogdevich, O.; Ene, A.; Cadocinicov, O.; Culighin, E. The analysis of old pesticides and PAHs pollution sources in Low Danube region. J. Int. Sci. Publ. Ecol. Saf. 2013, 7, 233–243. [Google Scholar]
- Ţigănuş, D.; Coatu, V.; Lazăr, L.; Oros, A.; Spînu, A.D. Identification of the sources of polycyclic aromatic hydrocarbons in sediments from the Romanian Black Sea sector. Cercet. Mar. 2013, 43, 187–196. [Google Scholar]
- State of the Environment of the Black Sea 2009-2014/5; Commission on the Protection of the Black Sea Against Pollution: Istabul, Turkey, 2019; ISBN 978-605-84837-0-5.
- Monchanin, C.; Devaud, J.M.; Barron, A.B.; Lihoreau, M. Current permissible levels of metal pollutants harm terrestrial invertebrates. Sci.Total Environ. 2021, 779, 146398. [Google Scholar] [CrossRef]
- Ali, H.; Khan, E.; Ilahi, I. Environmental Chemistry and Ecotoxicology of Hazardous Heavy Metals: Environmental Persistence, Toxicity, and Bioaccumulation. J. Chem. 2019, 2019, e6730305. [Google Scholar] [CrossRef]
- Sakan, S.M. Trace Element Study In∼Tisa River and Danube Alluvial Sediment in Serbia. Int. J. Sediment Res. 2013, 28, 12. [Google Scholar] [CrossRef]
- Iordache, A.M.; Nechita, C.; Pluhacek, T.; Iordache, M.; Zgavarogea, R.; Ionete, R.E. Past and Present Anthropic Environmental Stress Reflect High Susceptibility of Natural Freshwater Ecosystems in Romania. Environ. Pollut. 2020, 267, 115505. [Google Scholar] [CrossRef]
- Subotić, S. Heavy Metal and Trace Element Bioaccumulation in Target Tissues of Four Edible Fish Species from the Danube River (Serbia). Ecotoxicol. Environ. Saf. 2013, 98, 196–202. [Google Scholar] [CrossRef]
- Milošković, A.; Dojčinović, B.; Kovačević, S.; Radojković, N.; Radenković, M.; Milošević, D.; Simić, V. Spatial Monitoring of Heavy Metals in the Inland Waters of Serbia: A Multispecies Approach Based on Commercial Fish. Environ. Sci. Pollut. Res. 2016, 23, 9918–9933. [Google Scholar] [CrossRef]
- Milanov, Đ.; Krstić, M.; Markovic, R.; Jovanovic, D.; Baltic, M.; Ćirić, J.; Jovetic, M.; Baltić, Ž. Analysis of Heavy Metals Concentration in Tissues of Three Different Fish Species Included in Human Diet from Danube River. Acta Vet. 2016, 66, 89–102. [Google Scholar] [CrossRef]
- Lavrova, S.; Georgieva, S.; Gartsiyanova, K. Assessment of the metal concentration in Yantra river within an area with active anthropogenic influence. For. Ideas 2020, 26, 326–340. [Google Scholar]
- Pantelica, A.; Ene, A.; Georgescu, I. Instrumental Neutron Activation Analysis of Some Fish Species from Danube River in Romania. Microchem. J. 2012, 103, 142–147. [Google Scholar] [CrossRef]
- Ilie, M.; Marinescu, F.; Ghita, G.; Deak, G.; Tanase, S.; Raischi, M. Assessment of Heavy Metal in Water and Sediments of the Danube River. J. Environ. Prot. Ecol. 2014, 15, 825. [Google Scholar]
- Simionov, I.-A.; Cristea, V.; Petrea, S.M.; Mogodan Antache, A.; Aurelia, N.; Strungaru, S.-A.; Ene, A.; Sarpe, D. Heavy metal evaluation in the lower sector of Danube river. Sci. Pap. Ser. E Land Reclam. Earth Obs. Surv. Environ. Eng. 2020, 11, 11–16. [Google Scholar]
- Bravo, A.; Loizeau, J.-L.; Dranguet, P.; Makri, S.; Björn, E.; Ungureanu, G.; Slaveykova, V.I.; Cosio, C. Persistent Hg Contamination and Occurrence of Hg-Methylating Transcript (HgcA) Downstream of a Chlor-Alkali Plant in the Olt River (Romania). Environ. Sci. Pollut. Res. 2016, 23, 10529–10541. [Google Scholar] [CrossRef]
- Assessment of Heavy Metals Pollution in Sediments from Reservoirs of the Olt River as Tool for Environmental Risk Management. Rev. Chim. 2020, 70, 4153–4162. [CrossRef]
- Ioniţǎ, C.; Magdalena, M.; Morosan, E. Analysis of Heavy Metals and Organic Pollutants from Some Danube River Fishes. Farmacia 2014, 62, 299–305. [Google Scholar]
- Matache, M.L.; Marin, C.; Rozylowicz, L.; Tudorache, A. Plants Accumulating Heavy Metals in the Danube River Wetlands. J. Environ. Health Sci. Eng. 2013, 11, 39. [Google Scholar] [CrossRef] [PubMed]
- Calmuc, V.A.; Calmuc, M.; Arseni, M.; Topa, C.M.; Timofti, M.; Burada, A.; Iticescu, C.; Georgescu, L.P. Assessment of Heavy Metal Pollution Levels in Sediments and of Ecological Risk by Quality Indices, Applying a Case Study: The Lower Danube River, Romania. Water 2021, 13, 1801. [Google Scholar] [CrossRef]
- Begy, R.-C. Sediment Dynamics and Heavy Metal Pollution History of the Cruhlig Lake (Danube Delta, Romania). J. Environ. Radioact. 2016, 153, 167–175. [Google Scholar] [CrossRef]
- Gati, G.; Pop, C.; Brudaşcă, F.; Gurzău, A.E.; Spînu, M. The Ecological Risk of Heavy Metals in Sediment from the Danube Delta. Ecotoxicology 2016, 25, 688–696. [Google Scholar] [CrossRef]
- Burada, A.; Topa, M.-C.; Georgescu, L.; Teodorof, L.; Nastase, C.; Seceleanu-Odor, D.; Negrea, B.; Iticescu, C. Heavy Metals Accumulation in Plankton and Water of Four Aquatic Complexes from Danube Delta Area. AACL Bioflux 2014, 77, 301–310. [Google Scholar]
- Burada, A.; Topa, M.-C.; Georgescu, L.; Teodorof, L.; Nastase, C.; Seceleanu-Odor, D.; Iticescu, C. Heavy Metals Environment Accumulation in Somova—Parches Aquatic Complex from the Danube Delta Area. Rev. Chim.-Buchar.-Orig. Ed. 2015, 66, 48–54. [Google Scholar]
- Nastase, C.; Teodorof, L.; Burada, A.; Seceleanu-Odor, D.; Tiganus, M.; Tudor, I.; Ibram, O.; Spiridon, C.; Năstase, A.; George, T.; et al. Danube Delta Biosphere Reserve—Ten Years of Toxic Substances Monitoring. Ann. Univ. Dunarea Galati Fascicle II—Math. Phys. Theor. Mech. 2017, 40, 55–60. [Google Scholar]
- Strungaru, S.-A.; Nicoara, M.; Teodosiu, C.; Baltag, E.; Ciobanu, C.; Plavan, G. Patterns of Toxic Metals Bioaccumulation in a Cross-Border Freshwater Reservoir. Chemosphere 2018, 207, 192–202. [Google Scholar] [CrossRef]
- Simionov, I.-A.; Cristea, D.S.; Petrea, S.-M.; Mogodan, A.; Nicoara, M.; Plavan, G.; Baltag, E.S.; Jijie, R.; Strungaru, S.-A. Preliminary Investigation of Lower Danube Pollution Caused by Potentially Toxic Metals. Chemosphere 2021, 264, 128496. [Google Scholar] [CrossRef]
- Trifan, A.; Breabăn, I.G.; Sava, D.; Bucur, L.; Toma, C.-C.; Miron, A. Heavy metal content in macroalgae from Roumanian Black Sea. Rev. Romaine Chim. 2015, 60, 915–920. [Google Scholar]
- Jitar, O. Bioaccumulation of Heavy Metals in Marine Organisms from the Romanian Sector of the Black Sea. New Biotechnol. 2015, 32, 10. [Google Scholar] [CrossRef] [PubMed]
- Ivanova, K.; Stancheva, M.; Panayotova, V. Determination of Heavy Metals in Black Sea Mytilus Galloprovincialis and Rapana Venosa. Scr. Sci. Med. 2012, 44, 27–30. [Google Scholar] [CrossRef][Green Version]
- Zubcov, E.; Zubcov, N.; Ene, A.; Biletchi, L. Assessment of Copper and Zinc Levels in Fish from Freshwater Ecosystems of Moldova. Environ. Sci. Pollut. Res. Int. 2012, 19, 2238–2247. [Google Scholar] [CrossRef] [PubMed]
- ISO 5667-3:2018 Water Quality—Sampling—Part 3: Preservation and Handling of Water Samples. Available online: https://www.iso.org/cms/render/live/en/sites/isoorg/contents/data/standard/07/23/72370.html (accessed on 11 August 2021).
- ISO 5667-13:2011 Water Quality—Sampling—Part 13: Guidance on Sampling of Sludges. Available online: https://www.iso.org/cms/render/live/en/sites/isoorg/contents/data/standard/04/54/45450.html (accessed on 11 August 2021).
- ISO 15587-1:2002 Water Quality—Digestion for the Determination of Selected Elements in Water—Part 1: Aqua Regia Digestion. Available online: https://www.iso.org/cms/render/live/en/sites/isoorg/contents/data/standard/03/13/31354.html (accessed on 11 August 2021).
- ISO 15587-2:2002 Water Quality—Digestion for the Determination of Selected Elements in Water—Part 2: Nitric acid Digestion. Available online: https://www.iso.org/cms/render/live/en/sites/isoorg/contents/data/standard/03/13/31355.html (accessed on 11 August 2021).
- ISO 17294-2:2016 Water Quality—Application of Inductively Coupled Plasma Mass Spectrometry (ICP-MS). Available online: https://www.iso.org/cms/render/live/en/sites/isoorg/contents/data/standard/06/29/62962.html (accessed on 11 August 2021).
- ISO 11047:1998 Soil Quality—Determination of Cadmium, Chromium, Cobalt, Copper, Lead, Manganese, Nickel and Zinc—Flame and Electrothermal Atomic Absorption Spectrometric Methods. Available online: https://www.iso.org/cms/render/live/en/sites/isoorg/contents/data/standard/02/40/24010.html (accessed on 11 August 2021).
- Simionov, I.-A.; Cristea, V.; Petrea, S.M.; Sarbu, E.; Coada, M.T.; Cristea, D.S. The Presence of Heavy Metals in Fish Meat from Danube River: An Overview. AACL Bioflux. 2016, 9, 12. [Google Scholar]
- Order MEWM no 161/2006 of Romanian Ministry of Environment and Water Management regarding Norms for Surface Water Classification in Order to Establish Ecological State of Water Bodies, In Romanian Official Monitor no. 511 (Published in 13 June 2006), Bucharest. Available online: http://www.legex.ro/Ordin-161-2006-71706.aspx (accessed on 12 August 2021).
- Astatkie, H.; Ambelu, A.; Mengistie, E. Contamination of Stream Sediment With Heavy Metals in the Awetu Watershed of Southwestern Ethiopia. Front. Earth Sci. 2021, 9, 609. [Google Scholar] [CrossRef]
- Protano, C.; Zinnà, L.; Giampaoli, S.; Spica, V.R.; Chiavarini, S.; Vitali, M. Heavy Metal Pollution and Potential Ecological Risks in Rivers: A Case Study from Southern Italy. Bull. Environ. Contam. Toxicol. 2014, 92, 75–80. [Google Scholar] [CrossRef] [PubMed]
- García-Pereira, F.J.; García Giménez, R.; Vigil de la Villa, R.; Procopio, J.R. Heavy Metal Fractionation in Sediments from the Jarama River (Central Spain). Environ. Earth Sci. 2015, 73, 2385–2396. [Google Scholar] [CrossRef]
- Manzetti, S. Heavy Metal Pollution in the Baltic Sea, from the North European Coast to the Baltic States, Finland and the Swedish Coastline to Norway. Fjordforsk AS Tech. Rep. 2020, 6, 90. [Google Scholar] [CrossRef]
- Spagnoli, F.; De Marco, R.; Dinelli, E.; Frapiccini, E.; Frontalini, F.; Giordano, P. Sources and Metal Pollution of Sediments from a Coastal Area of the Central Western Adriatic Sea (Southern Marche Region, Italy). Appl. Sci. 2021, 11, 1118. [Google Scholar] [CrossRef]
- Teodorof, L.; Burada, A.; Despina, C.; Odor, D.S.; Spiridon, C.; Țigănuș, M.; Tudor, M.I.; Tudor, M.; Ene, A.; Zubcov, E.; et al. Sediments Quality Assessment in Terms of Single and Integrated Indices from Romanian MONITOX Network (2019–2020). Ann. ”Dunarea Jos” Univ. Galati Fascicle II Math. Phys. Theor. Mech. 2020, 43, 175–183. [Google Scholar] [CrossRef]
- Kirschner, A.K.T.; Reischer, G.H.; Jakwerth, S.; Savio, D.; Ixenmaier, S.; Toth, E.; Sommer, R.; Mach, R.L.; Linke, R.; Eiler, A.; et al. Multiparametric Monitoring of Microbial Faecal Pollution Reveals the Dominance of Human Contamination along the Whole Danube River. Water Res. 2017, 124, 543–555. [Google Scholar] [CrossRef]
- Kavka, G.G.; Kasimir, G.D.; Farnleitner, A.H. Microbiological Water Quality of the River Danube (km 2581–km 15): Longitudinal Variation of Pollution as Determined by Standard Parameters; Austrian Committee Danube Research/IAD: Vienna, Austria, 2006; pp. 415–421. [Google Scholar]
- Council Directive 91/271/EEC of 21 May 1991 Concerning Urban Waste-Water Treatment; L 135; OJEU: Aberdeen, UK, 1991.
- Directive 2006/7/EC of the European Parliament and of the Council of 15 February 2006 Concerning the Management of Bathing Water Quality and Repealing Directive 76/160/EEC; L 64; OJEU: Aberdeen, UK, 2006.
- Directive (EU) 2020/2184 of the European Parliament and of the Council of 16 December 2020 on the Quality of Water Intended for Human Consumption (Recast) (Text with EEA Relevance); L 435; OJEU: Aberdeen, UK, 2020.
- ISO 9308-2:2012 Water Quality—Enumeration of Escherichia coli and Coliform Bacteria—Part 2: Most Probable Number Method. Available online: https://www.iso.org/cms/render/live/en/sites/isoorg/contents/data/standard/05/22/52246.html (accessed on 18 August 2021).
- Kirschner, A.; Kavka, G.; Reischer, G.; Sommer, R.; Blaschke, A.; Stevenson, M.; Vierheilig, J.; Mach, R.; Farnleitner, A. Microbiological Water Quality of the Danube River: Status Quo and Future Perspectives. In The Danube River Basin; The Handbook of Environmental Chemistry; Springer: Berlin/Heidelberg, Germany, 2015; Volume 39, pp. 439–468. [Google Scholar] [CrossRef]
- Ajeagah, G.; Cioroi, M.; Praisler, M.; Constantin, O.; Palela, M.; Bahrim, G. Bacteriological and Environmental Characterisation of the Water Quality in the Danube River Basin in the Galati Area of Romania. Afr. J. Microbiol. Res. 2012, 6, 292–301. [Google Scholar] [CrossRef]
- Ene, A.; Vasile, M.A.; Bahrim, G. Study of Microbiological Contamination Level of Surface Water in MONITOX Network Areas before and after COVID-19 Pandemic. Analele Univ. ”Dunărea Jos” Din Galați Fasc. II Mat. Fiz. Mec. Teor. Ann. ”Dunarea Jos” Univ. Galati Fascicle II Math. Phys. Theor. Mech. 2020, 43, 75–81. [Google Scholar] [CrossRef]
- Vasile, M.A.; Ene, A.; Bahrim, G. Microbiological Quality and Contamination Level of Water of Black Sea and Northern Aegean Sea. In Proceedings of the Environmental Toxicants in Freshwater and Marine Ecosystems in the Black Sea Basin, Kavala, Greece, 8–11 September 2020; Available online: https://ibn.idsi.md/vizualizare_articol/115635 (accessed on 18 July 2021).
- Kalkan, S.; Altuğ, G. The Composition of Cultivable Bacteria, Bacterial Pollution, and Environmental Variables of the Coastal Areas: An Example from the Southeastern Black Sea, Turkey. Environ. Monit. Assess. 2020, 192, 356. [Google Scholar] [CrossRef] [PubMed]
- Pavlovi, P.; Pavlovi, D. Assessment of the Contamination of Riparian Soil and Vegetation by Trace Metals—A Danube River Case Study. Sci. Total Environ. 2016, 540, 396–409. [Google Scholar] [CrossRef]
- Daneshvar, A.; Svanfelt, J.; Kronberg, L.; Prévost, M.; Weyhenmeyer, G.A. Seasonal Variations in the Occurrence and Fate of Basic and Neutral Pharmaceuticals in a Swedish River–Lake System. Chemosphere 2010, 80, 301–309. [Google Scholar] [CrossRef]
- Herrero-Hernández, E.; Rodríguez-Cruz, M.S.; Pose-Juan, E.; Sánchez-González, S.; Andrades, M.S.; Sánchez-Martín, M.J. Seasonal Distribution of Herbicide and Insecticide Residues in the Water Resources of the Vineyard Region of La Rioja (Spain). Sci. Total Environ. 2017, 609, 161–171. [Google Scholar] [CrossRef]
- Wiegel, S.; Aulinger, A.; Brockmeyer, R.; Harms, H.; Löffler, J.; Reincke, H.; Schmidt, R.; Stachel, B.; von Tümpling, W.; Wanke, A. Pharmaceuticals in the River Elbe and Its Tributaries. Chemosphere 2004, 57, 107–126. [Google Scholar] [CrossRef] [PubMed]
- Paíga, P.; Santos, L.H.M.L.M.; Ramos, S.; Jorge, S.; Silva, J.G.; Delerue-Matos, C. Presence of Pharmaceuticals in the Lis River (Portugal): Sources, Fate and Seasonal Variation. Sci. Total Environ. 2016, 573, 164–177. [Google Scholar] [CrossRef] [PubMed]
- Ferrari, F.; Gallipoli, A.; Balderacchi, M.; Ulaszewska, M.M.; Capri, E.; Trevisan, M. Exposure of the Main Italian River Basin to Pharmaceuticals. J. Toxicol. 2011, 2011, e989270. [Google Scholar] [CrossRef] [PubMed]


| Sampling Site/Sampling Moment (Data) | Monitored Contaminants | Analytical Approach | Relevant Environmental Concentrations Range for the Detected Compunds in Analysed Matrices | Ref. |
|---|---|---|---|---|
| Middle and lower sector of the Danube River and its tributaries August–September 2013 (JDS3) | Five compounds, including: carbamazepine, its metabolite 10,11-dihydro-10,11-dihydroxy-carbamazepine, sulfamethoxazole and diclofenac | SPE-UHPLC-QqQ- MS-MS, MRM mode | Surface waters (ng/L): Carbamazepine (20–68, max in Arges river); Sulfamethoxazole (20–141, max. in Arges river); Diclofenac (2–255, max. in Arges river); Naproxen (1–9); Ibuprofen (5–27) | [45] |
| Along the Danube banks of Novi Sad/July and November 2011, March and May 2012, seasonal monitoring | Four compounds, including: caffeine, sulfamethoxazole, chloramphenicol, tiamuline | SPE-HPLC-DAD | Surface waters (ng/L): Caffeine (15.91–306, mean 40.6) | [46] |
| Danube, Novi Sad region/Spring, 2012 | 47 compounds, including: analgesics, lipid regulators, psychiatric drugs, diuretics, antidiabetic, antihypertensives, NSAIDs | SPE-UHPLC-Q-TRAP MS, turbo ion spray source | Surface waters (ng/L): Ibuprofen (<LOQ-346 in surface water, 92 in groundwater); 10,11-Epoxycarbamazepine (<LOQ-932 in surface water, 128 in drinking water); Hydrochlorothiazid (54.55); Valsartan (89.6); Erythromycin (292); Cefalexin (283), Hydrochlorothiazide (<LOQ-164); Atenolol (<LOQ-50.6); Metoprolol (<LOQ-26.3); Clarithromycin (<LOQ-616); Cefalexin (283); Carbamazepine (<LOQ-35.5) | [15] |
| Danube River downstream of Novi Sad/seasonal monitoring, 2016 | Seven compounds, including: caffeine, carbamazepine, diazepam and metabolite desmethyldiazepam benzotriazole sulfamethoxazole, ibuprofen | SPE-LCQqQ MS-MS, ESI source, MRM mode | Surface waters (ng/L): Caffeine (5.27–256); Carbamazepine (3.94–22.9); Ibuprofen (3.32–60.1); | [47] |
| Danube River and four sampling sites in tributaries Tisa, Sava, Morava and Pek near confluence with the Danube/2009–2010 | 10 compounds, including: penicillin antibiotics, benzodiazepines carbamazepine diclofenac, metamizole metabolites | SPE-LC-QqQ MS-MS | Surface waters (ng/L): Metamizole metabolite 4-AAA (150, in ground water and 247 in surface water in Tisa river); Metamizole metabolite 4-FAA (327 in surface water—Morava); Trimethoprim (223 in surface water, Danube); Carbamazepine (94 in surface water, Tisa river); Lozarepam (34) | [48] |
| Two sampling points on the Danube River, in the cities of Novi Sad and Kovin (Serbia) and three sampling sites from Danube’s major tributaries: the Tisa River, the Sava River, the Morava River/Not mentioned | 13 compounds, including: penicillins, sulfamethoxazole, trimethoprim, macrolides, aminophenazone and metabolites, benzodiazepines, carbamazepine | SPE-UHPLC-Q-IT MS, SRM mode | Surface waters (ng/L): Trimetoprim (7–212 in surface water, max. in Morava river); 4-formylaminoantipyrine (4-FAA) (9–186, in surface water, max. in Tisa river); 4-acetylaminoantipyrin (4-AAA) (20–512, in surface water, max. in Morava river); Carbamazine (8–94, in surface water, max. in Tisa river); Groundwaters (ng/L): Azithromycin (12–68, in ground water, max. in Danube); Sediment (ng/g): Diazepam (48) | [39] |
| Middle and low of the Danube River and its tributaries Morava, Tisza, Sava, Velika Morava, Arges, Olt, Iskar, Rusenski Lom (not on map), Yantra, and Prut/August 2007 | Six compounds, including: sulfamenthoxazole, carmabazepine, caffeine, ibuprofen, diclofenac, bezafibrat | SPE-UHPLC-QqQ MS-MS, ESI source, MRM mode | Surface waters (ng/L): Sulfametoxazole (30–204, max. in the Arges River); Ibuprofen (5–34, max. in the Velika Morava river); Carbamazepine (27–945, max. in the Arges River); Diclofenac < 5 ng/L | [49] |
| 11 km upstream from the Iron Gate I dam/ August–September 2007, JDS2 | 19 compounds, including: antihypertensive, macrolide antibiotics, sedatives, antiepileptics, anticoagulants, NSADs | UAE and SPE UHPLC Q-IT-, ESI and APCI source | Sediment core samples (Max deep 70 cm) (ng/g): Sulfamethoxazole (0.5–30); Erytromycin (6.8–36.9); Carbamazepine (0.5–0.9); Clopidogrel (0.1–13.9) | [44] |
| 16 sampling locations along the Romanian side of the Danube and its three main tributaries, Jiu, Olt and Argeș rivers/ February, April and June 2014 and October 2015 | 35 compounds, including: diuretics, NSAIDs, antibiotics, analgesics, lipid regulators, caffeine, anticonvulsivants | SPE, LC-QqQMS-MS Target analysis in MRM mode | Surface waters (ng/L): Caffeine (28.3–128); Carbamazepine (5.4–15.4); Clarithromycin (1.2–23.2); Cephalexin (5.6–17.8); Sulfamethoxazole (3.2–15.7); Trimethoprim (1.3–11.1); Naproxen (2.4–106); Ibuprofen (2–27.2); Diclofenac (0.8–7.5) | [50] |
| 15 sites in the Mures, River (Tributary of Tisza, Danube basin) on exit from the Romanian territory/ 2018 | 10 compounds: carbamazepine, 10,11-dihydrocarbamazepine, enalapril, furosemide enalaprilat, ibuprofen, and methabolites carboxyibuprofen,1-hydroxyibuprofen, 2-hydroxyibuprofen | SPE-LC-QqQ MS | Surface waters (ng/L): Enalaprilat (1.73–23.16); Enalapril (1.16–14); Furosemide (7.88–444.63); Carbamazepine (7.16–643.31); Ibuprofen (1.65–117.14); Carboxi-ibuprofen (6.74–391.16); 1-hidroxyibuprofen (0.16–11.24); 2 hidroxyibuprofen (2.89–68.29) | [51] |
| 16 samples from Danube river and from three of the main effluents: Siret, Olt, Arges; 4 samples from Danube Delta/ May, June, August and October 2014 | 36 compounds, including: macrolides, benzimidazole, tranquilizers, macrolides, sulfonamides, quinolones, penicillins, tetracyclines, NSAIDs, antiepileptic, lipid regulator, coccidiostats | SPE-LC-HR Q-Orbitrap MS –MS Targeted analysis in SIM mode | Surface waters (ng/L): Carbamazepine (4–40, max. in Arges tributary); Sulfamethoxazole (2.5–30); Trimethoprim (3–12); Diclofenac (4.8–166, max. in Arges tributary); Ketoprofen (8.5–58, max. in Siret tributary); Naproxen (6.1–22); Piroxicam (3.7–32); Tylosine (11–39) | [10] |
| 3 samples from the Danube river and 2 samples from tributary Siret and Prut River/ April 2012 | 15 compounds, including: macrolides, benzimidazole, tranquilizers, macrolides, sulfonamides, quinolones, penicillins, tetracyclines, NSAIDs, antiepileptic, lipid regulator, coccidiostats | SPE-LC-HRMS Orbitrap MS–MS targeted screening method | Surface waters (ng/L): Trimethoprim (>25); Sulfamethoxazole (>30); Diclofenac (>50); Carbamazepine (>20); Erythromycin (20–25) | [52] |
| Along the 250-km-long stretch of the Prut River basin (Danube tributary)/Three sampling campaigns: May and November 2011, and June 2012 | 150 compounds, including various pharmaceuticals and metabolites | SPE-LC-HRMS-MS, full MS and DDA MS/MS | Surface waters (ng/L):Metformin (100–440; max. in Jijia river); Acetamidantipyrine (75–210); Gabapentin (<LOD-310, max. in Jijia river); Propyphenazone (<LOQ-156); Phenazone (15–73); Carbamazepine (7–14); Carbamazepine-10,11-dihydro-10,11-dihydroxy (16–99); Dihydroxycarbamazepine (16–40); Diclofenac (<LOQ-150 max. in Jijia river); Caffeine (<LOQ-46); Atenol (LOQ-13); Atenolol acid (8.4–120); Fluconazole (6–24); Metoprolol (6–17); Metronidazole (3.2–9); Sulfamethoxazole (2.1–61); Trimetoprim (2.4–11) | [53] |
| Dniester River Basin (Ukraine and Republic of Moldova)/May 2019 | 42 compounds, including: various pharmaceuticals and metabolites, drugs of abuse, stimulants | SPE-LC-ESI-QTOF-HRMS in DIA and DDA acquisition modes | Surface waters (ng/L): 4-Acetamidoantipyrine (6.34–1611); Carbamazepine (4.59–1981); Carmabazepine metabolite (4.59–2858); Climbazole (2.78–178); Fluconazole (61.3–3390); Ibuprofen (51.5–155); Lamotrigene (16.2–189); Lidocaine N-Oxide (0.7–7708); Metformin (1103); Sulfamethoxazole (2.47–1229); Salicilic acid (4.45–102); Trimethoprim (1–56); Norephedrine (0.2–2633); Caffeine (24.1–1180) | [26] |
| Sampling Site/Sampling Moment (Data) | Monitored Contaminants | Analytical Approach | Relevant Environmental Concentrations Range for the Detected Compounds in Analyzed Matrices | Ref. |
|---|---|---|---|---|
| 8 sampling points, Danube river, near Novi Sad, Serbia/November 2012 | Bisphenol A (BPA) | SPE-GC-MS, SIM mode | Surface waters (ng/L): BPA (6–221.6) | [23] |
| Danube and Sava Rivers in the region of Belgrade/January and February 2013 | Steroids hormons: E1, E2, EE2, E3, progesterone, norethindrone | HPLC–ESI-MS targeted analysis; | Surface waters (ng/L): E1 (0.15–0.19); EE2 (0.16); E3 (0.37–0.57); Progesterone (0.020–03); Norethindrone (0.05–0.13); | [65] |
| Danube along the Novi Sad bank /November 2012, March, May and September 2013 | Bisphenol A (BPA) | SPE-GC-MS, SIM mode | Surface waters (ng/L): BPA (6–693) | [20] |
| 30 sites, along the Danube River and its tributaries Sava and Tisa rivers in Serbia | Endocrine disruptors industrial chemicals (NP, OP, BPA), natural (E2, E1, E3), synthetic estrogens (EE2, DES) and their conjugates | UHPLC-QqQ MS- MS, SRM mode | Surface waters (ng/L): E1 (0.2–9.8); Estrone-3-sulfate (0.1–7.2); E3 (2.1–4.8); Estriol-3-sulfat (0.2–4.1); Ctylphenol (0.1–36.6); Nonylphenol (0.1–36.6); BPA (0.6–105.7) | [61] |
| 11 km upstream from the Iron Gate I dam/August–September 2007, during the JDS 2 | Steroids hormons: mestranol, EE2, E2, E1 | UAE and SPE-UHPLC-LTQ XL, APCI source | Sediments (ng/g): Mestranol (1.0–77.5) | [44] |
| 16 sampling locations along the Danube and its three main tributaries, Jiu, Olt and Argeș rivers/February, April and June 2014 and October 2015 | Steroids hormons: E1, E2, EE2, equiline, E3 | SPE-UHPLC-QqQ MS-MS Target analytesin MRM mode | Surface waters (ng/L): E1 (1.4–3.0); E2 (1.5–3.3); EE2 (0.5–3.7), with higher values in the tributary | [50] |
| 16 sites along the Romanian part of the Danube River, Jiu, Olt and Arges river/October 2015 | Estradiol, and 6 estrogen hormones 17α-Ethinylestradiol,: Equilin, Estrone, 17α-Estradiol, 17β-Estriole | UHPLC-QqQ MS-MS, MRM mode | Surface waters (ng/L): E3 (3.3, in the Danube river); E3 (<LOQ–3.8, in the Jiu river); E2 and EE2 (<LOQ-1.6) | [66] |
| Danube (sampling point: Braila) and tributary Jiu River (sampling point Targu Jiu)/July–October 2018, February and April 2019 | Bisphenols: BPA, BPS, BPE, BPF, BPB, BPC and 4-hydroxyacetophenone (4 HAP, BPA metabolite) | SPE-UHPLC-ESI-MS/MS method | Surface waters (ng/L): BPS (6.15–8.23); 4-HAP (12.2–98.5); BPA (22.1–135) | [67] |
| 11 sampling points in the Danube Delta/November 2019 | Bisphenols: BPA, BPS, BPE, BPF, BPB, BPC and 4 HAP | UHPLC-QqQ MS-MS targeted analysis, SIM mode | Surface waters (ng/L): BPA (4.2–9.02); BPE (<LD-16.8);4-HAP (BPA metabolite) (3.56–30.9) | [68] |
| 45 sites in the Romanian Black Sea Coast area/August 2020 | Bisphenols: BPA, BPS, BPE, BPF, BPB and BPC 4-hydroxyacetophenone | UHPLC-QqQ MS-MS | Seawater (ng/L): BPA(nd-416); BPF (nd-19.7); BPE (nd-194) Sediments (ng/g): BPC (3.8–16.2) Algae (ng/g DW): BPA (nd-10.1); BPC (12–45); BPE (nd-244); BPF(nd-53.9) | [69] |
| Sampling Site/Sampling Moment (Data) | Monitored Contaminants | Analytical Approach | Relevant Environmental Concentrations Range for the Detected Compounds in Analysed Matrices | Ref. |
|---|---|---|---|---|
| Belgrade section of the Danube River (from 1168th to 1170th river km), Serbia/October–November 2010 | As, B, Ba, Cd, Co, Cr, Cu, Fe, Hg, Li, Mn, Mo, Ni, Pb, Se, Sr, and Zn | (ICP-OES | Surface waters (µg/L): Al (17–18); As (1.1–1.6); Cd (0.03–0.18); Cu (2.8–10.1); Fe (120–380); Mn (ND–20); Zn (3.8–10.5) Fish muscle (mg/kg DW): Al (4.87–7.56); As (0.17–0.93); Cd (0.005–0.01); Ba (0.66–2.18); Cr (0.01–0.08); Mn (0.12–0.87); Cu (0.75–1.42); Hg (0.89–1.63); Zn (15.14–59.01) | [108] |
| Danube and tributary on Serbian territory/2011 and 2013, during the same season (June–October) | Al, As, Cd, Co, Cr, Cu, Fe, Hg, Mn, Ni, Pb, and Zn | ICP-OES | Surface Waters (µg/L): Al (80–470); As (0.5–5); Cd (0.1–50); Cr (0.5–90); Cu (5–70); Fe (810–8140); Hg (0.1); Mn (10–180); Ni (0.9–220); Pb (0.3–10); Zn (6–340) Fish (mg/kg WW): Al (0.07–0.93); As (0.09–0.4); Cd (0.001–0.09); Cr (0.1–1.41); Cu (0.07–2.78); Fe (0.81–8.14); Hg(0.004–0.78); Mn (0.08–0.41); Ni (0.009–0.07); Pb (0.11–0.82) | [109] |
| Danube in the Belgrade region, Serbia/early autumn, 2012 | Cu, Fe, Zn, Ni, Pb, Cd, Hg, As | AAS | Surface waters (µg/L): Zn (32); Fe (330); Cu (4); As (4). Sediments (mg/kg): Zn (139.4); Fe (16,104); Cu (35.95); As (8.9); Cd (0.610); Hg(0.690); Pb (32.58) Fish muscle (mg/kg DW): Pb (0.014–0.048); Cd (0.008–0.014); Hg (0.140–0.327); As (0.003–0.036) | [110] |
| Tisa River/July, August and September of 2001 | Cd, As, Hg, Cu, Zn, Cr, Pb, Ni | FAAS with a hydride vapour system | Sediments (mg/kg): Cu (1.96–33.1); Cr (0.440–7.640); Zn (3.75–158); Pb (0.6–32.5); Cd (0.15–1.04); Ni (0.71–11.1); As (0.06–0.68); Hg (0.02–0.09) | [106] |
| Five sites along Yantra River, Bulgaria/2013–2018 (four times per year, once every three months) | Fe, Mn, Mg, Ca, Cd, Hg, As, Cu, Cr, Zn, Pb and Ni | ICP-OES, (method: ISO 011885) | Surface Waters (µg/L): Mn (10.35–19.97); Fe (48.6–185.1); Cu (0.006–2.85); Zn (9.13–40.01); Pb (0.001–1.20); Hg (0.001–68.15); Cd (0.002–14.90); As (1.06–10.1); Cr (0.01–1.87;) Ni (2.02–4.1) Expresed as mean value/site | [111] |
| 120 sites on the Begej canal, at the border between Romania and Serbia/ 2008–2016 | Ni, Zn, Cd, Cr, Cu, Pb, As and Hg | FAAS and GFAAS (methods USEPA 3051A, 2007a, 2007b) | Sediments (sludge layer) (mg/kg): Ni (3.24–143); Zn (204–975); Cd (0.25–3.26); Cr (71–391); Cu (94–200); Pb (8.95–263); As (8.5–43); Hg (0.04–0.97); | [84] |
| Danube river (km 1049 and km 630)/2010 | 32 elements (Ag, As, Au, Ba, Br, Ca, Ce, Co, Cr, Cs, Eu, Fe, Hf, Hg, K, La, Lu, Na, Ni, Rb, Sb, Sc, Se, Sm, Sr, Ta, Tb, Th, U, W, Zn and Zr) | INAA | Surface Waters (µg/L): As (2.35); Co (1.05); Fe (2.02); Hg (0.117); Ni (9.9) Fish (mg/kg WW): As (0.029–0.204); Cr (0.06–1.63); Hg (0.0031–0.027); Ni (0.084–0.412); Co (0.0058–0.121); Sb (0.0021–0.0139); Zn (0.0124–0.0825); Rb (0.00093–0.004); Fe (13.7–64.1); Se (0.0058–0.0507) | [112] |
| Danube river between 347 km and 333 km/2011–2013, monthly monitoring | Cd, Pb, Ni, Cu, Cr, and Zn | AAS | Surface waters (µg/L): Cd (0.02–0.19); Pb (0.05–3.81); Ni (0.33–4.92); Cu (0.44–7.81); Cr (0.21–3.97); Zn (0.40–79.00) Sediments (mg/kg): Cd (0.10–0.78); Pb (0.42–77.67); Ni (11.93–93.52); Cu (7.24–86.52); Cr (4.09–68.15); Zn (32.05–302.52) | [113] |
| 10 sampling sites on the Lower Danube km 375–175 section (Romanian territory)/2011–2017 | As, Cd, Cr, Cu, Pb, Hg, Zn, Ni | AAS | Surface sediments (mg/kg): As (06–16.96); Cd (0.02–1.33); Cr (1.86–99.87); Cu (2.65–126.52); Pb (0.42–84.75); Hg (0.02–0.52); Zn (28.29–217.43); Ni (10.08–99.67) | [85] |
| Two sites along lower sector of the Danube River, at rkm 150 and 170 (Romanian territory) /April-May 2018 | Cd, Pb, Ni, Cu, Fe, Zn | FAAS with HR-CS-GF-AAS | Surface waters (µg/L): Cd (0.158–0.243); Pb (2.76–3.67); Ni (5.65–7.20); Cu (5.70–9.59); Zn (16.27–38.9); Fe (722.65–1244.68) (Expresed as mean values/site) | [114] |
| Five reservoirs of the Olt River September, 2014 | Total Hg (THg), inorganic Hg (IHg), methylmercury (MeHg) | AAS | Surface waters (µg/L): THg (0.52–2.36) in water; Biota (mg/kg DW) THg (0.034–0.098) DW in biota; Sediments (mg/kg): THg (0.75–1.7); MeHg (2.5–18.6) | [115] |
| 22 sites along Olt river (middle and inferior course)/ March–May 2018 | Zn, Cr, Cu, Ni, Pb, As, Cd, Hg | ICP-MS | Surface sediments (mg/kg): Zn (3.20–160); Cr (0.009–100.66); Cu (0.125–52.02); Ni (5.68–86.31); Pb (1.74–49.63); As (10.00–242.13); Cd (0.008–1.23); Hg (0.01–1.105) | [116] |
| 28 sites along Olt river (middle and inferior course)/May, July, and September 2019 | Al, As, Cd, Co, Cu, Cr, Fe, Hg, Mn, Ni, Pb, Zn | ICP-MS and AAS, method ISO 11047:1998 | Surface water (µg/L): Cr (2–64); Mn (0.8–468); Co (0.02–10); Ni (0.05–87); Cu (0.2–12); As (0.02–6.9); Cd (0.01–6.5); Pb (0.04–1.8); Hg (0.01–1.5); Zn (0.1–38); Fe (1–1264); Al (ND–2991) Sediments (mg/kg): Cr (ND–72); Mn (137–2273); Co (ND–29); Ni (0.2–86); Cu (0.08–56); As (ND–8.3); Cd (0.1–0.5); Pb (0.05–21); Hg (0.01–0.2); Zn (7.6–524); Fe (ND–14053); Al (3719–30819) | [107] |
| Two sites in low Danube region, Galati (km 150) and Tulcea (km 71)/August 2010 | Cd, Cu, Zn, Pb | AAS (air/acetyene flame); GC with ECD. | Surface waters (µg/L):: Cd (15.7–18.4); Cu (93.5–112.3); Zn (32.58–47); Pb (14.6–21.4) Fish (DW): Cd (0.010–0.091); Cu (1.5–5.34); Zn (21.92–44. 5); Pb (0.26–0.65) | [117] |
| Danube River, South-Western part of Romania/ December 2010 and July 2012 | Cd, Cu, Pb, Zn | ICP-MS | Surface waters (µg/L)::Cd (0.002–0.008); Cu (1.46–3.17); Pb (ND–2.76); Zn (0.78–1.82) Plants (mg/kg DW): Cd (0.65–3.52); Cu (6.24–22.71); Pb (1.51–20.06); Zn (15.63–104.23) | [118] |
| Lower Danube River, between 180 and 60 km/autumn of 2018 and the spring of 2019 | Cd, Ni, Zn, Pb, Cu | ICP–MS Method ISO 17294–2/2005 | Sediments (mg/kg): Pb (4.17–21.14); Cu (4.30–27.50); Cd (0.30–0.82); Zn (58.57–161.24); Ni (14.00–50.46) (Expresed as seasonal average/site) | [119] |
| Cruhlig Lake, Danube Delta, south of the Sf. Gheorghe branch/2013 | Al, As, Cd, Co, Cs, Cr, Cu, Fe, Hg, K, Li, Mg, Mn, Ni, Pb and Zn | ICP-MS | Sediments (mg/kg): Al (0.7–16.35); As (1.7–158.24); Cd (0.0034–0.824); Co (0.5–12.5); Cr (0.055–38.53); Cu (0.06–46.2); Hg (0.0278–0.520); Li (2.4–26.77); Zn (0.1–90.8); Pb (0.50–11.18); Fe (1380–24650); Mn (244.8–1377) | [120] |
| S–E of the Danube Delta, the Sf. Gheorghe Branch/ October 2012–September 2013 | Pb, Cd, As, Hg | electrothermal (ETAAS) method and HGAAS | Sediments (mg/kg): Pb (5.44–47.45); As (1.13–20.55); Cd (0.04–1.34); Hg (0.005–0.99) | [121] |
| Danube Delta Biosphere Reserve (four aquatic complexes)/ 2007–2011 | Mg, Cu, Rh, Cd, In, Ba, Ce, Pb | ICP-MS | Surface waters (µg/L): Mn (54.67–251.74); Pb (6.81–48.04); Ni (27.15–104.28); Cr (26.00–81.24); Zn (124.5–333.78); Cd (4.21–11.05) Plankton (mg/kg DW): Cd (2874–42.356); Cr (3.658–24.362); Mn (1.104–29.714); Ni (7.440–27.890); Pb(0.118–1.014); Zn (10.959–74.644) | [122] |
| Biosphere Reservation of Danube Delta/three time per year during 2007–2015 | Cd, Cr, Mn, Ni, Pb and Zn | ICP-MS | Surface waters (µg/L): Cd (3.5–10.5); Cr (22.6–76.2); Mn (72.8–178.2); Ni (27.8–76.4); Pb (6.11–11.2); Zn (100.2–209.8) Sediment (mg/kg): Cd (3.47–7.88); Cr (29.4–117.6); Mn (301.9–687.9); Ni (27.1–79.1); Pb (5.18–13.99); Zn (122.1–204.7) Aquatic plants (mg/kg DW): Cd (0.447–2.026); Cr (0.967–5.107); Mn (0.286–3.889); Ni (1.630–14.052); Pb (0.160–5.792); Zn (5.741–25.284) | [123] |
| 4 sampling sites in Danube Delta Biosphere Reserve (Matita-Merhei)/ 2006–2015, seasonal monitoring in spring, summer and autumn | Ni, Cr, Pb, As | ICP-MS | Surface waters (µg/L): As (7.96–16.25); Ni (19.10–79.10); Cr (12.5–78.25); Pb (5.5–34) Sediments (mg/kg): As (1.9–9.42); Ni (5.14–21.35); Cr (9.20–17.68); Pb (1.9–9.42) | [124] |
| The reservoir Stanca-Costesti, on the middle course of the Prut River/ July, 2015 and April 2015 | Cu, Cd, Pb, Cr and Ni | HR-CS-GF-AAS | Sediments (mg/kg): Cu (1.86–5.01); Cd (0.026–0.202); Pb (1.33–3.36); Cr (2.16–6.26); Ni (3.1–8.05) Mollusch (mg/kg DW): Cu (0.93–41.67); Cd (0.049–0.099); Pb (0.07–0.53); Cr (0.22–1.52); Ni (0.47–1.81) | [125] |
| Seven sites along the Danube River, Danube Delta and Black Sea/ April 2018 | Ca, Mg, Na, K, Fe, Zn, Cu, Ni, As, Cd, Pb, Cr | FAAS; HR-CS-GF-AAS | Surface waters (µg/L): Zn (0.5–57); Fe (100–1500); Ni (1–11); Pb (0.5–3.1); As (1.7–3.9); Cu (0.5–6.7); Cd (0.004–0.14) Sediment (mg/kg): Zn (17–150); Fe (3000–22000); Cu (2–40); Cr (5–26) ; Ni (5.2–39.8); As (1.4–13); Pb (2–12); Cd (0.01–0.7) Fish muscle (mg/kg WW): Pb (0.002–0.024); Cd (0.001–0.15); As (0.3–0.5); Cu (0.2–5.4); Fe (4–72); Zn (3.6–37.9) | [126] |
| The Romanian Black Sea coastline June 2014 | Hg, Cd, Pb, Ni, Cr, Mn, Zn, and Cu | ICP-MS | Microalgae species (mg/kg DW): Mn (22.94–612.34); Zn (33.03–119.02); Cu (0.28–13.85); Ni 0(.41–6.30); Hg (0.00214–0.00876); Cr (0.003–1.77); Pb (0.10–1.83); Cd (0.05) | [127] |
| The Romanian Black Sea coastline April 2011 and October 2012 | Cd, Pb, Cr, Ni, and Cu | AAS with graphite furnace | Surface waters (µg/L): Cu (3.06–30.66); Cd (0.41–2.72); Pb(4.03–12.93); Ni (2.50–2.70); Cr (0.67–2.19) Sediments (mg/kg): Cu (17.76–26.68); Cd (0.90–1.20); Pb (8.40–11.59); Ni (22.15–26.25); Cr (24.5–30.26) Algae (mg/kg DW): Cu (0.33–17.44); Cd (0.29–0.33); Pb (5.26–6.48); Ni (12.3–13.08); Cr (4.78–6.70) Molluscs (mg/kg DW): Cu (2.71–18.32); Cd (0.20–1.64); Pb (0.07–1.36); Ni (0.52–1.05); Cr (0.16–0.89) Fish (mg/kg DW)Cu (1.91–3.48); Cd (0.02–0.06); Pb (0.07–0.32); Ni (0.06–0.25); Cr (0.02–0.11) | [128] |
| Bulgarian Black Sea coast/ spring 2011 | As, Hg, Cd, Mn, Pb | AAS and ETAAS | Molluscs (mg/kg DW) Mn (0.26–1.74); As (2.07–4.17); Cd (0.005–0.090); Pb (0.11–0.32); Hg (0.08–0.32), (DW) | [129] |
| Dniester and Prut rivers/ 2005–2010 | Cu, Zn | AAS | Surface waters (µg/L): Cu (2.5–6.2); Zn (20–47) Fish (mg/kg WW): Cu (19.9–42.2 in liver); (3.6–28.5 in muscle); Zn (29.9–56 in liver); (8.7–30.2 in muscle); | [130] |
| Dniester River Basin (Ukraine and Republic of Moldova)/ May 2019 | As, Hg, Zn, Cu, Cr, Cd, Pb, Ni | ICP-MS | Surface waters (µg/L): As (1.34–6.92); Hg (0.009–0.080); Zn (5.77–108); Cu (1.26–10.8); Cr (0.26–4.38) Sediment (mg/kg): As (2.36–8.93); Hg (0.012–0.501); Zn (42.6–167); Cu (0.61–26.6); Cr (30.7–108); Cd (0.208–0.757); Pb (11.7–31.7); Ni (13.3–49.5) | [26] |
Publisher’s Note: MDPI stays neutral with regard to jurisdictional claims in published maps and institutional affiliations. |
© 2021 by the authors. Licensee MDPI, Basel, Switzerland. This article is an open access article distributed under the terms and conditions of the Creative Commons Attribution (CC BY) license (https://creativecommons.org/licenses/by/4.0/).
Share and Cite
Chiţescu, C.L.; Ene, A.; Geana, E.-I.; Vasile, A.M.; Ciucure, C.T. Emerging and Persistent Pollutants in the Aquatic Ecosystems of the Lower Danube Basin and North West Black Sea Region—A Review. Appl. Sci. 2021, 11, 9721. https://doi.org/10.3390/app11209721
Chiţescu CL, Ene A, Geana E-I, Vasile AM, Ciucure CT. Emerging and Persistent Pollutants in the Aquatic Ecosystems of the Lower Danube Basin and North West Black Sea Region—A Review. Applied Sciences. 2021; 11(20):9721. https://doi.org/10.3390/app11209721
Chicago/Turabian StyleChiţescu, Carmen Lidia, Antoaneta Ene, Elisabeta-Irina Geana, Aida Mihaela Vasile, and Corina Teodora Ciucure. 2021. "Emerging and Persistent Pollutants in the Aquatic Ecosystems of the Lower Danube Basin and North West Black Sea Region—A Review" Applied Sciences 11, no. 20: 9721. https://doi.org/10.3390/app11209721
APA StyleChiţescu, C. L., Ene, A., Geana, E.-I., Vasile, A. M., & Ciucure, C. T. (2021). Emerging and Persistent Pollutants in the Aquatic Ecosystems of the Lower Danube Basin and North West Black Sea Region—A Review. Applied Sciences, 11(20), 9721. https://doi.org/10.3390/app11209721