
High-Order Community Detection in the Air Transport Industry: A Comparative Analysis among 10 Major International Airlines


Abstract
:1. Introduction
- This paper examines the applicability and the robustness of the weighted clique percolation method in the commercial world, with a sample of ten major airlines with different business models.
- This paper expands the research scope by taking both codeshare agreements and the flight weights into account.
- New insights in air transport geographical and topological patterns include the following:
- The detected high-order communities can be interpreted purely based on geographical information.
- The wide-spread topological hub-shifting phenomenon is observed, resulting in inconsistency between topological gateway airports and the actual airline hubs.
- It is possible that airlines with the different business models and network sizes share an identical topology profile.
2. Literature Review
2.1. Traffic Dynamics from a Low-Order Perspective
2.2. High-Order Community Detection in Aviation
2.3. The Applicability and The Robustness of The Existing Community Detection Methods
3. Methodology
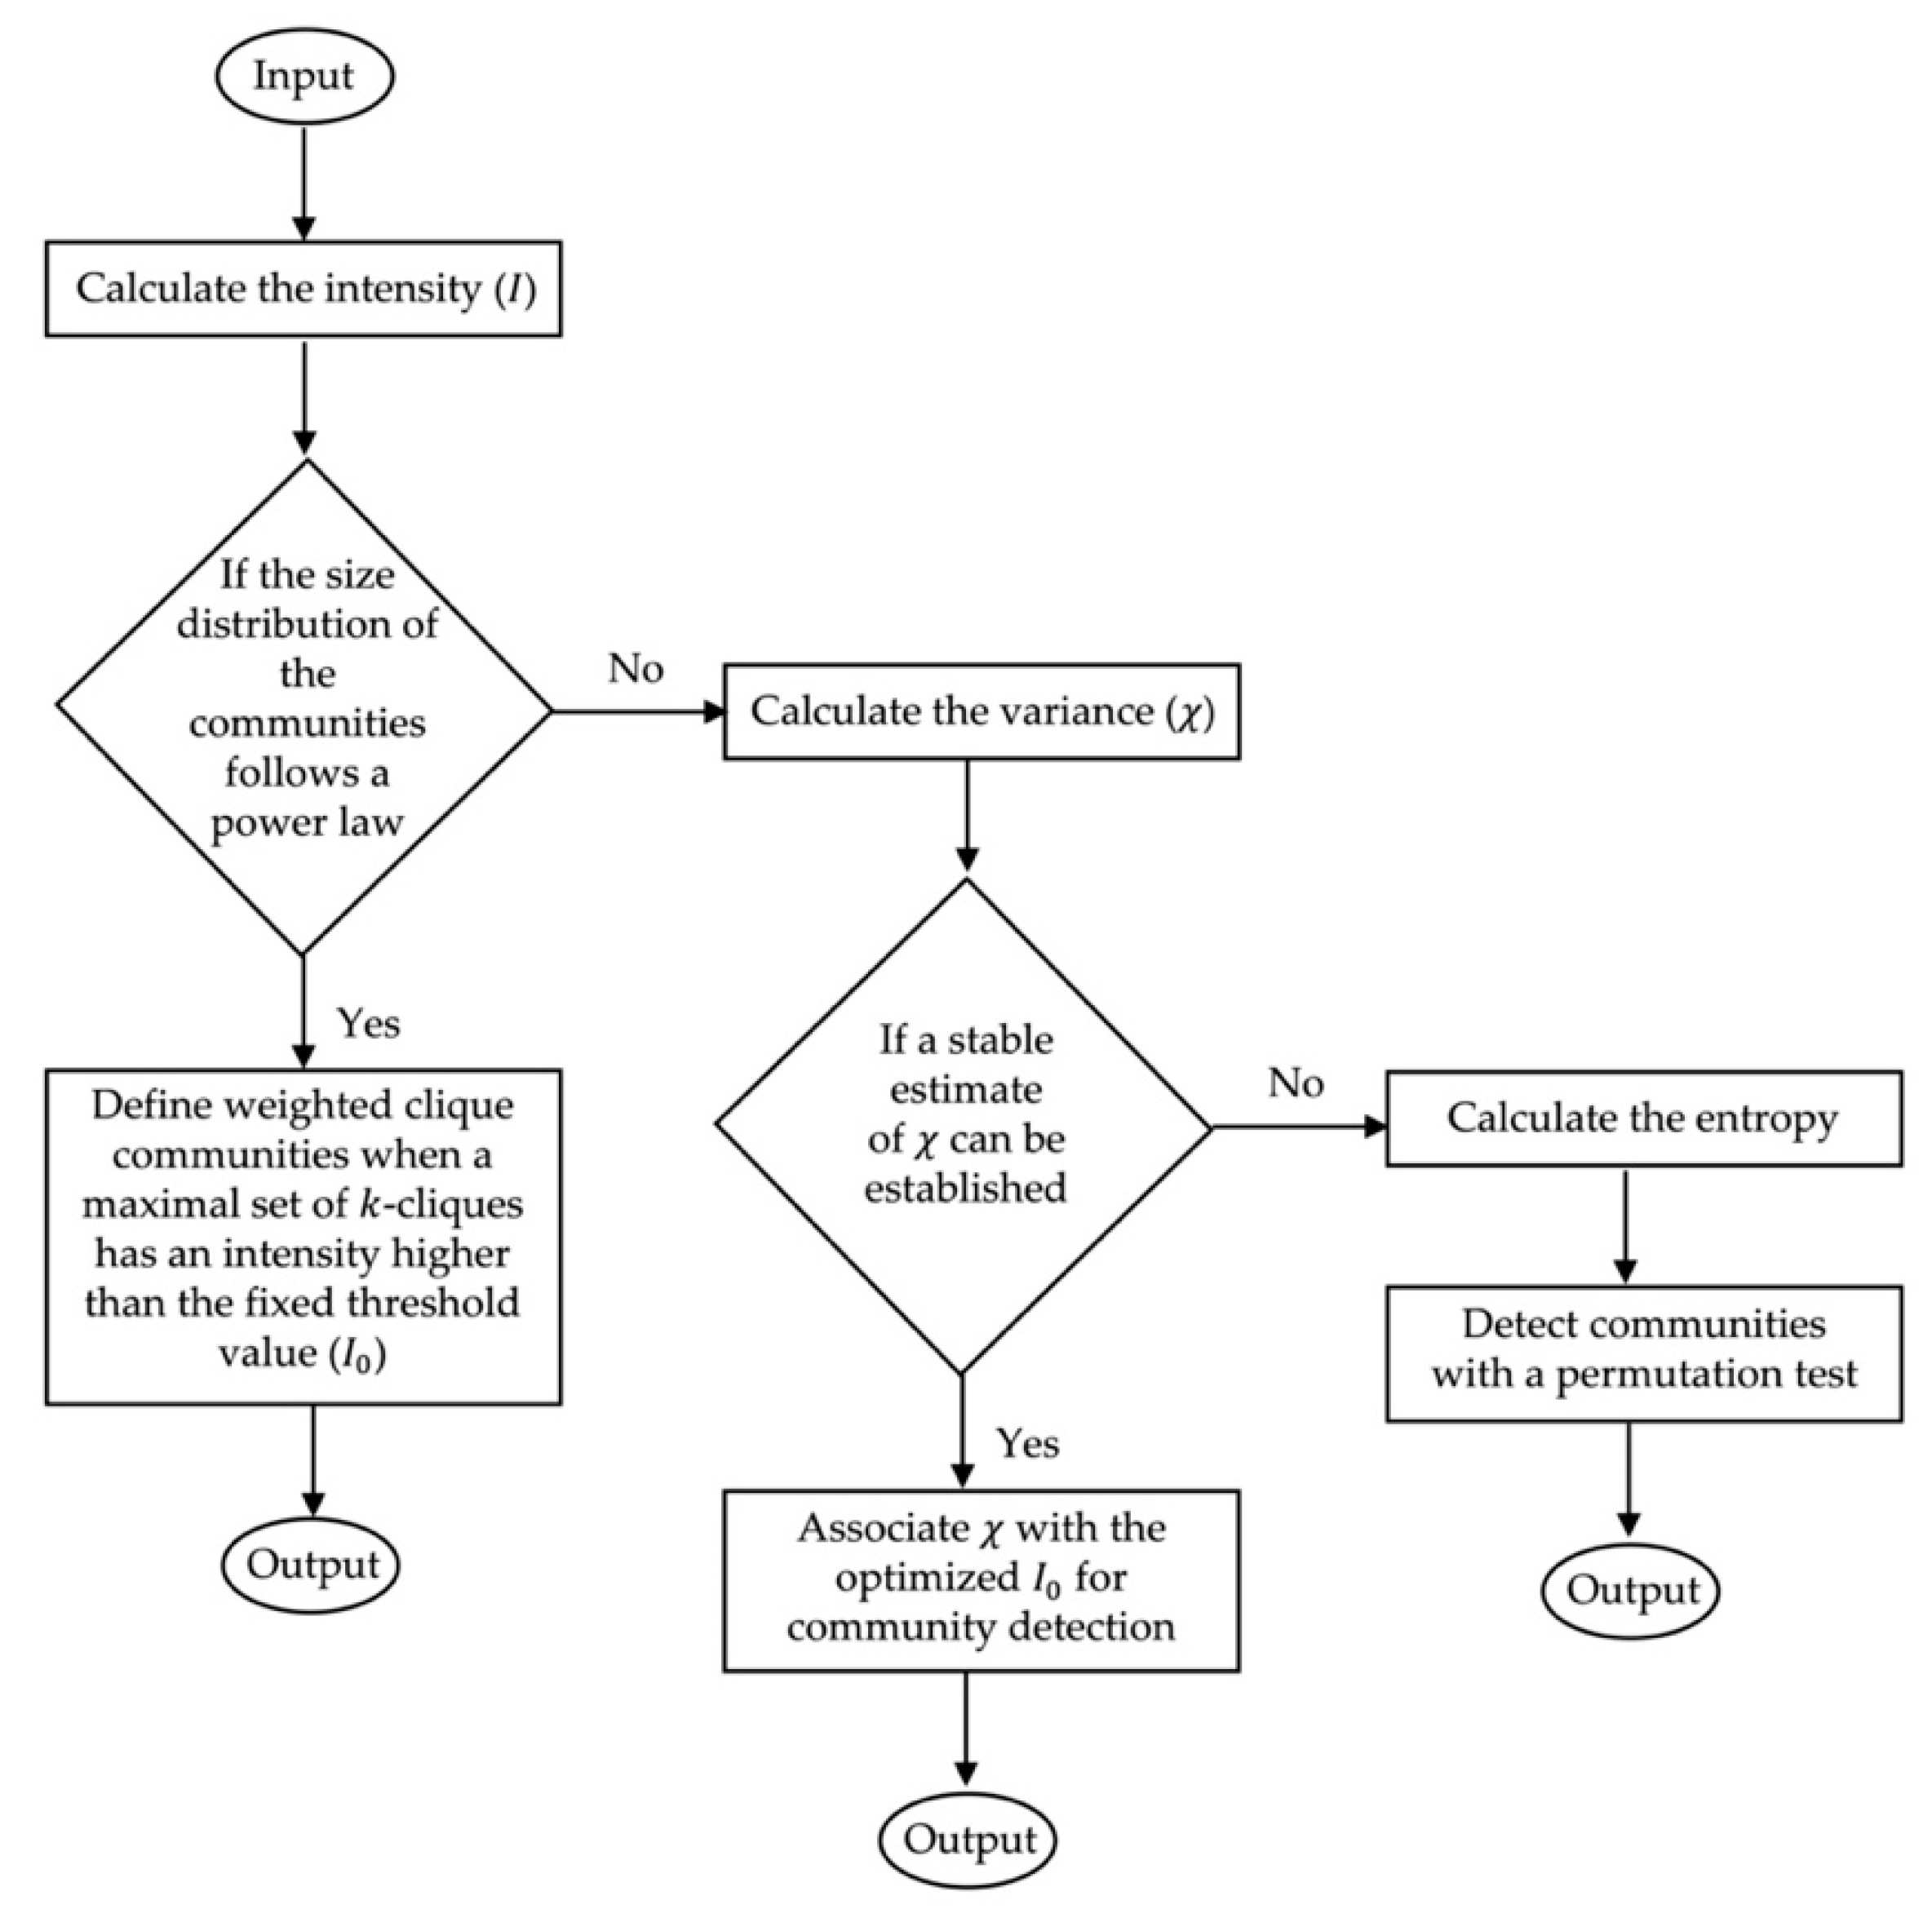
3.1. Weighted Clique Percolation Method
3.2. Dataset
4. Clique Percolation Community Detection
4.1. Network Properties for Selected Airlines
4.2. Clique Percolation Community Detection Process
4.3. Community Detection Results and Airline Network Configurations
4.4. Airports’ Roles in Codeshare Network: Hub Shifting or Hub Concentration
5. Findings and Discussion, Contribution, Limitations and Future Work of The Study
5.1. Findings and Discussion
5.2. Contribution
5.3. Limitations and Future Work of The Study
6. Conclusions
Author Contributions
Funding
Institutional Review Board Statement
Informed Consent Statement
Data Availability Statement
Acknowledgments
Conflicts of Interest
Appendix A

| IATA Code | Airport Name | Country |
|---|---|---|
| AKL | Auckland International Airport | New Zealand |
| CAN | Guangzhou International Airport | China |
| CDG | Paris Charles de Gaulle Airport | France |
| CPT | Cape Town International Airport | South Africa |
| DEN | Denver International Airport | USA |
| DUB | Dublin (IE) International Airport | Ireland Republic of |
| DUR | Durban King Shaka International Airport | South Africa |
| FRA | Frankfurt International Airport | Germany |
| GRU | Sao Paulo Guarulhos International Airport | Brazil |
| HKG | Hong Kong International Airport | Hong Kong (sar) China |
| ICN | Seoul Incheon International Airport | Korea Republic of |
| JFK | New York J. F. Kennedy International Airport | USA |
| JNB | Johannesburg O.r. Tambo International Airport | South Africa |
| LAS | Las Vegas McCarran International Airport | USA |
| LAX | Los Angeles International Airport | USA |
| LGW | London Gatwick Airport | United Kingdom |
| LHR | London Heathrow Airport | United Kingdom |
| MAD | Madrid Adolfo Suarez-Barajas Airport | Spain |
| MDW | Chicago Midway International Airport | USA |
| MEL | Melbourne Airport | Australia |
| MIA | Miami International Airport | USA |
| PEK | Beijing Capital International Airport | China |
| PHX | Phoenix Sky Harbour International Airport | USA |
| PLZ | Port Elizabeth International Airport | South Africa |
| PVG | Shanghai Pudong International Airport | China |
| SEA | Seattle-Tacoma International Airport | USA |
| SFO | San Francisco International Airport | USA |
| SIN | Singapore Changi Airport | Singapore |
| SYD | Sydney Kingsford Smith Airport | Australia |
| URC | Urumqi International Airport | China |
References
- Bounova, G. Topological Evolution of Networks: Case Studies in the US Airlines and Language Wikipedias. Ph.D. Dissertation, Massachusetts Institute of Technology, Cambridge, MA, USA, 2009. [Google Scholar]
- Zanin, M.; Lillo, F. Modelling the air transport with complex networks: A short review. Eur. Phys. J. Spec. Top. 2013, 215, 5–21. [Google Scholar] [CrossRef] [Green Version]
- Guimerà, R.; Mossa, S.; Turtschi, A.; Amaral, L. The worldwide air transportation network: Anomalous centrality, community structure, and cities’ global. Proc. Natl. Acad. Sci. USA 2005, 102, 7794–7799. [Google Scholar] [CrossRef] [PubMed] [Green Version]
- Yang, H.; Dobruszkes, F.; Wang, J.; Dijst, M.; Witte, P. Comparing China’s urban systems in high-speed railway and airline networks. J. Transp. Geogr. 2018, 68, 233–244. [Google Scholar] [CrossRef]
- Guo, W.; Toader, B.; Feier, R.; Mosquera, G.; Ying, F.; Oh, S.; Price-Williams, M.; Krupp, A. Global air transport complex network: Multi-scale analysis. SN Appl. Sci. 2019, 1, 680. [Google Scholar] [CrossRef] [Green Version]
- Porter, M.; Onnela, J.; Mucha, P. Communities in networks. Not. AMS 2009, 56, 1082–1097. [Google Scholar]
- Wang, X.; Li, J. Detecting communities by the core-vertex and intimate degree in complex networks. Physica A 2013, 392, 2555–2563. [Google Scholar] [CrossRef]
- Souravlas, S.; Anastasiadou, S.; Katsavounis, S. A Survey on the Recent Advances of Deep Community Detection. Appl. Sci. 2021, 11, 7179. [Google Scholar] [CrossRef]
- Wang, X.; Qin, X. Asymmetric intimacy and algorithm for detecting communities in bipartite networks. Physica A 2016, 462, 569–578. [Google Scholar] [CrossRef]
- Zanin, M.; Papo, D.; Sousa, P.A.; Menasalvas, E.; Nicchi, A.; Kubik, E.; Boccaletti, S. Combining complex networks and data mining: Why and how. Phys. Rep. 2016, 635, 1–44. [Google Scholar] [CrossRef] [Green Version]
- Lu, Z.; Wahlström, J.; Nehorai, A. Community Detection in Complex Networks via Clique Conductance. Sci. Rep. 2018, 8, 5982. [Google Scholar] [CrossRef]
- Huang, X.; Chen, D.; Ren, T.; Wang, D. A survey of community detection methods in multilayer networks. Data Min. Knowl. Discov. 2021, 35, 1–45. [Google Scholar] [CrossRef]
- Girvan, M.; Newman, M. Community structure in social and biological networks. Proc. Natl. Acad. Sci. USA 2002, 99, 7821–7824. [Google Scholar] [CrossRef] [Green Version]
- Newman, M.; Girvan, M. Finding and evaluating community structure in networks. Phys. Rev. E 2004, 69, 026113. [Google Scholar] [CrossRef] [PubMed] [Green Version]
- Rodrigues, F.; Travieso, G.; Costa, L.F. Fast community identification by hierarchical growth. Int. J. Mod. Phys. C 2007, 18, 937–947. [Google Scholar] [CrossRef] [Green Version]
- Li, J.; Wang, X.; Eustace, J. Detecting overlapping communities by seed community in weighted complex networks. Physica A 2013, 392, 6125–6134. [Google Scholar] [CrossRef]
- Eustace, J.; Wang, X.; Cui, Y. Overlapping community detection using neighbourhood ratio matrix. Physica A 2014, 421, 510–521. [Google Scholar] [CrossRef]
- Eustace, J.; Wang, X.; Cui, Y. Community detection using local neighborhood in complex networks. Physica A 2015, 436, 665–677. [Google Scholar] [CrossRef]
- Behera, R.K.; Rath, S.K.; Misra, S.; Damaševicius, R.; Maskeliunas, R. Large Scale Community Detection Using a Small World Model. Appl. Sci. 2017, 7, 1173. [Google Scholar] [CrossRef] [Green Version]
- Wu, W.; Zhang, H.; Zhang, S.; Witlox, F. Community Detection in Airline Networks: An Empirical Analysis of American vs. Southwest Airlines. J. Adv. Transp. 2019, 2019, 3032015. [Google Scholar] [CrossRef]
- Cui, Y.; Wang, X.; Eustace, J. Detecting community structure via the maximal sub-graphs and belonging degrees in complex networks. Physica A 2014, 416, 198–207. [Google Scholar] [CrossRef]
- Cui, Y.; Wang, X.; Li, J. Detecting overlapping communities in networks using the maximal sub-graph and the clustering coefficient. Physica A 2014, 405, 85–91. [Google Scholar] [CrossRef]
- Li, J.; Wang, X.; Cui, Y. Uncovering the overlapping community structure of complex networks by maximal cliques. Physica A 2014, 415, 398–406. [Google Scholar] [CrossRef]
- Edler, D.; Bohlin, L.; Rosvall, M. Mapping Higher-Order Network Flows in Memory and Multilayer Networks with Infomap. Algorithms 2017, 10, 112. [Google Scholar] [CrossRef] [Green Version]
- Huang, L.; Wang, C.-D.; Chao, H.-Y. Higher-Order Multi-Layer Community Detection. In Proceedings of the Thirty-Third AAAI Conference on Artificial Intelligence (AAAI-19), Honolulu, HI, USA, 27 January–1 February 2019; Volume 33, pp. 9945–9946. [Google Scholar]
- Hong, C.; Liang, B. Analysis of the weighted Chinese air transportation multilayer network. In Proceedings of the IEEE 2016 12th World Congress on Intelligent Control and Automation (WCICA), Guilin, China, 12–15 June 2016; pp. 2318–2321. [Google Scholar]
- Jia, T.; Qin, K.; Shan, J. An exploratory analysis on the evolution of the US airport network. Physica A 2014, 413, 266–279. [Google Scholar] [CrossRef]
- Agasse-Duval, M.; Lawford, S. Subgraphs and Motifs in a Dynamic Airline Network. 2018. Available online: https://arxiv.org/abs/1807.02585 (accessed on 31 December 2019).
- Cardillo, A.; Gomez-Gardenes, J.; Zanin, M.; Romance, M.; Papo, D.; del Pozo, F.; Boccaletti, S. Emergence of network features from multiplexity. Sci. Rep. 2013, 3, 1344. [Google Scholar] [CrossRef] [PubMed] [Green Version]
- Malliaros, F.; Rossi, M.; Vazirgiannis, M. Locating influential nodes in complex networks. Sci. Rep. 2016, 6, 19307. [Google Scholar] [CrossRef] [PubMed]
- Du, W.; Zhou, X.; Lordan, O.; Wang, Z.; Zhao, C.; Zhu, Y. Analysis of the Chinese Airline Network as multi-layer networks. Transp. Res. Part E Logist. Transp. Rev. 2016, 89, 108–116. [Google Scholar] [CrossRef] [Green Version]
- Rocha, L. Dynamics of Air Transport Networks: A Review from a Complex Systems Perspective. Chin. J. Aeronaut. 2017, 30, 469–478. [Google Scholar] [CrossRef]
- Farkas, I.; Abel, D.; Palla, G.; Vicsek, T. Weighted network modules. New J. Phys. 2007, 9, 180. [Google Scholar] [CrossRef]
- Fortunato, S. Community detection in graphs. Phys. Rep. 2010, 486, 75–174. [Google Scholar] [CrossRef] [Green Version]
- Reggiani, A.; Nijkamp, P.; Cento, A. Connectivity and Concentration in Airline Networks: A Complexity Analysis of Lufthansa’s Network; Tinbergen Institute: Amsterdam, The Netherlands, 2011. [Google Scholar]
- Du, W.; Zhou, X.; Jusup, M.; Wang, Z. Physics of transportation: Towards optimal capacity using the multilayer network framework. Sci. Rep. 2016, 6, 19059. [Google Scholar] [CrossRef] [PubMed] [Green Version]
- Li, X.; Xu, G.; Jiao, L.; Zhou, Y.; Yu, W. Multi-layer network community detection model based on attributes and social interaction intensity. Comput. Electr. Eng. 2019, 77, 300–313. [Google Scholar] [CrossRef]
- Lordan, O.; Sallan, J. Core and critical cities of global region airport networks. Physica A 2019, 513, 724–733. [Google Scholar] [CrossRef]
- O’Kelly, M. Global Airline Networks: Comparative Nodal Access Measures. Spat. Econ. Anal. 2016, 11, 253–275. [Google Scholar] [CrossRef]
- Ren, G.; Wang, X. Epidemic spreading in time-varying community networks. Chaos Interdiscip. J. Nonlinear Sci. 2014, 24, 023116. [Google Scholar] [CrossRef]

| Categories | Reference | Year | Approaches | Sketches |
|---|---|---|---|---|
| Low-Order Community Detection | [13] | 2002 | Based on betweenness | Could handle both weighted and directed graphs Improved the speed of the algorithm |
| [14] | 2004 | Based on shortest path betweenness | Tested for undirected unweighted edge Could handle more complicated network types | |
| [3] | 2005 | Based on the modularity Proposed by Newman and Girvan [14] | Tested for undirected unweighted graph | |
| [15] | 2007 | Based on successive neighborhoods | Potentially faster than most community finding algorithms Not as precise as Girvan and Newman’s method [14] | |
| [7] | 2013 | Degree-based core-vertex algorithm | Detected overlapping communities | |
| [16] | 2013 | Extended modularity Based on absorbing degree (EM-BOAD) algorithm | Detected overlapping communities in weighted complex networks | |
| [17] | 2014 | Enhanced NMF-based Method by neighborhood ratio matrix | Detected overlapping communities | |
| [18] | 2015 | Based on local community neighborhood ratio function | Detected non-overlapping communities for undirected and unweighted network | |
| [19] | 2017 | Map-Reduce approach | Detected communities in a large-scale network | |
| [4] | 2018 | hierarchical cluster Analysis based on the modularity proposed by Newman and Girvan [14] | Evaluated the result of network partitioning by calculating the difference between the number of edges within communities and the expected one. | |
| [20] | 2019 | Clauset–Newman–Moore modularity maximization algorithm | Added a traffic-driven indicator for weighted network | |
| High-order community detection | [21] | 2014 | BASH (based on maximal sub-graphs) algorithm | Detected overlapping communities |
| [22] | 2014 | ACC algorithm (based on the clustering coefficient of two neighboring maximal sub-graphs) | Detected overlapping communities | |
| [23] | 2014 | Based on the deep and bread searching for extracting all the maximal cliques | Detected overlapping communities for unweighted and weighted networks | |
| [24] | 2017 | Infomap-based algorithm | Reveal important modular regularities in the flows for sparse memory networks | |
| [11] | 2018 | Graph partitioning method based on Clique conductance minimization | Proposed a computationally efficient algorithm that approximately solves the optimization problem | |
| [25] | 2019 | Multi-layer motif (M-Motif) approach | Detected higher-order multi-layer communities | |
| [26] | 2019 | An attribute-based multi-layer network community detection algorithm (M-ALCD) | Addressed networks with sparse connections and high levels of noise |
| Operating Network | Codeshare Network | ||||||||
| Full-Service Carrier | IATA Code | Nodes | Edges | Edge-to-Node Ratio | Density | Nodes | Edges | Edge-to-Node Ratio | Density |
| American Airlines | AA | 204 | 1165 | 5.71 | 5.63% | 583 | 3014 | 5.17 | 1.78% |
| Delta Air Lines | DL | 234 | 1232 | 5.26 | 4.52% | 611 | 3318 | 5.43 | 1.78% |
| United Airlines | UA | 211 | 1155 | 5.47 | 5.21% | 612 | 3327 | 5.44 | 1.78% |
| China Southern Airlines | CZ | 222 | 1531 | 6.9 | 6.24% | 349 | 2311 | 6.62 | 3.81% |
| Lufthansa | LH | 181 | 533 | 2.94 | 3.27% | 489 | 2037 | 4.17 | 1.71% |
| China Eastern Airlines | MU | 237 | 1711 | 7.22 | 6.12% | 403 | 2811 | 6.98 | 3.47% |
| British Airways | BA | 208 | 453 | 2.18 | 2.10% | 486 | 1893 | 3.9 | 1.61% |
| Air China | CA | 195 | 976 | 5.01 | 5.16% | 333 | 2247 | 6.75 | 4.06% |
| Operating Network | |||||||||
| Low-Cost Carrier | IATA Code | Nodes | Edges | Edge-to-Node Ratio | Density | ||||
| Southwest Airlines | WN | 101 | 1492 | 14.77 | 29.54% | ||||
| Ryanair | FR | 220 | 3707 | 16.85 | 15.39% | ||||
| 95% Confidence Interval | ||
|---|---|---|
| k | Lower Bound | Upper Bound |
| 4 | 0.00013132 | 0.00737702 |
| Codeshare Network | ||||||
|---|---|---|---|---|---|---|
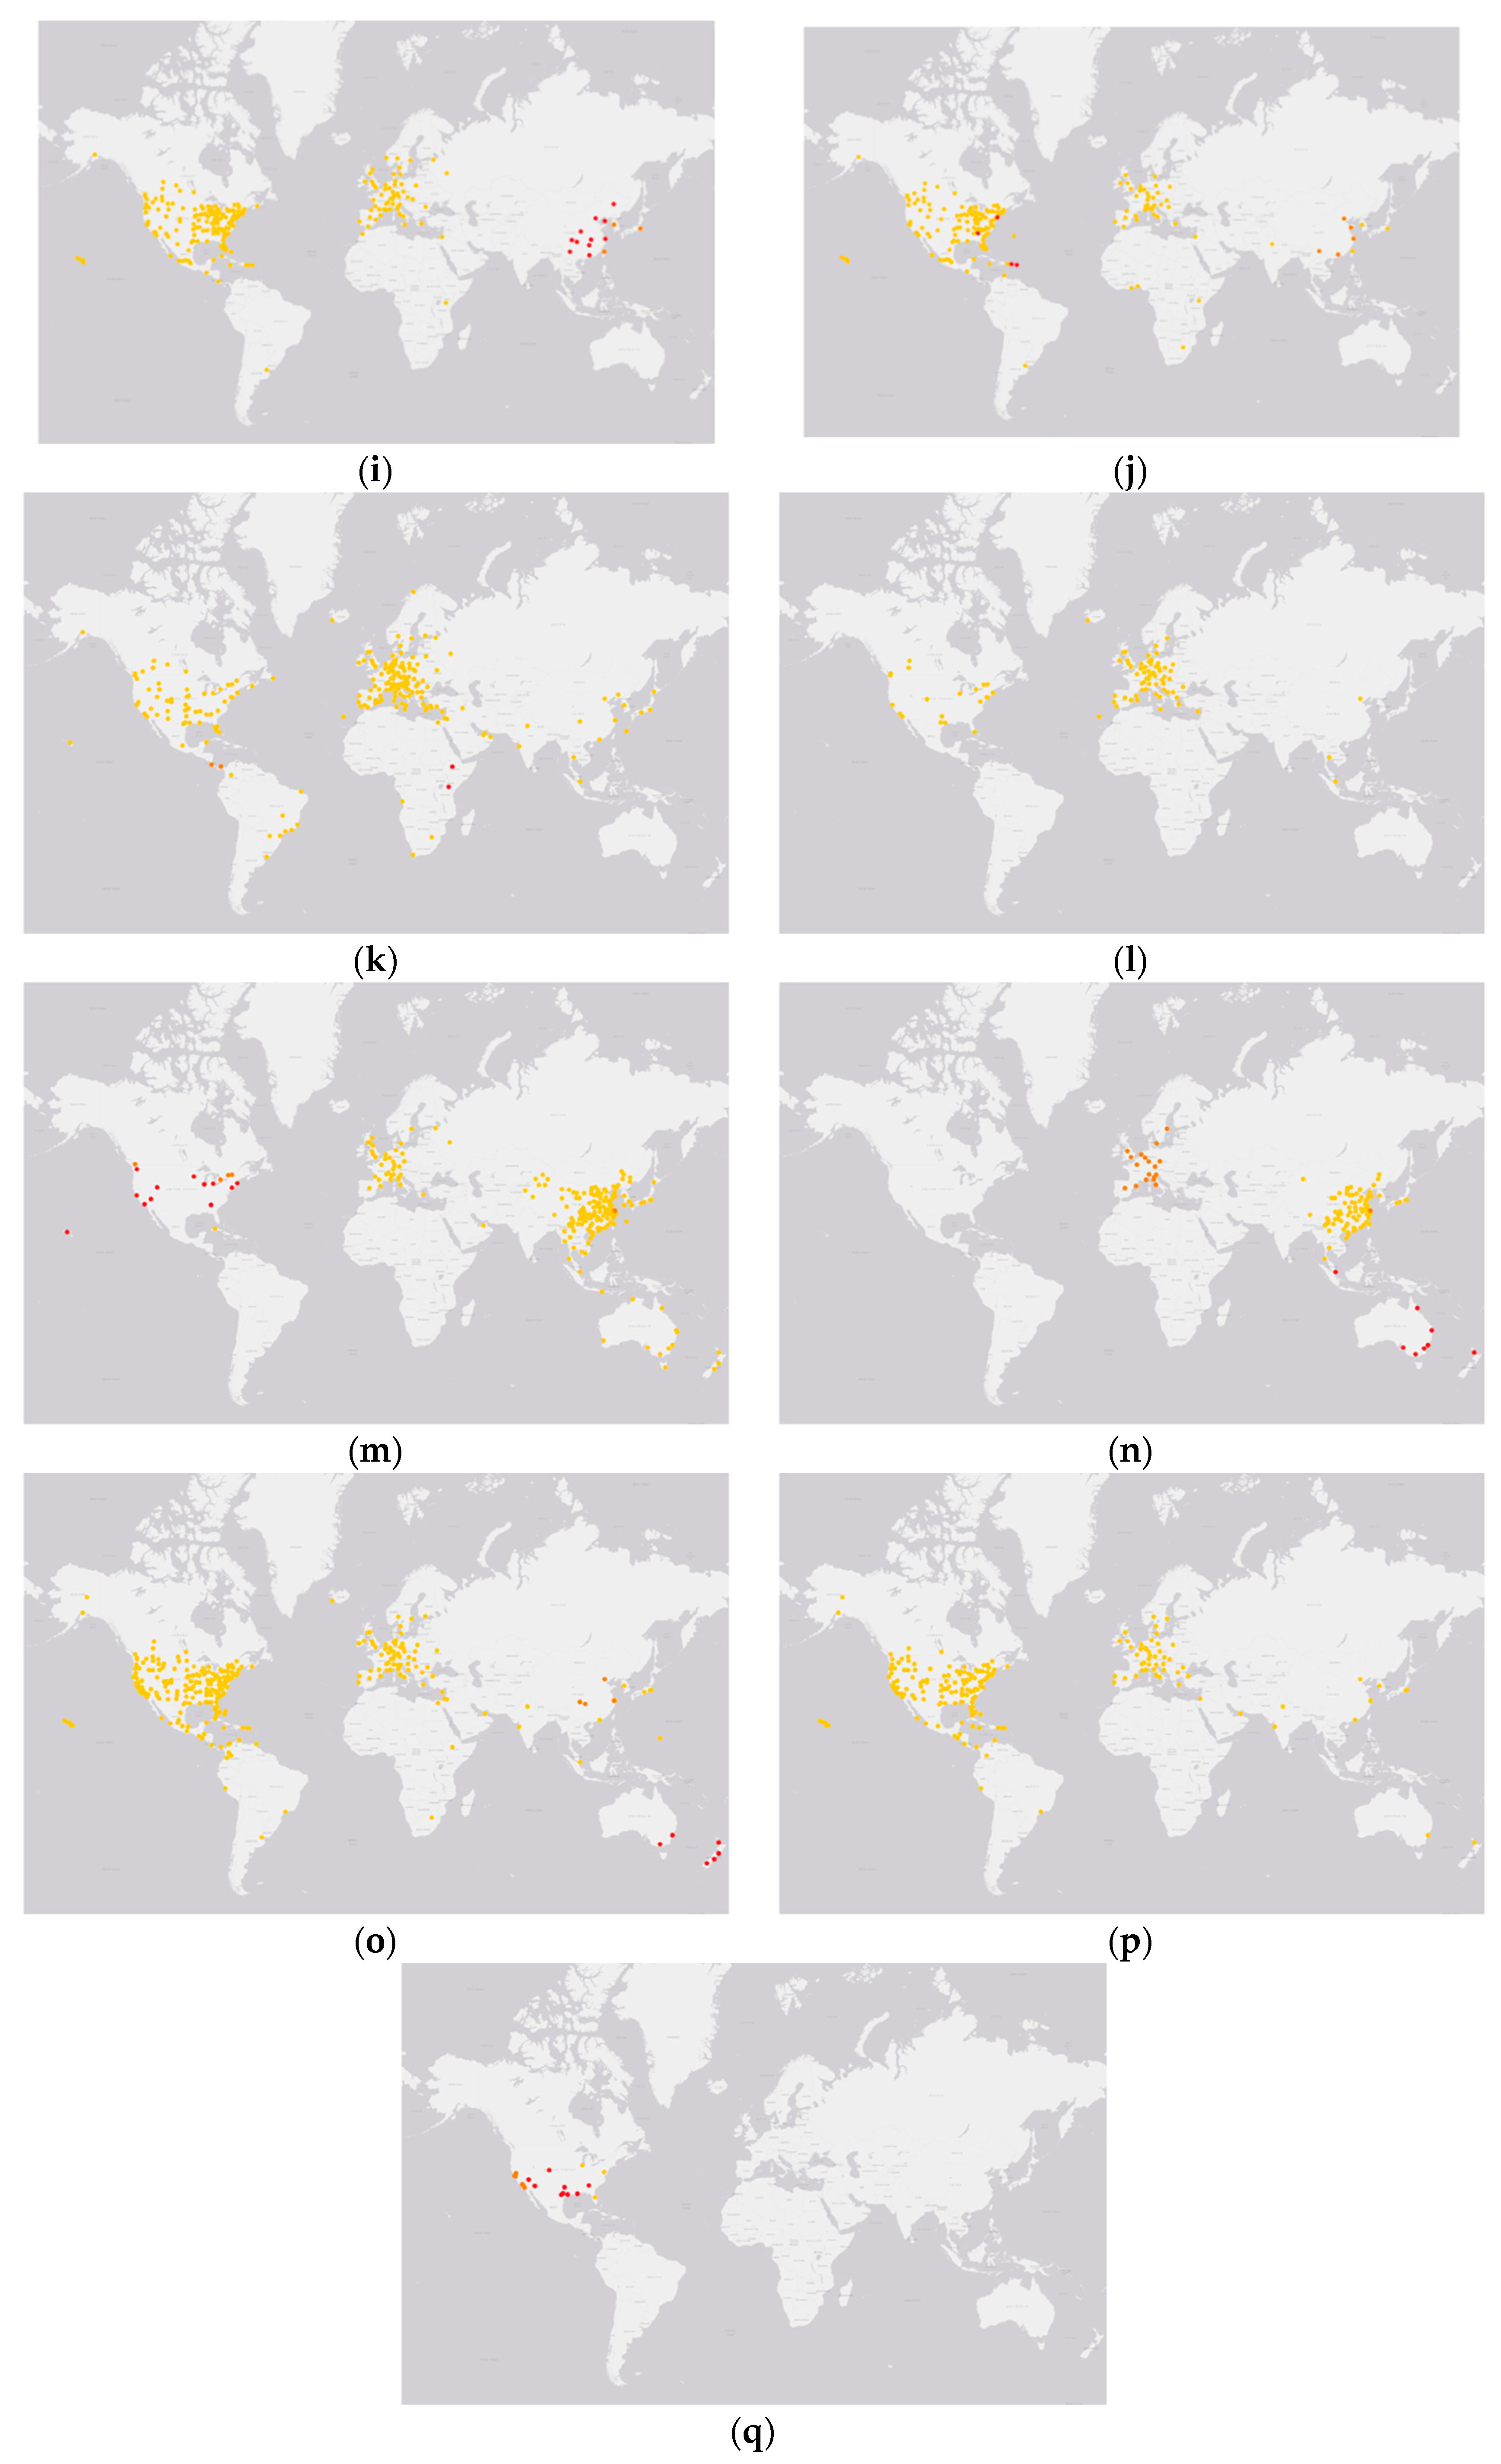
| Full-Service Carrier | IATA Code | The Number of 3-Clique Communities | Shared Nodes in 3-Clique Communities | The Number of 4-Clique Communities | Shared Nodes in 4-Clique Communities | The Number of Codeshare Partners |
| American Airlines | AA | 3 | LAX SEA | 3 | GRU LAX MIA | 44 |
| Delta Air Lines | DL | 3 | CAN ICN PVG | 3 | ATL CAN JFK PEK PVG | 35 |
| United Airlines | UA | 3 | AKL PEK SYD | 1 | – | 56 |
| China Southern Airlines | CZ | 3 | AMS | 3 | AMS URC | 27 |
| Lufthansa | LH | 3 | FRA | 1 | – | 57 |
| China Eastern Airlines | MU | 3 | PVG | 3 | CDG PVG SIN SYD | 33 |
| British Airways | BA | 3 | – | 3 | DUB JFK LHR | 39 |
| Air China | CA | 3 | – | 2 | PEK PVG | 46 |
| Low-Cost Carrier | ||||||
| Southwest Airlines | WN | 3 | DEN LAS MDW PHX | – | – | 0 |
| Ryanair | FR | – | – | – | – | 1 (RR) |
Publisher’s Note: MDPI stays neutral with regard to jurisdictional claims in published maps and institutional affiliations. |
© 2021 by the authors. Licensee MDPI, Basel, Switzerland. This article is an open access article distributed under the terms and conditions of the Creative Commons Attribution (CC BY) license (https://creativecommons.org/licenses/by/4.0/).
Share and Cite
Yang, H.; Le, M. High-Order Community Detection in the Air Transport Industry: A Comparative Analysis among 10 Major International Airlines. Appl. Sci. 2021, 11, 9378. https://doi.org/10.3390/app11209378
Yang H, Le M. High-Order Community Detection in the Air Transport Industry: A Comparative Analysis among 10 Major International Airlines. Applied Sciences. 2021; 11(20):9378. https://doi.org/10.3390/app11209378
Chicago/Turabian StyleYang, Huijuan, and Meilong Le. 2021. "High-Order Community Detection in the Air Transport Industry: A Comparative Analysis among 10 Major International Airlines" Applied Sciences 11, no. 20: 9378. https://doi.org/10.3390/app11209378
APA StyleYang, H., & Le, M. (2021). High-Order Community Detection in the Air Transport Industry: A Comparative Analysis among 10 Major International Airlines. Applied Sciences, 11(20), 9378. https://doi.org/10.3390/app11209378