1. Introduction
To overcome the ever increasing freshwater demand due to population growth and welfare concerns, the first desalination plants were installed in the late 1950s [
1,
2,
3].
The first technologies were thermally driven due to the low cost of fossil fuels (less than
$3 for one barrel of oil). As the cost of energy has progressively increased, two lines of research have been pursed in order to minimize the total cost of water treatment [
1,
4]:
For example, in the first case the number of stages in Multi-Stage Flash (MSF) distillation has progressively increased from 8–12 to 20 [
5,
6]. As regards the proposal of innovative solutions, the introduction of semipermeable membranes represents a radical change in the desalination sector. In fact, nowadays Reverse Osmosis (RO) is the most used technology for this purpose [
7].
The term “desalination” refers to the technological process used to extract freshwater from brackish or saltwater. Seawater is often the raw water source used to supply this process.
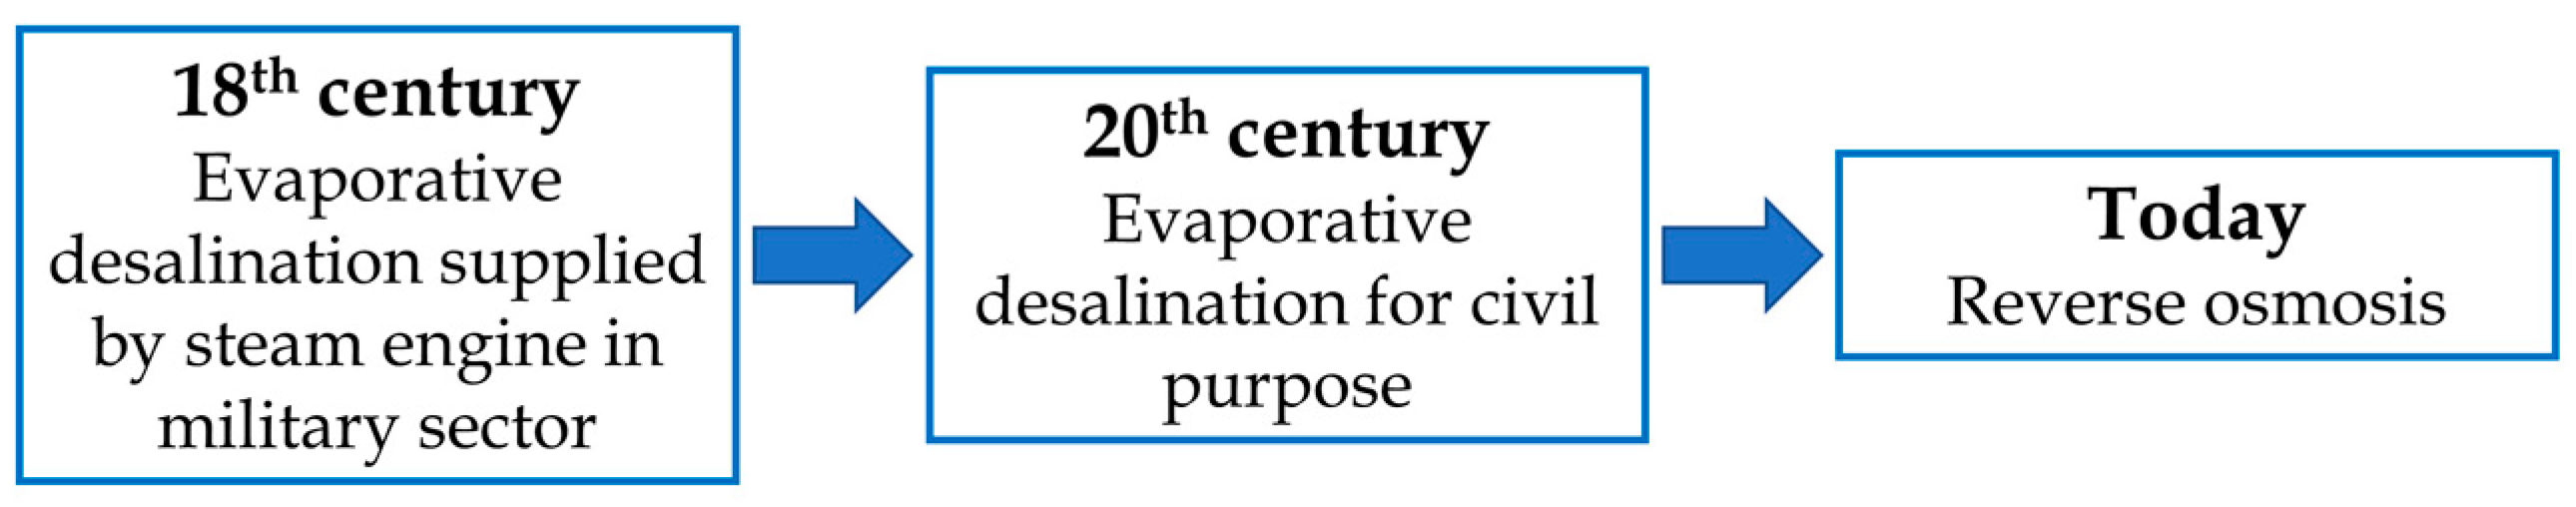
Historically, the idea behind the desalination process was introduced by the Royal Navy (the United Kingdom’s naval warfare force) at the end of the 18th century with the purpose of increasing navigational autonomy without storing more water on the ships [
8].
Since in that period ships were equipped with steam engines, the first desalination technology was single flash distillation, which was improved in the following years into the more efficient MSF.
The first type of desalination unit was realized by the G. and J. Weir in 1885 in Glasgow (Scotland) [
9]. This company, which later became known as Weir Westgarth, practically had a monopoly as a desalination unit builder until World War II.
In the following years, desalination plants had been installed around the world for civil purposes. In 1907, a Dutch company installed the first desalination plant in the Arabian Gulf countries in the city of Jeddah [
10]. By the order of King Abdulaziz Al Saud, the same plant was replaced in 1928, with two units produced by Weir Westgarth being installed (with a total installed capacity of 135 m
3/day) [
10].
In 1953 other desalination plants were installed in Qatar and Kuwait. In detail, 5 units were installed in Qatar, with a total capacity equal to 682 m
3/day, and 10 units in Kuwait, with a total capacity of 4545.5 m
3/day. In 1955 another 10 units were installed in Shuwaikh (Kuwait), which were the same size [
10]. From this moment on, desalination plants expanded around the world, with the birth of many companies such as Krupp in Germany, Westinghouse in the USA, and SIR (Società Italiana Resine) in Italy [
8].
The other mainstream technique is RO, based on semipermeable membranes. Historically, the phenomenon of osmosis was observed for the first time in 1748 by Jean-Antoine Nollet, without any application for about two centuries [
11].
In the USA the first studies were started by the researchers Sidney Loeb and Srinivasa Sourirajan in 1956 at the University of California and the University of Florida, respectively. The first membrane was realized in 1959 whereas the first pilot plant was installed in 1965, with a capacity of 19 m
3/day [
8].
An improvement of this technique was obtained by the development of asymmetric membranes that show a different porosity moving from a face to the other one, allowing a greater water flux through them [
11].
The slow diffusion of RO was initially due to the high electricity consumption required to produce freshwater in comparison with other techniques, and the limited life of semipermeable membranes [
8]. The first applications were related to brackish water, due to its lower osmotic pressure in comparison with seawater.
The first desalination plant, based on RO, for a municipality was realized in 1977 in the USA, with an installed capacity of 11,350 m
3/day. In the same area, in 1985 another big desalination plant was realized, having an installed capacity equal to 56,800 m
3/day [
11].
Great technological progress occurred in the process of reverse osmosis thanks to the increase in membrane lifetimes and the adoption of energy recovery devices to reduce the energy requirements for the process. So, nowadays RO is applied to seawater and is economically competitive with the other technologies. This improvement was achieved during the 1990s thanks to the introduction of an energy recovery system based on the introduction of hydro turbines or similar systems before returning the brackish water to the sea [
8].
Currently, RO is the most widespread technology for desalination, followed by MSF and Multi-Effect Distillation (MED). According to the statistics, in the last year the total installed capacity was based essentially on three technologies: RO (68.7%), MSF (17.6%), MED (6.9%). The other technologies had a marginal role (6.8%) [
12]. Desalination plants are installed around the world but are mainly concentrated in Middle East and North Africa (47.5% of global capacity). The main raw water source is represented by seawater (70.5% of global capacity) [
12].
Several technologies are currently under investigation, with the goal being to reduce the energy demand for freshwater production.
Authors’ Contribution
As described above, the desalination sector is quite variegated and subject to continuous research and development. Different technologies have been developed during more than a century. Since new solutions are currently under development, the authors want to outline a detailed review on the state of the art of desalination, showing the working principles and reporting some information on the diffusion of each technology. The review also includes the new frontiers of research, like for example, technologies based on water freezing or directly run by solar radiation.
Since energy saving and the adoption of renewable energy sources are mainstream topics, all reported technologies are described in detail to clarify the main energy input that is required to run the process. In this way, each desalination technology can be easily coupled with renewable energy sources.
The paper is structured in the following way:
Section 2 reports the state of the art of desalinating technologies, classifying them in the first part and consequently reporting the detailed description of each solution in the following paragraphs.
Section 3 reports some technical statistics, among which are the specific energy demand, the installed global capacity and the development status. Finally, the conclusions are reported in
Section 4.
2. The State of the Art
Today, desalination can be realized using several technologies. In general, a desalination plant includes different processes to obtain freshwater, among which the desalination unit is the most energy expensive component. A desalination plant normally includes [
6]:
Intake, composed by pumps and pipes to take water from the source (sea or brackish water)
Pre-treatment, consisting of the filtration of raw water to remove solid components and the addition of chemical substances to reduce the salt’s precipitation and the corrosion inside the desalination unit
Desalination, where freshwater is extracted from saltwater
Post-treatment, to correct pH by adding selected salts to meet the requirements of the final uses.
As introduced before, the desalination process represents the most energy consuming water treatment. For this reason, this topic is quite widely assessed in literature.
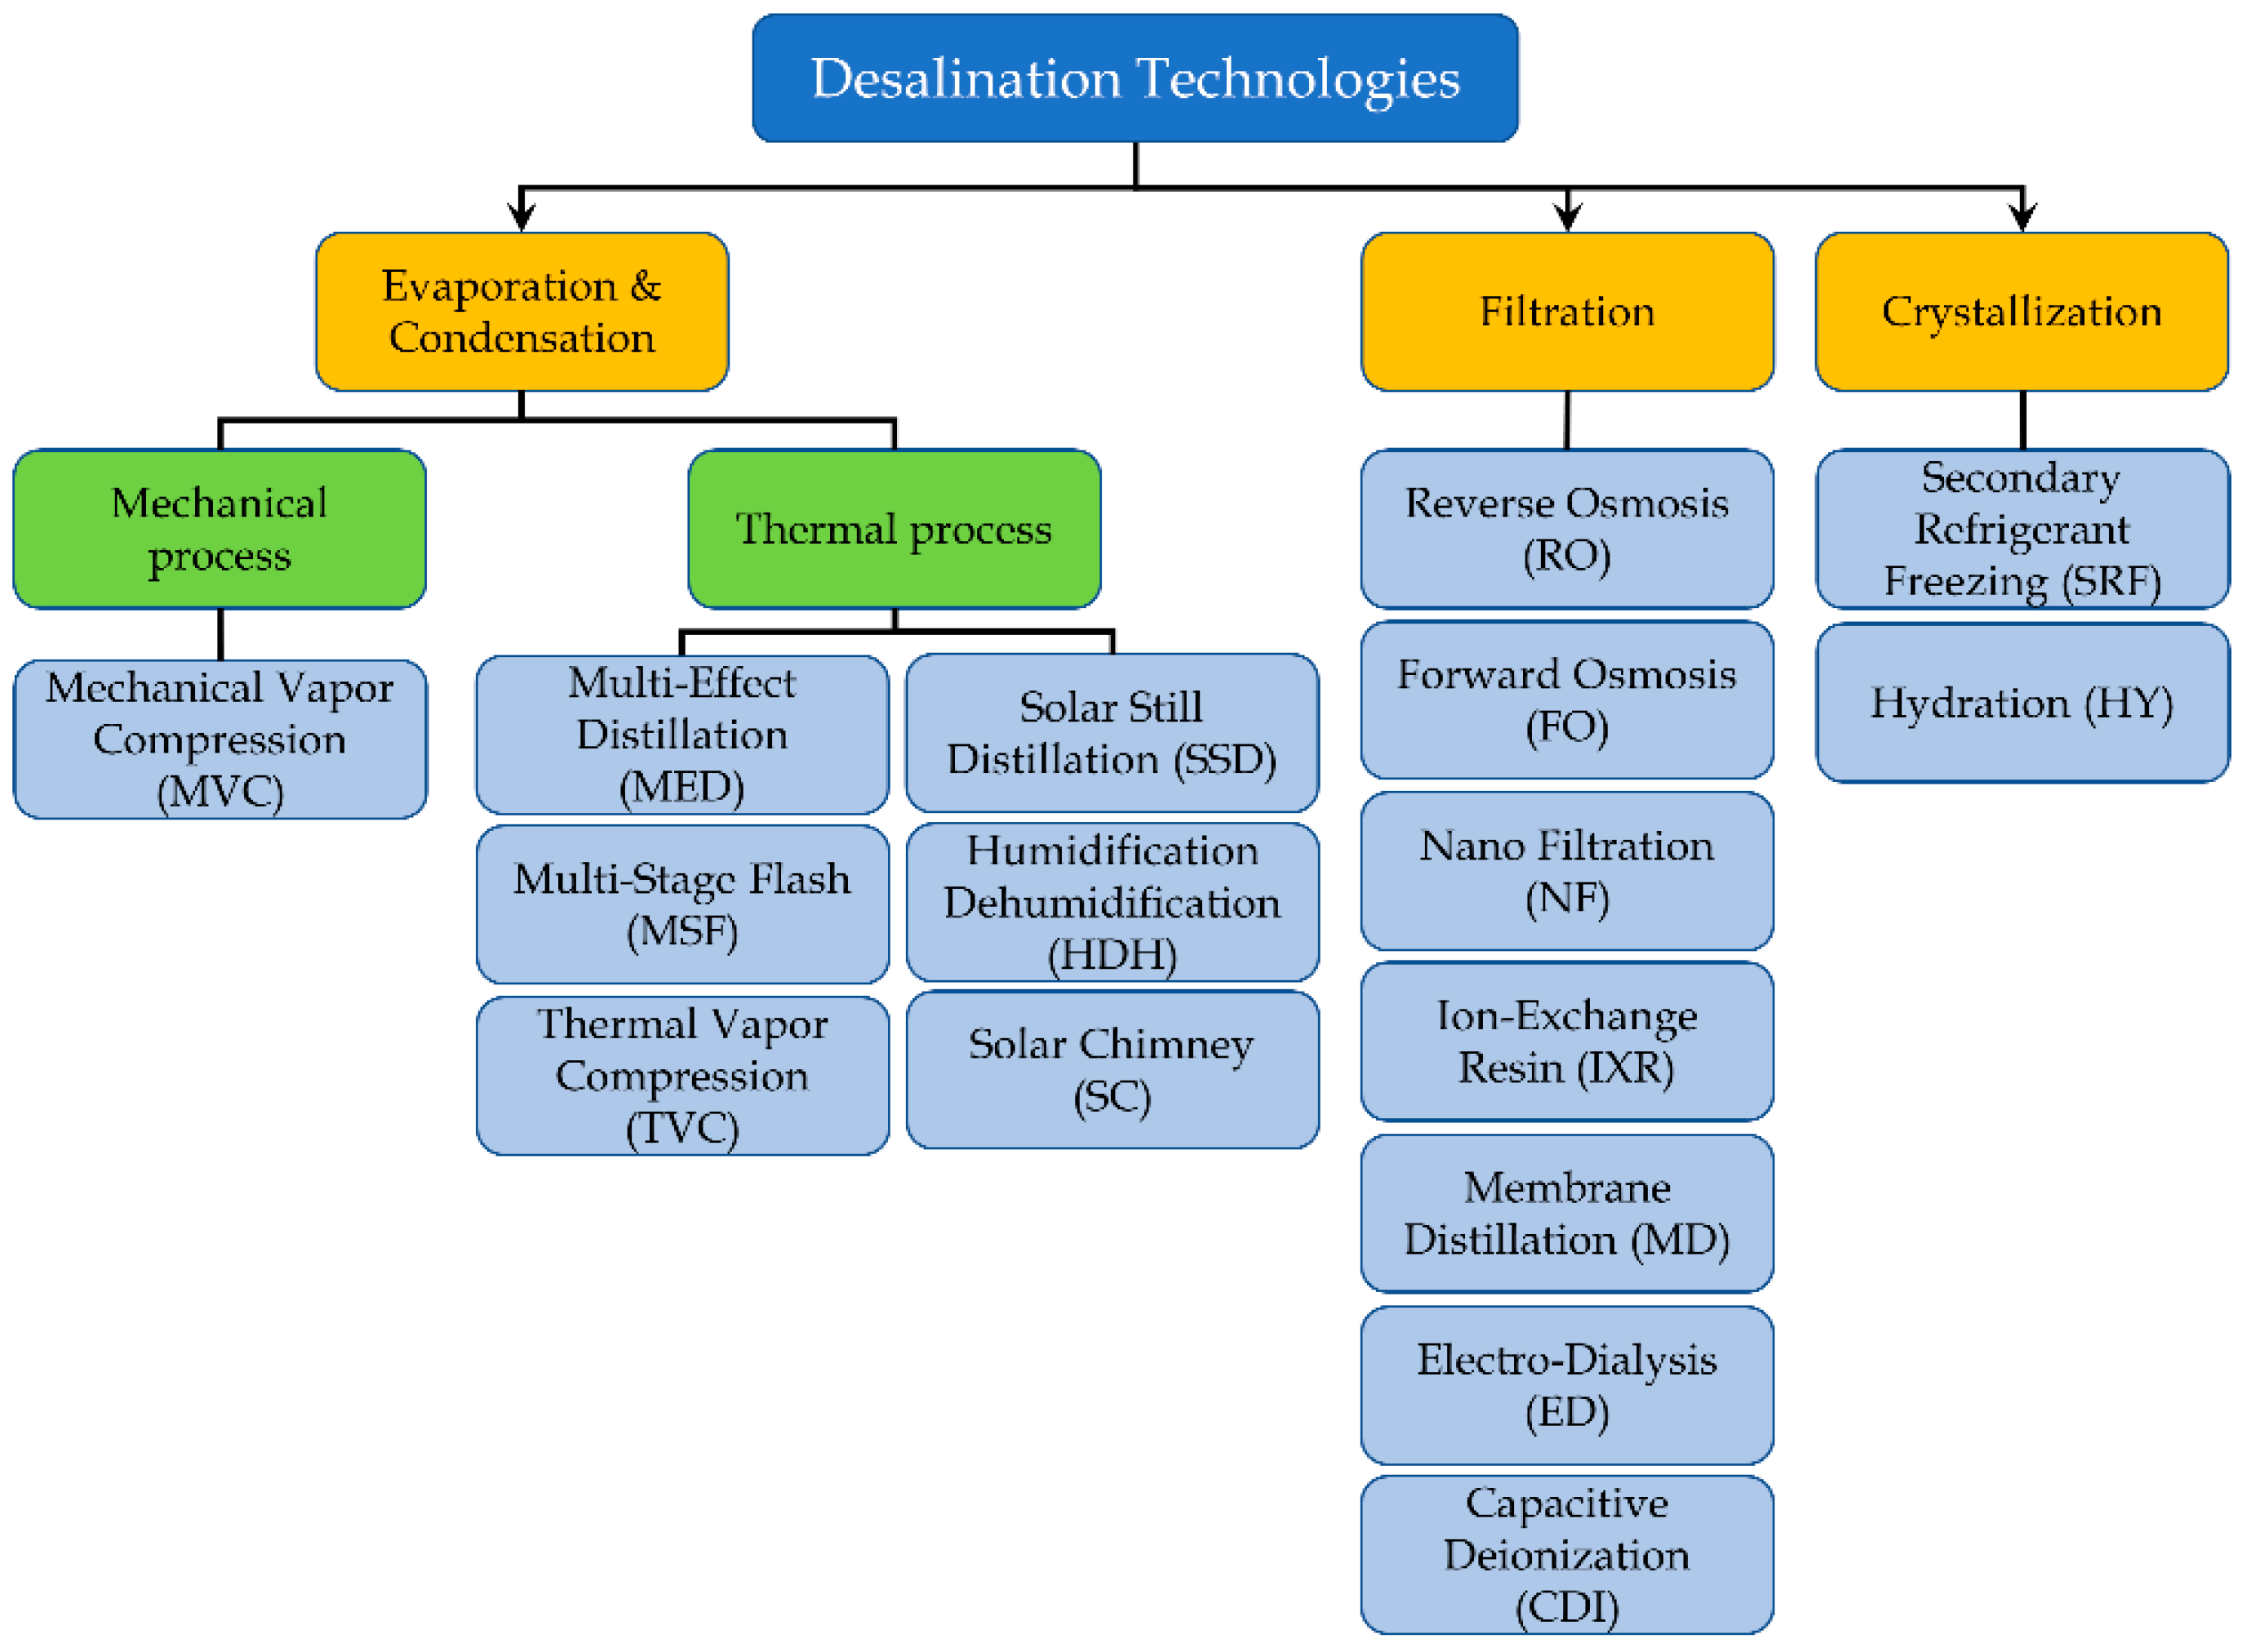
Before analyzing the specific solutions, a classification is required. Alkaisi suggested three main categories [
13]: Evaporation and Condensation, Filtration and Crystallization.
The following
Figure 1 shows an upgrade of the classification proposed by Alkaisi, integrating the new technologies currently under investigation.
Evaporation and Condensation technologies are the first desalination techniques to be historically introduced and used for civil freshwater production. The idea is to supply thermal energy to seawater, producing a vapor, and then condensate it. This energy can be generated by using the heat from a thermal process (for example, waste heat or fuel combustion), or through a mechanical process. In the first case, the most common technologies are MED, MSF, Thermal Vapor Compression (TVC) and Membrane Distillation (MD). Currently other approaches are under investigation, and among these we can find few new solutions supplied by solar radiation: Solar Still Distillation (SSD), Solar Chimney (SC) and Humidification-Dehumidification (HDH) desalination.
Regarding the mechanical processes used to produce freshwater through the evaporation and condensation of seawater, the main technique is Mechanical Vapor Compression (MVC) [
14,
15].
In case of filtration technologies, all solutions are essentially based on a semipermeable membrane, i.e., a layer that shows a different mode of crossing behavior according to the sizes or nature of molecules. The only exception is Ion-exchange resins (IXR), where natural or artificial materials are used to capture the dissolved ions in a chemical way [
16].
In this context RO is the most used technology for desalination. The Electrodialysis (ED) and Ion Exchange Resin (IXR) are used to produce water with a very limited concentration of salts. Other techniques, as Forward Osmosis (FO), Nano Filtration (NF) and Capacitive Deionization (CDI) are in the development stage [
17].
Finally, the Crystallization category comprises techniques that extract freshwater producing ice as intermediate product. As example, the main techniques are Secondary Refrigerant Freezing (SRF), Hydration (HY) and Vacuum Freezing (VF) desalination. All these approaches are under investigation [
18]. A timeline showing the evolution of desalination is shown below in
Figure 2.
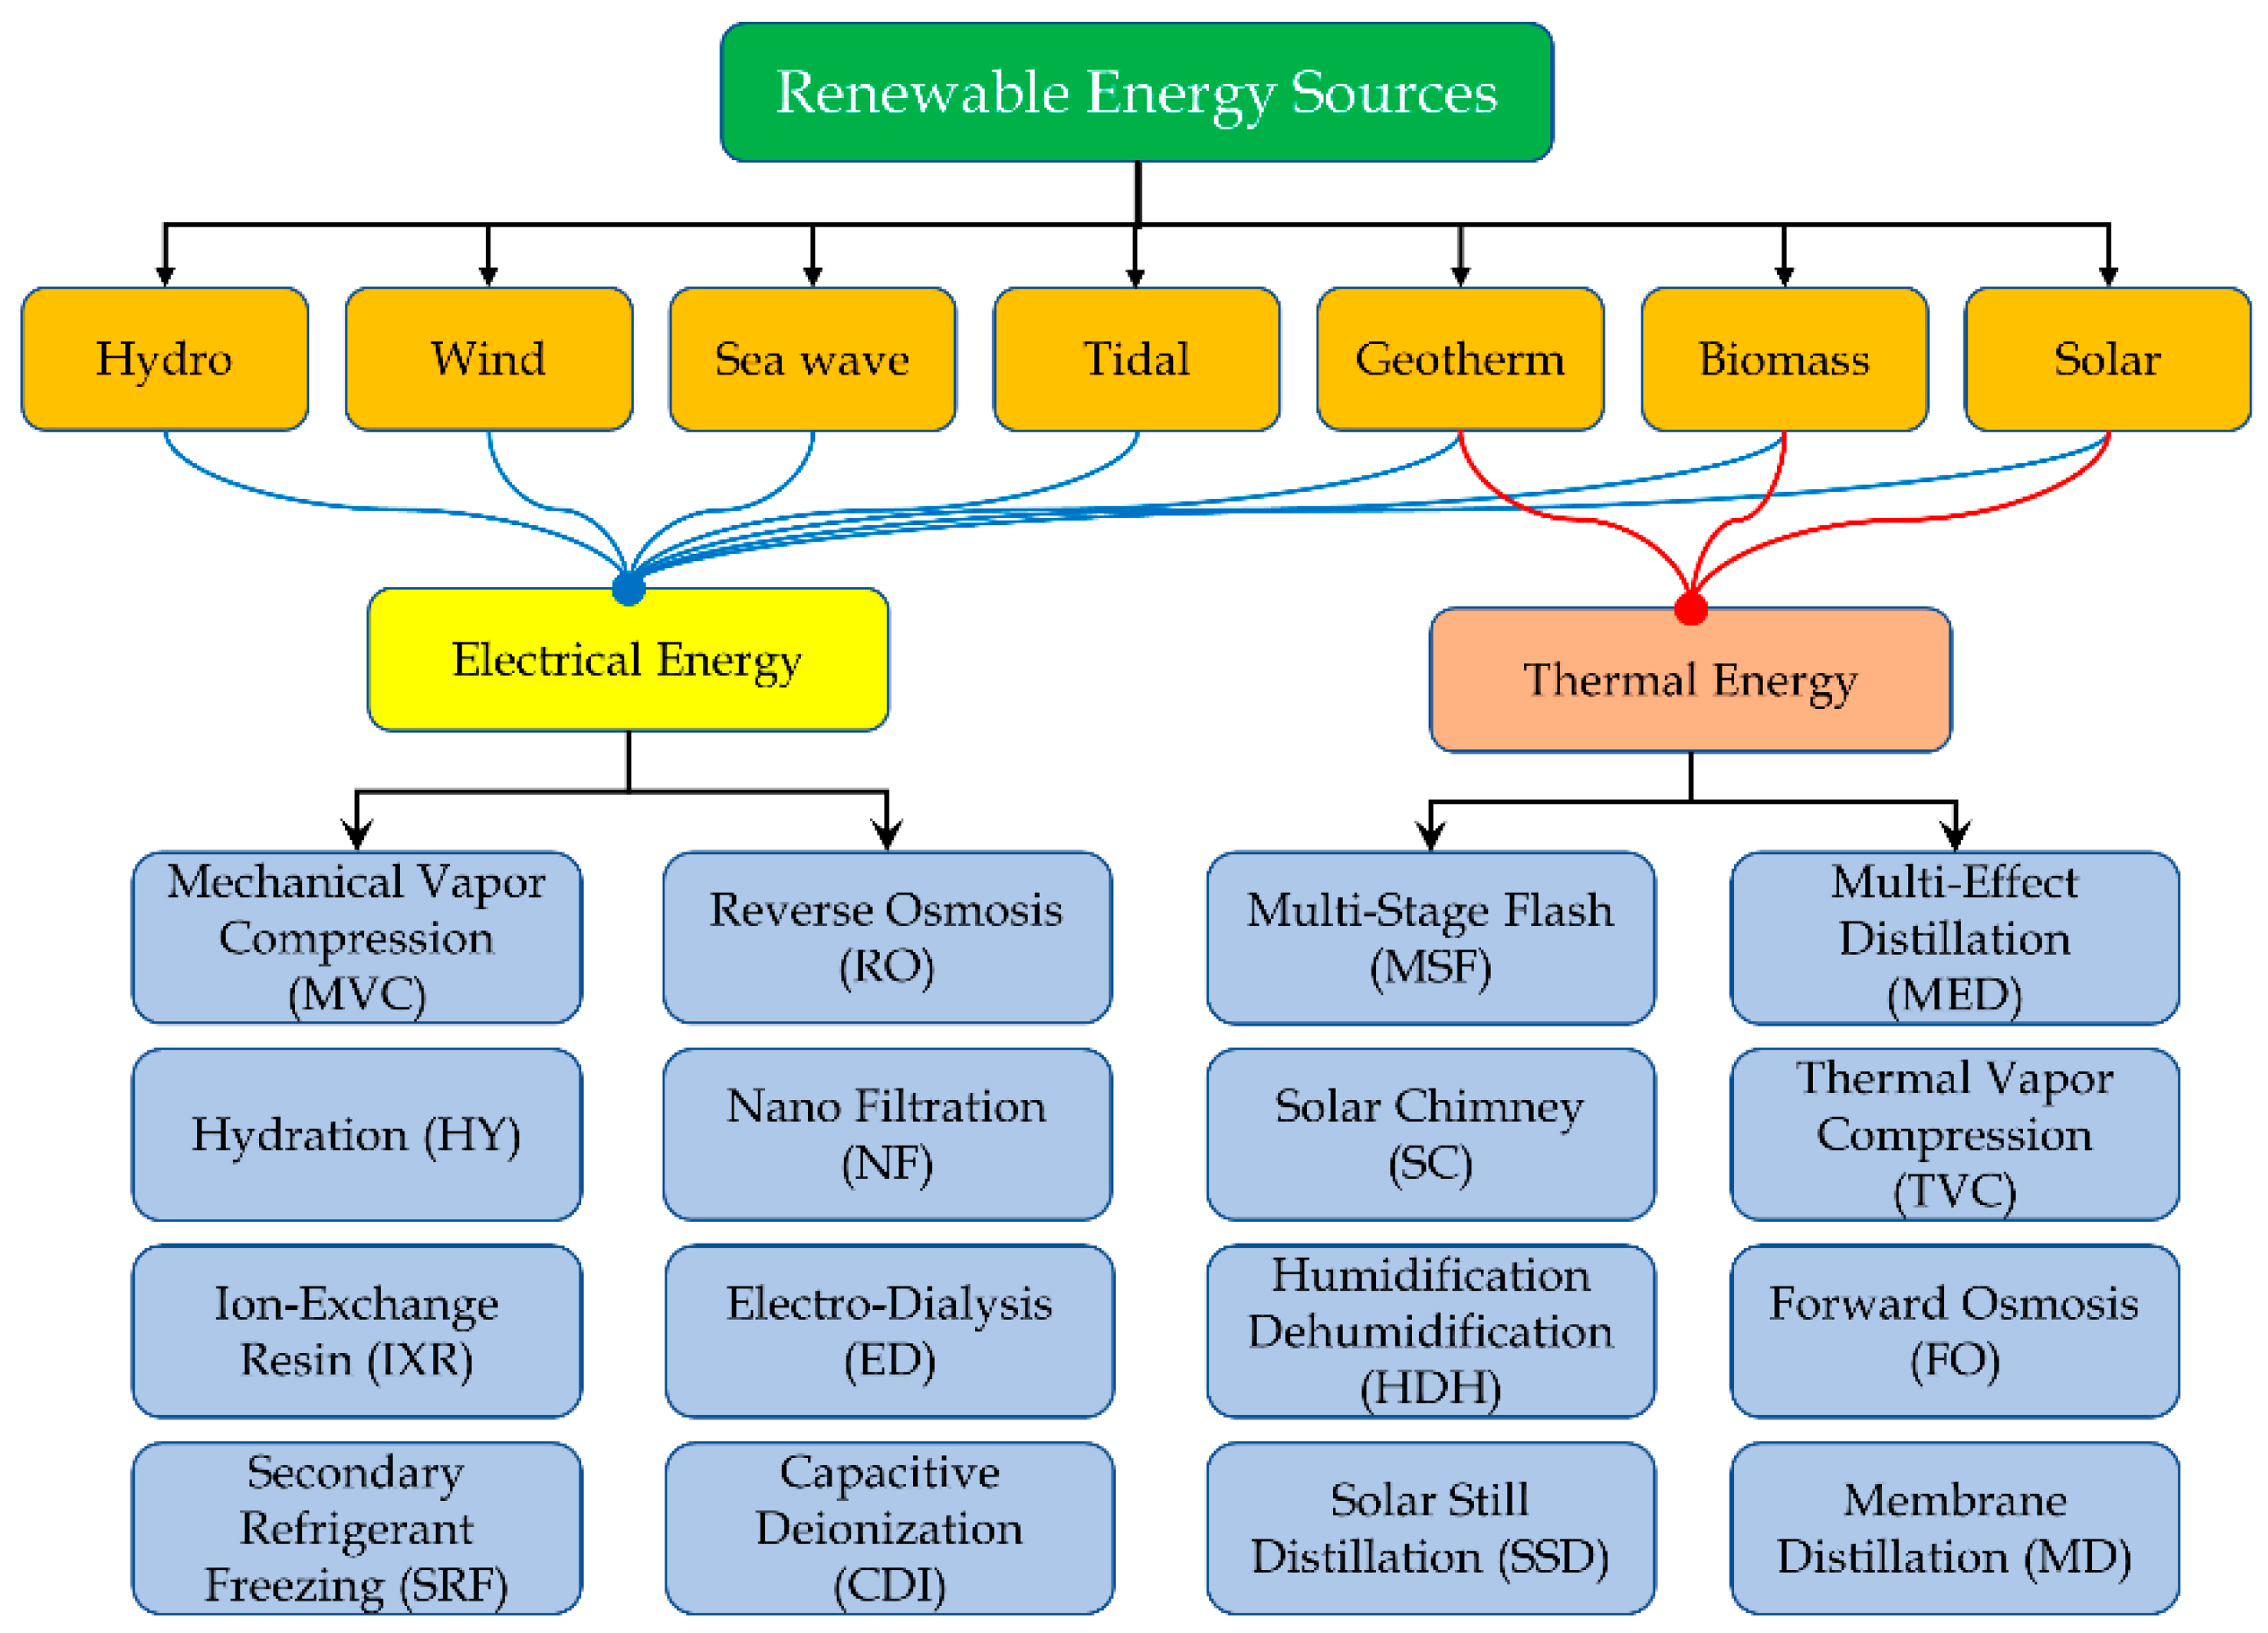
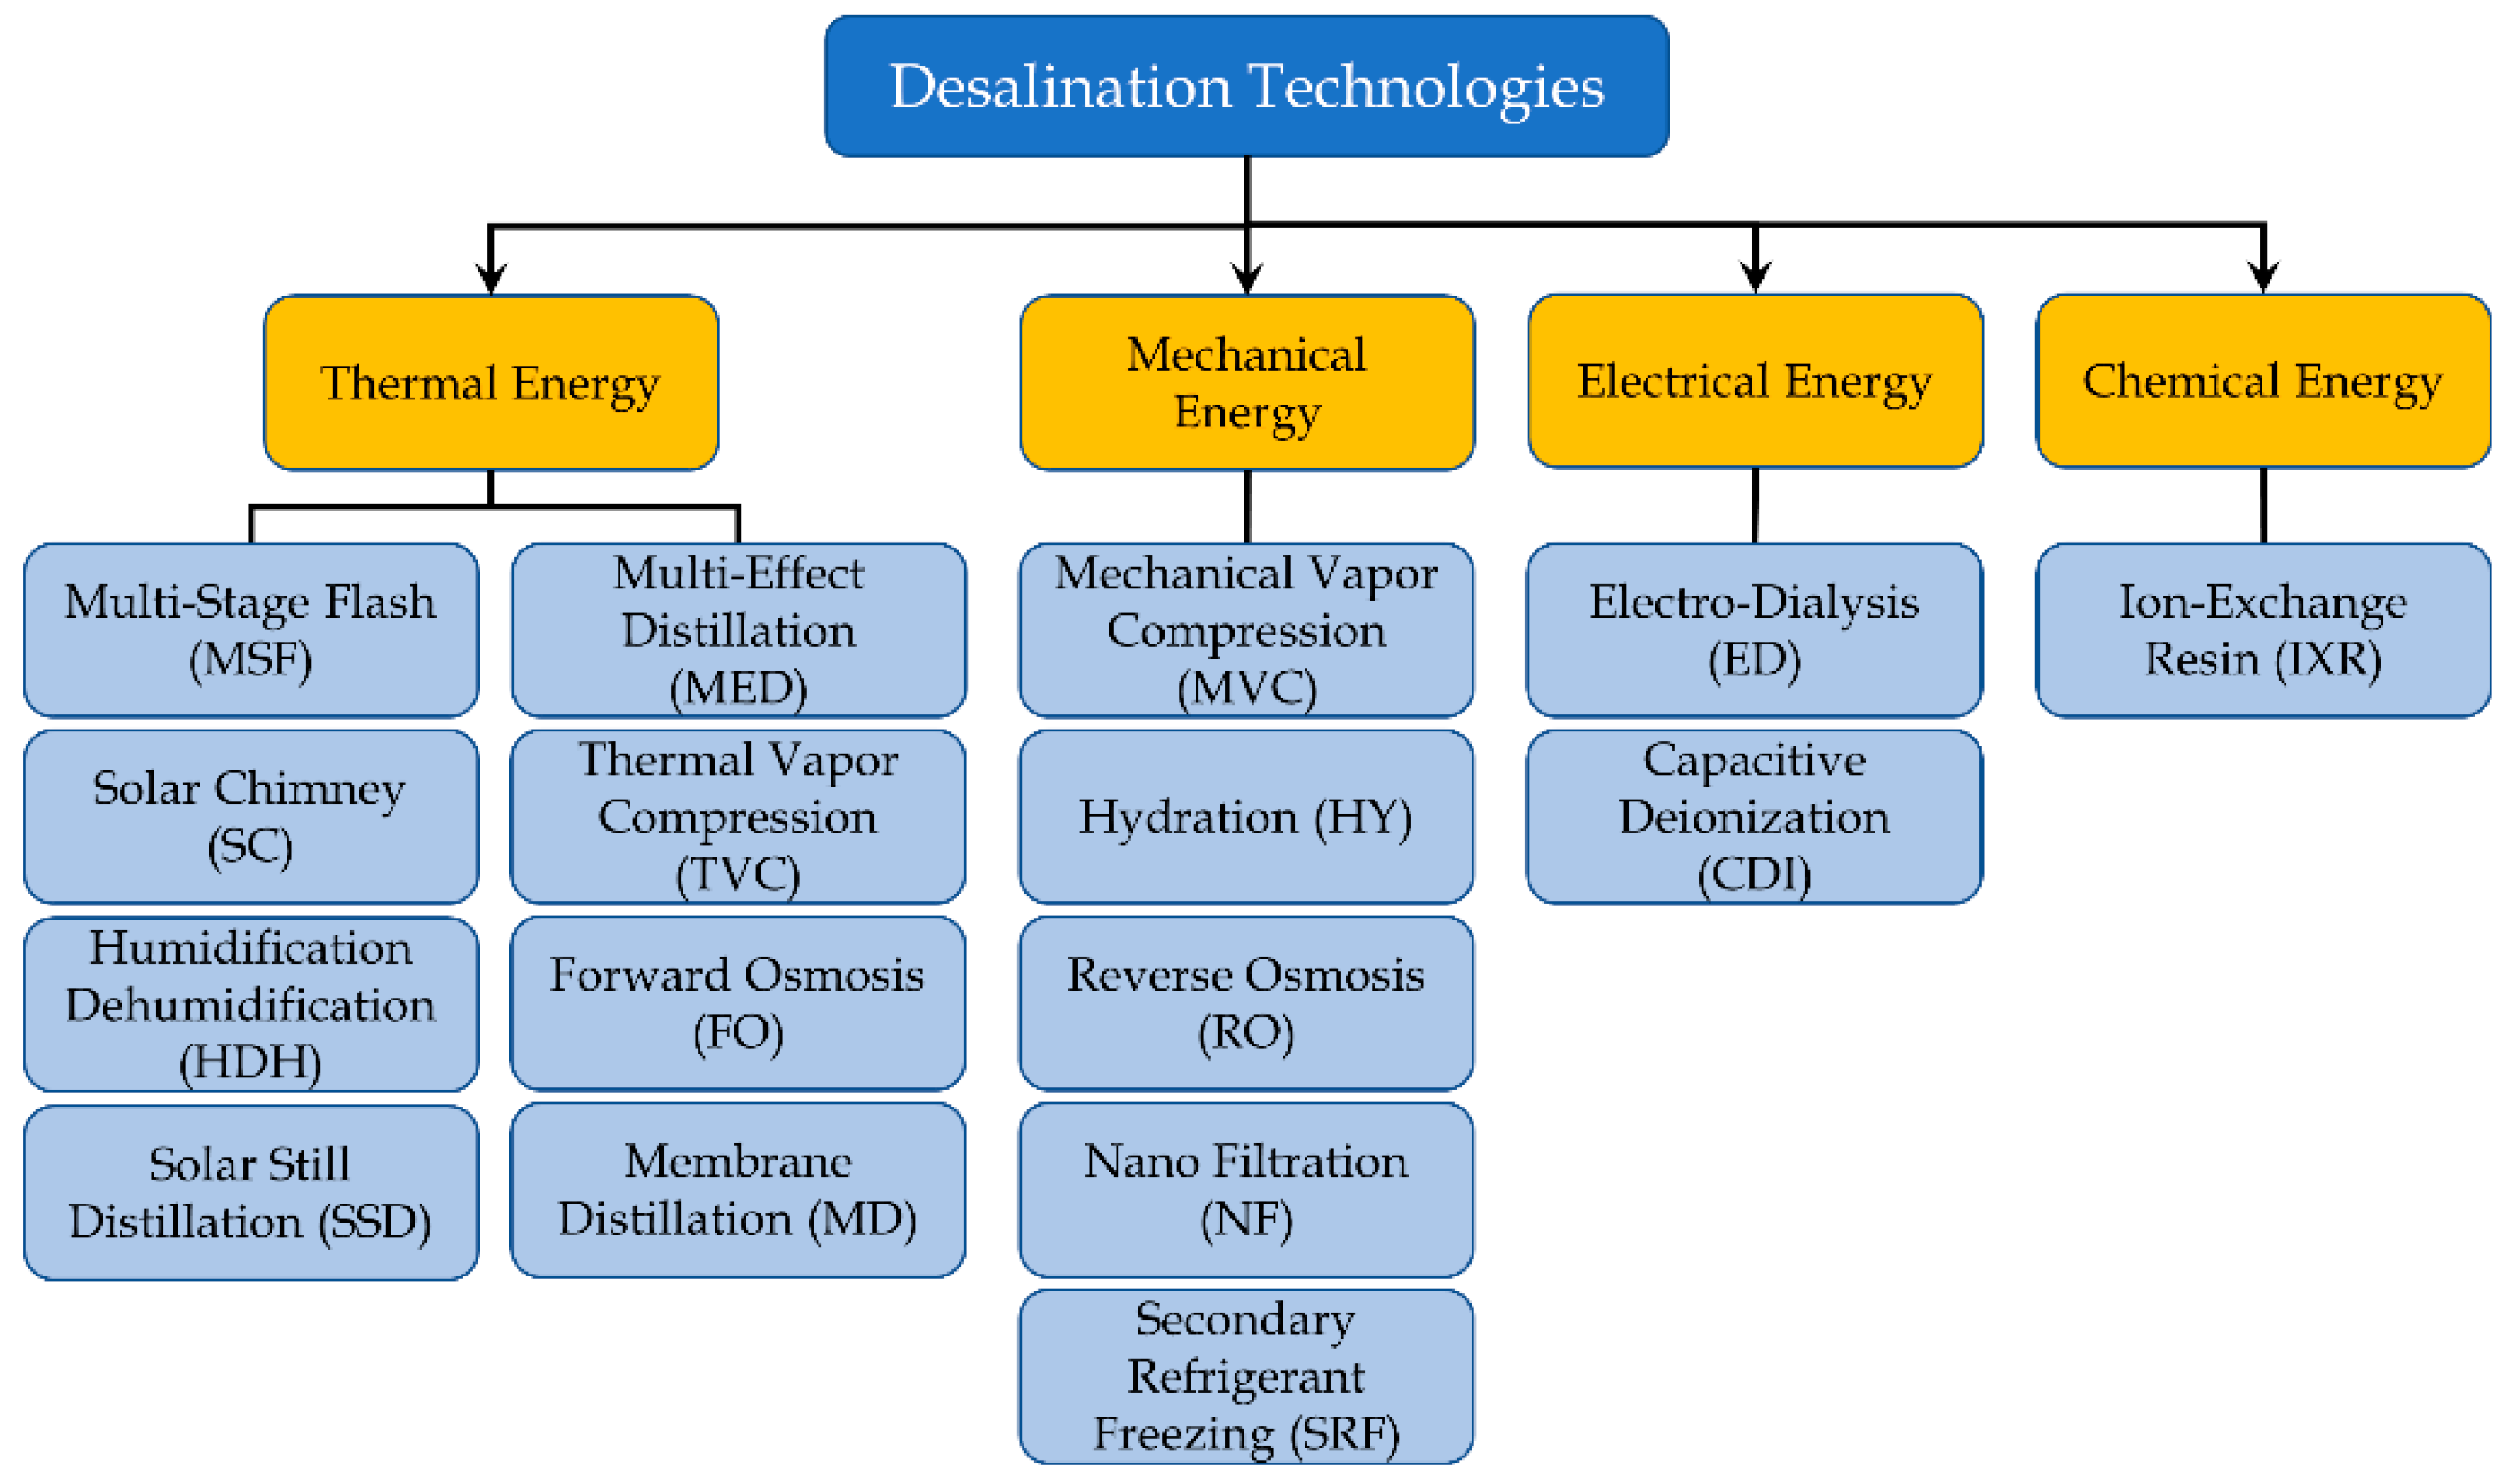
Another useful classification can be realized by considering the kind of energy mainly required to run the process, as shown in
Figure 3. This aspect is important for select renewable energy sources to supply the desalination process [
19]. In detail, four kinds of energy are considered here:
Thermal energy
Mechanical energy
Electrical energy
Chemical energy
The first category could be supplied by solar thermal or geothermal energy sources. It comprises the following technologies: MSF, MED, TVC, MD, SC, HDH and SSD. In particular, the last three approaches are designed to directly exploit solar radiation [
20].
The group of technologies requiring a Mechanical Energy as input comprises MVC, RO, NF, SRF, HY. All these techniques are characterized by the presence of pumps and compressors, which require a major part of the total energy demand for the process.
The last two categories have limited examples. Electrodialysis and Capacitive Deionization desalination require the generation of an electric field between two electrodes, separated by an anion membrane and a cation membrane (selective membranes that allow positive and negative ions to cross, respectively). In this case, electricity is the only way to supply the process.
As regards the Ions Exchange Resin, the working principle is the chemical replacement of positive and negative ions. In the case of FO, a solute replacement occurs to extract water from a saline solution.
It is important to underline that mechanical energy and electricity can be easily converted in both directions, with high efficiency. For this reason, the technologies that require a mechanical energy input, through pumps or compressors, can be easily supplied by electricity by using common electrical motors. Similarly, mechanical energy can be converted by alternators into electricity to supply the desalination processes that require electrical energy as input.
Thermal energy is a different case, because it can be easily obtained from electricity, through the Joule Effect or heat pumps. The conversion from thermal energy into mechanical or electrical energy is obtained by using thermal machines or plants, affected by a low energy efficiency in comparison with the previous cases, for thermodynamic and technical reasons.
It is important to underline that thermal sources can be successfully adopted to produce electricity, in specific conditions. For example, in the case of a high temperature geothermal source, a power plant can be realized [
21].
Thus, in order to supply the desalination process with renewable energy sources, it is convenient to distinguish the energy sources that can be used to produce electricity (or mechanical energy) from those producing thermal energy.
With this goal, the renewable energy sources can be sorted in the following categories, according to the usual energy output that can be produced:
Electricity producers, such as wind, hydro, tidal and wave.
Thermal and electrical energy producers, such as solar, geothermal and biomass. The energy output is usually selected according to the features of the local energy resource.
Combining the technologies for renewable energy sources utilization and the desalination solutions,
Figure 4 is obtained.
In the following paragraphs, each technology is analyzed in detail, describing the entire process, and reporting the state of the art.
2.1. Multi-Effect Distillation (MED)
The first MED plant was realized in Kuwait in the 1950s, using a triple-effect submerged tube evaporator. Despite being the first technology for desalination to be introduced, MED did not spread because it is particularly affected by the scaling problem on the pipes in comparison with other thermally supplied desalination technologies [
22]. However, from the 1980s several research projects have been realized about MED, investigating lower temperatures to reduce the scaling issues and the corrosion of the pipes [
23]. MED is also currently used in food industries to extract juice from sugarcane, and to produce salts from seawater [
24].
MED units can be arranged in several configurations, taking into consideration the shape of the heat exchangers or the brine flow direction regarding the vapor direction. The effects can be assembled in one line or in two parallel lines, working at different pressures in order to optimize the heat recovery [
22,
25]. According to the Top Brine Temperature (TBT), MED can be classified as Low Temperature (below 90 °C) or High Temperature (over 90 °C).
To reduce the energy costs, steam is usually spilled from a steam turbine inside a power plant or recovered from a waste energy source in industrial processes [
23]. As the primary steam is not in direct contact with saline water, the condensate inside the evaporator is normally recycled to the boiler for reuse [
23].
The maximal temperature of brine is limited to 120 °C by the calcium sulphate scaling, while the minimal is related to the available temperature in the wave.
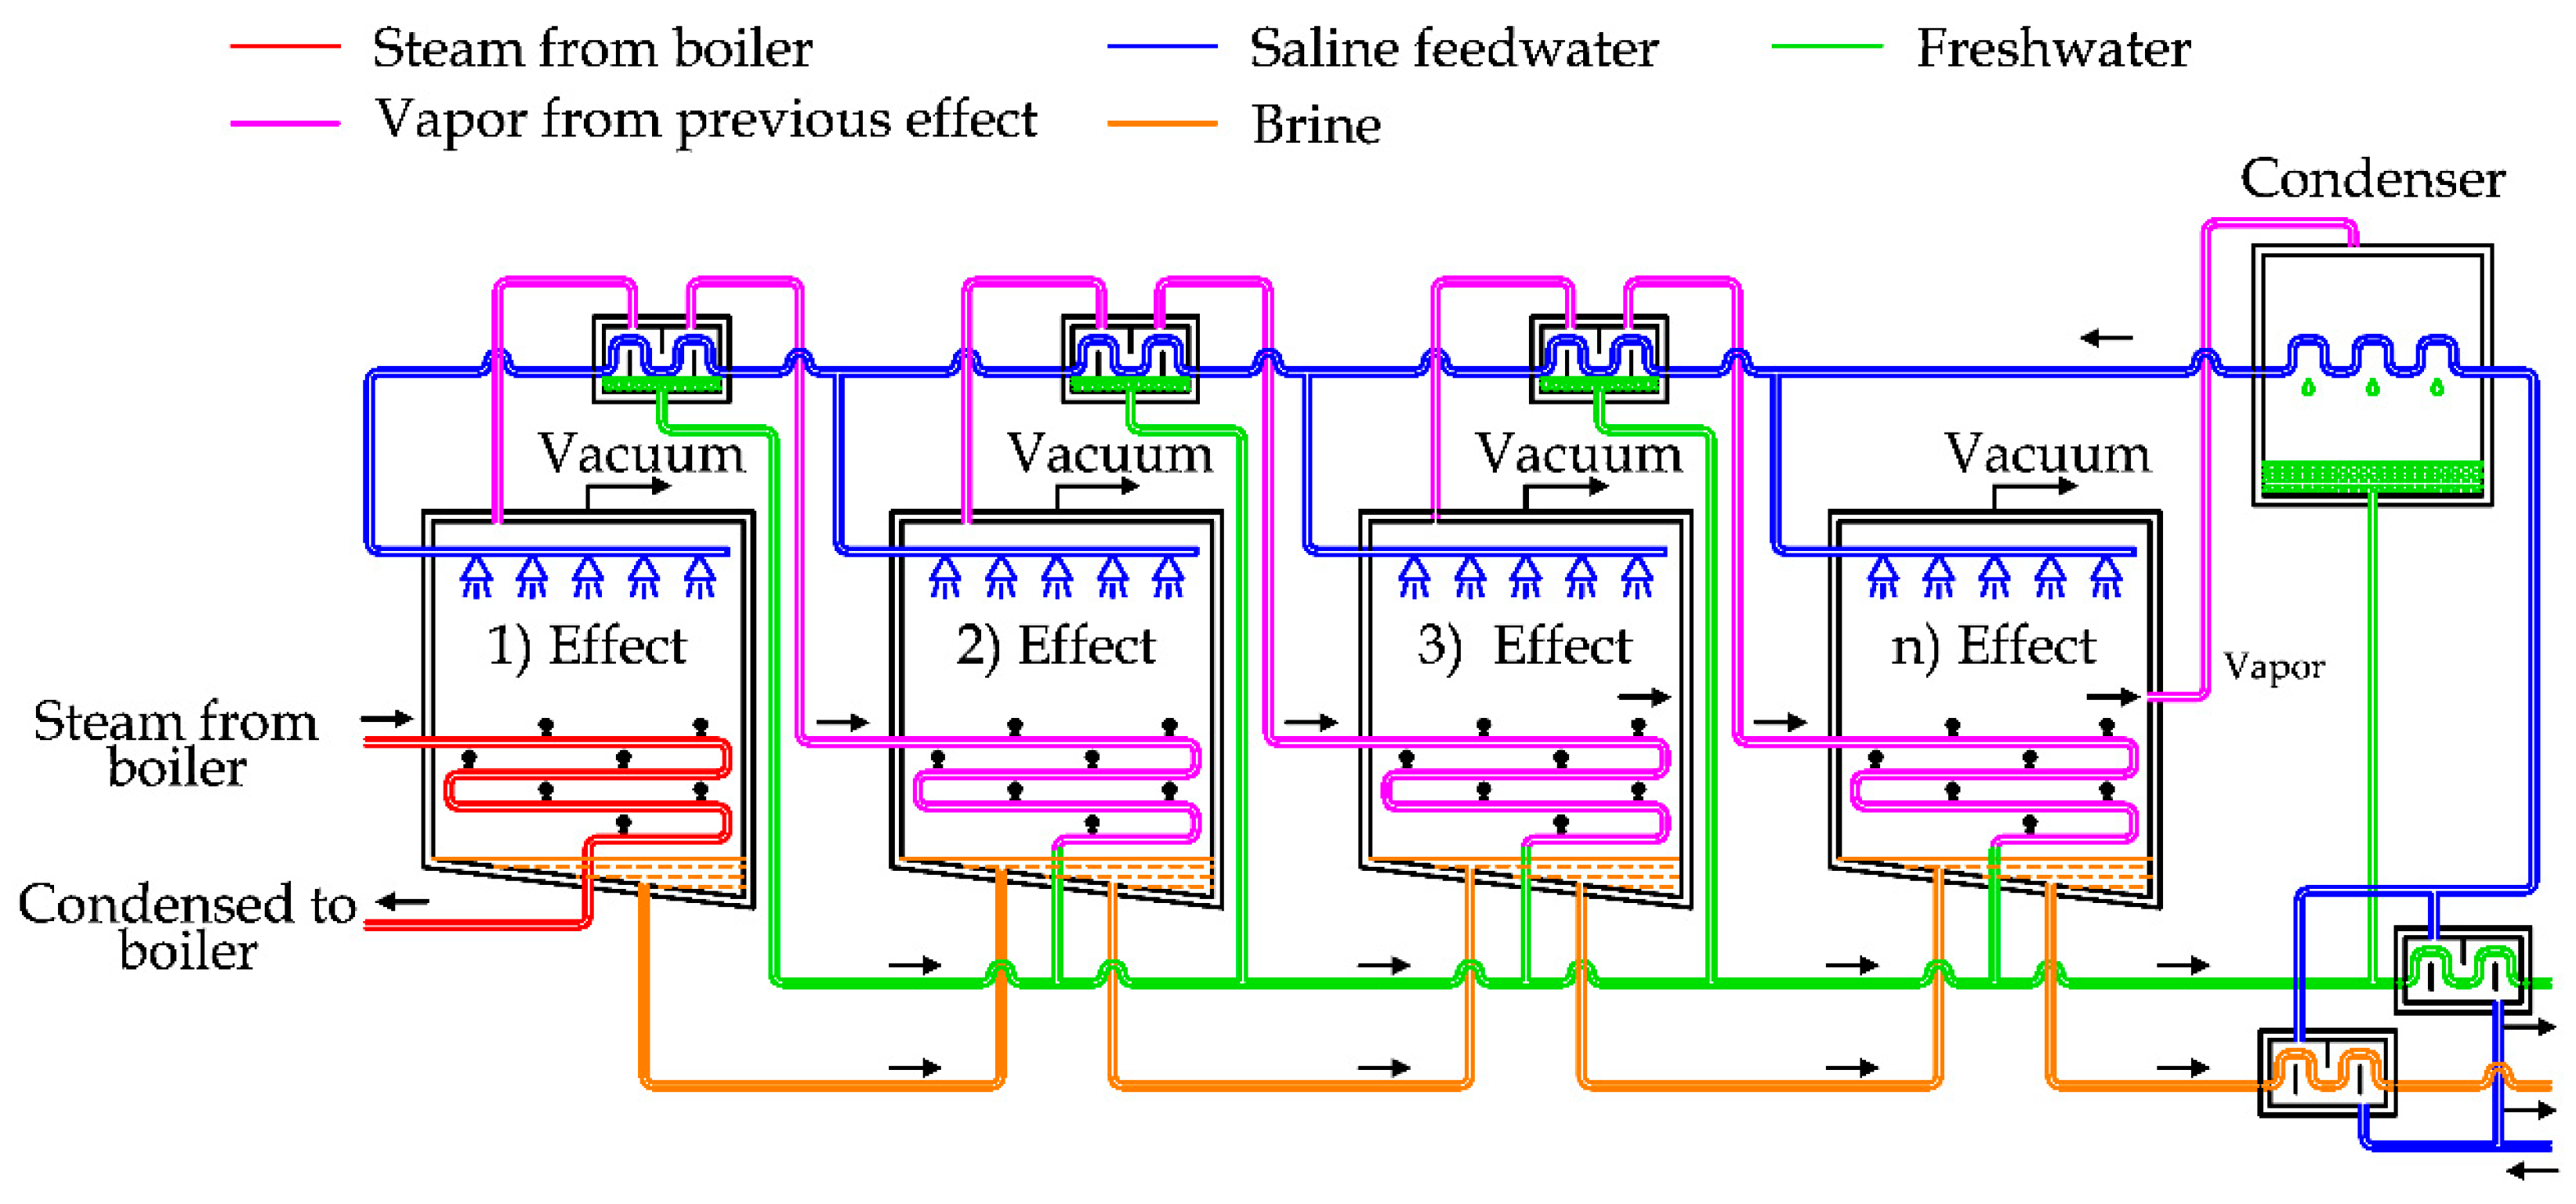
Figure 5 shows the diagram of a MED plant with horizontal tubes [
23,
26,
27].
In general, this plant is composed of a steam supply, several effects, heat recovery exchangers, a condenser and a venting system [
22].
In detail, the saline water can be split into two lines, in order to recover the thermal energy of freshwater and brine produced by the system, as depicted in
Figure 5. After this step, saline water is used as cooling fluid for the condenser, then preheated by using the heat recovery exchangers that are supplied by the steam produced in each effect chamber [
5].
The preheated water is sprayed in the first chamber on the evaporator surface, producing a thin film to promote rapid boiling and evaporation thanks to the low pressure inside the chamber and the external thermal energy supply [
23].
The vapor produced inside this chamber is transferred by pipes to the following chamber. As the pressure inside the second chamber is lower than the first one, the boiling temperature is also lower. In this way, it is possible to condensate the vapor produced in the first chamber inside the pipes and at the same time produce other vapor inside the second chamber [
28].
This process is repeated in the subsequent chambers in the same way, using the steam generated in the previous flash chamber to produce more vapor at lower pressure. In the last chamber, the vapor is finally condensed inside the condenser, cooled by the saline feedwater.
The brine produced in the previous chambers is usually transferred inside the subsequent chambers, in order to force the extraction of more freshwater, thanks to the lower pressure inside them [
23].
The pressure inside the chambers is kept below the atmospheric conditions by using a dedicated vacuum system. The energy efficiency of MED units depends on the number of effects, normally ranging between 4 and 21 [
24].
MED units are used to produce freshwater with a flowrate ranging from 2000 to 20,000 m
3/day. To improve the energy efficiency, MED can be coupled with a Thermal or Mechanical Vapor Compression unit [
28]. The biggest desalination plants are concentrated in China and Middle East [
29].
2.2. Multi-Stages Flash (MSF)
The first MSF plant was realized in the 1950s in Scotland and after few years it became the most used desalination technology [
24]. MSF is also commonly used on ships and along the coastline in several parts of the world, like USA, Middle East and Korea, to produce freshwater from seawater [
30].
The MSF process shows some similitudes with MED, previously described. In fact, an initial heat supply is also required, using steam spilled from a power plant, and the decreasing pressure is used to force the vapor production [
5]. Electricity is required to run the several pumps distributed along the desalination plant [
31].
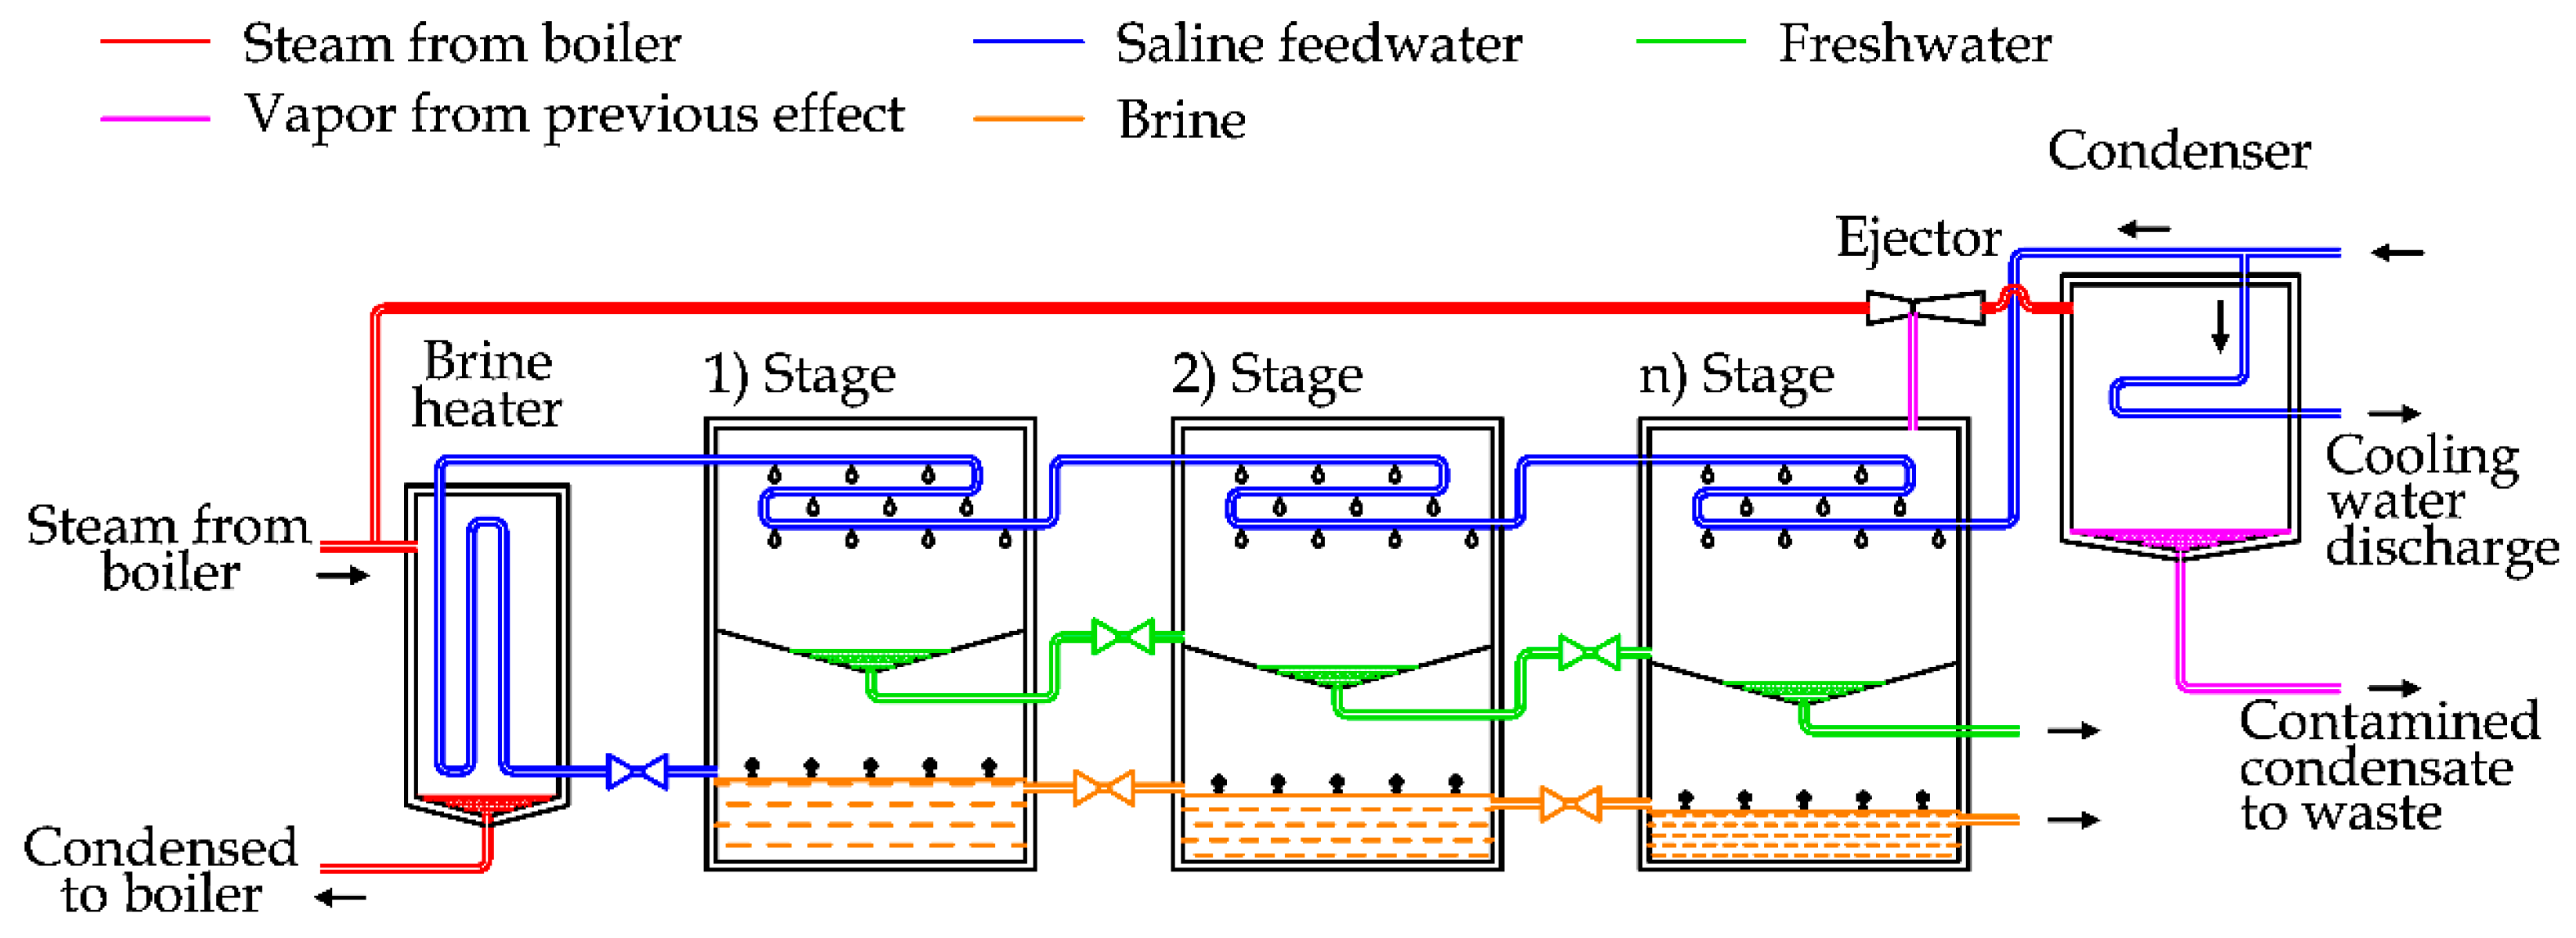
Figure 6 shows the diagram of a once-through MSF unit [
23,
26,
27]. The plant can be conceptually divided in two sections: the first is the brine heater section, where the feedwater receives heat from an external supply, and the latter one is the heat recovery section, where the thermal energy is recovered to preheat the feedwater [
6].
Focusing the attention on the picture reported above, the saline feedwater is firstly used as cooling water for the condenser and then as a raw source to produce freshwater.
The saline water increases its temperature progressively, flowing inside the pipes and forming the heat exchangers inside the flash stages. To start the process, the saline water is heated inside the brine heater by using steam usually spilled from a power plant. This steam condenses inside the brine heater (outside the tube bundle), so it can be reused in the steam power plant [
24].
As the saline feedwater flows inside pipes in the brine heater and in the flash stages, the maintenance operations to remove the scaling are simpler than in MED [
23]. For this reason, MSF is the most widespread thermally driven desalination technology, representing 17.6% of the total installed desalination capacity in the world [
12].
After the initial heating, saline water is laminated inside the first flash stage. The vapor produced inside the chamber condenses thanks to the heat removal by the saline feedwater inside the heat exchanger. The brine collected in the lower part of the chamber is laminated in the subsequent chambers, where the internal pressure is reduced linearly from the first stage to the terminal one [
30]. The vacuum is obtained by the utilization of steam ejectors supplied by high pressure steam (as shown in
Figure 6), or by using vacuum pumps [
6].
Thanks to the pressure drop, the introduction of heated saline water produces the “flashing effect”, for which the saline water boils rapidly inside the chamber, producing vapor [
24].
To maximize the energy efficiency of the system, MSF units are typically composed of several flash stages, with the total number ranging from 15 to 25 stages (greater values are related to bigger MSF plants). This technology is able to satisfy a freshwater demand of about 4000 to 57,000 m
3/day, requiring heating at 90 °C–110 °C [
23].
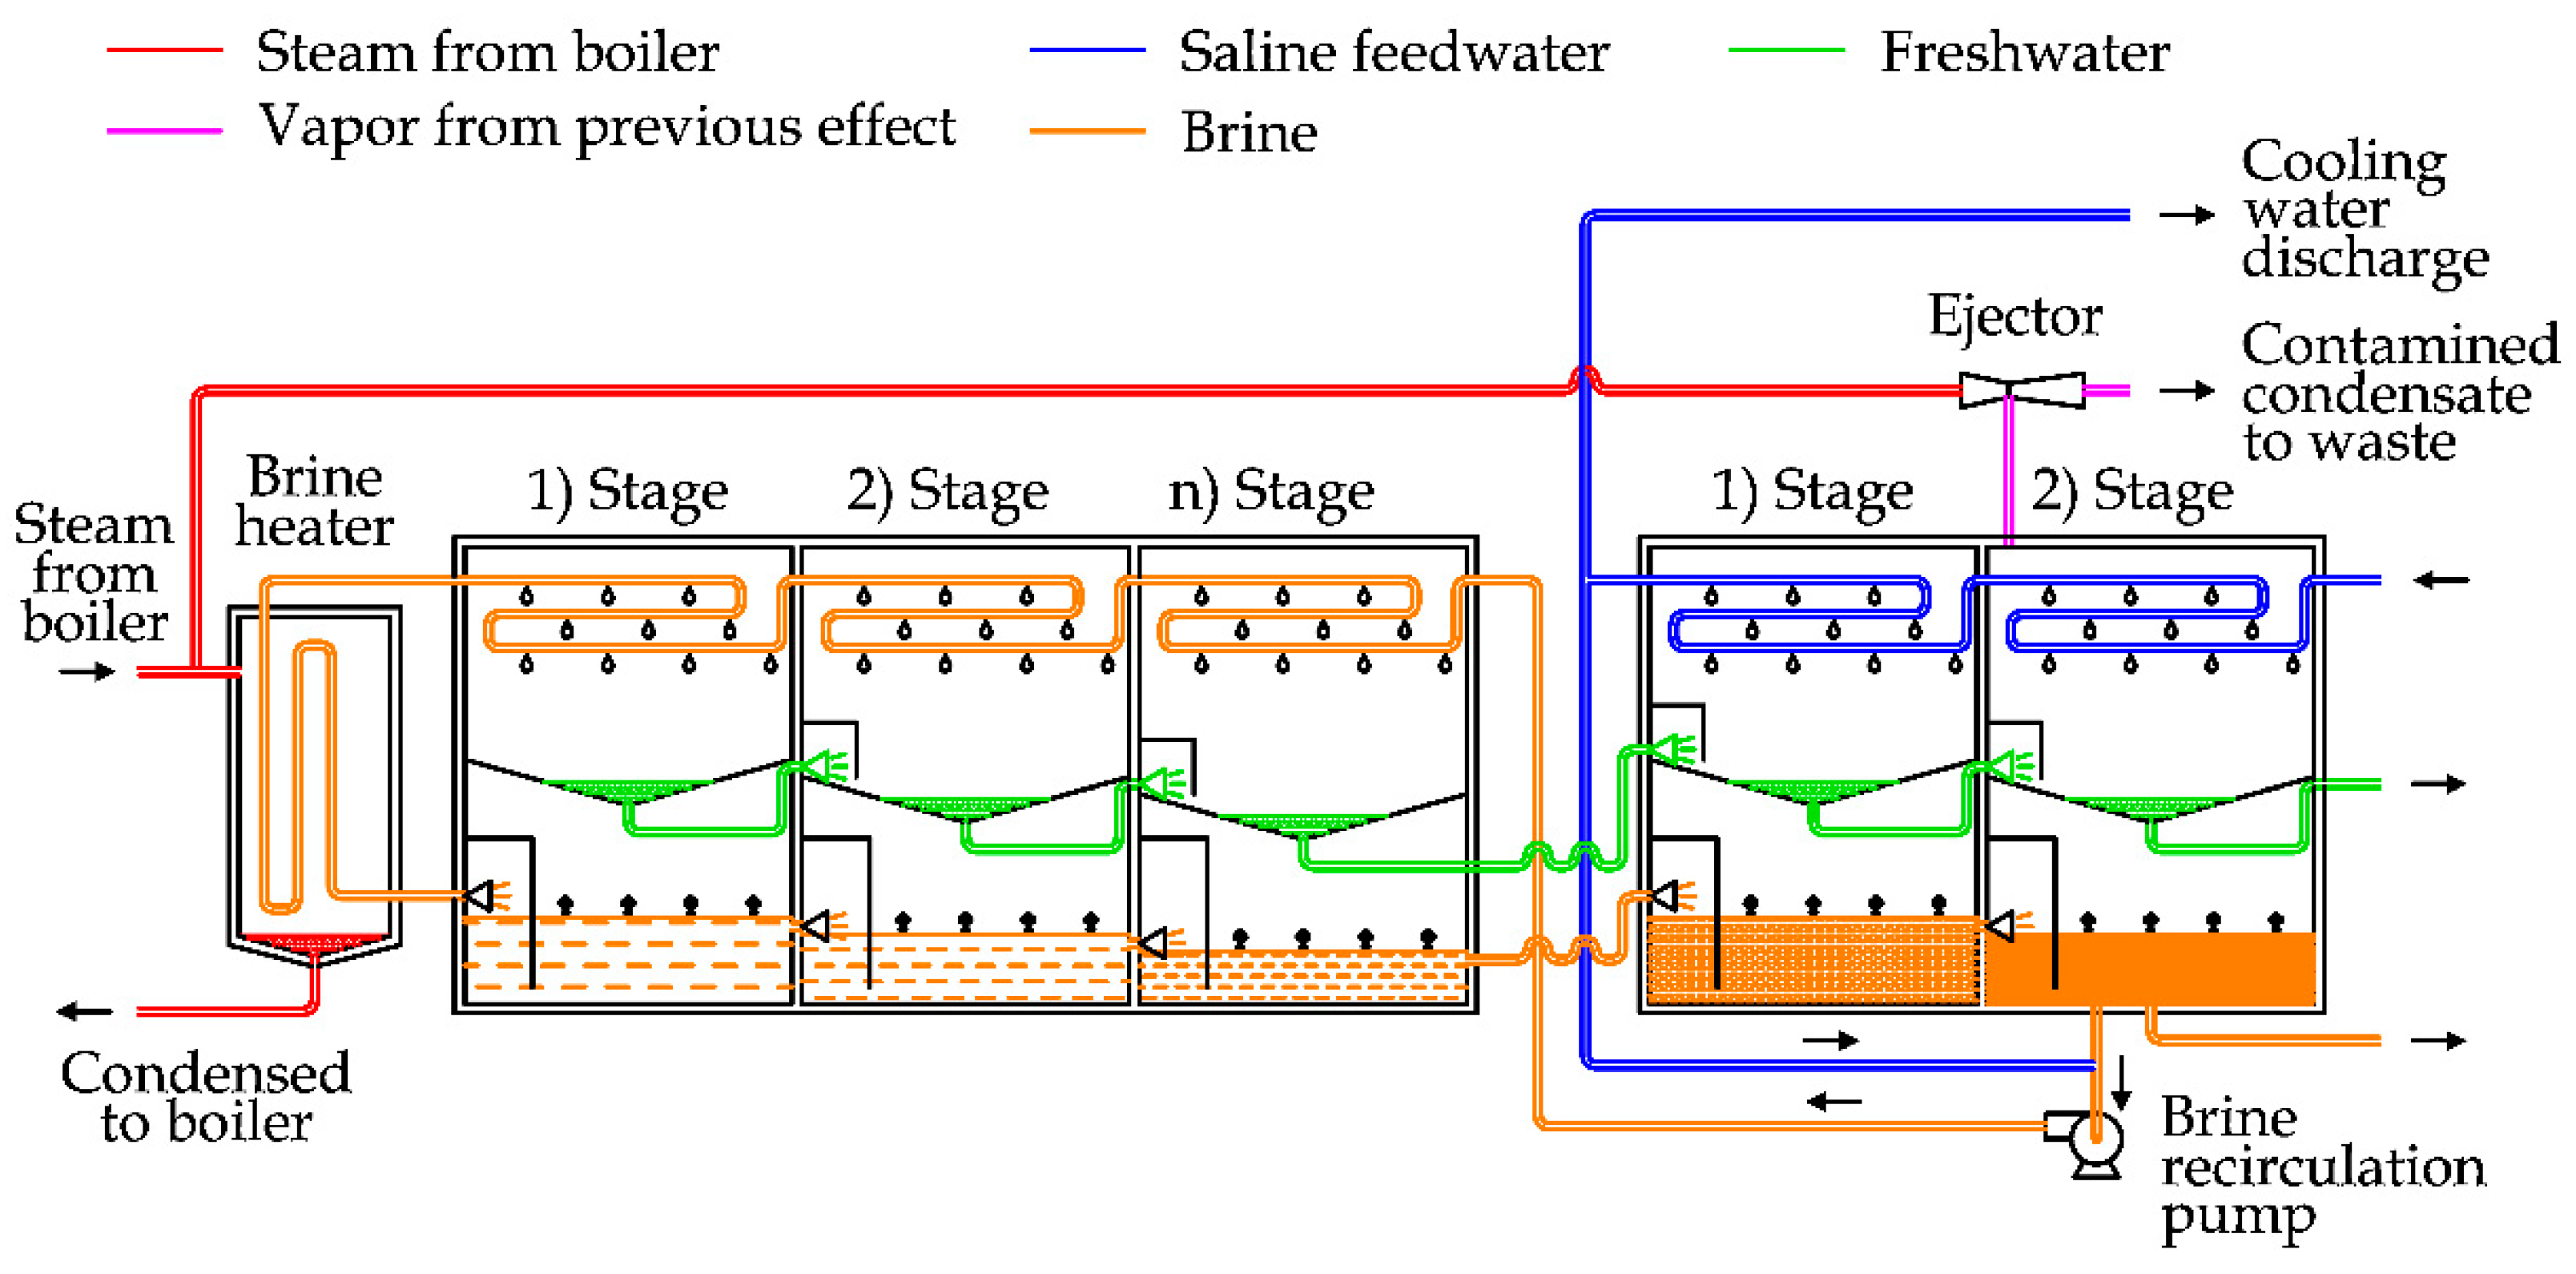
In more recent plants, a few changes have been introduced. Instead of the condenser, a heat rejection section is inserted, which is composed of two or three flash stages (see
Figure 7). In detail, seawater is used as cooling fluid in this section. After this step, a part of seawater is rejected and the other part is mixed with a part of brine extracted by the last flash stage. This salt solution is used in the main section of the desalination unit, in the same way as shown in the previous diagram. This technique is applied to increase the energy efficiency of big desalination plants, composed of 19–40 flash stages and 2–3 heat rejection stages [
6,
31].
In the last two decades, the reliability of the system has been improved thanks to scaling control (adding substances to limit the phenomenon), the introduction of automation and control systems and the choice of better materials for the realization of the desalination units [
23].
Similarly to MED, MSF desalination has spread where the thermal energy cost is low, like in Saudi Arabia, the United Arab Emirates and Kuwait [
24].
2.3. Vapor Compression (VC)
Vapor Compression is a common technique used in the desalination sector, based on the liquid–vapor phase transition.
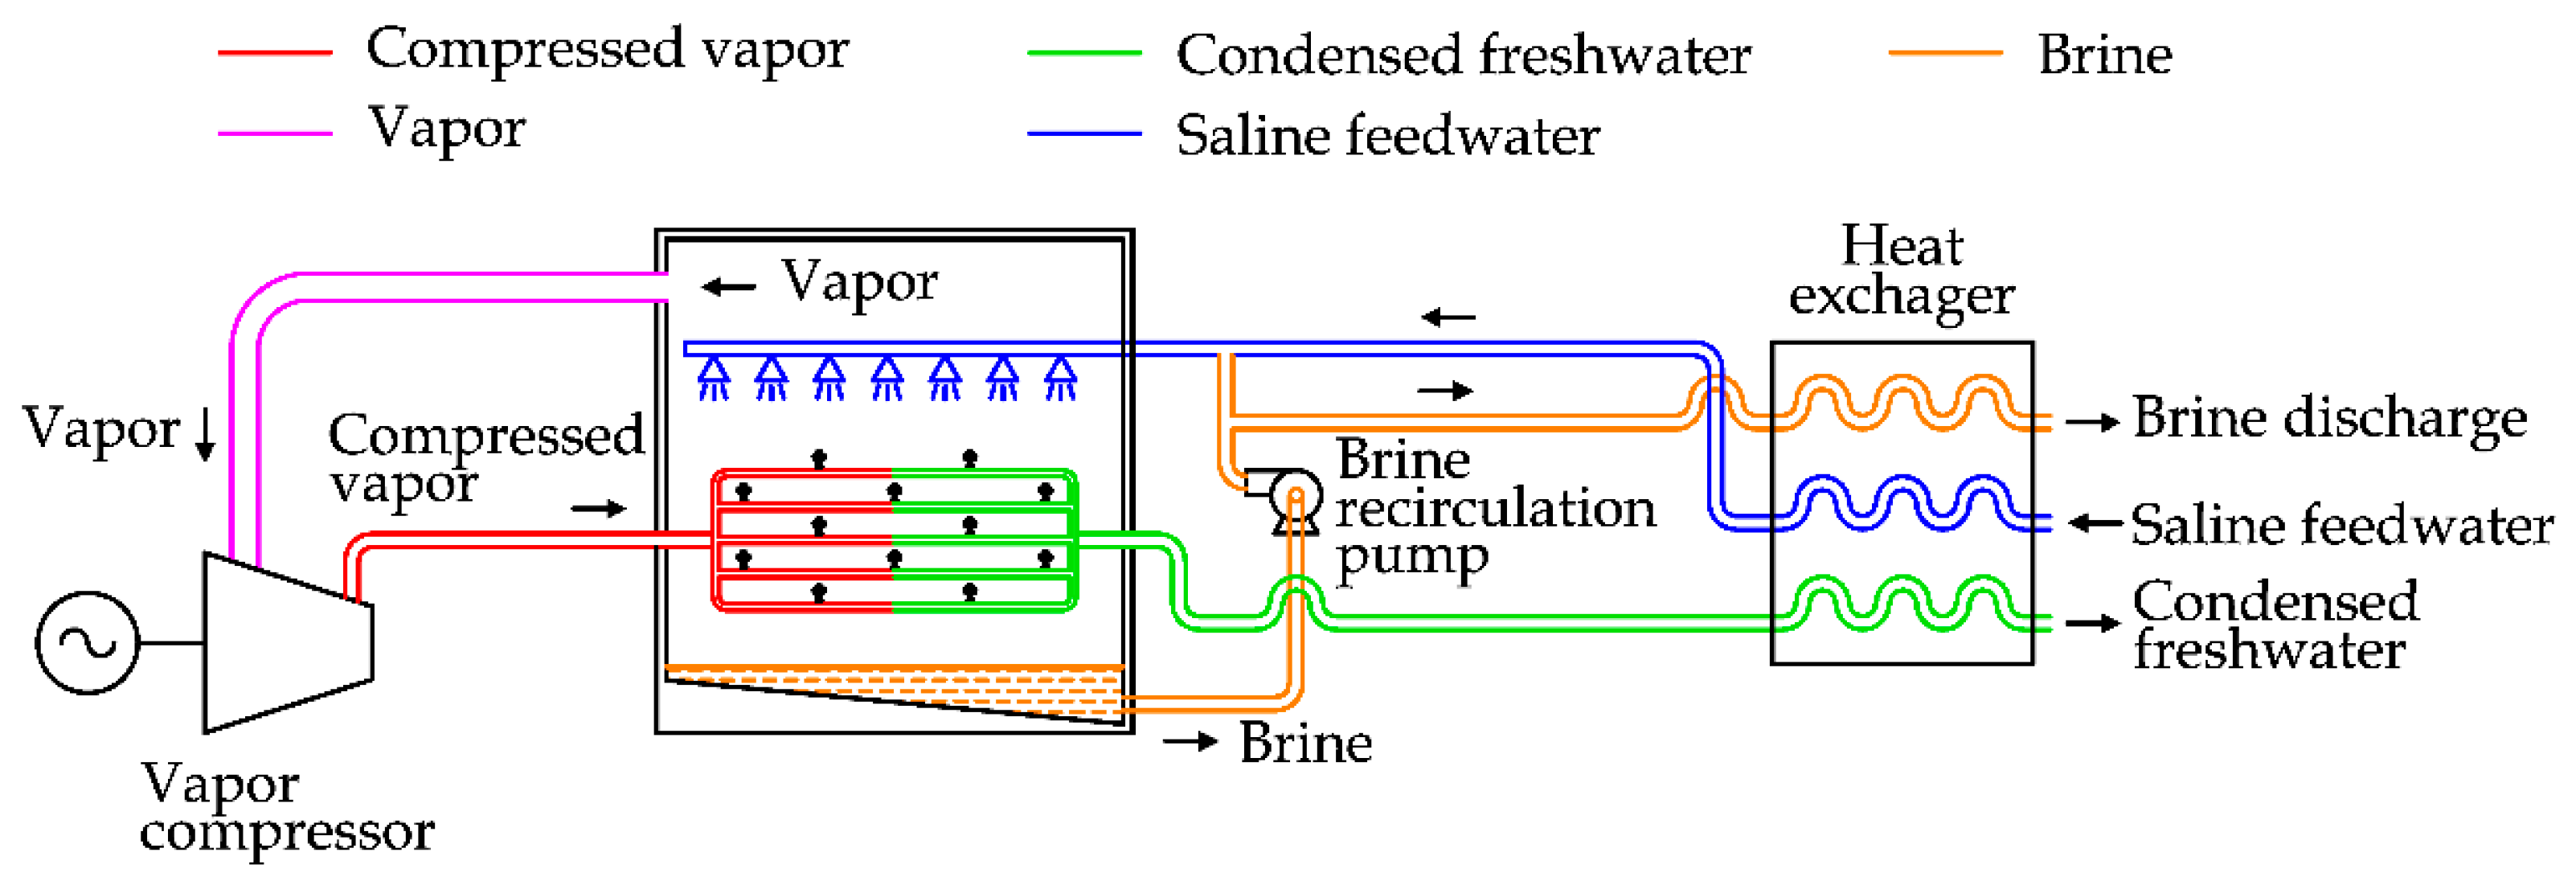
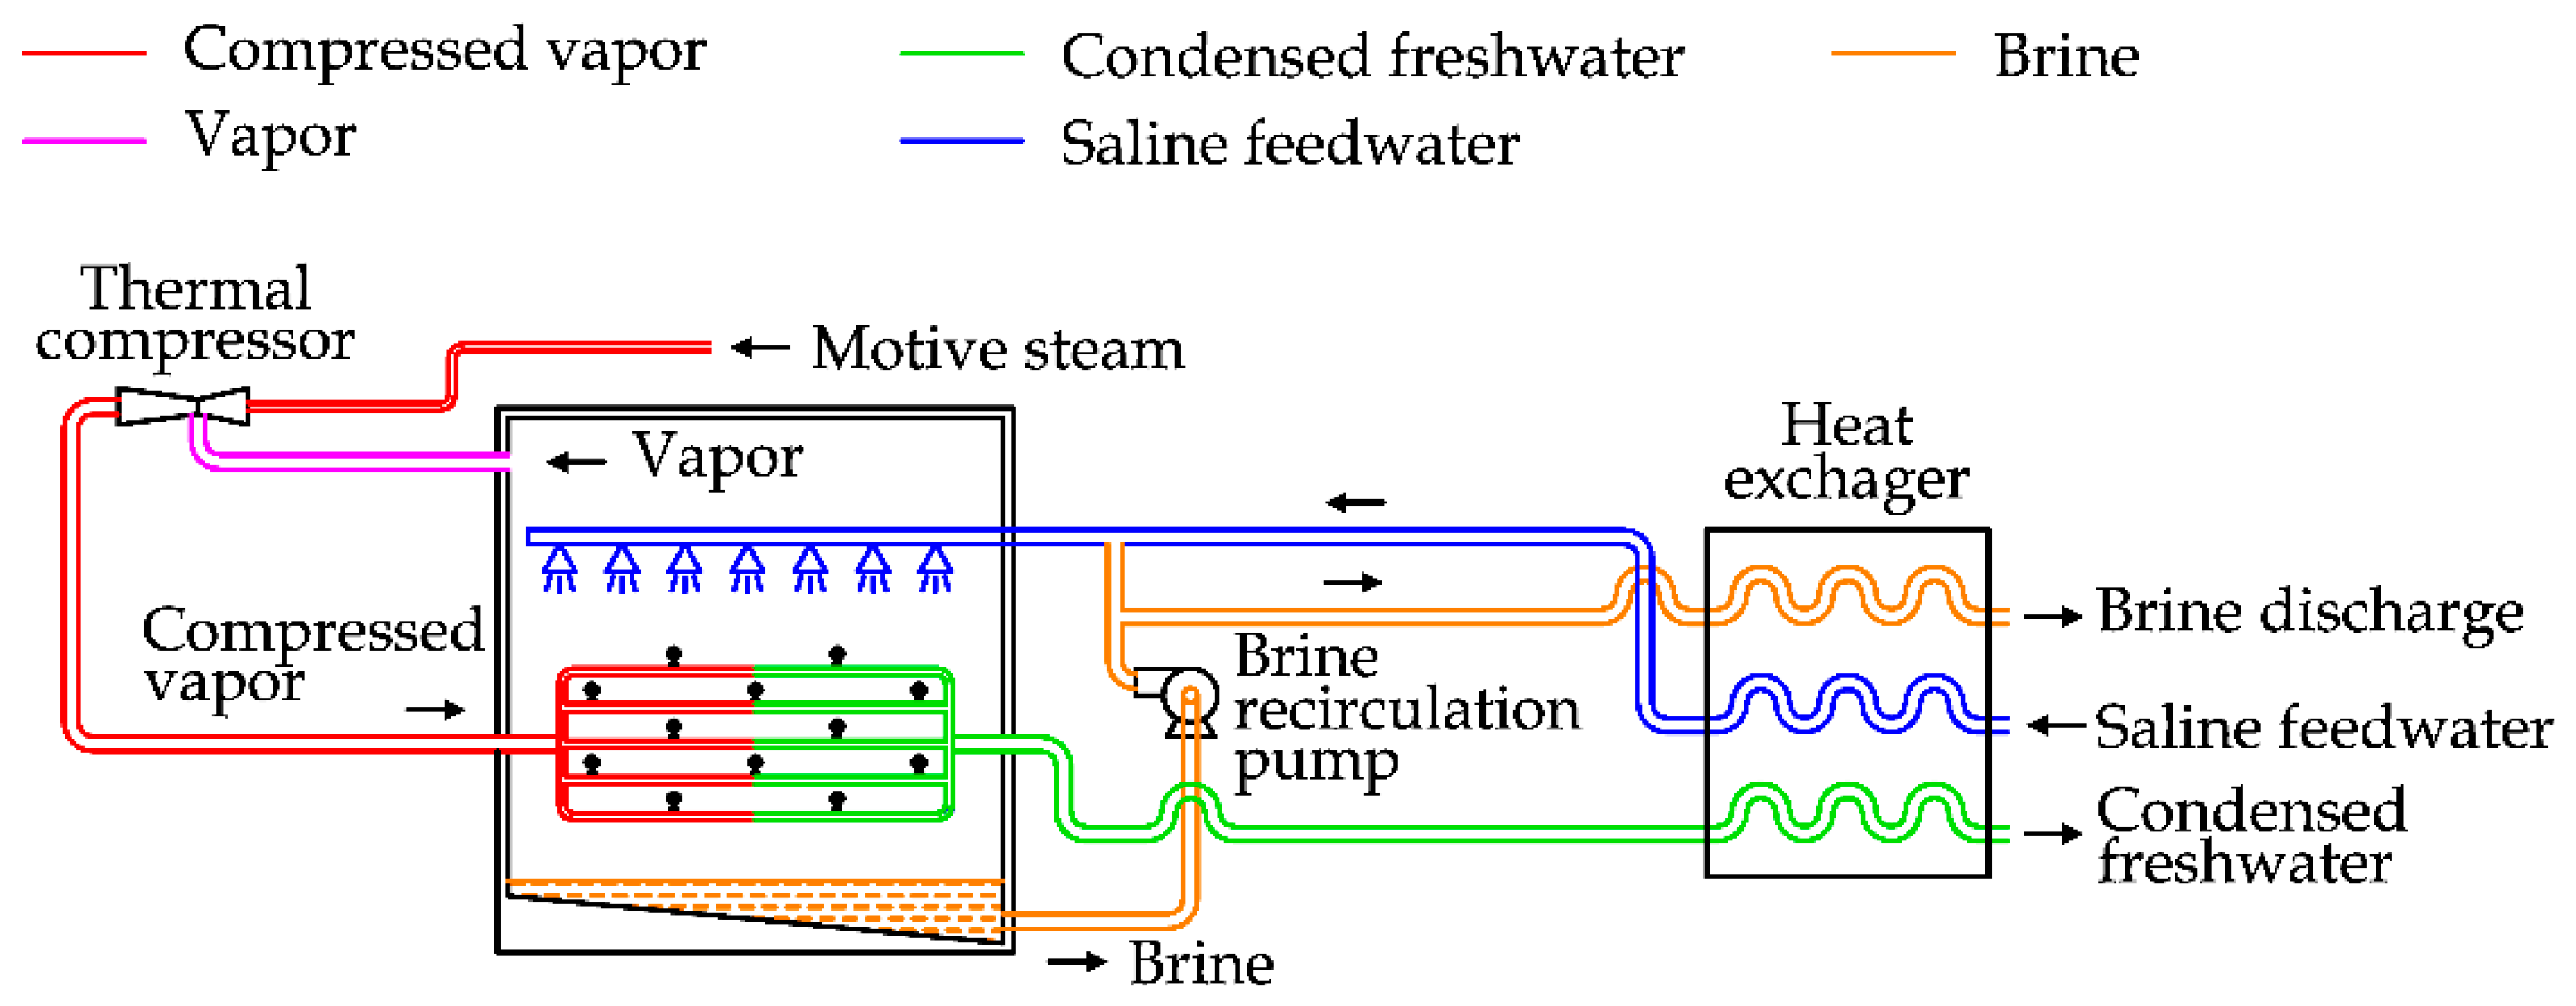
To clarify the process,
Figure 8 is considered, reporting the case of a Mechanical Vapor Compression (MVC) unit.
A vapor compressor is used to extract vapor produced inside the chamber. Due to the compression, the vapor increases its temperature and pressure. By raising the temperature and using a heat exchanger, the pressurized vapor can transfer heat to the saline water inside the chamber and produce vapor.
To minimize the energy consumption of the process, a heat recovery exchanger is used to transfer heat from the brine discharge and the condensed feedwater to the saline feedwater [
31].
After the preheating, the saline water is mixed with a brine recirculation flow. This solution is sprayed externally on the main heat exchanger inside the desalination unit.
MVC essentially requires electricity to run the process; therefore, a small stand-alone desalination unit can be realized to satisfy a freshwater demand ranging from 100 to 3000 m3/day.
The same approach is adopted in the Thermal Vapor Compression (TVC) unit, reported in
Figure 9.
The only significant difference is related to the method used to increase the vapor pressure. In TVC a thermal compressor is adopted, which is supplied by high pressure steam, normally spilled from a power plant.
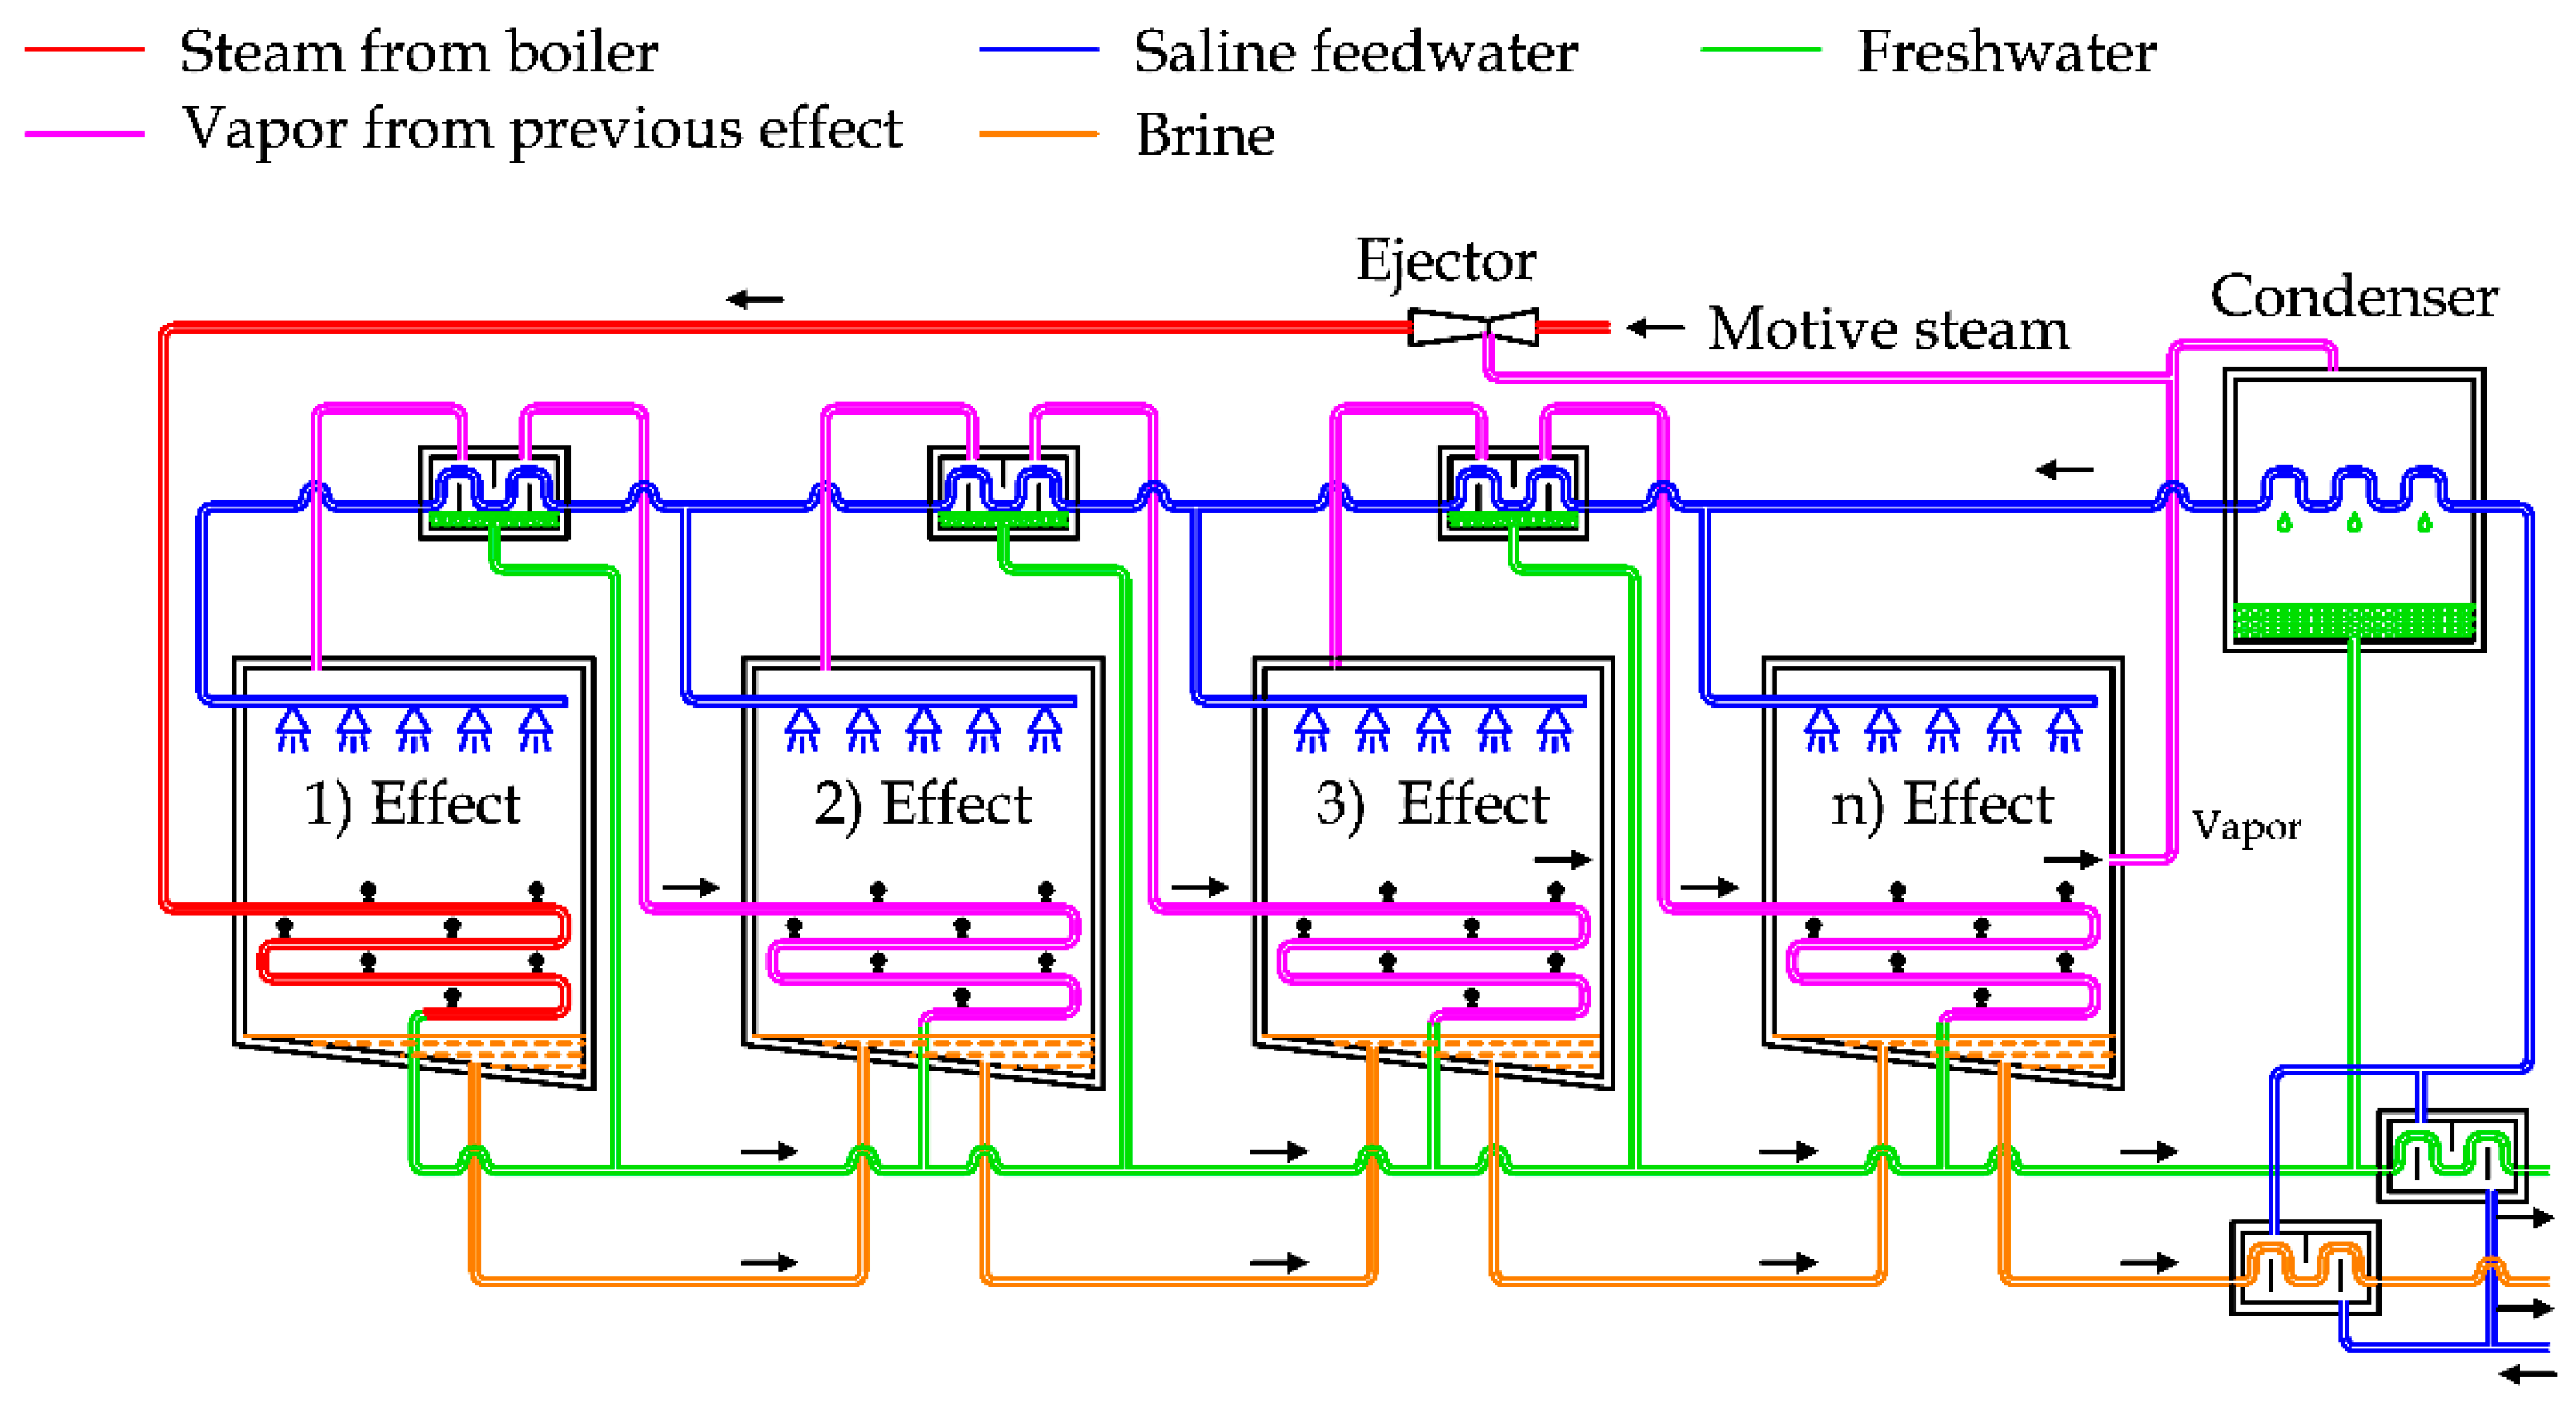
TVC requires thermal and electrical energy. The first one is used for the thermal compression, the latter one for the circulation pumps. TVC is sometimes assembled with MED units, realizing a hybrid system called a MED-TVC desalination plant, as shown in
Figure 10.
The comparison between the picture reported above and the MED diagram shows a few differences. The steam supply is used to produce the vacuum inside the condenser and the last effect of MED unit. The contaminated steam is condensed inside the first effect and added to the freshwater output [
32]. This configuration is used to satisfy significant freshwater demand, between 10,000 and 30,000 m
3/day [
6].
2.4. Reverse Osmosis (RO)
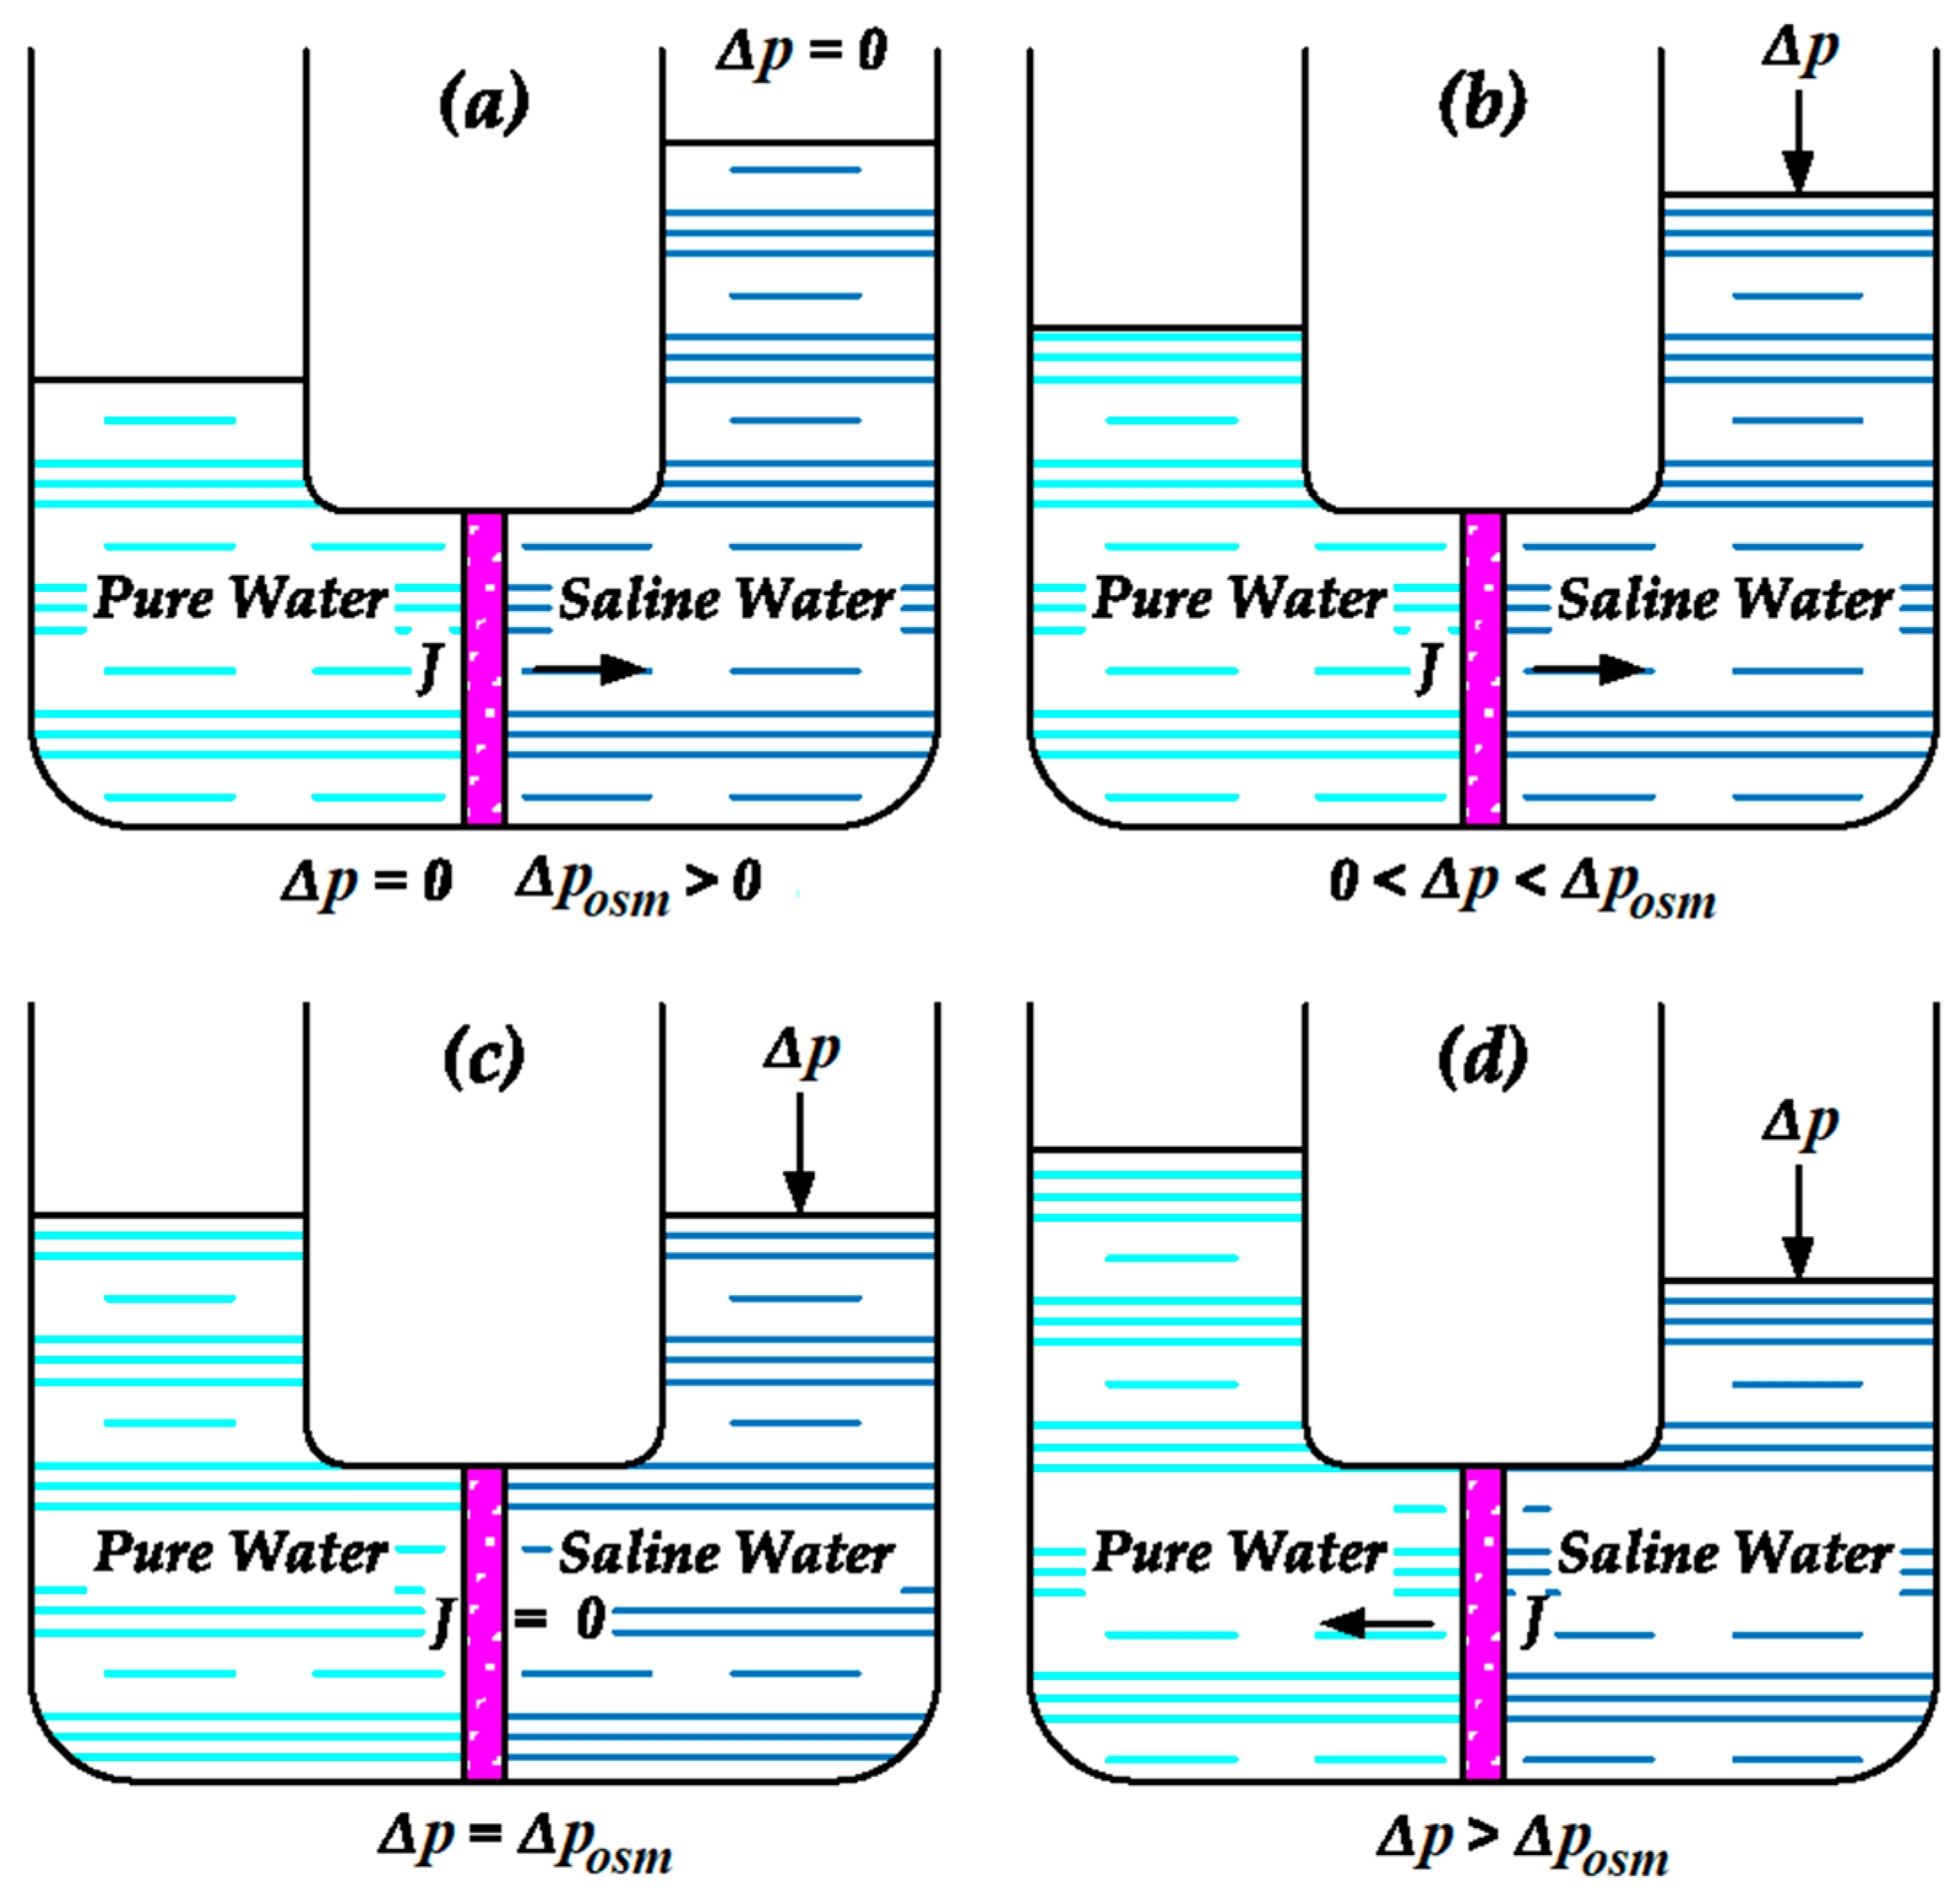
RO is a desalination technology based on semipermeable membranes, which are specific layers allowing the passage only to selected molecules. In nature, if two solutions with different concentrations of solutes are separated by a semipermeable membrane, the solvent flows spontaneously from the more diluted solution to the more concentrated one, in order to balance the energy potential of both solutions, as shown in
Figure 11 (see case a). This flow can be progressively reduced if an increasing external pressure gradient
is applied to the semipermeable membrane (see case b) [
33].
The exact value able to stop the solvent flow is defined as Osmotic Pressure
(see case c). If the external pressure gradient is greater than the osmotic pressure, the solvent flow is inverted, so the solvent can be extracted from the concentrated solution (see case d) [
33].
For each solution the absolute osmotic pressure
can be defined according to van’t Hoff’s equation [
33,
34] (In chemistry, the amount ι[c] is called “normality”, indicating the number of equivalents in a unitary volume. The equivalent represents the amount of a specific substance able to react with (or supply) one mole of hydrogen (H
+) in an acid-base reaction or react with (or supply) a mole of electrons in a redox reaction):
assuming the following notation:
is the dimensionless van’t Hoff index (also called the number of osmotically active particles), given by the relation , where is the degree of dissociation representing the ratio of how many original solute molecules are dissociated, and is the number of ions formed by the molecule dissociation (the stoichiometric coefficient of dissociation reaction). As an example, in the case of sodium chloride (NaCl), , , consequently .
is the molar concentration of the solute.
is the ideal gas constant equal to .
is the absolute temperature of the solution.
As the salt concentration is negligible in freshwater and consequently its osmotic pressure (the minimal pressure required to stop the solvent flow) is equal to the osmotic pressure of saline water. For seawater, the salt concentration ranges between
[
33]. Thus, considering an environmental temperature equal to 25 °C, the osmotic pressure according to van’t Hoff’s equation ranges between 25 and 33 bar. Greater values can be measured, as in the extreme case of Dead Sea, where the osmotic pressure is equal to 290 bar [
33].
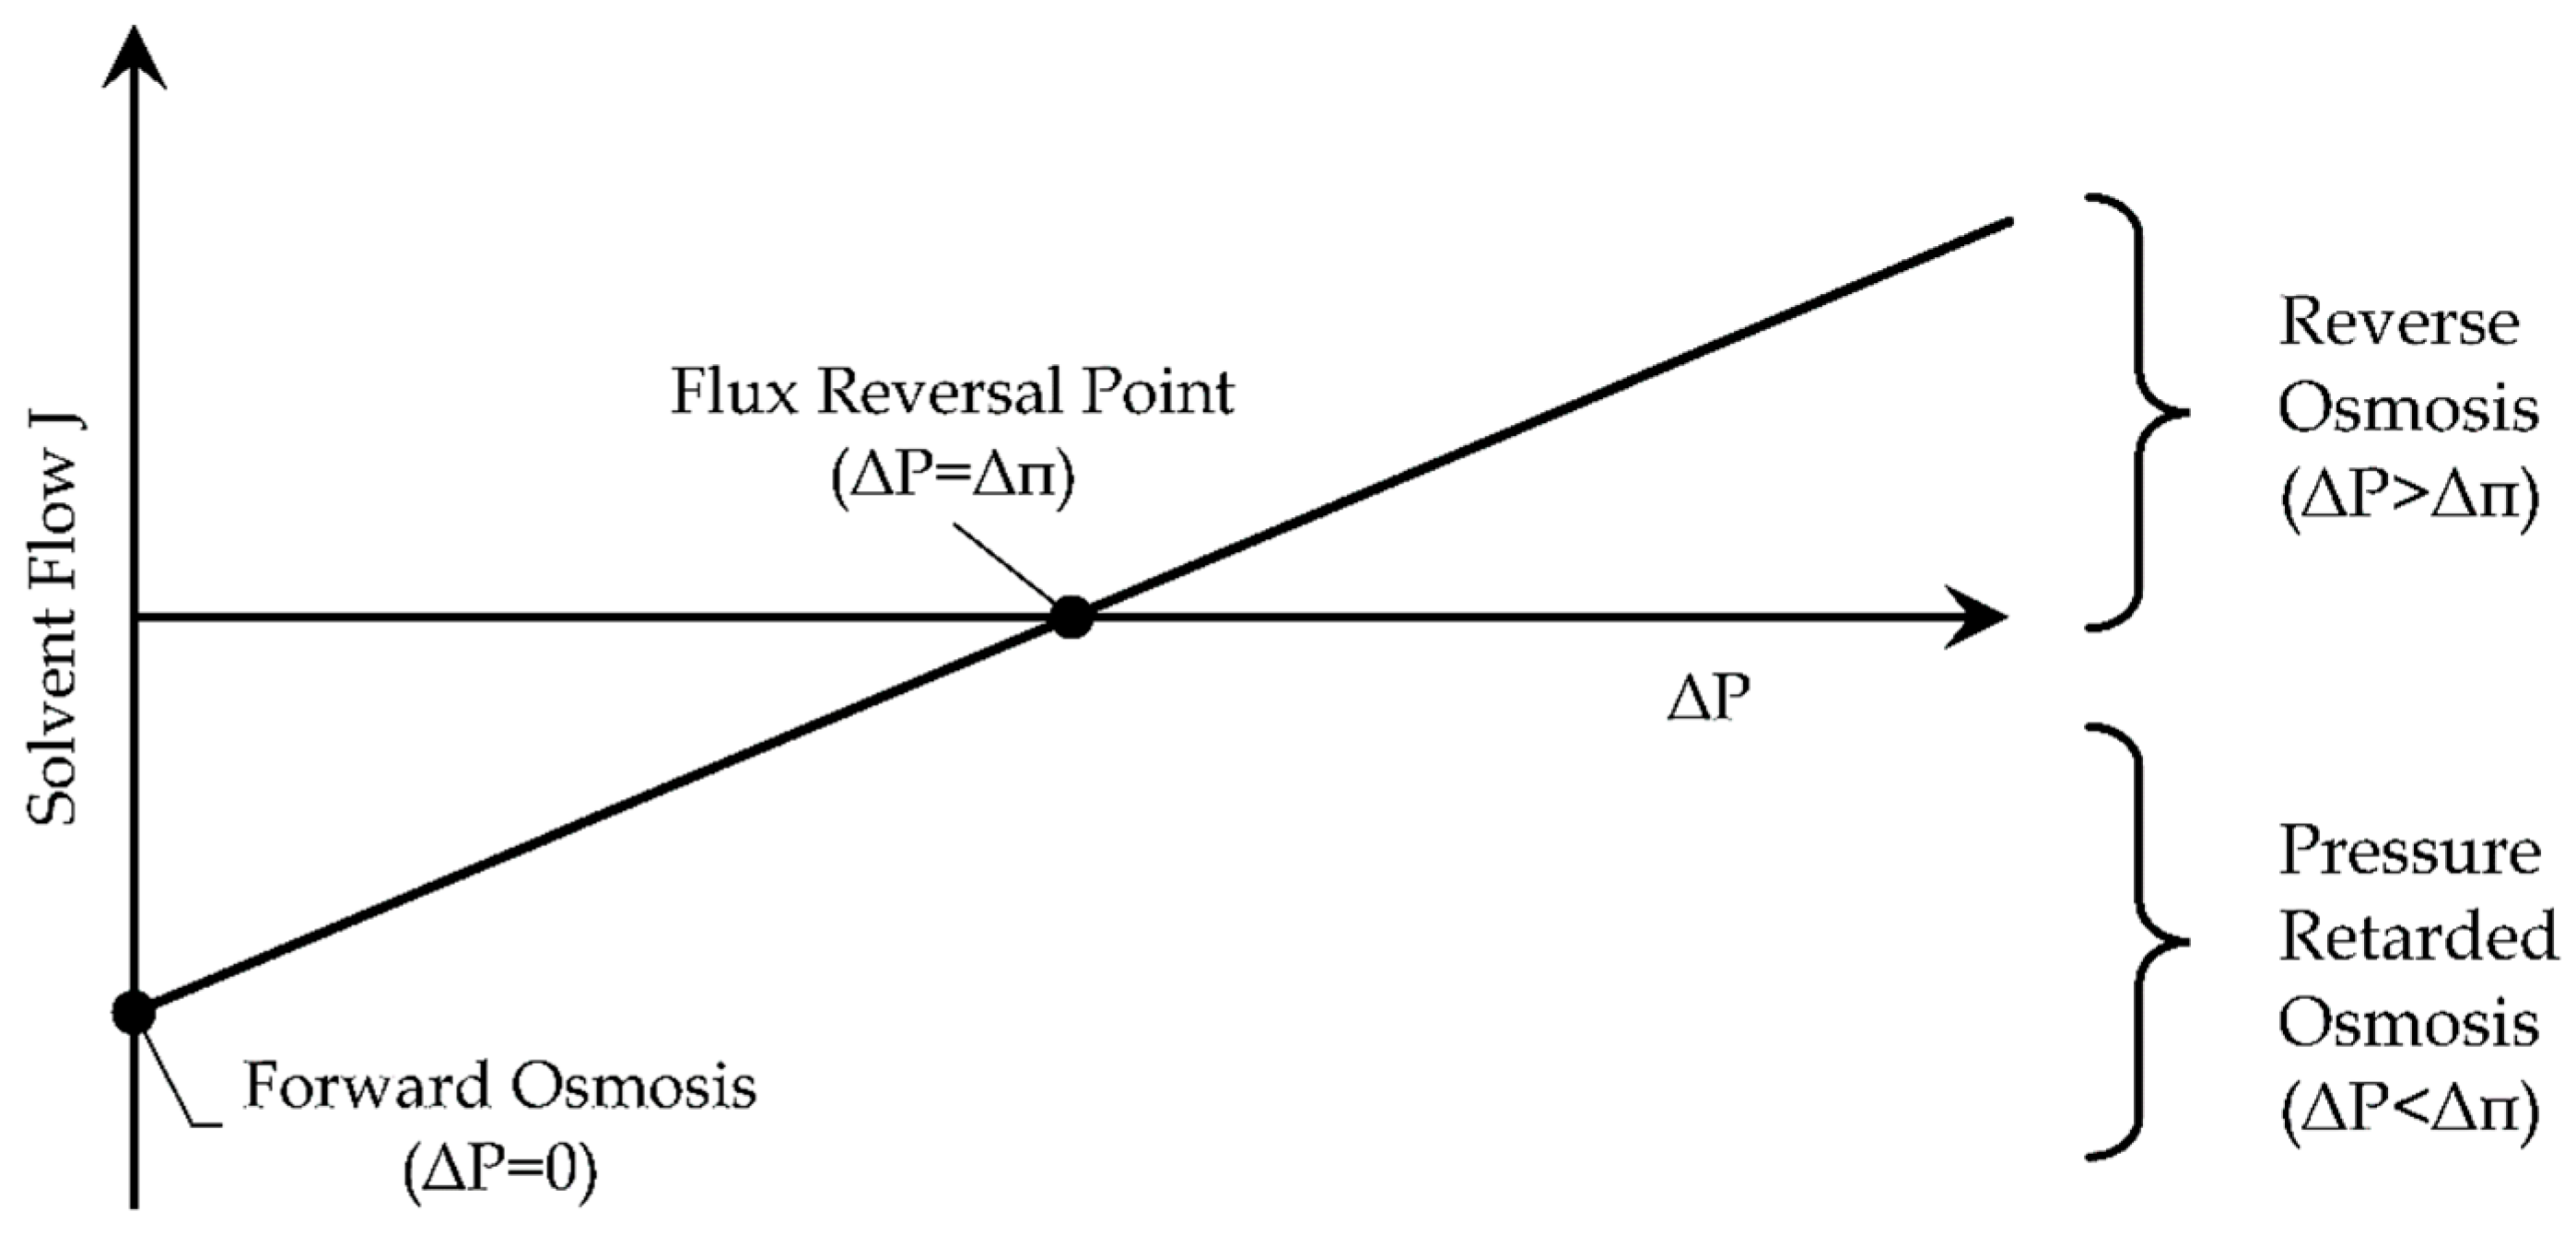
Figure 12 visualizes the phenomenon of osmosis: until the external pressure gradient is lower than the osmotic pressure, the solvent flows from the more diluted solution to the more concentrated one. In this working region, it is also possible to extract energy from the mixing of two solutions having different concentrations. This approach can be used in the estuary of the rivers. Indeed, the exploitation of the saline gradient energy source is currently under development [
35].
The case without an external pressure gradient is identified as “Forward Osmosis”, a condition which is used in the other osmosis desalination technique, analyzed in the following subsection.
By applying an external pressure gradient greater than the osmotic pressure, freshwater is extracted from saltwater. For desalination purposes, an external pressure between 15 and 25 bar is normally applied for brackish water, and between 54 and 80 bar for seawater [
23,
36].
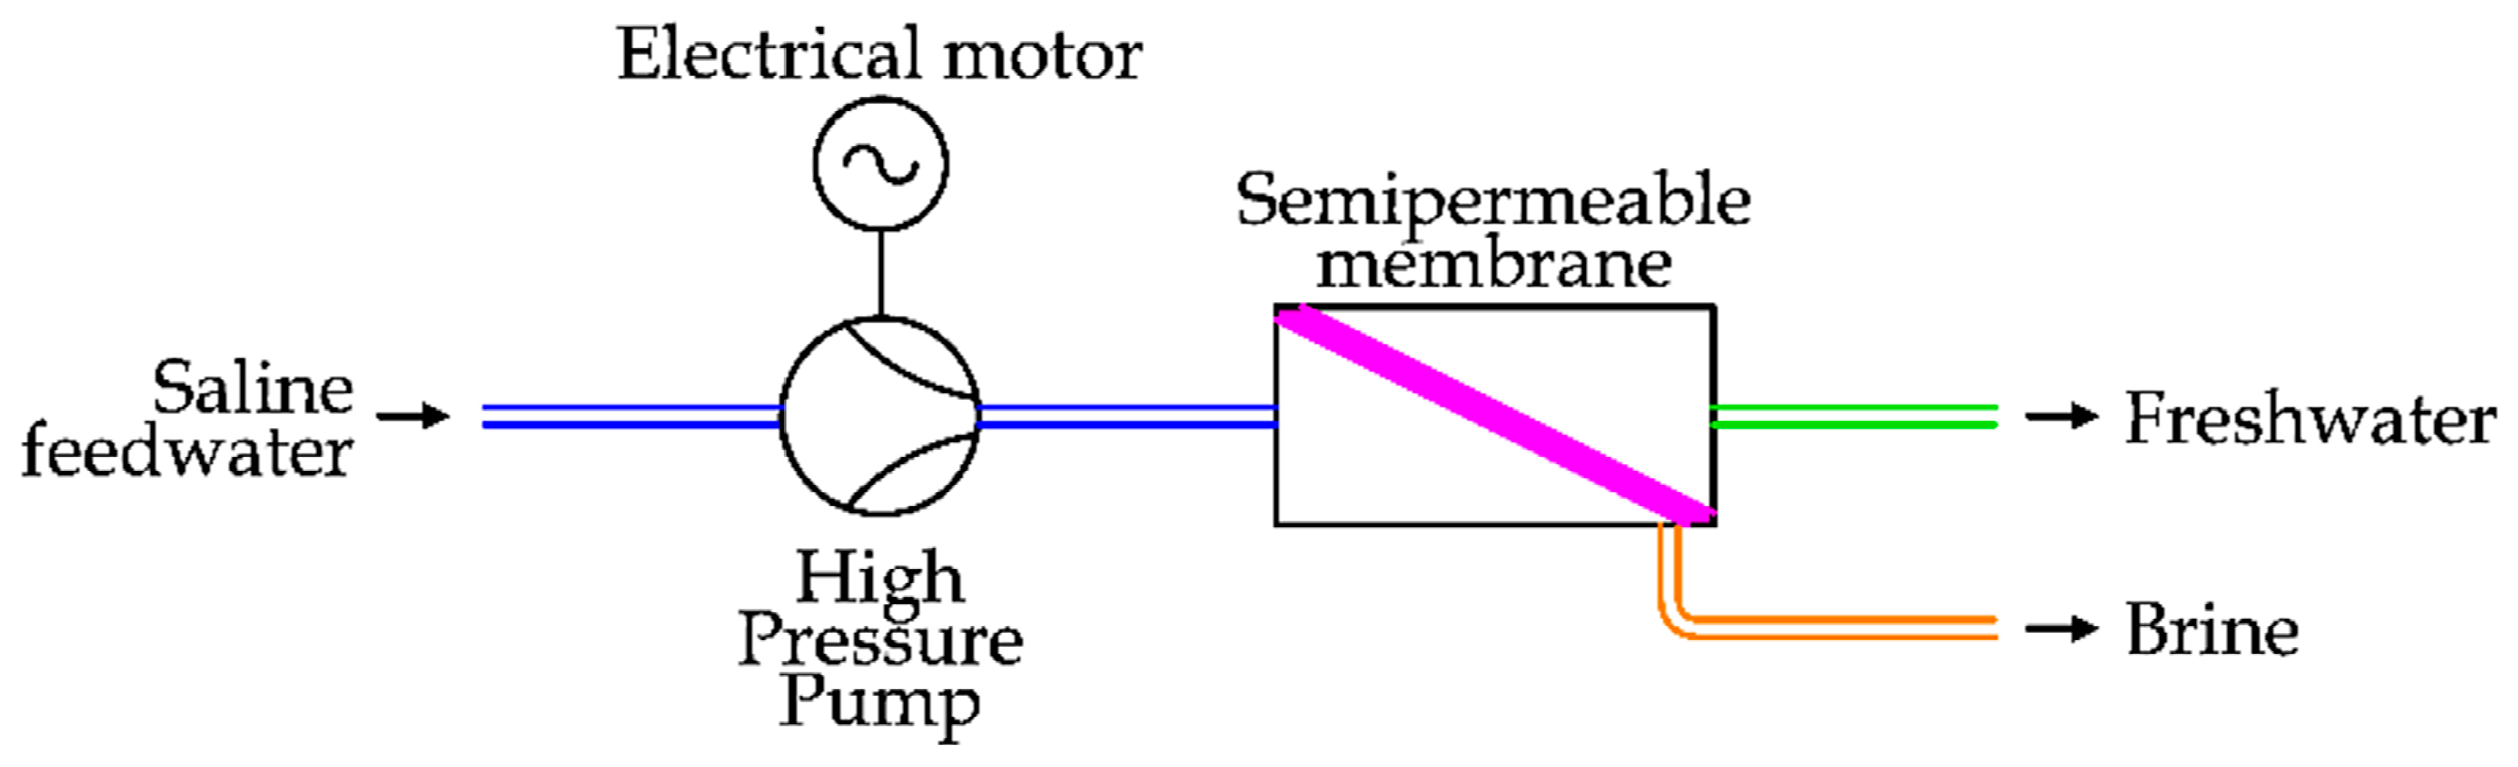
Thus, according to the values reported above, the RO essentially requires electrical (or mechanical) energy to run the pumps to significantly increase the seawater pressure before the semipermeable membrane. A simple diagram of a RO desalination unit is depicted in
Figure 13 [
37].
Seawater, after a pre-treatment to remove solid particles, is pressurized by a High Pressure Pump (HPP) in order to supply the RO desalination unit [
38].
In desalination applications, the Recovery Ratio (RR) is defined as the ratio between the freshwater flow and the saline feedwater flow [
12].
Considering the working conditions, RR assumes values between 35% and 50%, so practically only half (or less) of the seawater flow becomes freshwater and the remaining part is expelled as brine [
39]. To increase the freshwater extraction, the pressure before the semipermeable membrane should be increased, but there are several technical constraints, essentially related to the mechanical resistance of the membrane [
40]. As semipermeable membranes are not perfect, a limited amount of salts can be found in the freshwater output [
23].
The brine flow has a high energy potential, as its pressure is practically the same as the saline input water. In fact, the pressure drop inside the brine circuit is about 2–3 bar [
37].
To reduce the total energy consumption for desalination, many studies have been realized since the 1970s. In addition to the improvement of membrane properties, the main goal was energy recovery from the brine flow by the introduction of an Energy Recovering Device (ERD). The solutions can be classified as [
41]:
Centrifugal device
Isobaric device
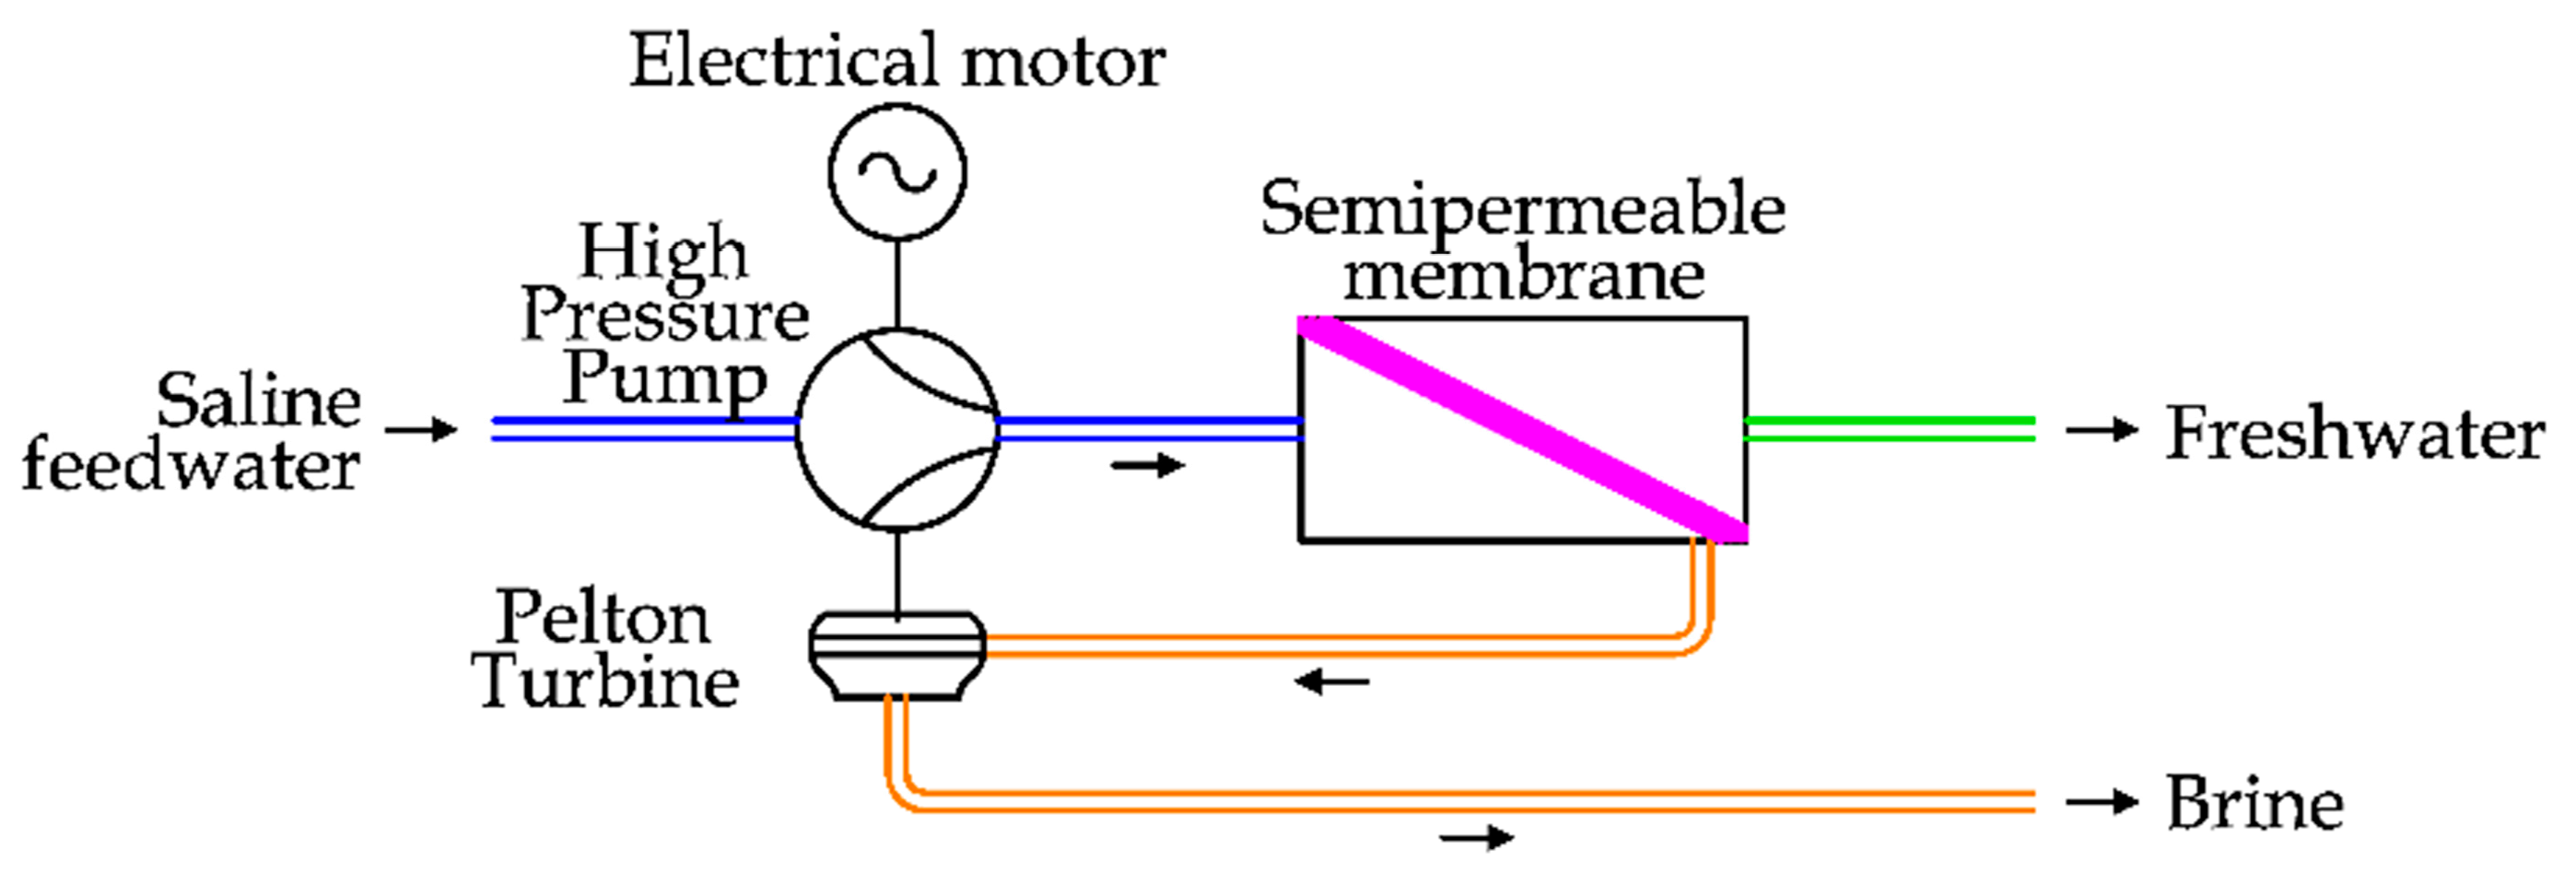
In the first case, two technologies have been proposed. The first, introduced in the 1980s, is the installation of a hydro turbine (Pelton) to recover the energy of the brine flow and transfer it to the main HPP. To complete the energy demand of the pump, an electrical motor is used. The pressure increase is realized by the main HPP to the entire saline feedwater flow. This solution is depicted in
Figure 14 [
37].
Pelton turbines are normally used in hydropower to exploit high heads, between 300 m and 1000 m. Of course, only a part of the available energy of the brine flow (about 70%) is transferred to the saline feedwater due to the double energy conversion (from the fluid to the mechanical shaft and then to the fluid) [
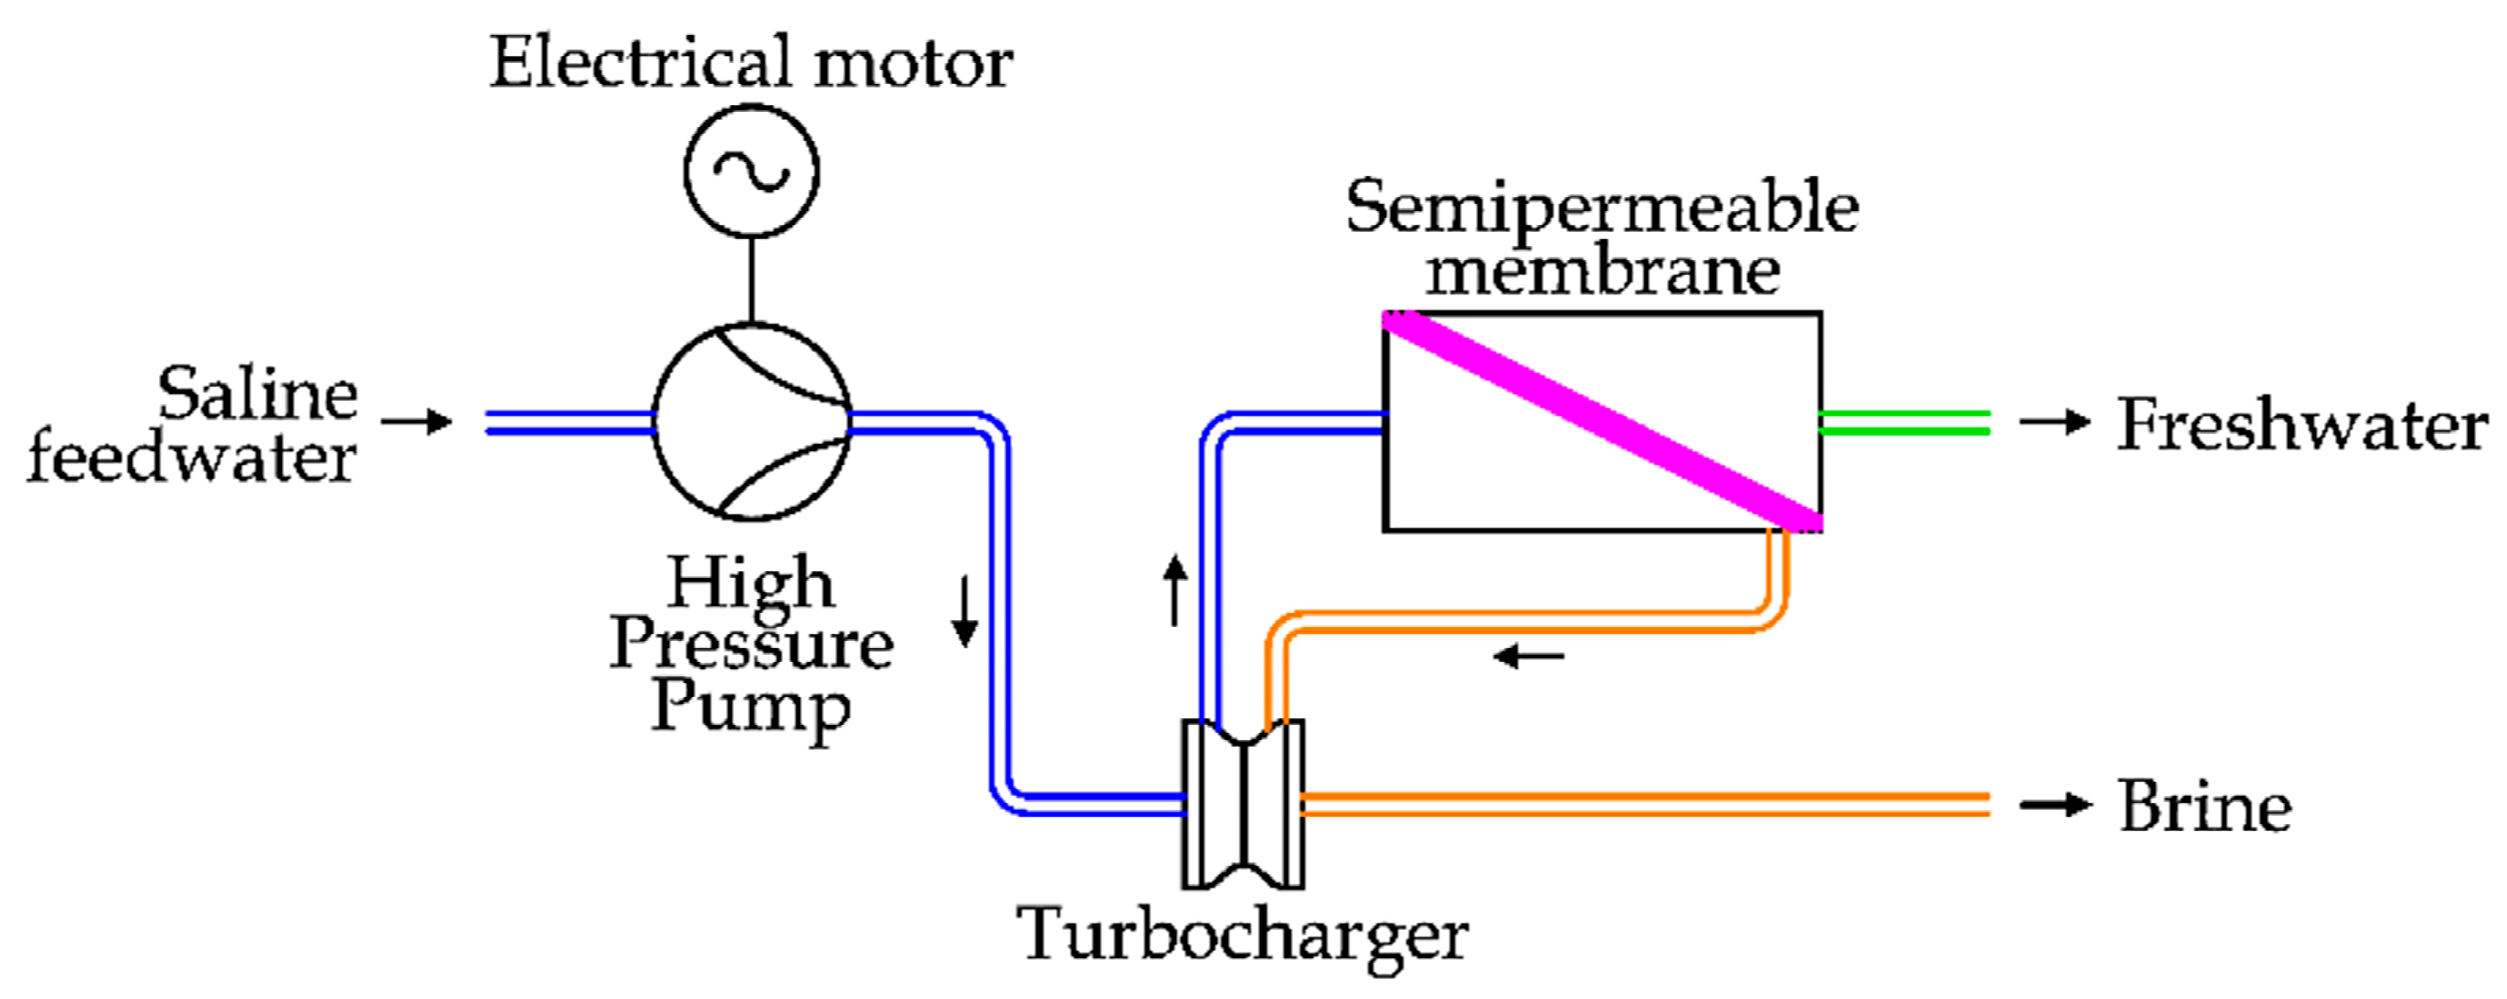
42]. At the end of the 1980s, another centrifugal ERD solution was introduced, represented by the turbocharger ERD. The working principles of this system are shown in
Figure 15.
In detail, the saline water is pressurized in two steps: the first one is entrusted to an HPP, driven by an electrical motor, and the latter one is realized by a turbocharger device, which is composed of a hydro turbine and a pump, directly coupled. This solution shows a greater energy efficiency in comparison to the previous one, as the rotary speed of the turbocharger can be modulated independently by the HPP [
43].
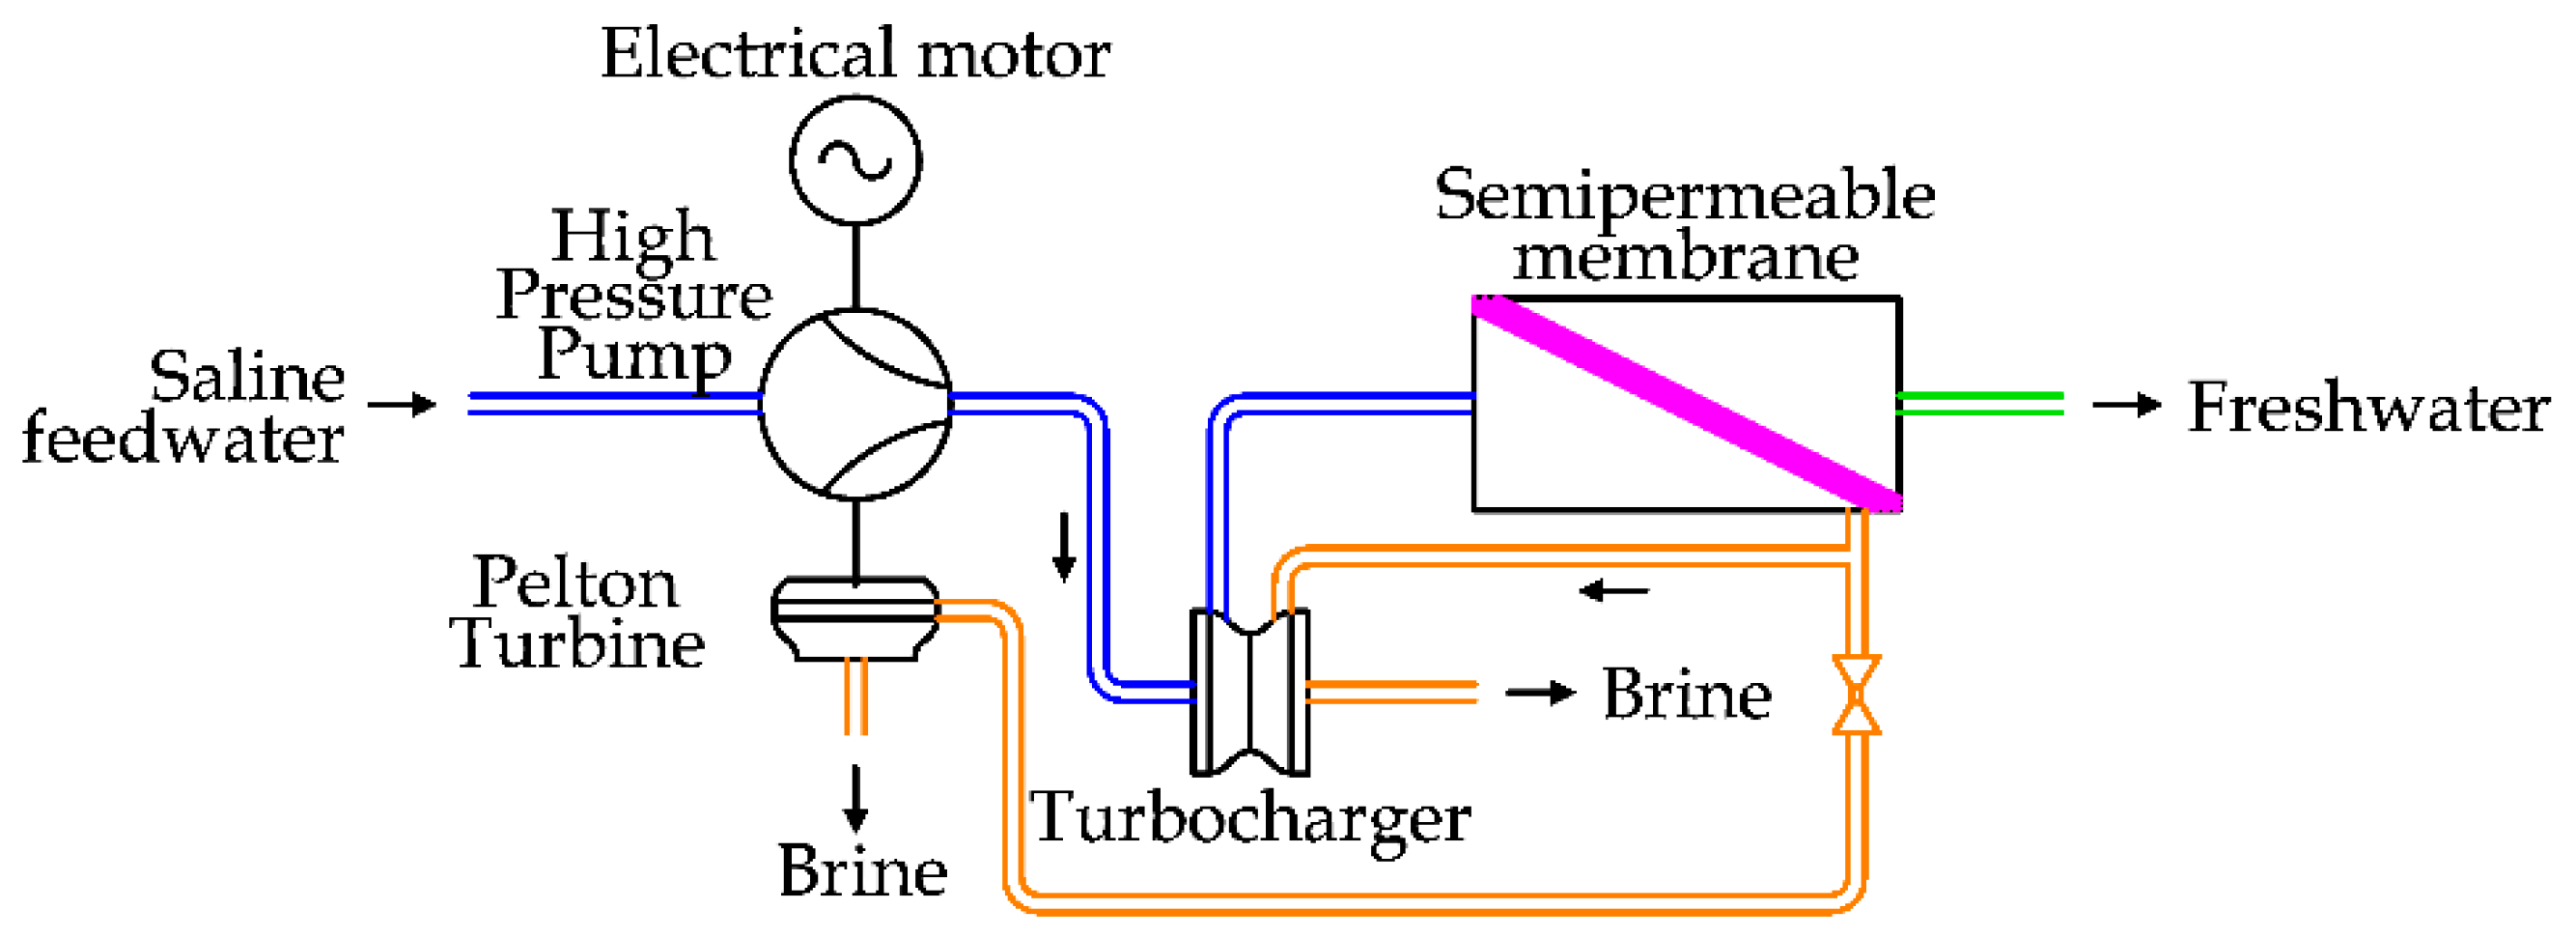
To improve the energy efficiency even in part-load, limiting the adoption of passive regulating systems, a Dual Turbine System has been proposed.
Considering the turbocharger system, shown in
Figure 15, a part of the brine flow is spilled to run a Pelton turbine and reduce the power load of the electrical motor in the HPP. A schema of this solution is reported in
Figure 16 [
37].
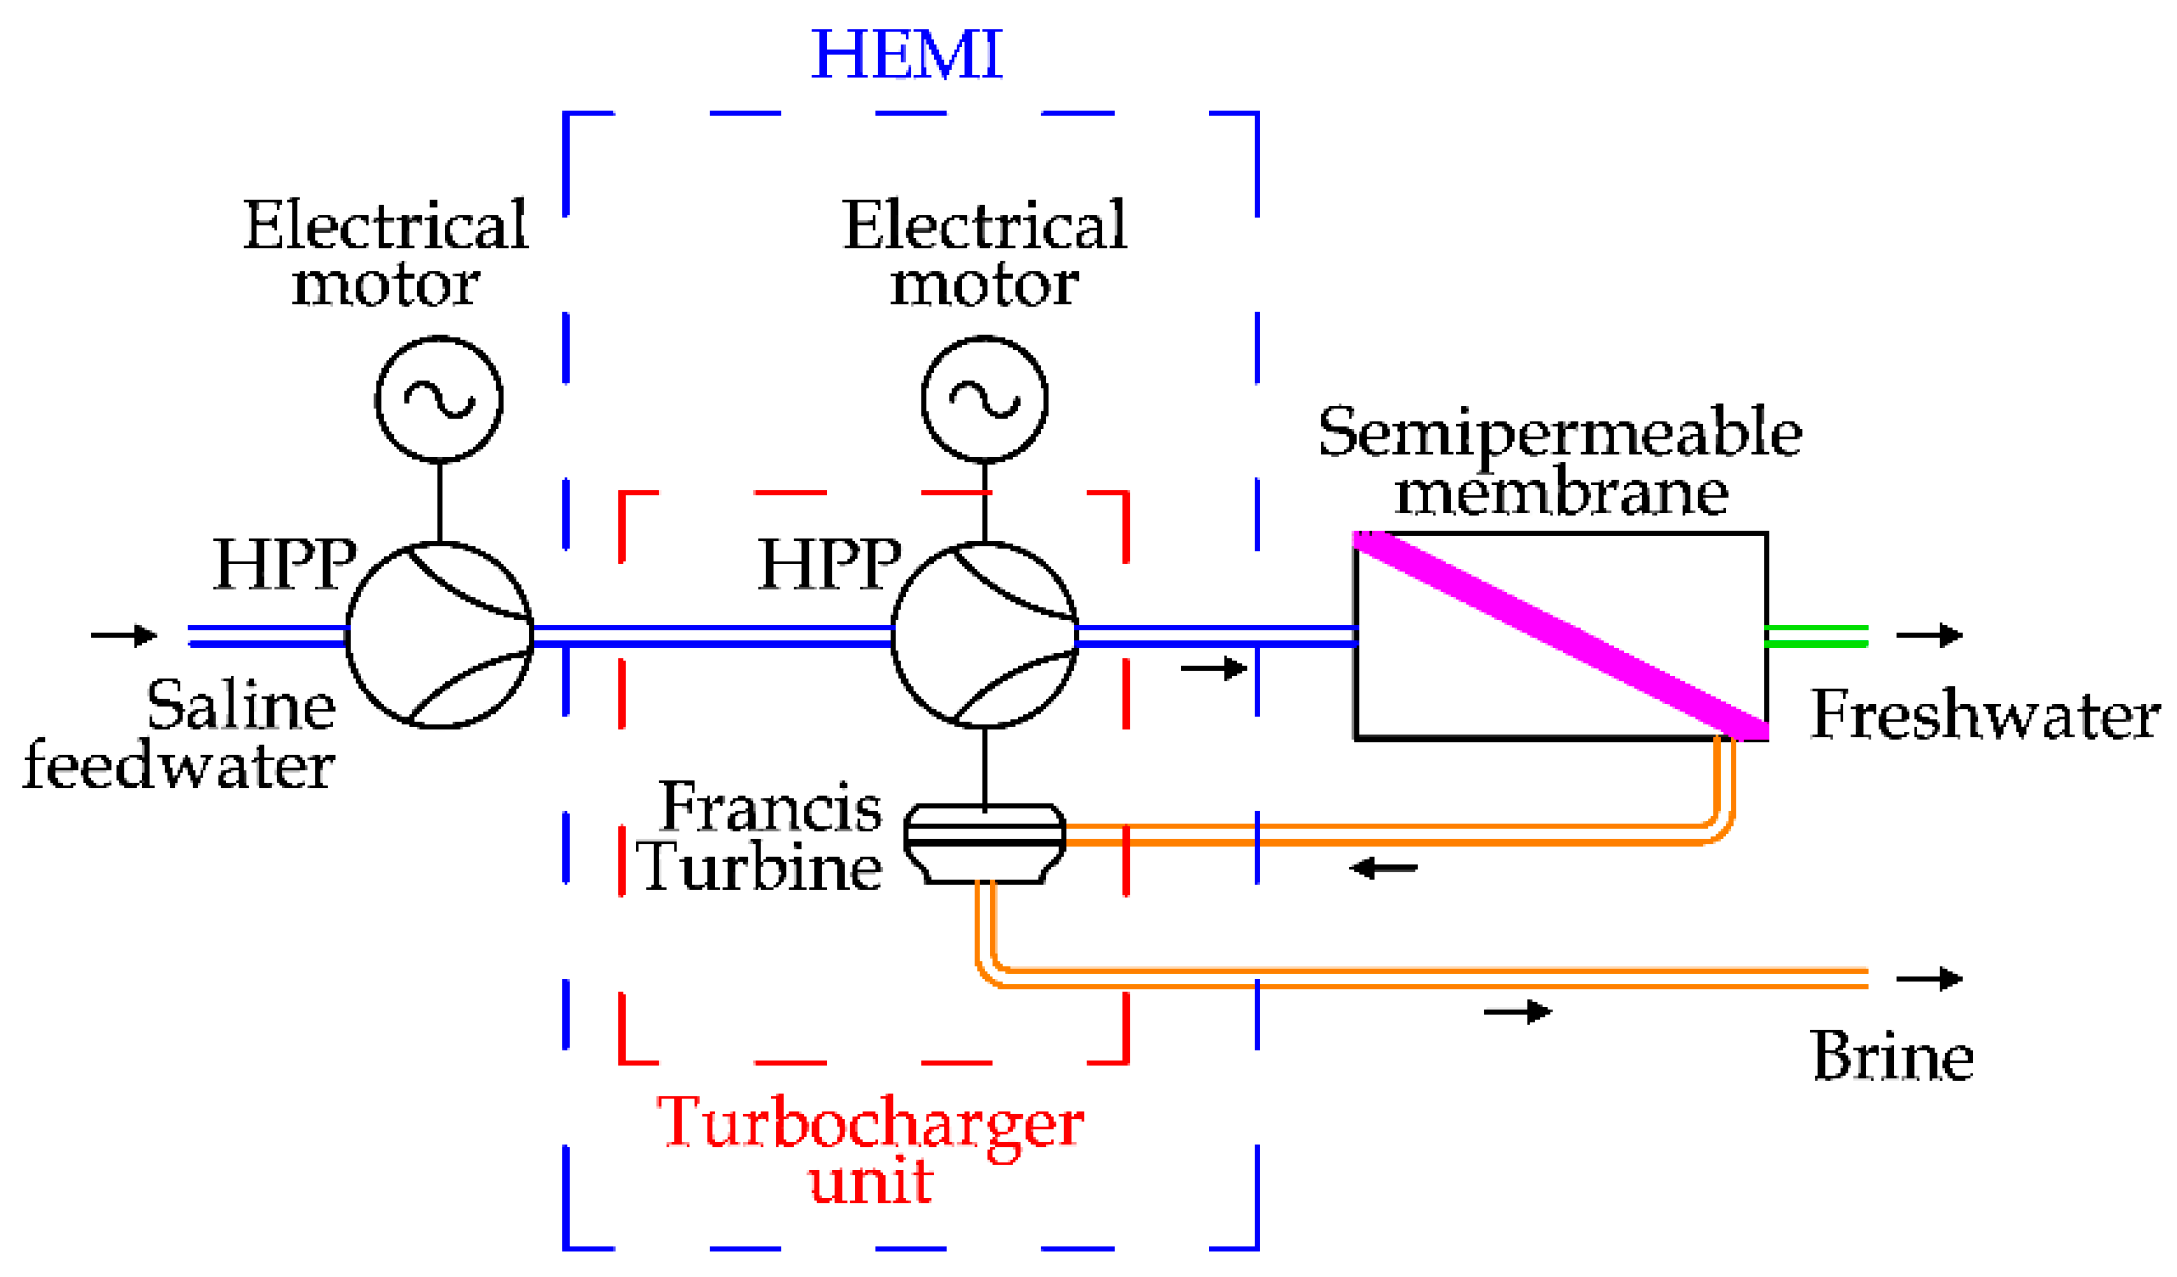
The last centrifugal solution is represented by the HEMI (Hydraulic Energy Management Integration) proposed by FEDCO (Fluid Equipment Development Company) [
44]. In detail, the HEMI solution consists of the adoption of an electrical motor in the turbocharger system, modulating the final pressure of the saline feedwater before the semipermeable membrane. In
Figure 17, the HEMI solution is depicted.
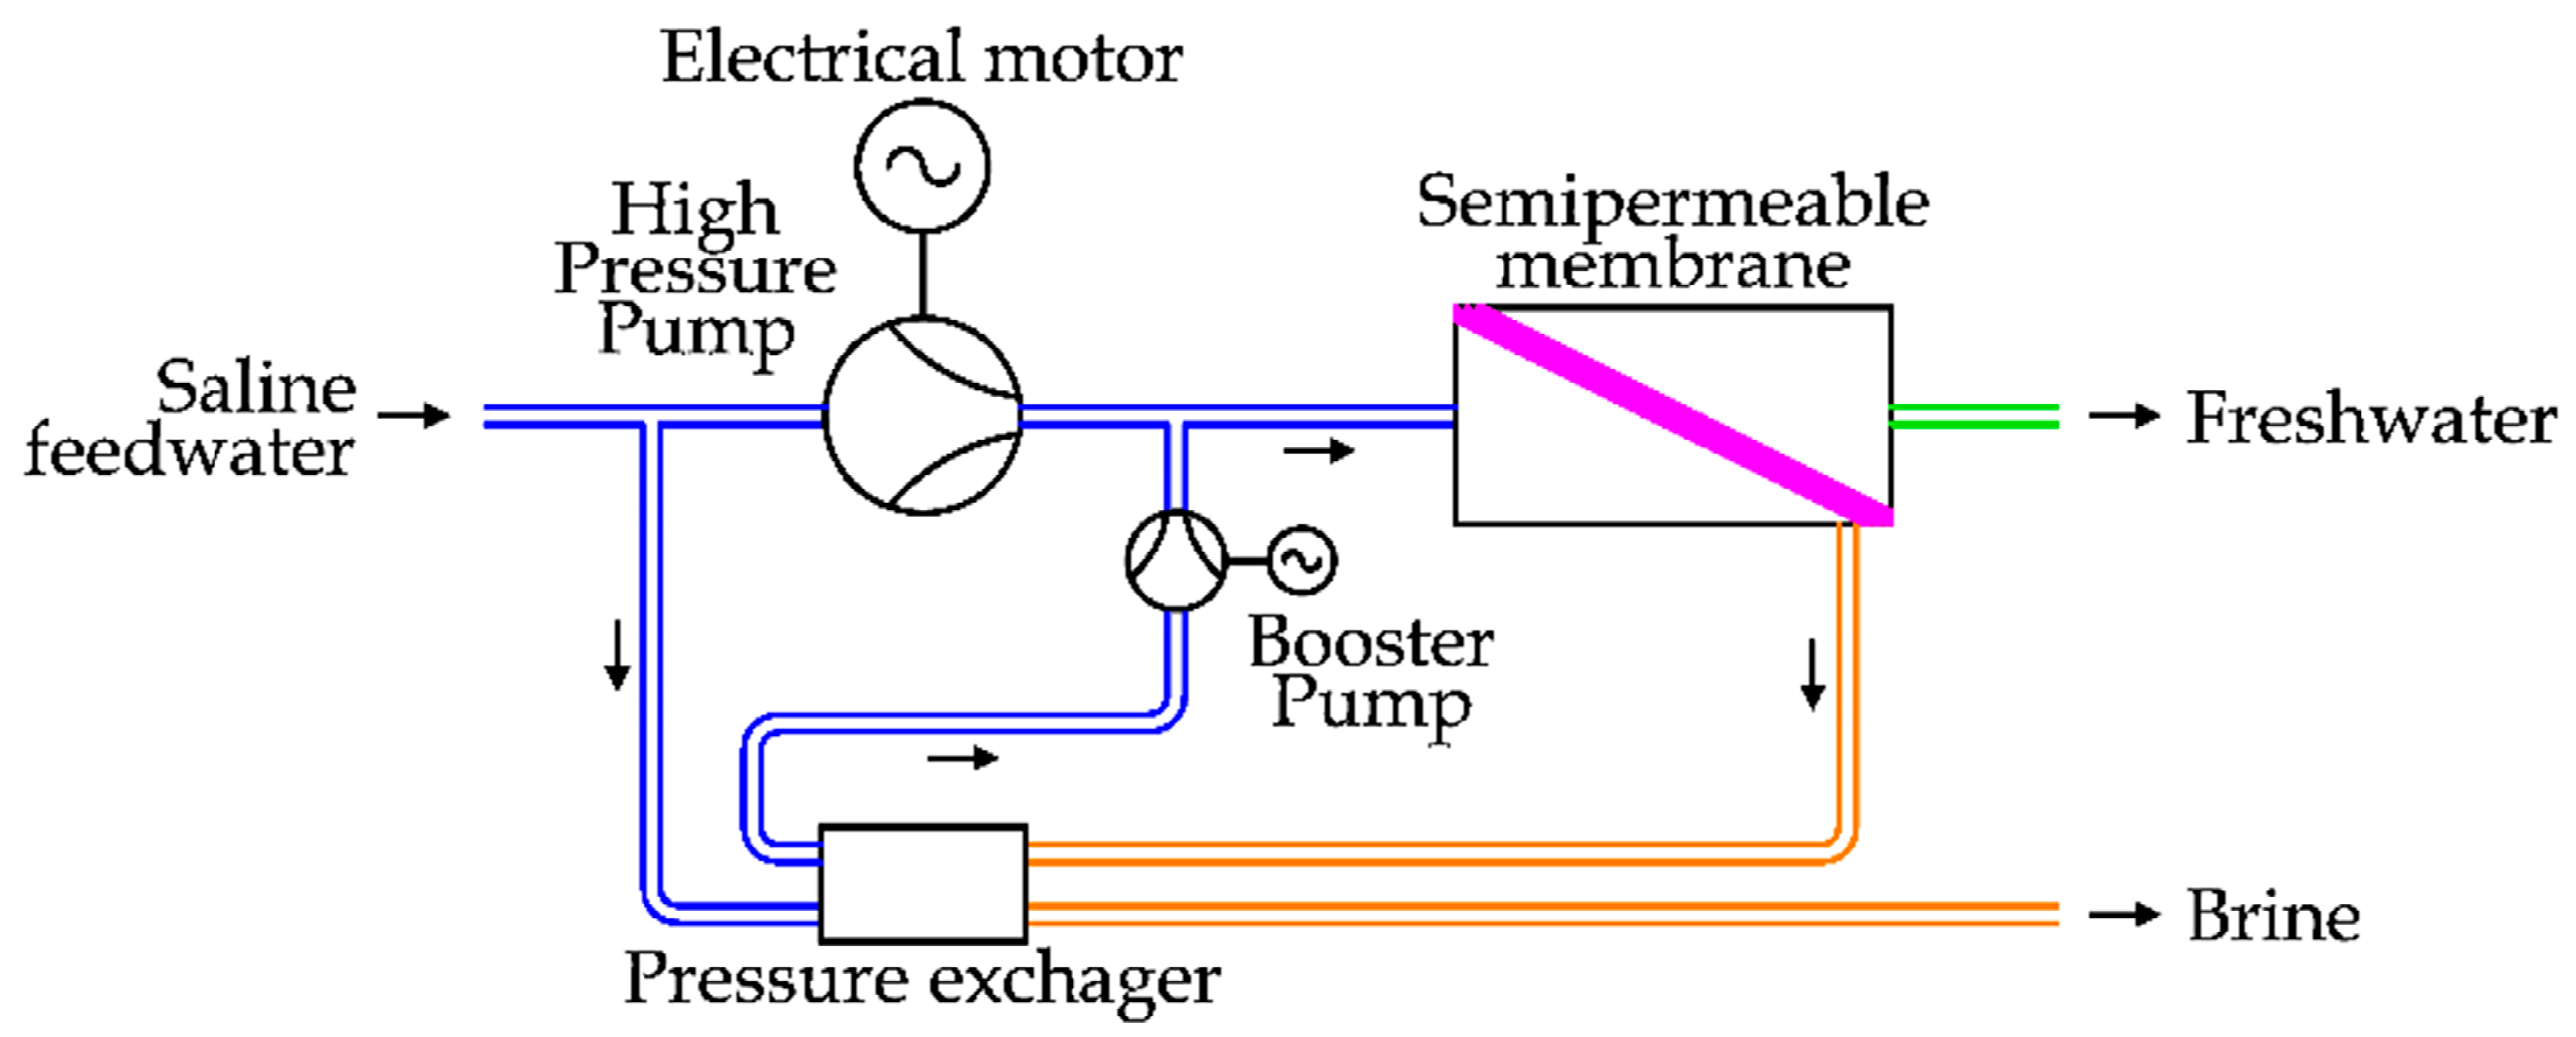
The Isobaric Devices are recent solutions used to transfer energy from the brine flow to the saline feedwater flow without intermediate energy conversions. The idea is depicted in
Figure 18.
The saline feedwater is divided in two flows: the first one is pressurized by the main HPP, driven by an electrical motor, and the latter one is pressurized by the ERD.
The HPP treats a part of the total saline feedwater flow, so this component is smaller in comparison with the previous cases, considering the same freshwater flow. At the same time, this kind of ERD shows higher energy efficiency, reducing the total energy expenditure in the desalination process.
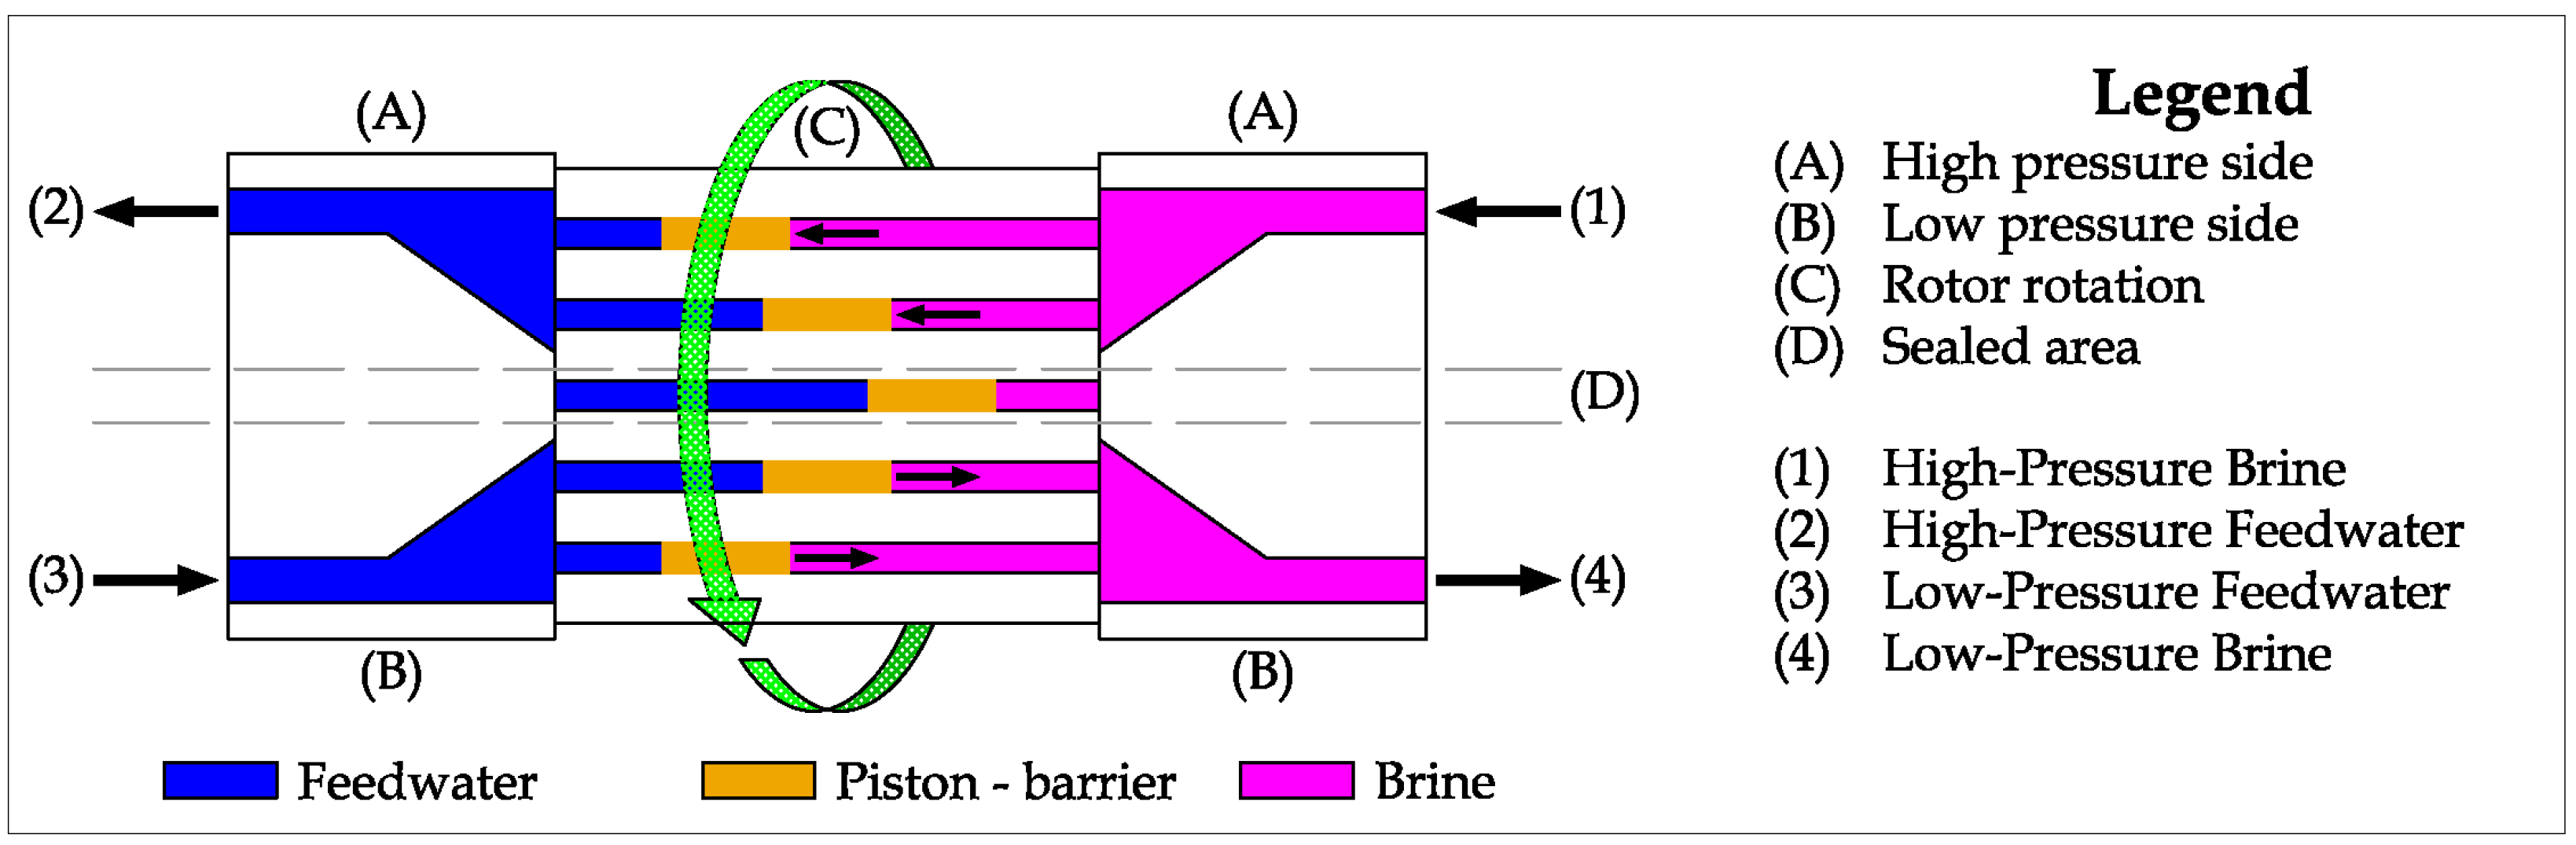
A solution is the Rotary Pressure Exchanger (RPX), depicted in
Figure 19. Inside the device, a ceramic matrix is taken into rotation by the brine flow, which enters with a tangential speed component [
45]. The channels inside the rotative matrix (part C in the picture) are alternatively connected to the High-Pressure Brine and the High-Pressure Feedwater pipes or to the Low-Pressure Feedwater and the Low-Pressure Brine pipes. In the first case, the channel, previously filled by feedwater, is now refilled by brine, pushing the feedwater inside the High-Pressure Feedwater pipe to nearly the same high pressure as the brine. In fact, a very limited pressure drop is measured due to the rotational motion of the channel matrix. Similarly, in the second case, the saline water is pushed by the feedwater, refilling the channel with feedwater at low pressure [
37]. The process is practically continuous because of the high rotary speed of the matrix and the number of internal channels.
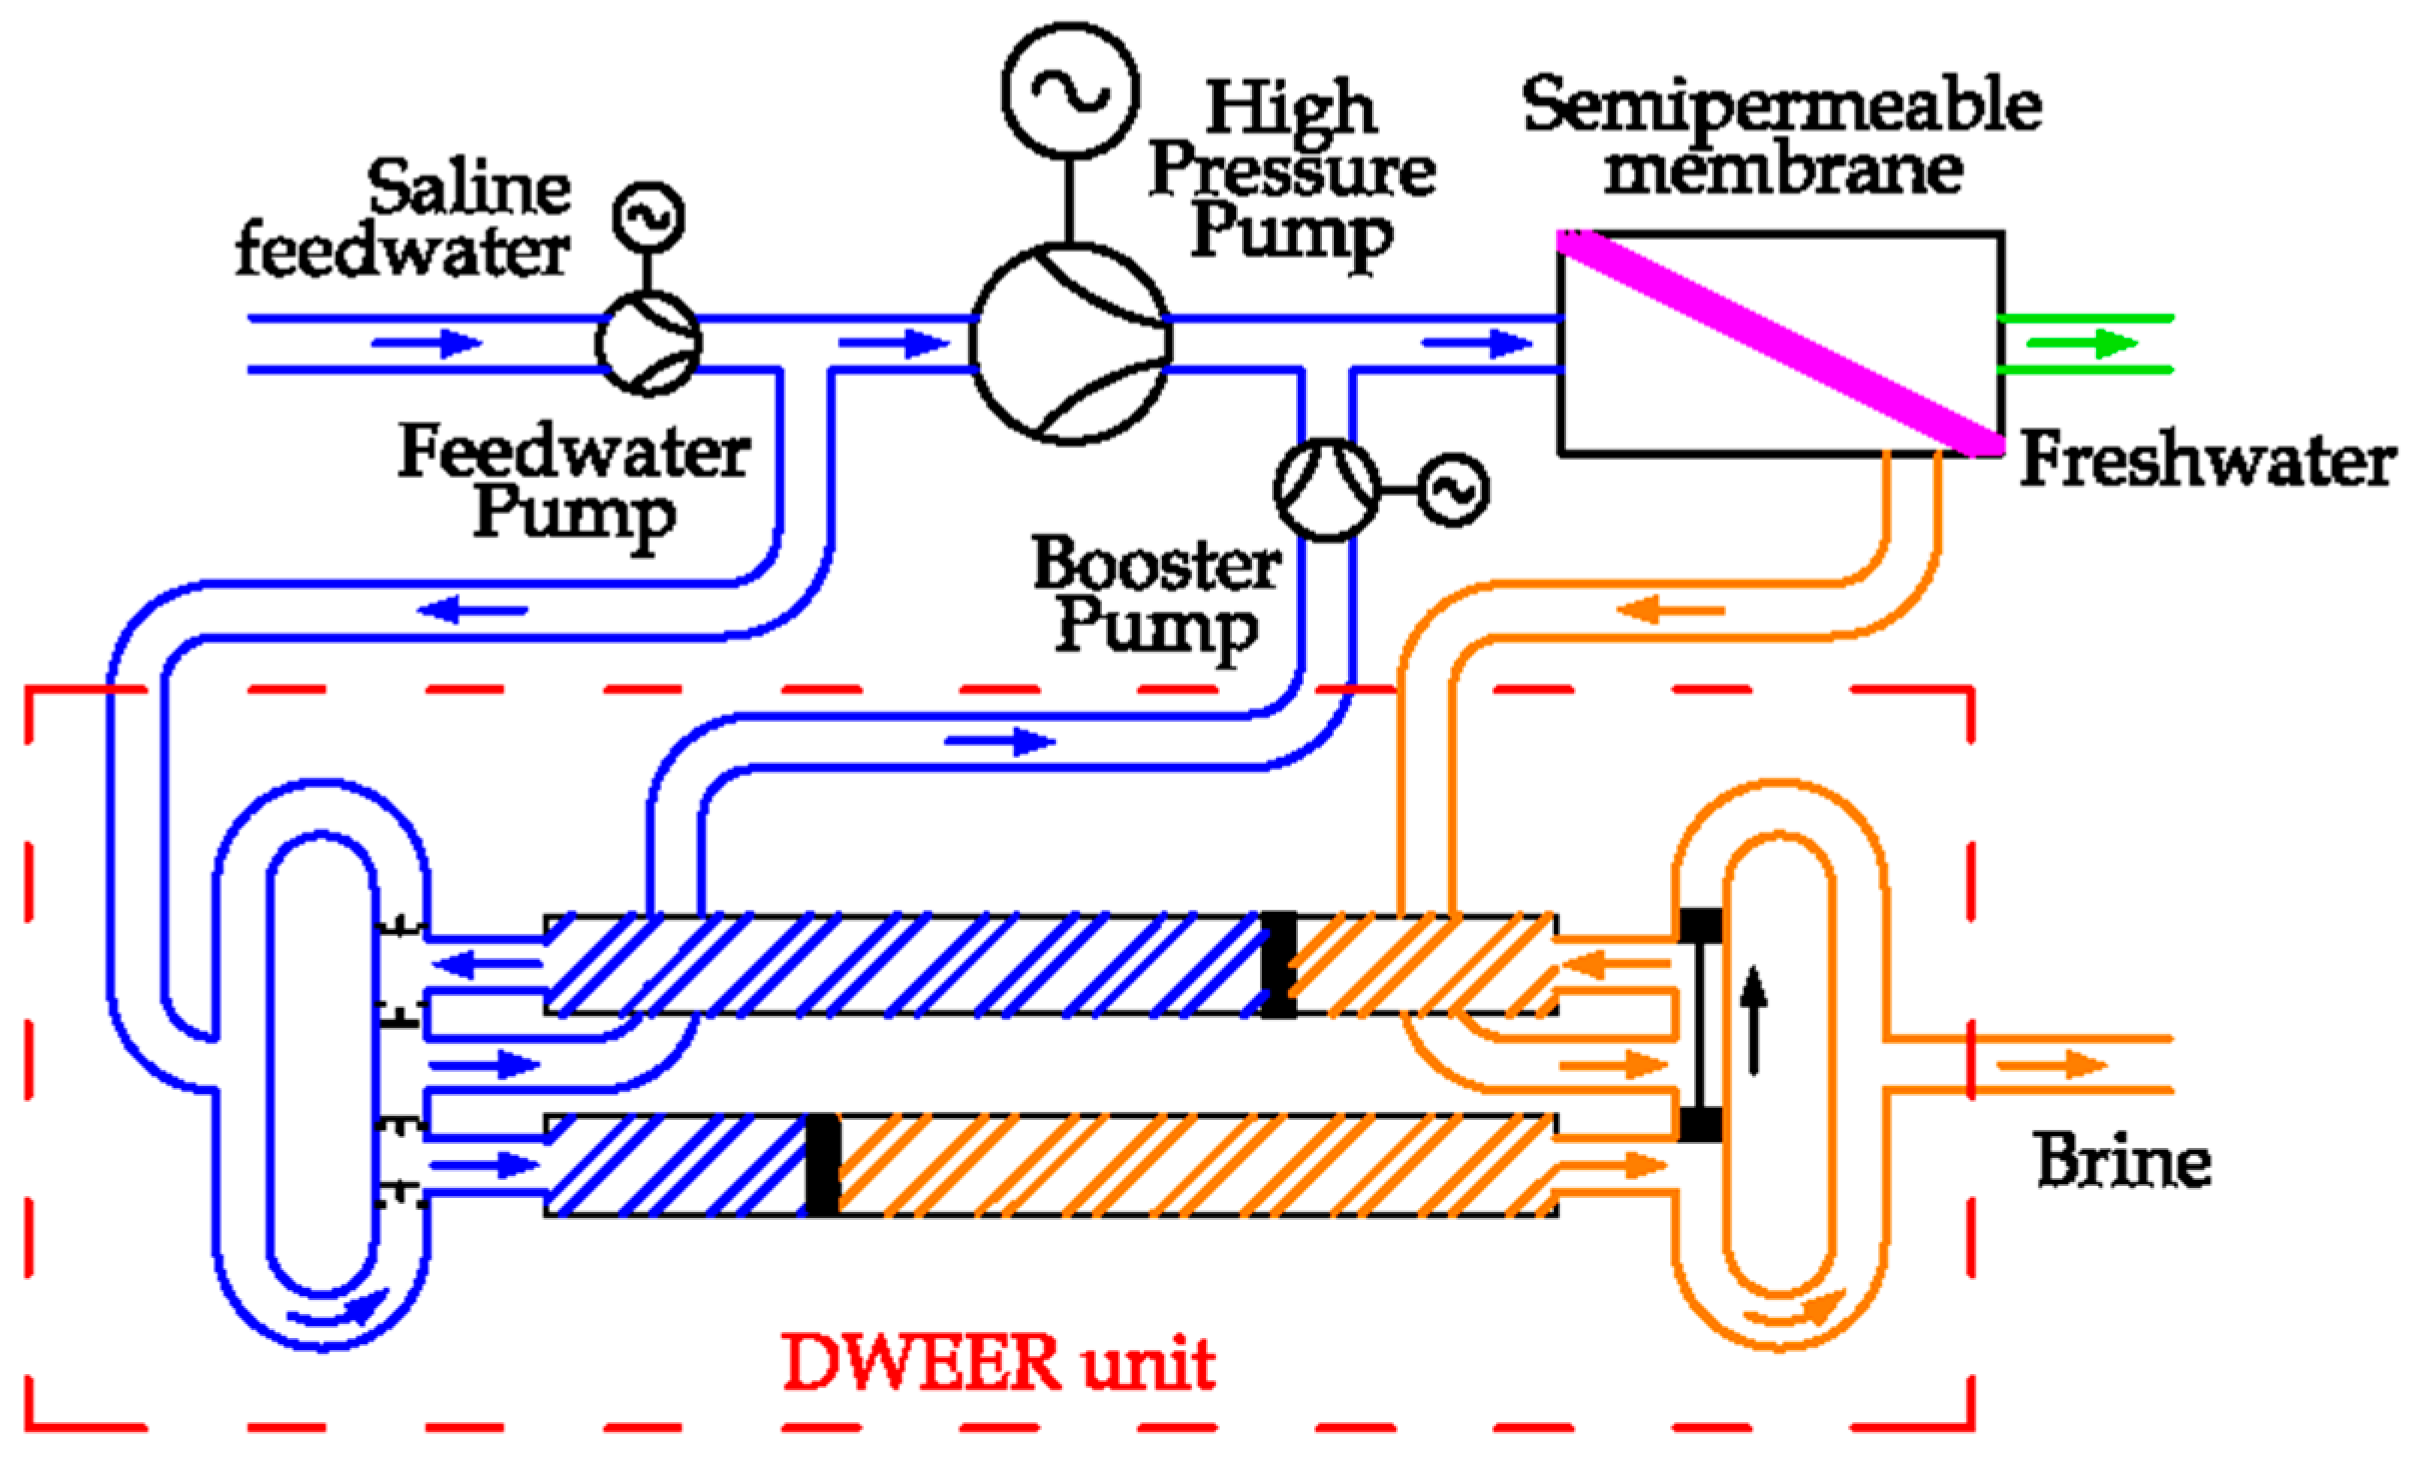
The same idea is applied in another way by the Dual Work Exchanger Energy Recovery (DWEER™), proposed by Calder AG (now Flowserve Corporation) [
37]. The DWEER system is presented in
Figure 20. In detail, the device is composed of two cylinders, with two commanded valves (LinX
® valve) to control the brine flow, and four automatic valves for the saline feedwater flow [
46].
According to the position of the LinX valve, the brine flow from the desalination unit can be introduced in one piston or in the other one. As the high pressure of the input water, the automatic valve (on the left side of the picture) is opened, transferring the saline feedwater to the booster pump. During this step, the piston is filled with brine water. Changing the position of the LinX valve, now the brine side of the cylinder is connected to the brine discharge pipe. As the water from the feedwater pump has a greater pressure than the brine discharge, the automatic valve is open, refilling the piston with saline water. The system is composed of two cylinders, which allows one to be filled with saline water (low pressure) and the other with brine (high pressure) in alternation [
37].
2.5. Forward Osmosis (FO)
As introduced in the previous section, Forward Osmosis refers to the natural process via which solvent flows from a more diluted solution to a concentrated one if they are put in contact and separated by a semipermeable membrane.
It is interesting to observe that two solutions with different solutes have the same osmotic pressure if they have the same equivalent concentration and temperature, as introduced by the van’t Hoff equation (see the Reverse Osmosis paragraph).
Therefore, it is possible to extract freshwater by using a solution of glucose more concentrated than the saline water. This approach is applied in the “hydration bags”, which are an emergency kit equipped with a semipermeable membrane, which contain sugar inside. The bag is used to produce an ingestible draw solution in case of emergency, if a water source is available (rivers, seas, puddles, ponds), thereby avoiding contamination from pathogens or toxins [
47].
FO can also be used in a continuative process. In 2005, a research team from the Yale University proposed the utilization of ammonia carbon dioxide as thermolytic draw solute [
48]. The extraction of freshwater from seawater produces the dilution of the ammonia carbon dioxide. These components can be easily recovered using a low temperature distillation. In this way, the main energy input is represented by thermal energy. Renewable energy sources could be exploited, such as solar and geothermal energy sources.
However, this technical solution is not applicable for drinking purposes because of the presence of traces of ammonia in the freshwater [
49]. In fact, according to the World Health Organization the maximal value of ammonia in freshwater for drinking purposes should be lower than 1.5 mg/L, but this condition cannot be achieved by this technology [
48].
Several researchers are investigating alternative draw solutions and better performing membranes, in order to use this technique in big desalination plants [
28]. In order to minimize the energy expended to separate the draw solution, different techniques are under investigation, such as temperature or pH variation, the adoption of electro-magnetic field or light [
50].
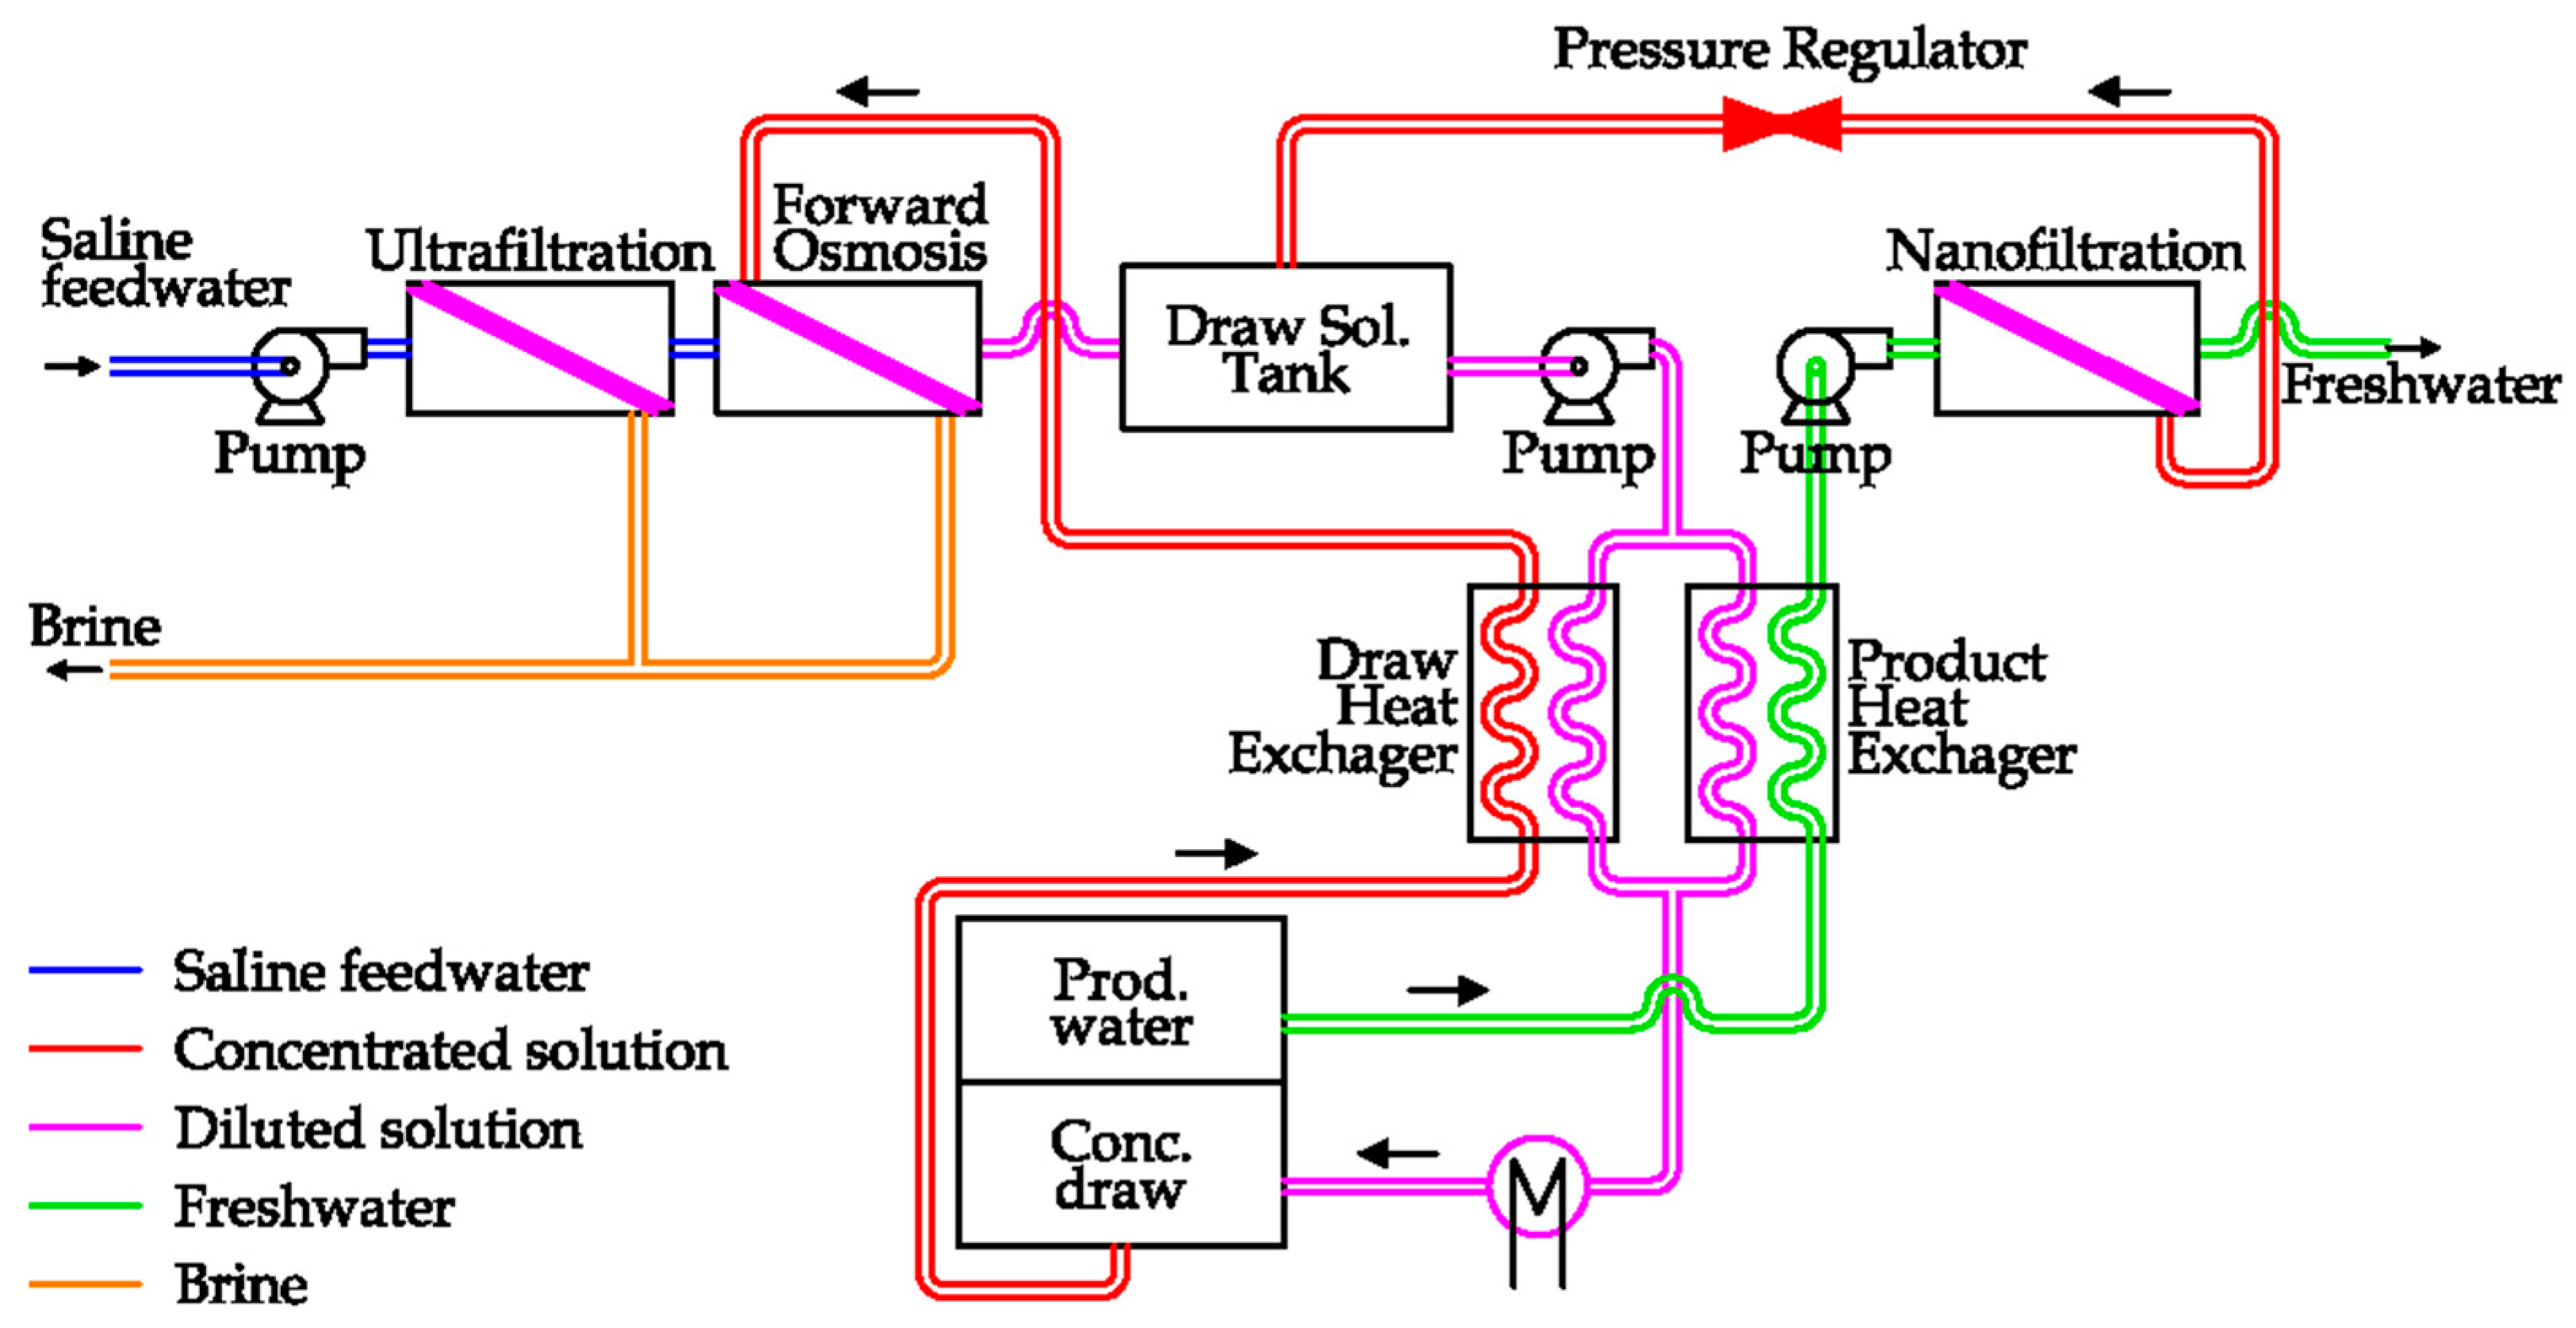
A possible solution has been proposed by Trevi Systems. The layout of the plant is reported in
Figure 21 [
51].
In detail, after a preliminary saltwater filtration is introduced into the Forward Osmosis unit. As the solution on the other side of semipermeable membrane is more concentrated, freshwater is extracted from saline water, diluting the raw solution. Thanks to an external thermal supply, the diluted solution can be separated into two flows: the concentrated raw solution, which is sent to the FO unit, and the freshwater flow, which is further filtered before the storage [
51]. This technology is in development phase.
2.6. Nanofiltration (NF)
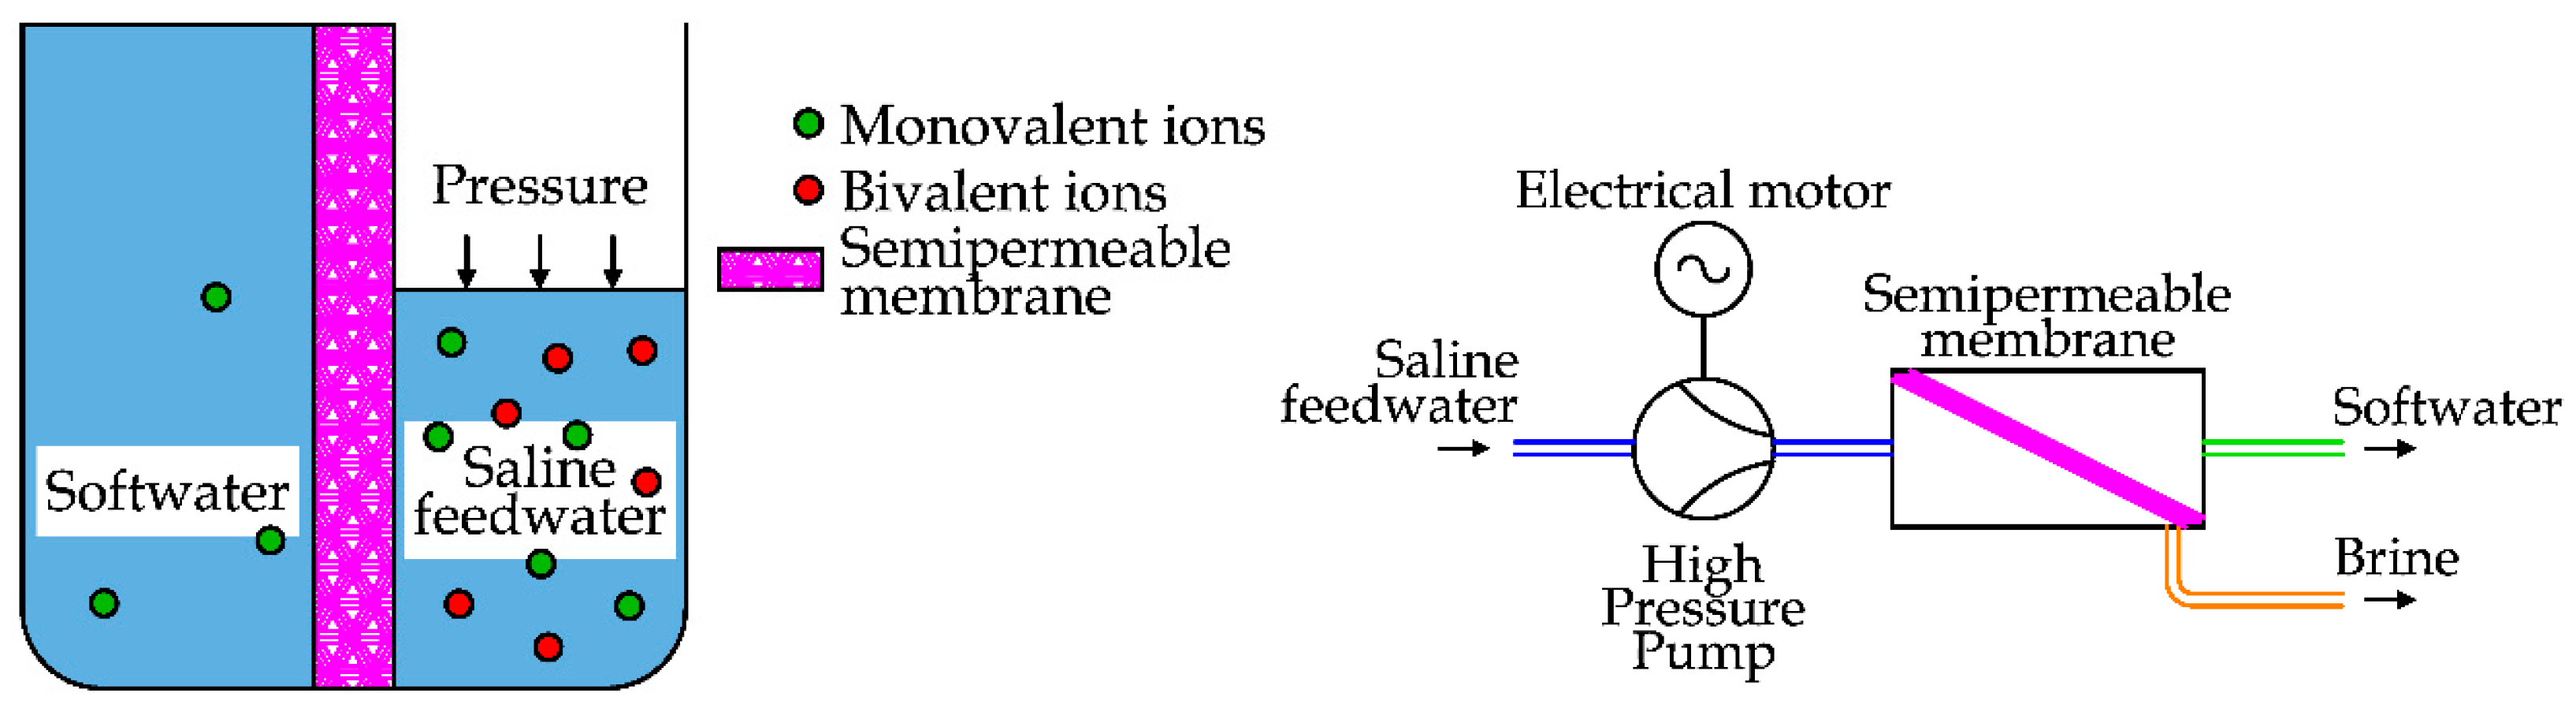
Nanofiltration is a membrane filtration process used to remove dissolved ions or organic matter to produce soft water, i.e., water with a limited number of ions that are responsible for scaling (Ca
2+, Mg
2+…). This technique is conceptually similar to RO. The main difference is the action used to remove the ions from the saltwater, as shown in
Figure 22.
NF is used in several applications such as water and wastewater, pharmaceutical and food processing [
52]. The applications for the desalination of seawater are limited, since these semipermeable membranes are more porous, allowing the passage of some dissolved solids [
23].
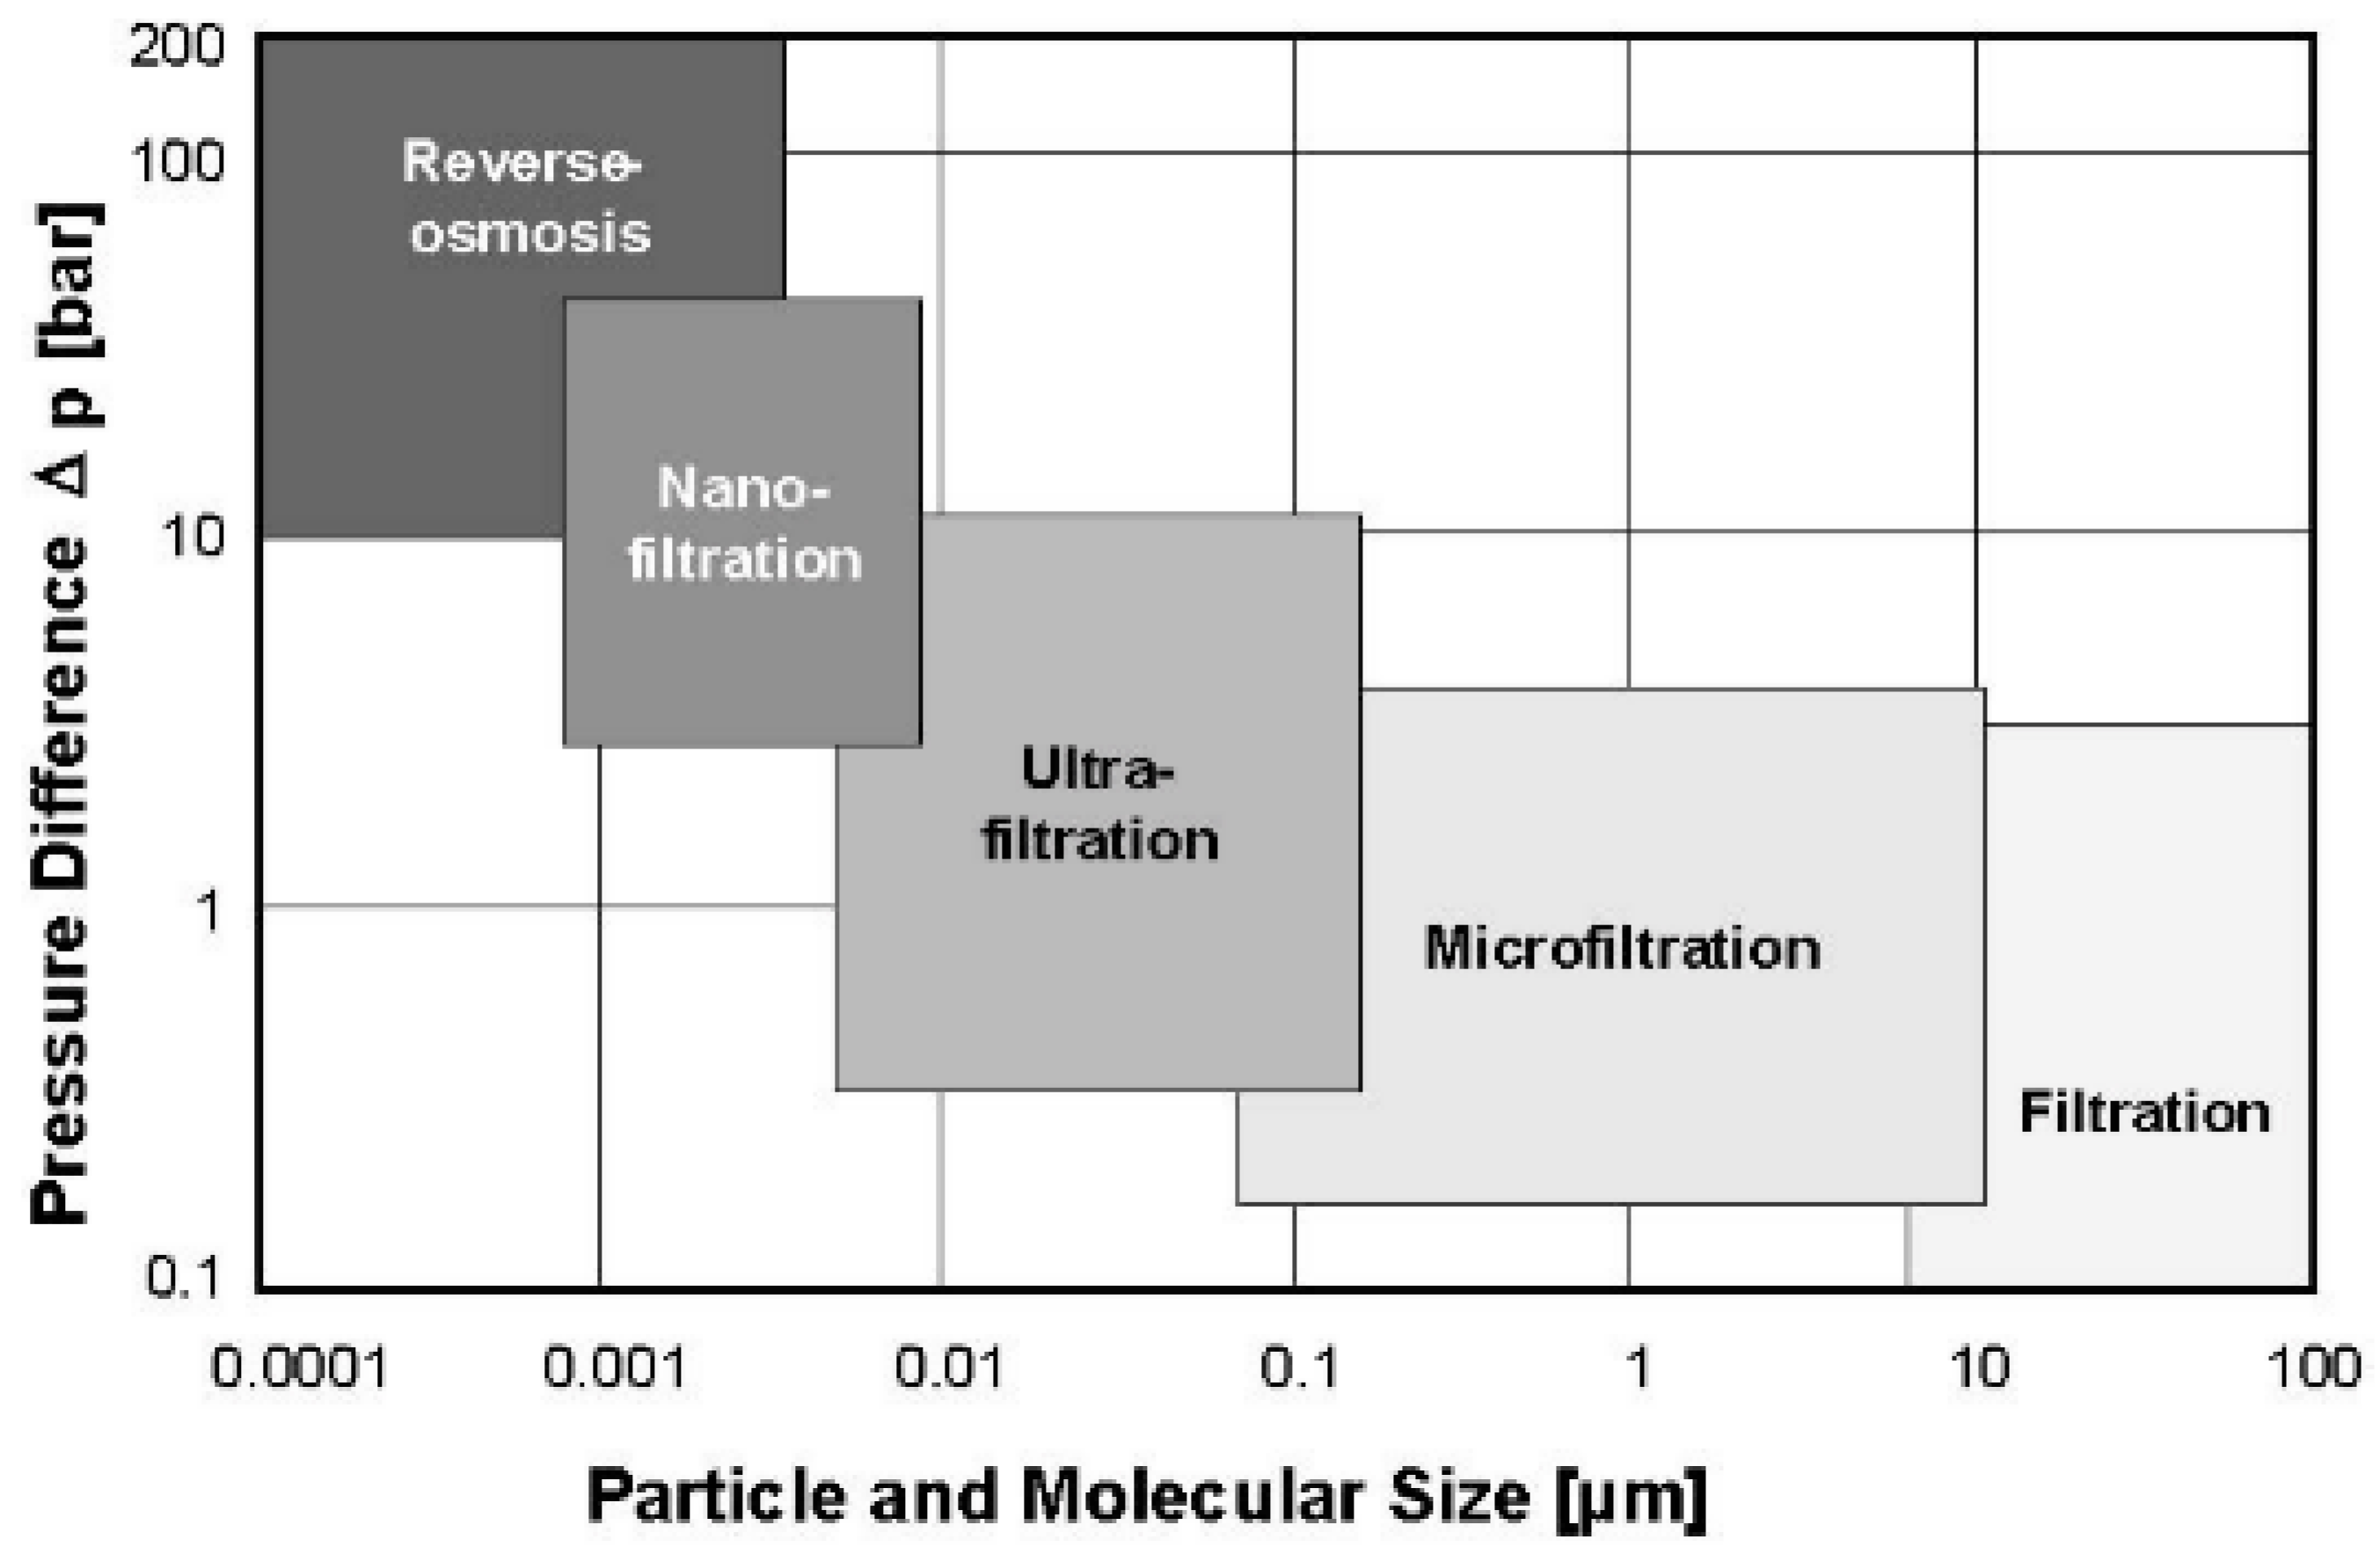
As shown in
Figure 23, filtration technologies are classified according to the size of the particles and molecules that are stopped by the membrane [
36].
The prefix “Nano” is related to the pore sizes, ranging from 1 to 10 nanometers, so smaller than other filtration techniques (microfiltration and ultrafiltration) but larger than in the RO. As a consequence, this technology removes mostly divalent ions (e.g., Ca
2+ and Mg
2+), with an efficiency of between 90% and 98%. The removal of monovalent ions is limited (between 60% and 85%) [
2].
As the soft water produced by the NF process has a greater ion concentration than RO, a lower pressure gradient must be applied to the semipermeable membrane (between 34 and 48 bar) [
2]. As NF requires a lower energy demand than RO, this solution is under investigation for seawater desalination, introducing a dual-stage unit [
46,
52].
2.7. Electrodialysis (ED)
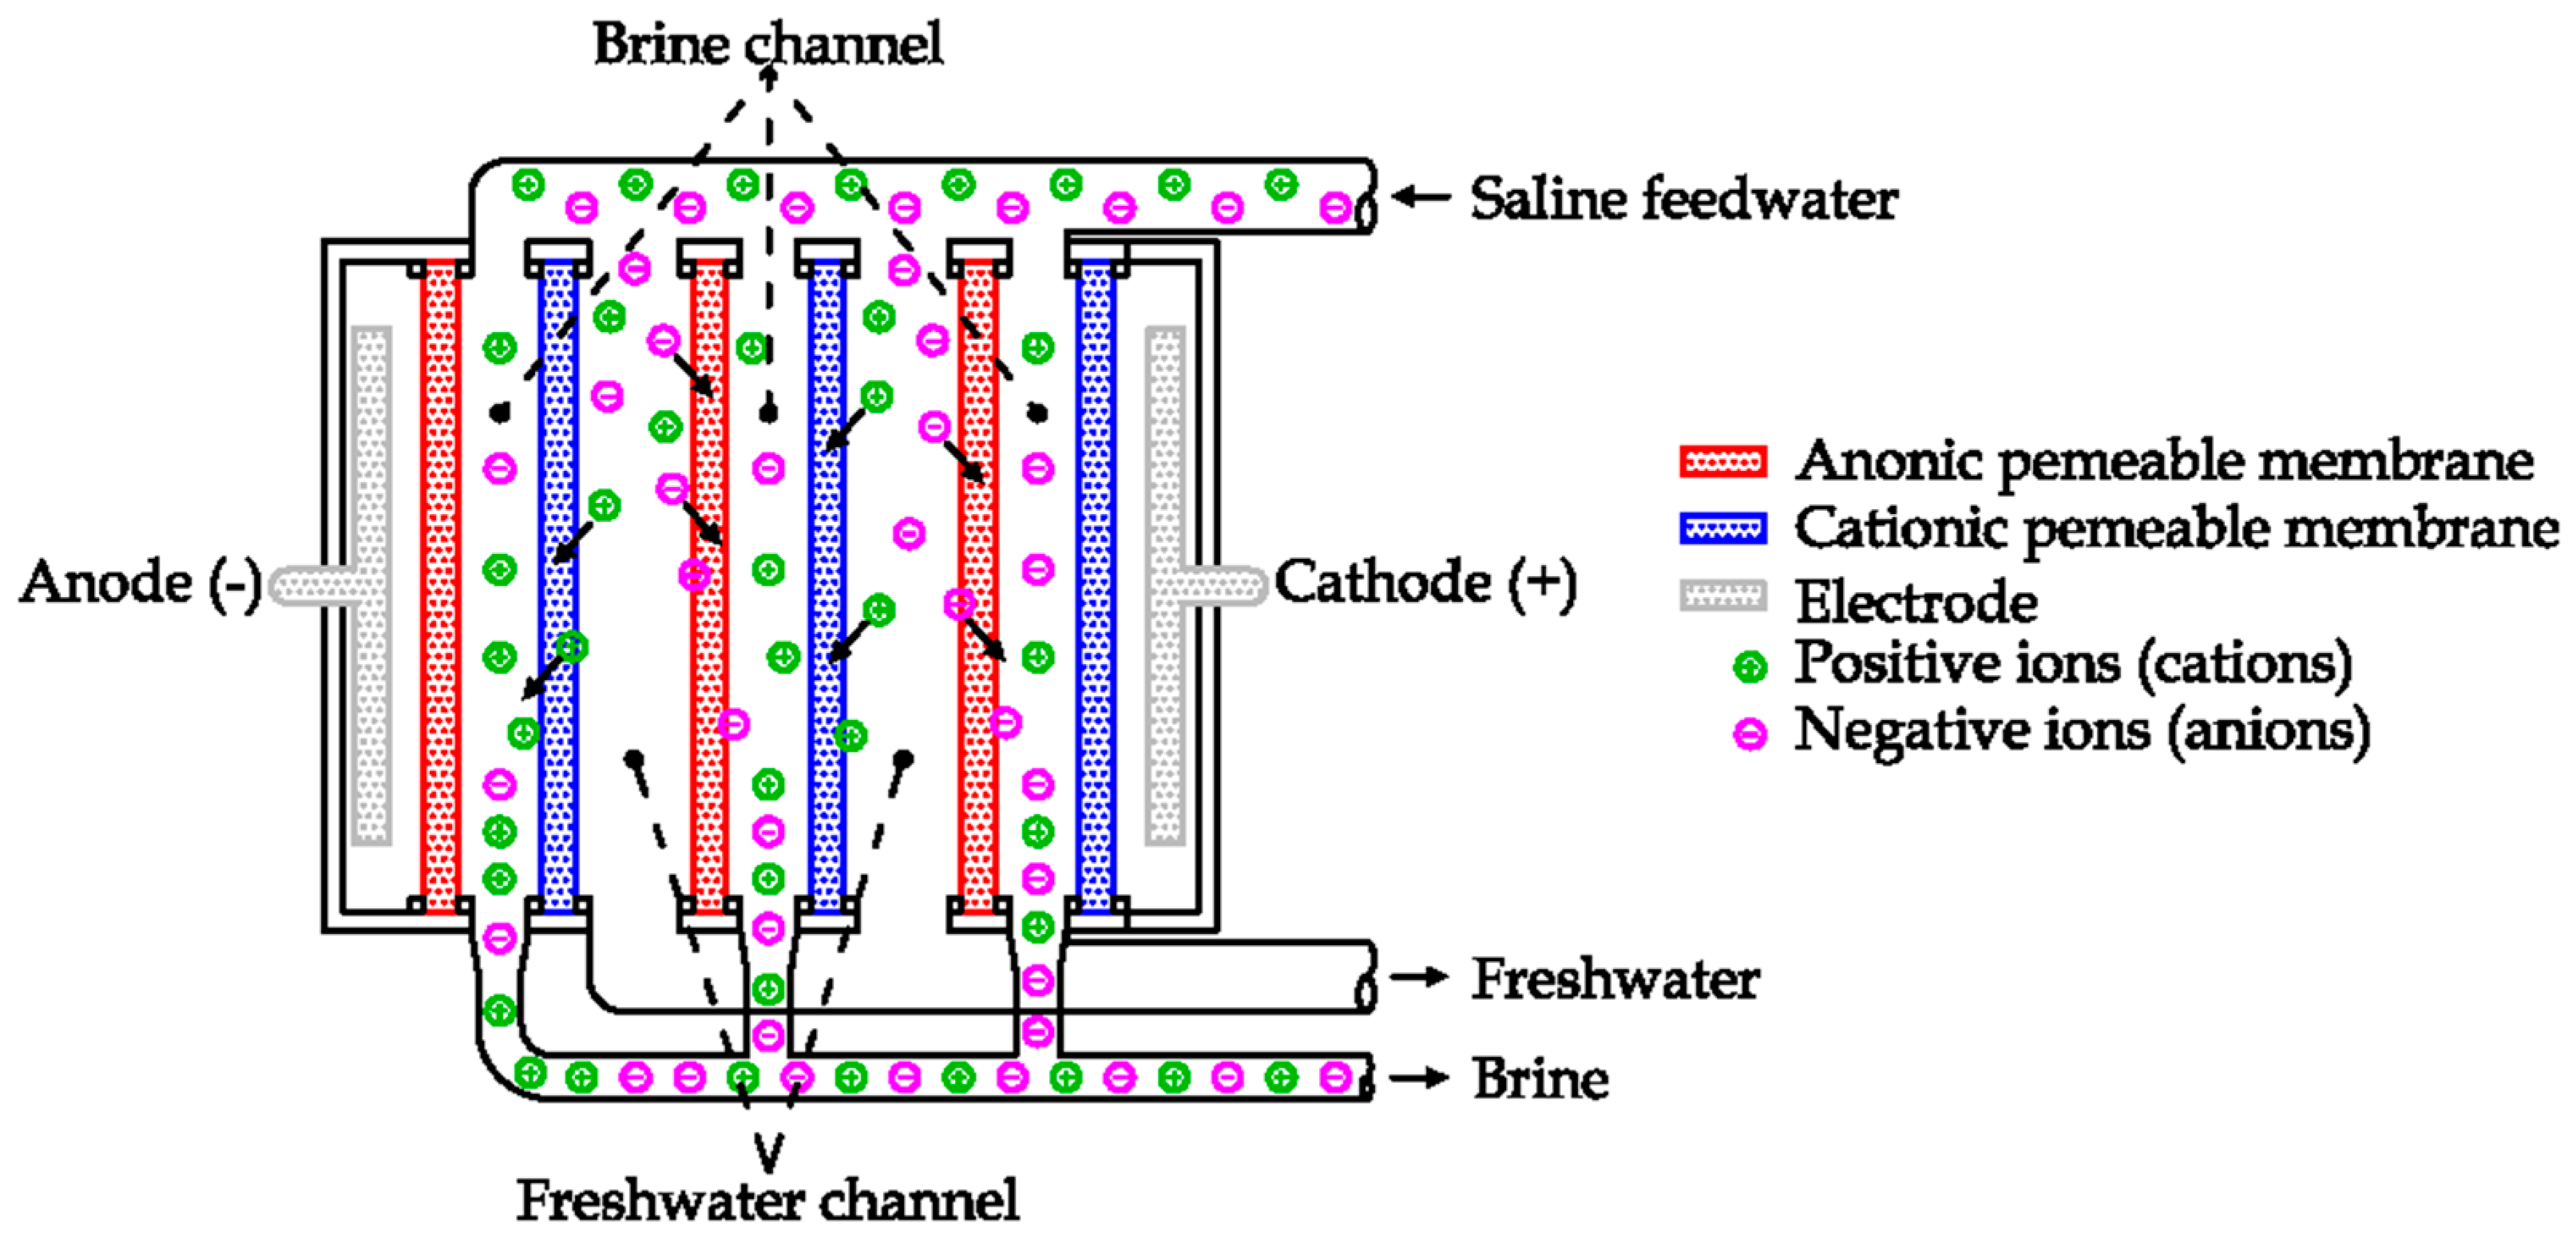
Electrodialysis (ED) is an electrochemical desalination process. This technology uses a combination of semipermeable membranes and the generation of an electric field to remove the dissolved ions from the solution [
53]. The working principles are shown in
Figure 24 [
23,
24].
The electric field is generated by two electrodes, supplied in direct current voltage. Each ion has an electric charge (positive or negative). Due to the electric field, each ion is affected by an electric force directly proportional to the amplitude of the electric field and the value of the ion charge.
The cations (positive ions, as Na
+, Ca
2+) are attracted by the anode, while the anions (negative ions, as Cl
−, HCO
3−, CO
32−) are attracted by the cathode [
53].
Anionic and cationic semipermeable membranes are alternatively installed in the region between the two electrodes. The first one allows the flow to the anions, the latter to the cations [
23]. In this way, the migration of ions generated by the electric field is selectively stopped by the semipermeable membranes. As an example, during its motion to the anode (on the left in the picture) a positive ion can cross the cationic membrane but not the anionic one. Thus, the electric field causes the motion of positive charges to the right side, while the anionic membrane stops the motion to the electrode. In the same way the negative ions migrate to the cathode but are stopped by the cationic membranes. As a result, the ions are confined inside the brine channels, removing ions from the freshwater channels (see
Figure 24) [
24].
The first ED units were commercially introduced in the early 1970s. As a solution to avoid the deposition of salts on membranes, at regular intervals the polarity of electrodes is inverted for a few minutes, changing the motion of the ions inside the unit. The feedwater channels work temporarily as brine channels and vice versa [
23]. This technology is currently used to produce freshwater from brackish water (salinity up to 2000 ppm) [
10].
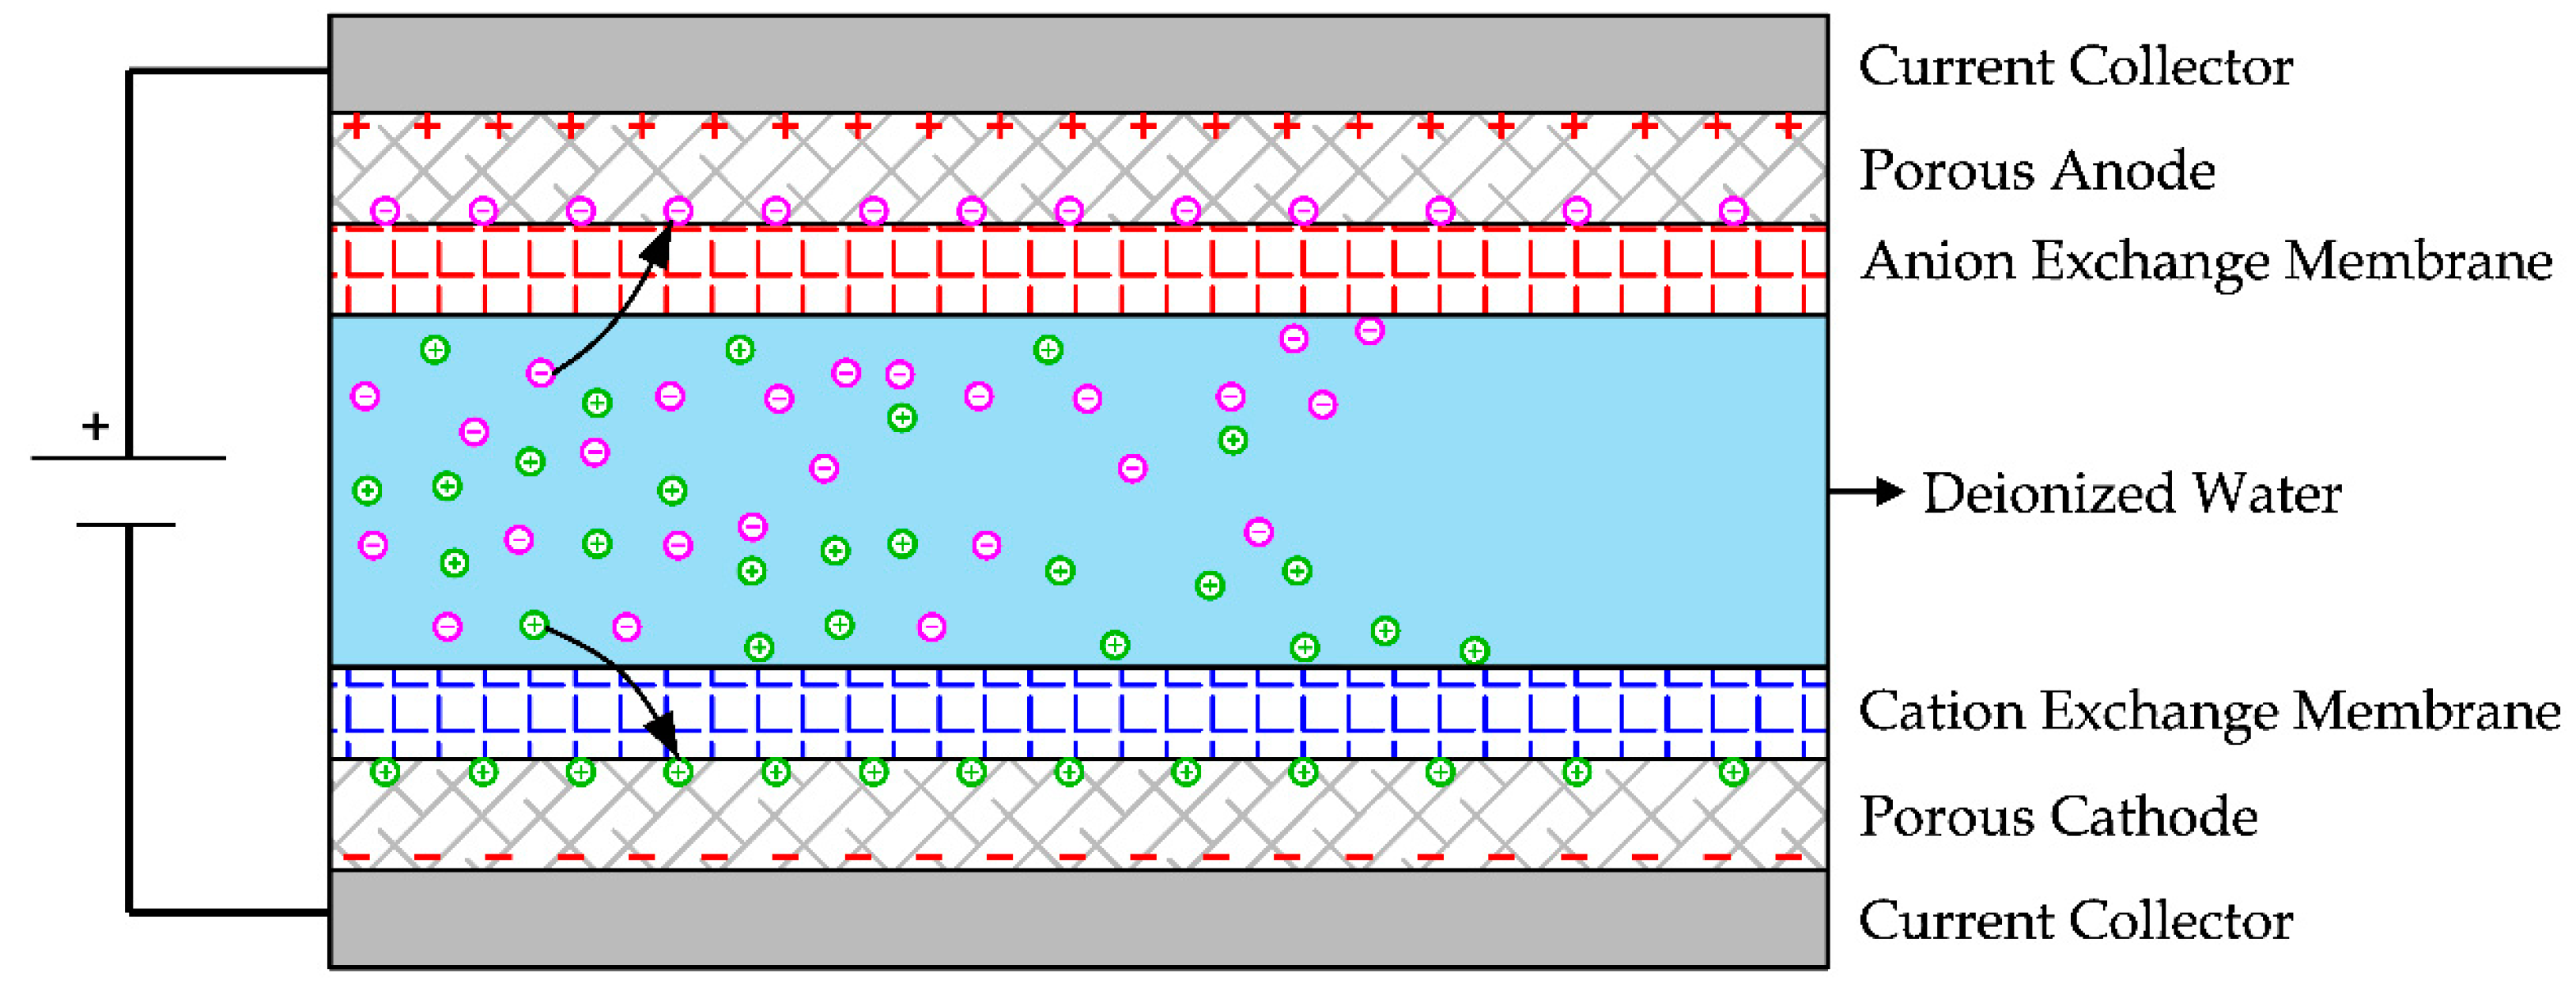
2.8. Capacitive Deionization (CDI)
Like electrodialysis reversal, in Capacitive Deionization (CDI) an electric field is produced between two carbon electrodes supplied with direct current voltage. As a consequence of the electric field, the dissolved ions are absorbed into the carbon micropores of the electrodes [
54]. To regenerate them, a reverse voltage is applied, releasing ions from the electrodes to the saltwater. The co-ion adsorption phenomenon limits the efficiency of this technology, i.e., the adsorption of ions by electrodes having the same surface charge. To improve the energy efficiency, an anion exchange membrane and a cation exchange membrane could be installed on the electrodes, as shown in
Figure 25 [
54]. This solution is called Membrane Capacitive Deionization (MCDI) [
55].
According to the literature, this technology requires a lower energy consumption for the desalination of brackish water and lower maintenance operations than the electrodialysis reversal units [
56]. Despite these advantages, CDI is a process under investigation, as it is a recent introduction in the context of saltwater desalination [
54,
57].
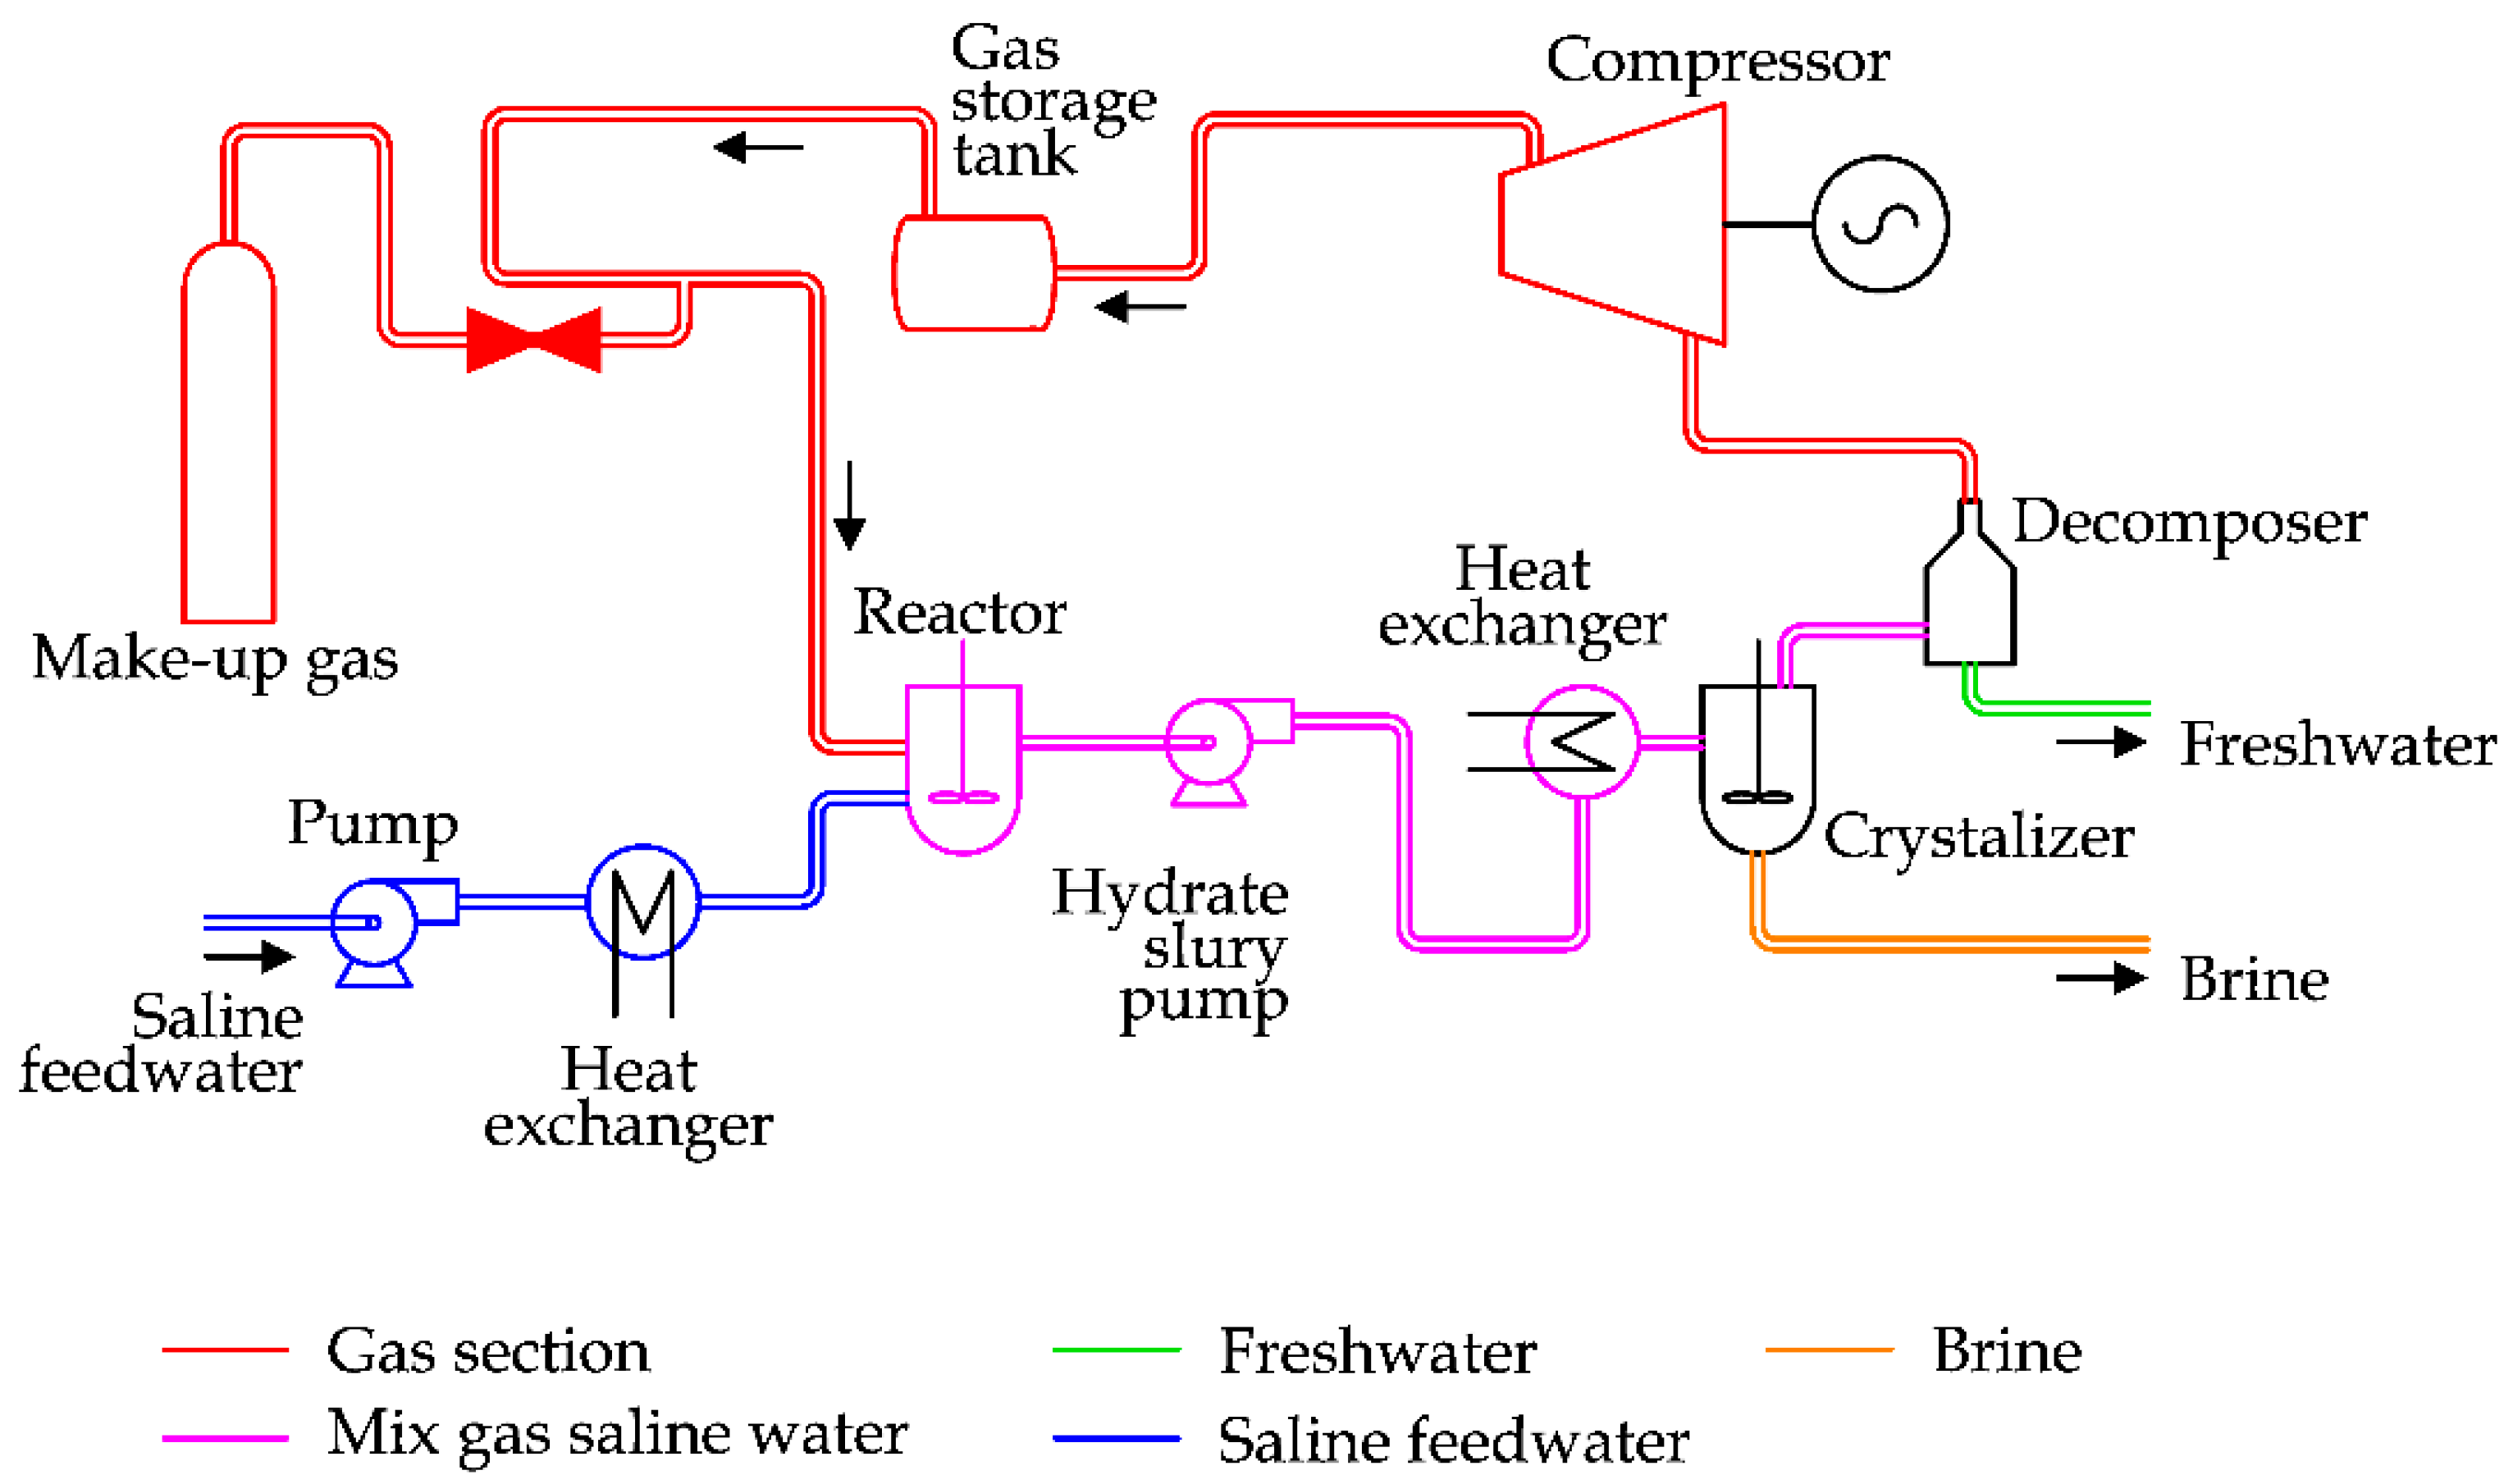
2.9. Hydration (HY)
Desalination by Hydration (HY) is based on the production of gas hydrates, which are crystalline solids composed of water (host) and gas (guest) molecules like nitrogen, carbon dioxide and methane [
58,
59]. The dissociation of 1 m
3 of hydrates can produce 0.8 m
3 of water and 164 m
3 of gas in standard conditions [
18].
As the generation of hydrates requires less severe thermodynamic conditions (T < 20 °C and P > 30 bar) than other phase transition desalination techniques, the idea behind HY desalination is the production of hydrates and then the separation into the components (gas and water). A schema of a Hydration plant is reported in
Figure 26 [
18].
In detail, after a preliminary refrigeration seawater is mixed inside a reactor with a mixture of propane and carbon dioxide. This mixture is transferred into the crystallizer, where hydrates are formed thanks to the low temperature and high pressure. The hydrate slurry is separated from the brine and transferred into a decomposer. Thanks to the heat supply, hydrates are converted into freshwater and gas. The last one is recovered to be reused to produce hydrates [
18].
This technology should require a lower energy expenditure in comparison with MSF and RO, however no commercial plants are available, as capital costs are high [
18].
2.10. Secondary Refrigerant Freezing (SRF)
Secondary Refrigerant Freezing (SRF) is a desalination process based on the liquid solid phase transition [
60]. As the ice formed contains a limited quantity of salts, this technique can be used to produce freshwater from seawater. A refrigerant is used to freeze the saline water. The main problem is the removal of the ice produced in the process [
28]. A solution proposed by Lin et al. suggests the utilization of low temperatures available for the regasification of LNG (Liquid Natural Gas) to freeze seawater and obtain ice [
60].
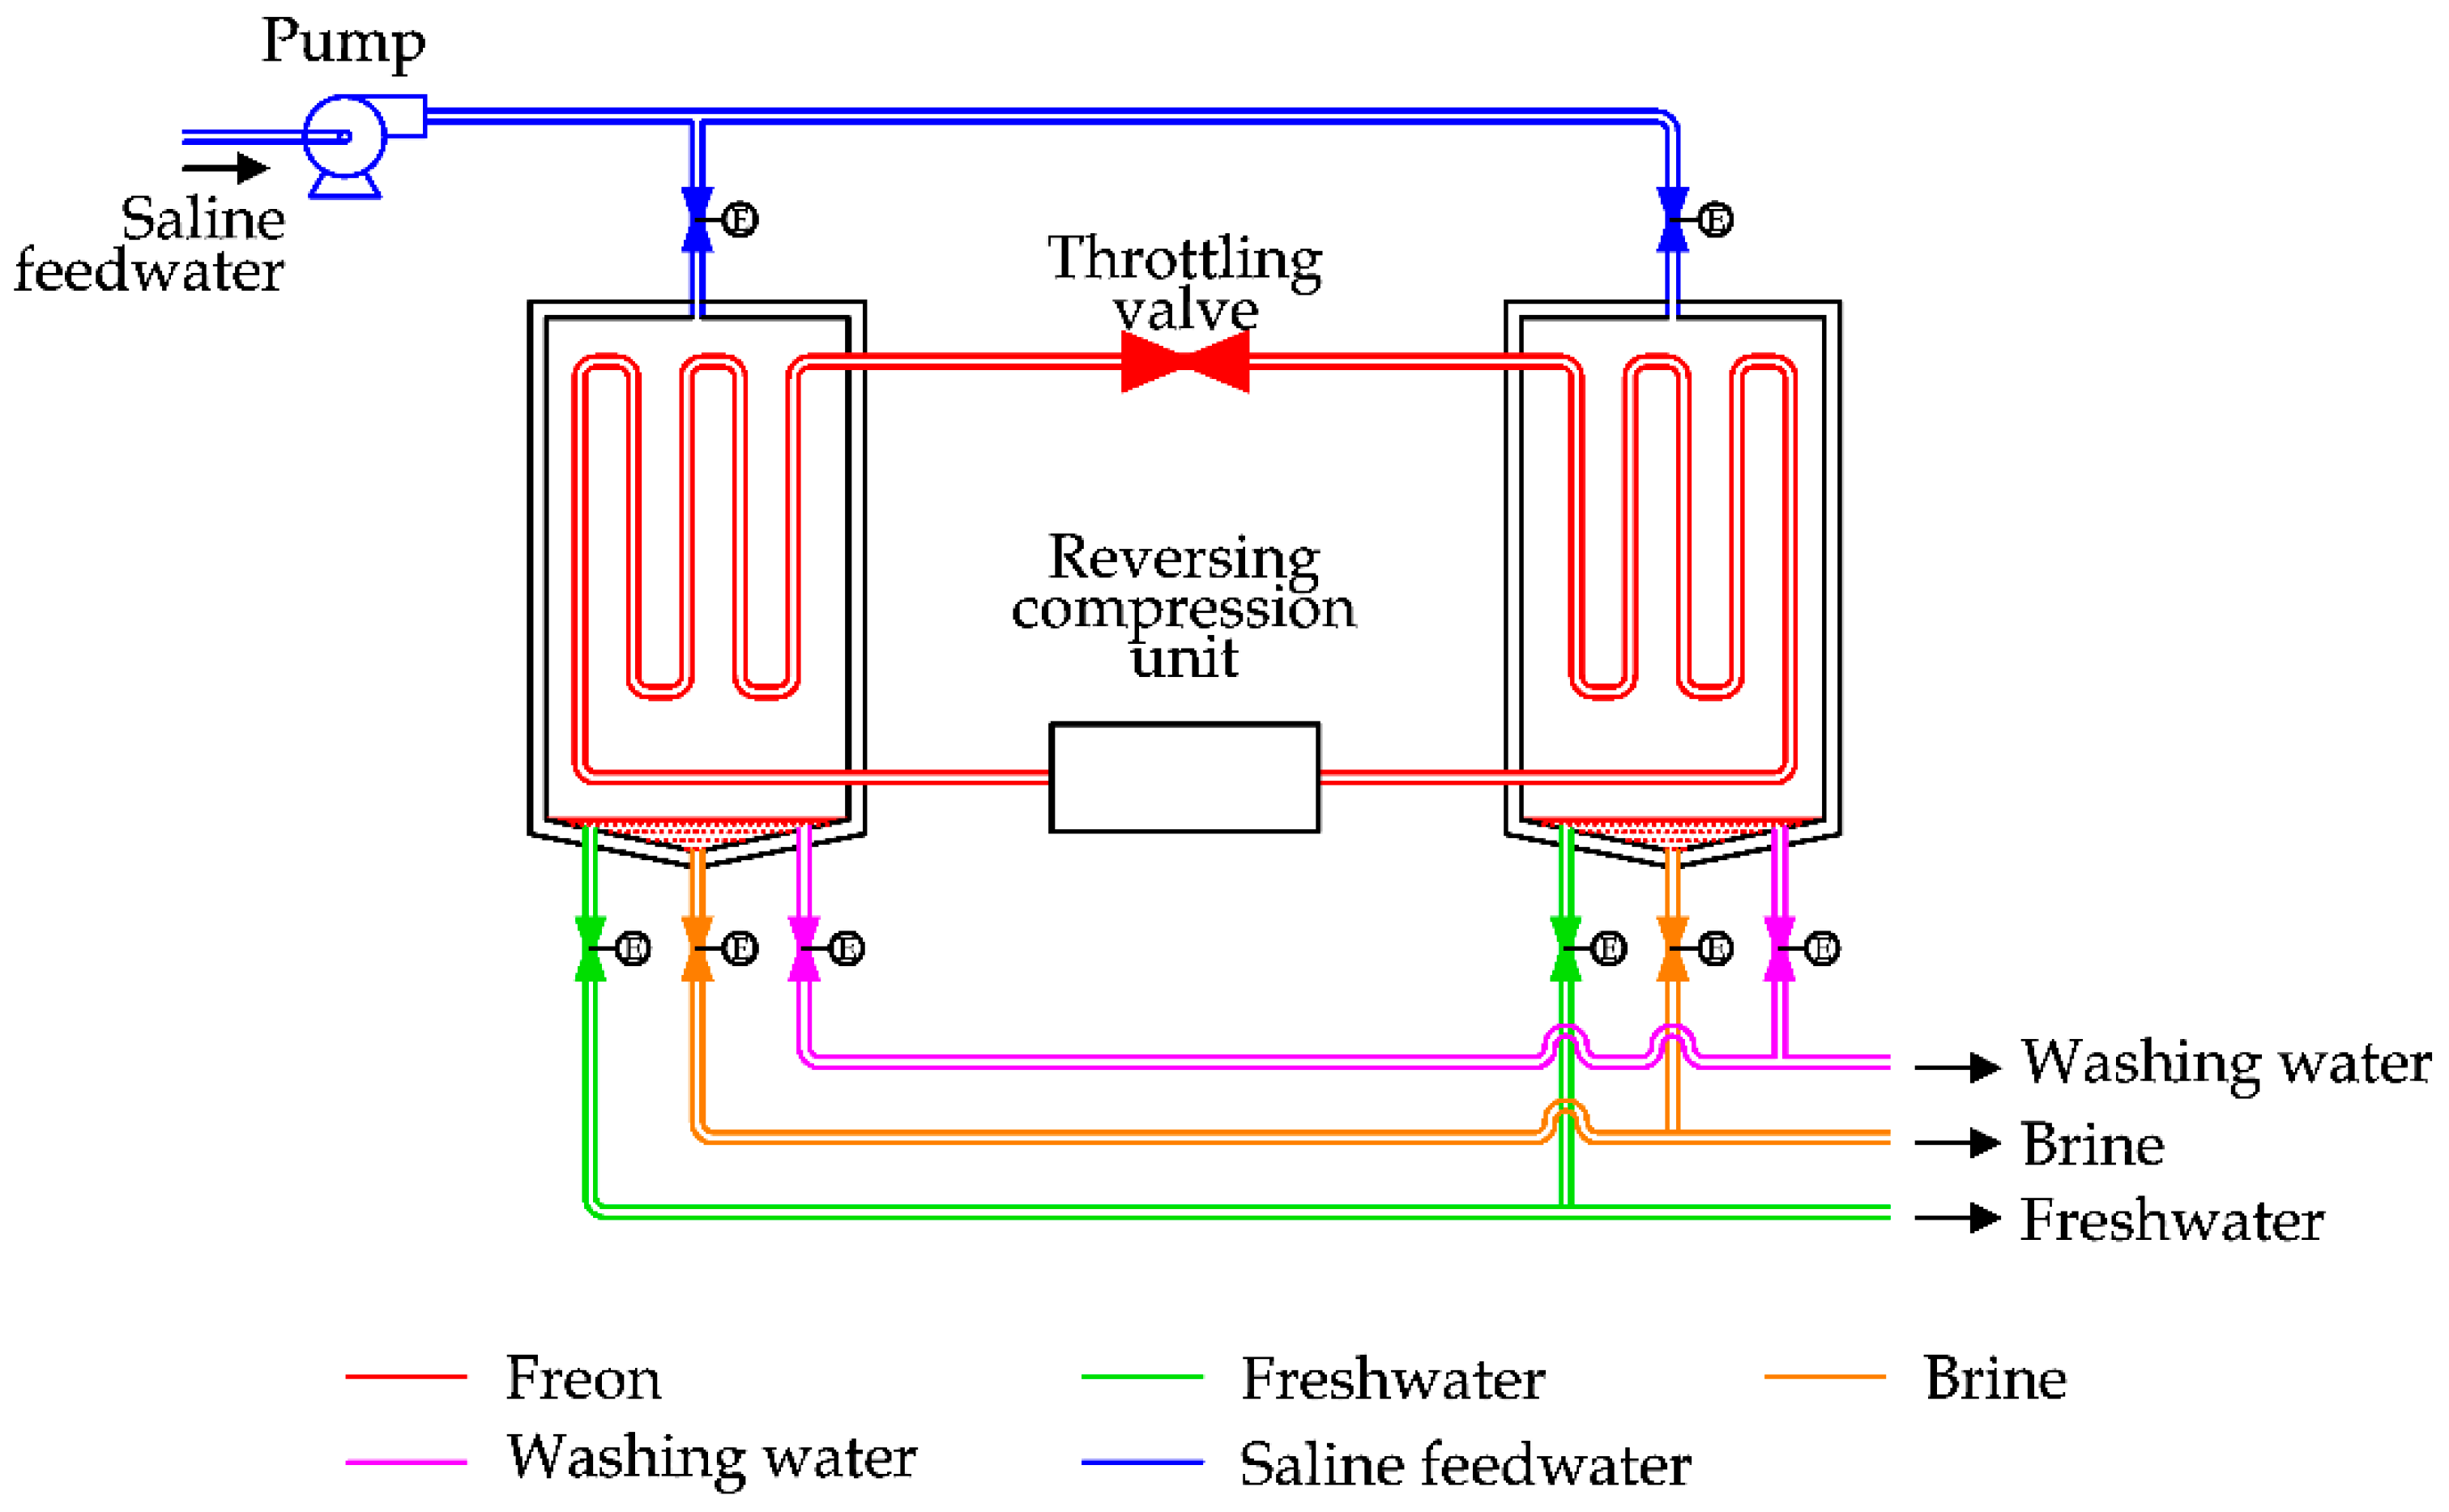
Another solution is depicted in
Figure 27 [
28]. This system is composed of two chambers, a reversing heat pump and solenoid valves. The unit works by alternatively producing ice and freshwater in the tank on the left (L) or in the other one on the right (R).
In the first case seawater is introduced in tank L. The heat pump is used to transfer heat from this chamber to the other one. As a result of the heat transfer, saline water is converted in a slurry of ice and brine inside tank L, while in tank R ice already formed in a previous step is melted. Stopping the process, brine is drained out by opening the valve in the bottom of the tank L while tank R is refilled with saline water. Reverting the heat pump, inside the tank L ice is melted thanks to the heat supply, producing freshwater. In the meantime, inside the tank R further ice is produced, and the cycle is repeated. This desalination technique is currently under development [
28].
2.11. Membrane Distillation (MD)
Membrane Distillation (MD) is a desalting process based on hydrophobic membranes. These kinds of membranes can be crossed by water as vapor molecules [
61].
MD is theoretically able to reject all non-volatile solutes (like salts). The main drawback of the MD process is the large amount of energy that is consumed during the liquid–vapor phase change process and the incomplete recovery of the latent heat. For these reasons, the MD process is energy-inefficient if used as a standalone system [
62].
However, this technology works at lower temperatures than other thermal-driven phase transition technologies (MSF, MED). Similarly, the required pressure is lower than other technology based on membranes (RO).
MD can be run by using low-grade waste heat as an energy source while operating at a low pressure and shows a negligible sensitivity to varying feed salinity. As an alternative, solar radiation can be used to supply MD units [
28].
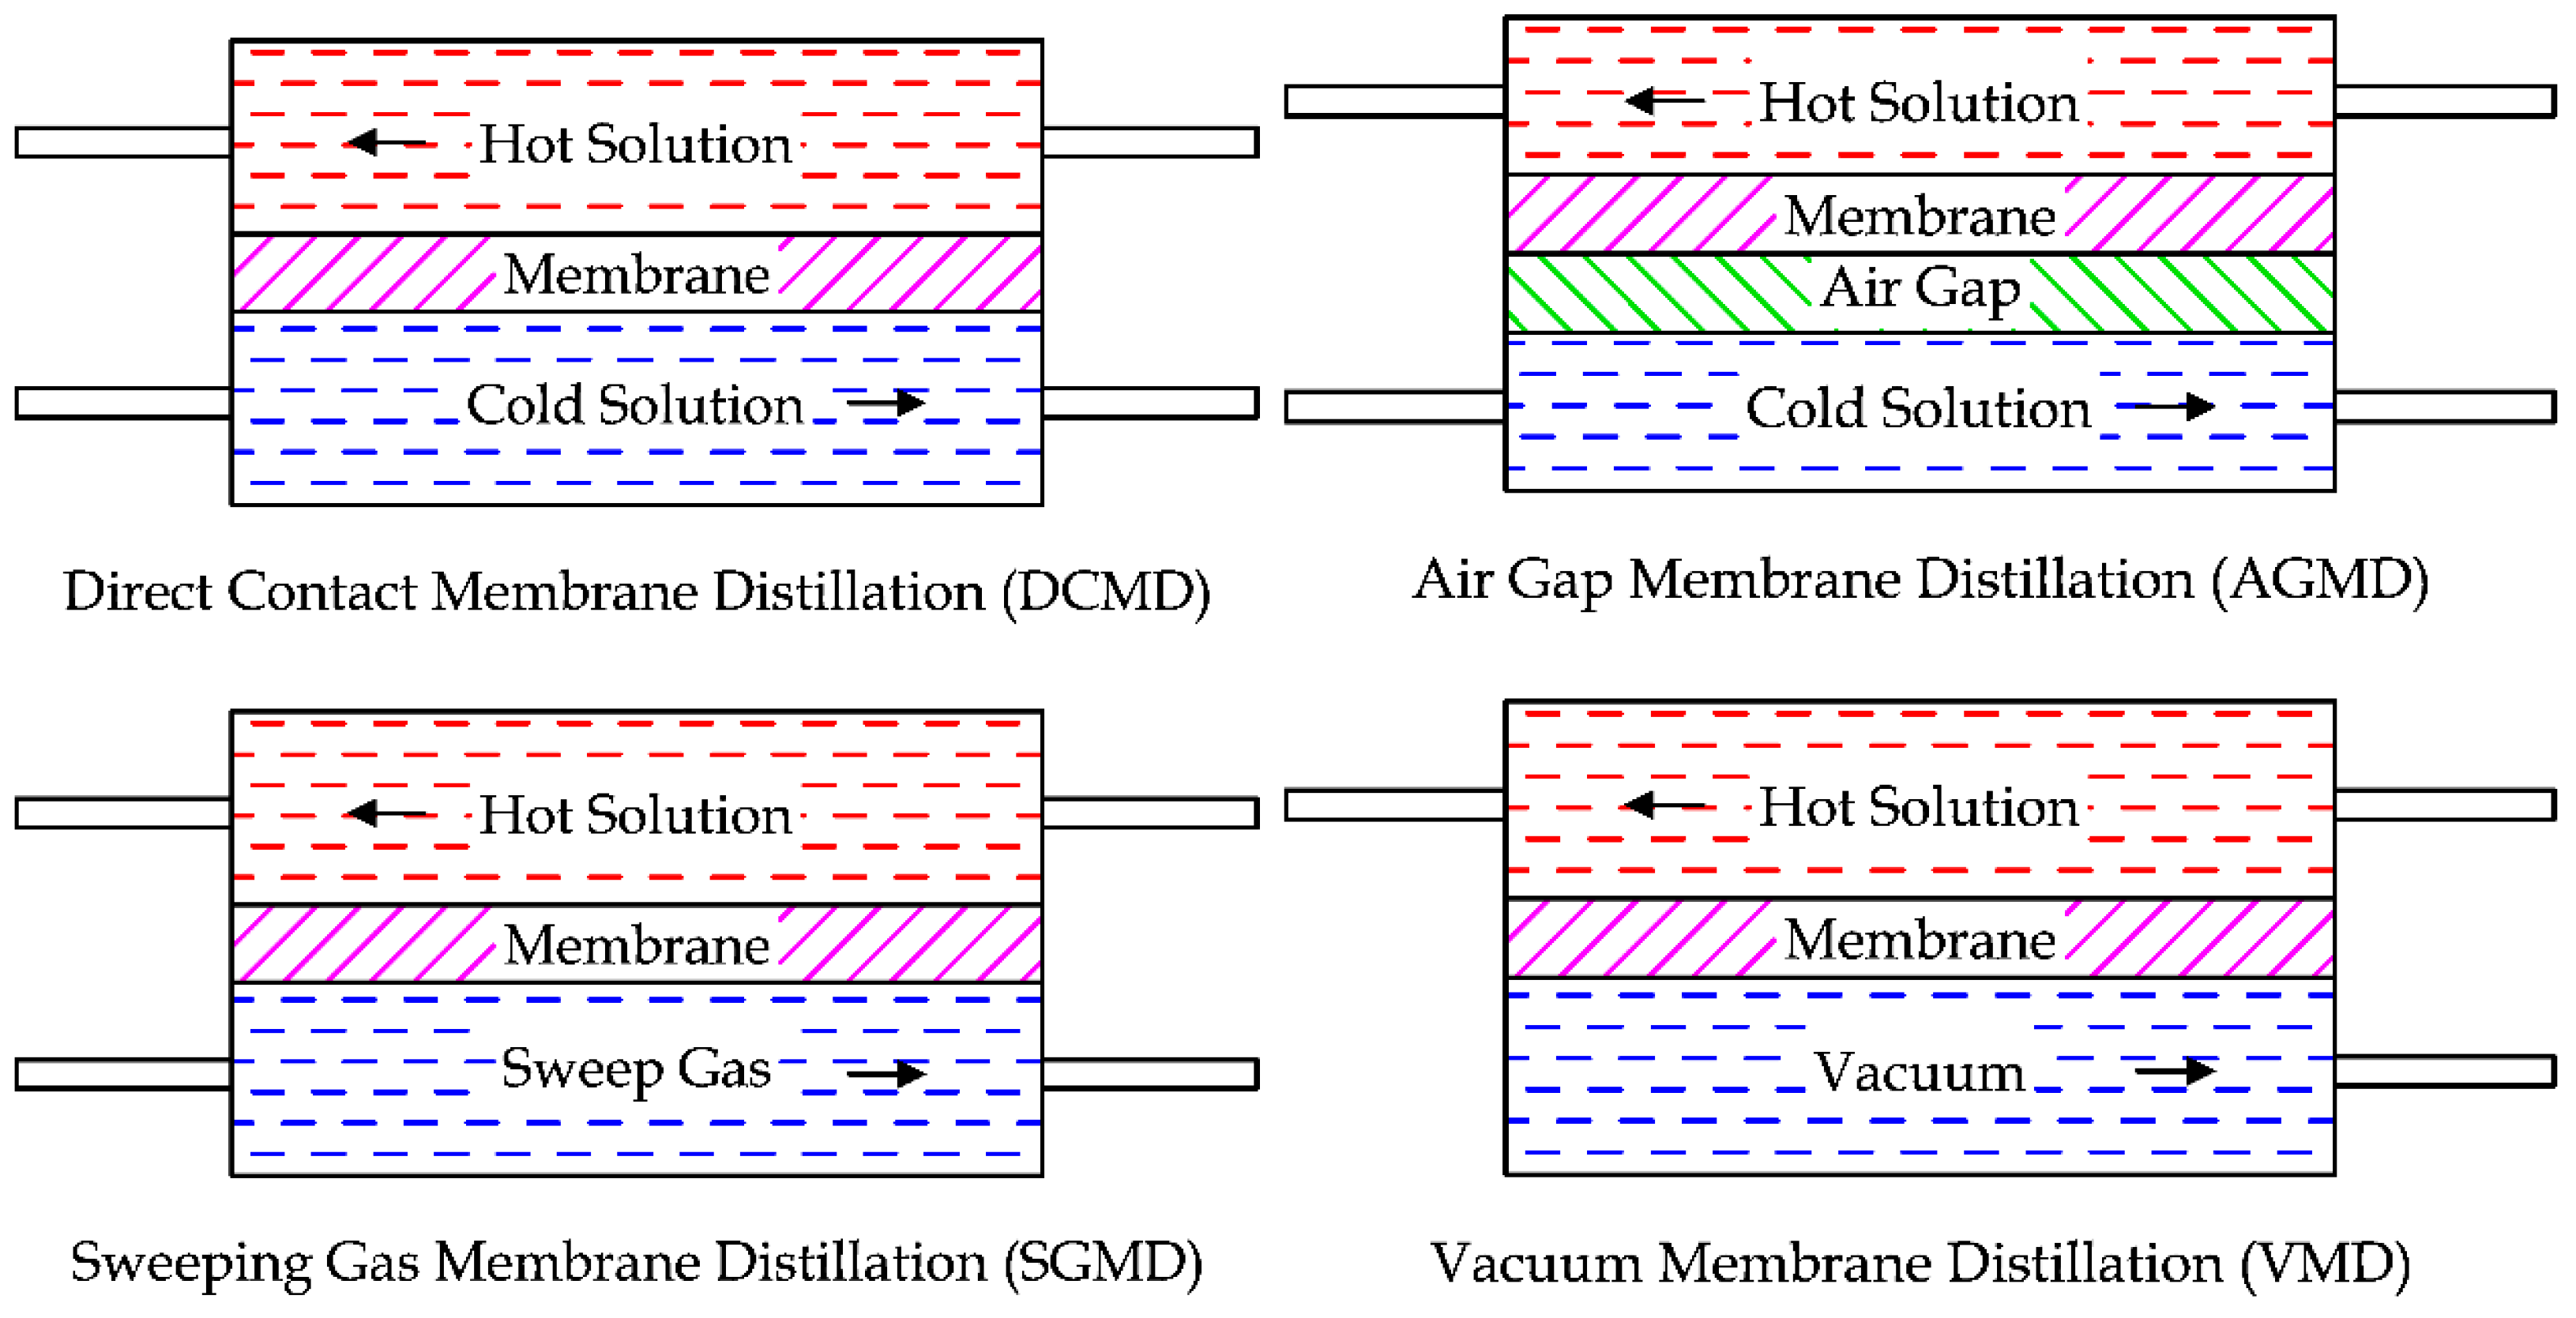
MD units can be assembled in four configurations, as shown in
Figure 28 [
62,
63]. The simplest one is the Direct Contact Membrane Distillation (DCMD), where two solutions are in direct contact with the hydrophobic membrane. Due to the difference of pressure between the two solutions, the vapor produced on the hot solution surface can cross the membrane, going inside the cold solution. This technology is commonly used in desalination and concentration processes of aqueous solutions in the food industry [
64,
65,
66].
In Air Gap Membrane Distillation (AGMD) a layer of stagnant air is added between the membrane and the cold solution. The reason is the reduction of the thermal energy expenditure, as the air gap increases the thermal resistance between the two fluids. However, the adding of the air gap obstructs the mass flow through the membrane. This technology can be used in desalination application or to remove volatile compounds from an aqueous solution [
63,
67].
Another technology is the Sweeping Gas Membrane Distillation (SGMD), where the hydrophobic membrane separates the hot solution from a sweep gas. Like the AGMD, the thermal efficiency is higher than the DCMD. The mass transfer is promoted by the sweep gas since it is not stationary. As a disadvantage, a large condenser is required. This technique can be used to remove volatile compounds from aqueous solutions [
68].
The last technique is the Vacuum Membrane Distillation (VMD), where the sweep gas (or the air gap) is replaced by the vacuum produced by a pump [
69]. The condensation is externally realized by the distillation unit. This solution has a high thermal efficiency and is used to separate volatile aqueous solutions [
70].
A common problem of all membrane distillation technologies is due to fouling and wetting phenomena, which are in part controlled by using different strategies like pretreatments [
71], surface modification [
72], increasing flow rate to promote turbulence [
73], and periodical hydraulic and chemical cleanings [
74,
75,
76].
2.12. Ion-Exchange Resin (IXR)
The term “ion-exchange resin” (IXR) indicates a variety of organic compounds, which have been chemically treated to react with the ions of a solution, capturing ions from the solution and releasing other ions from the resin into the solution. In the past, zeolites were used, i.e., minerals having this characteristic.
Ion-exchange resins are used in industrial and domestic applications like soft water production, sugar purification, and the extraction of precious elements, such as gold, silver, and uranium from mineral ores.
IXR can be classified according to functional group [
77]:
Strongly acid, realized with sulfonic acid groups
Strongly basic, based on quaternary amino groups
Weakly acidic, realized with carboxylic acid groups
Weakly basic, based on primary, secondary, or tertiary amino groups.
The acid resins (also called cation resins) are designed to capture positive ions (Ca2+, Na+, Mg2+, K+, Mn2+, Fe3+…) and release H+ ions. Consequently, the hardness of the water is reduced, and the acidity is increased, since the pH is increased by the greater concentration of H+ ions. The basic resins (also called anion resins) are utilized to capture negative ions such as Cl−, NO32−, SO42−, SiO2−, CO32− and release OH− ions.
This technology was developed at the end of the 1960s [
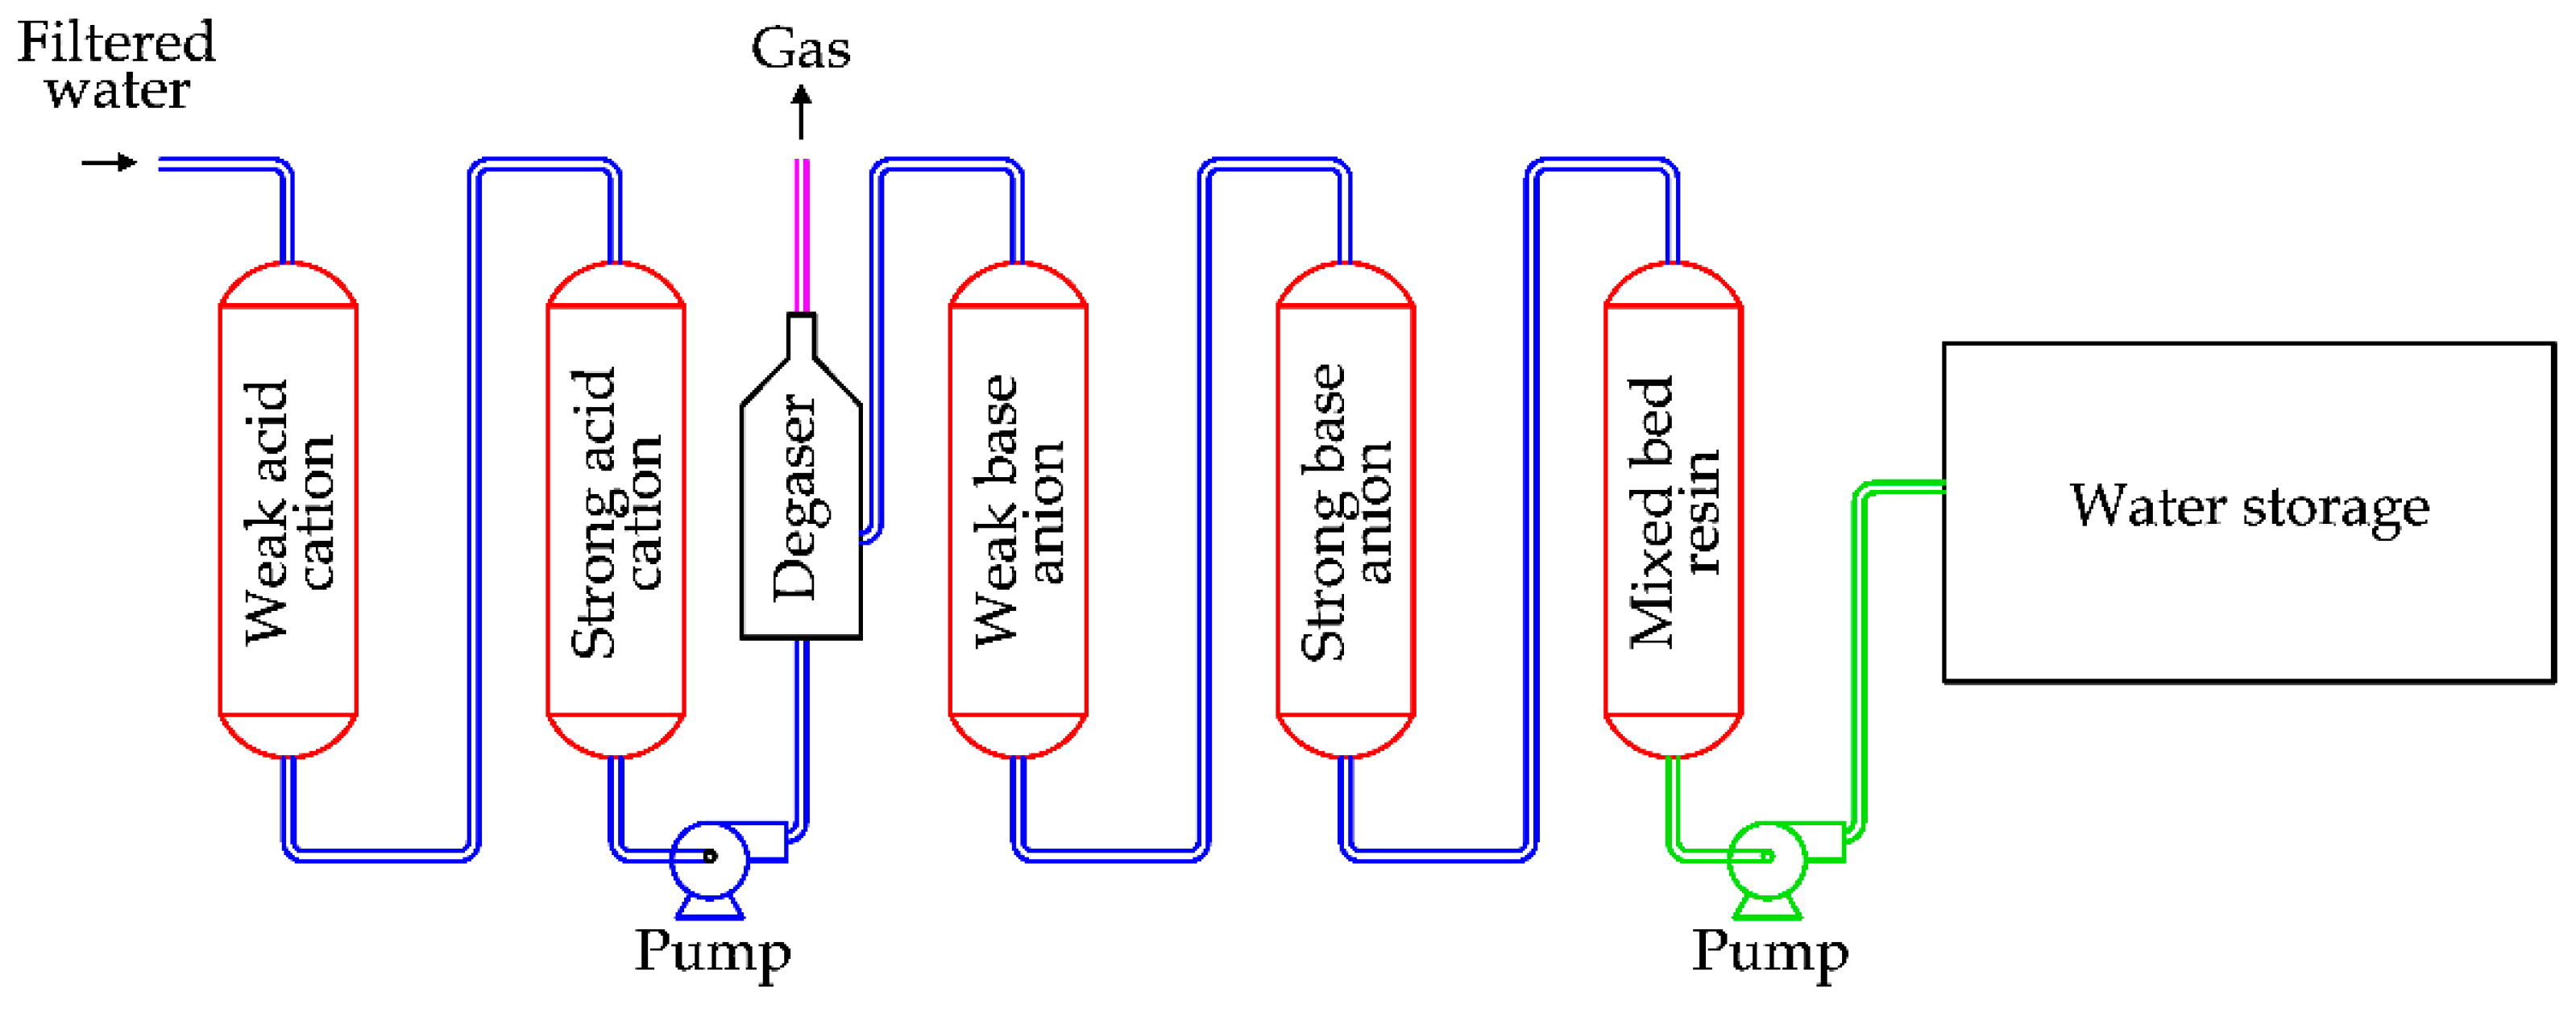
78]. A classical arrangement of a desalination plant based on IXR is reported in
Figure 29.
The saline water flows firstly through the weakly acid resin and the strongly acid resin. After this step, the water’s acidity is increased. A degasser is required, as bicarbonates inside the water react with H+ ions, producing carbon dioxide. After this step, water flows through the weakly basic resin and the strongly basic resin, reducing the water’s acidity. An amphoteric resin (a mix of acid and basic) is normally added to complete the removal of ions.
During the normal process, resins are progressively saturated by the ion exchange. Thence, a regeneration is periodically required to restore the resins. The regeneration uses acid solutions (H2SO4 and HCl) for the acid resins and basic solutions (NaOH and NH4OH) for the basic resins.
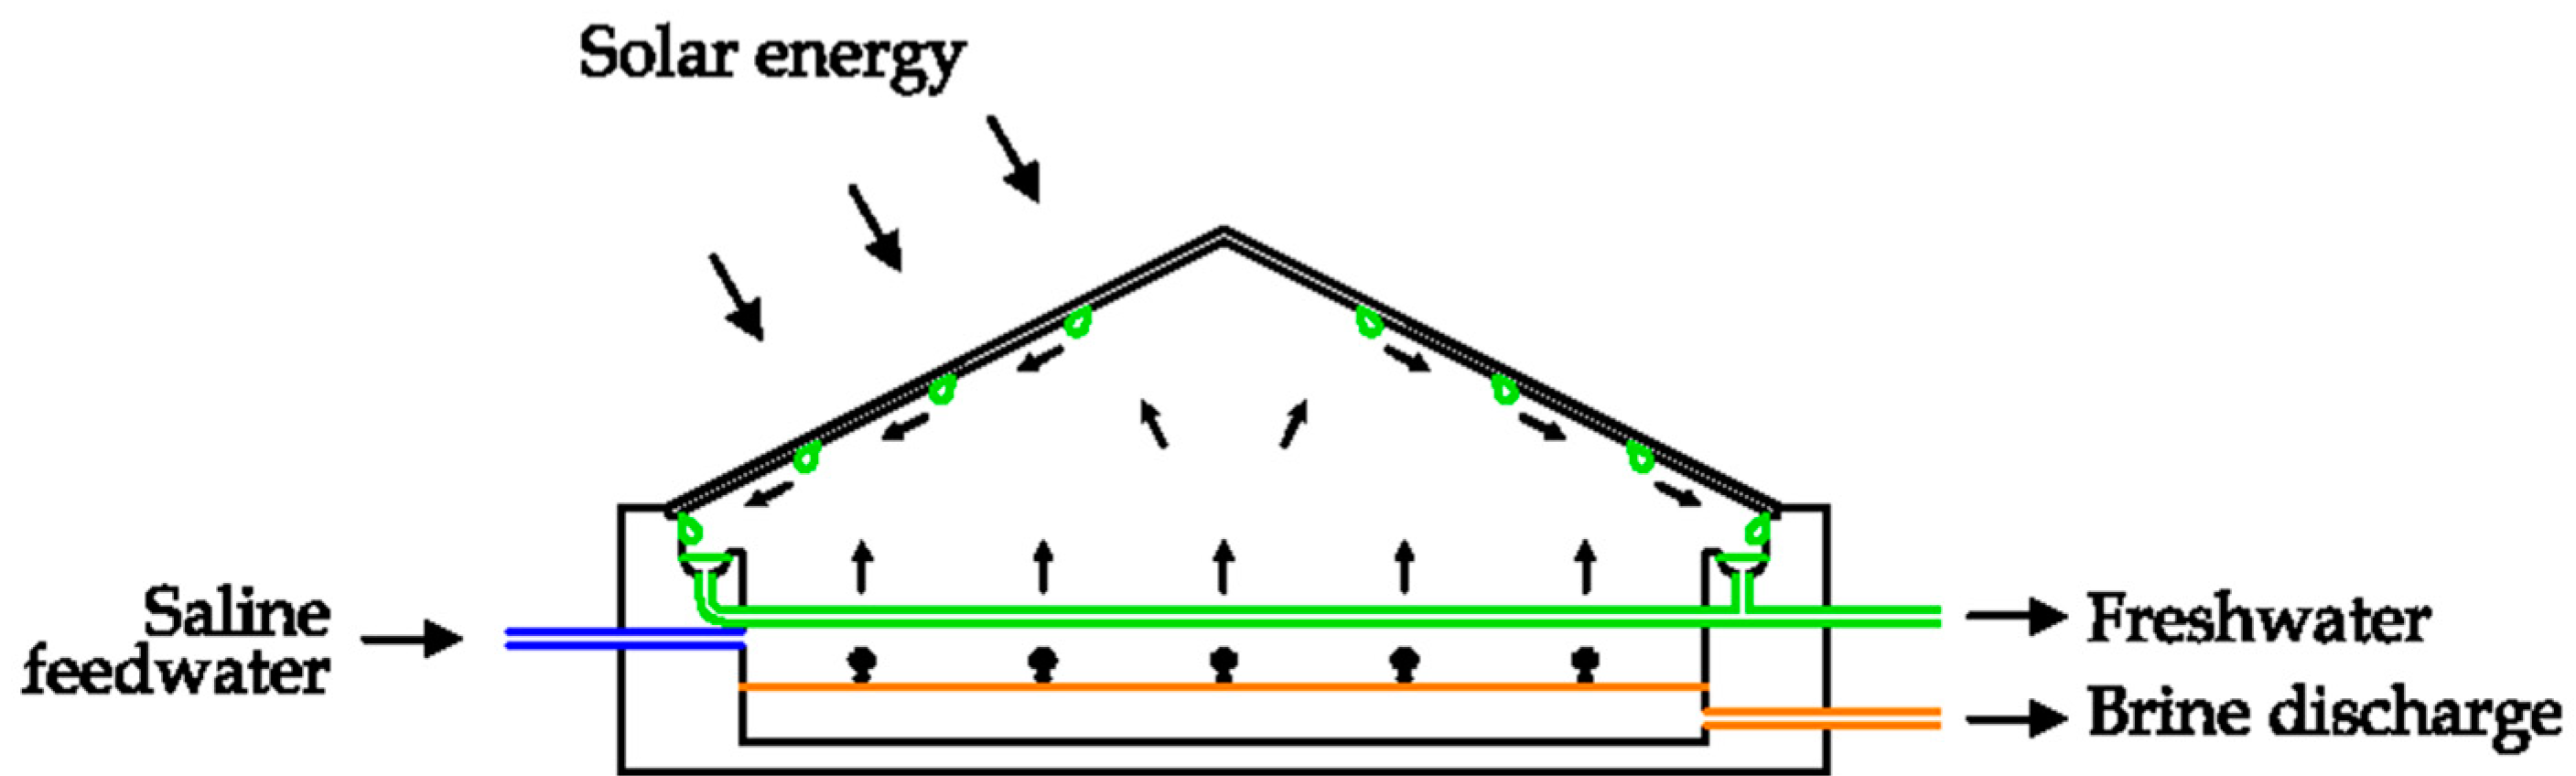
2.13. Solar Still Distillation (SSD)
Solar Still Distillation (SSD) can be realized by using a blackened tank containing saline, water and air [
28,
79]. The device is covered with inclined glass. In this way the solar radiation enters the system, increasing the temperature and facilitating the evaporation of freshwater. The internal humidity condenses on the surface of the glass, as this part has the lower temperature. The condensate is collected, obtaining freshwater [
80]. A possible solution is depicted in
Figure 30 [
23,
24]. The condensate is characterized by being high quality, with a daily production about 2–3 l./m
2. Consequently, this system can be used only in small applications.
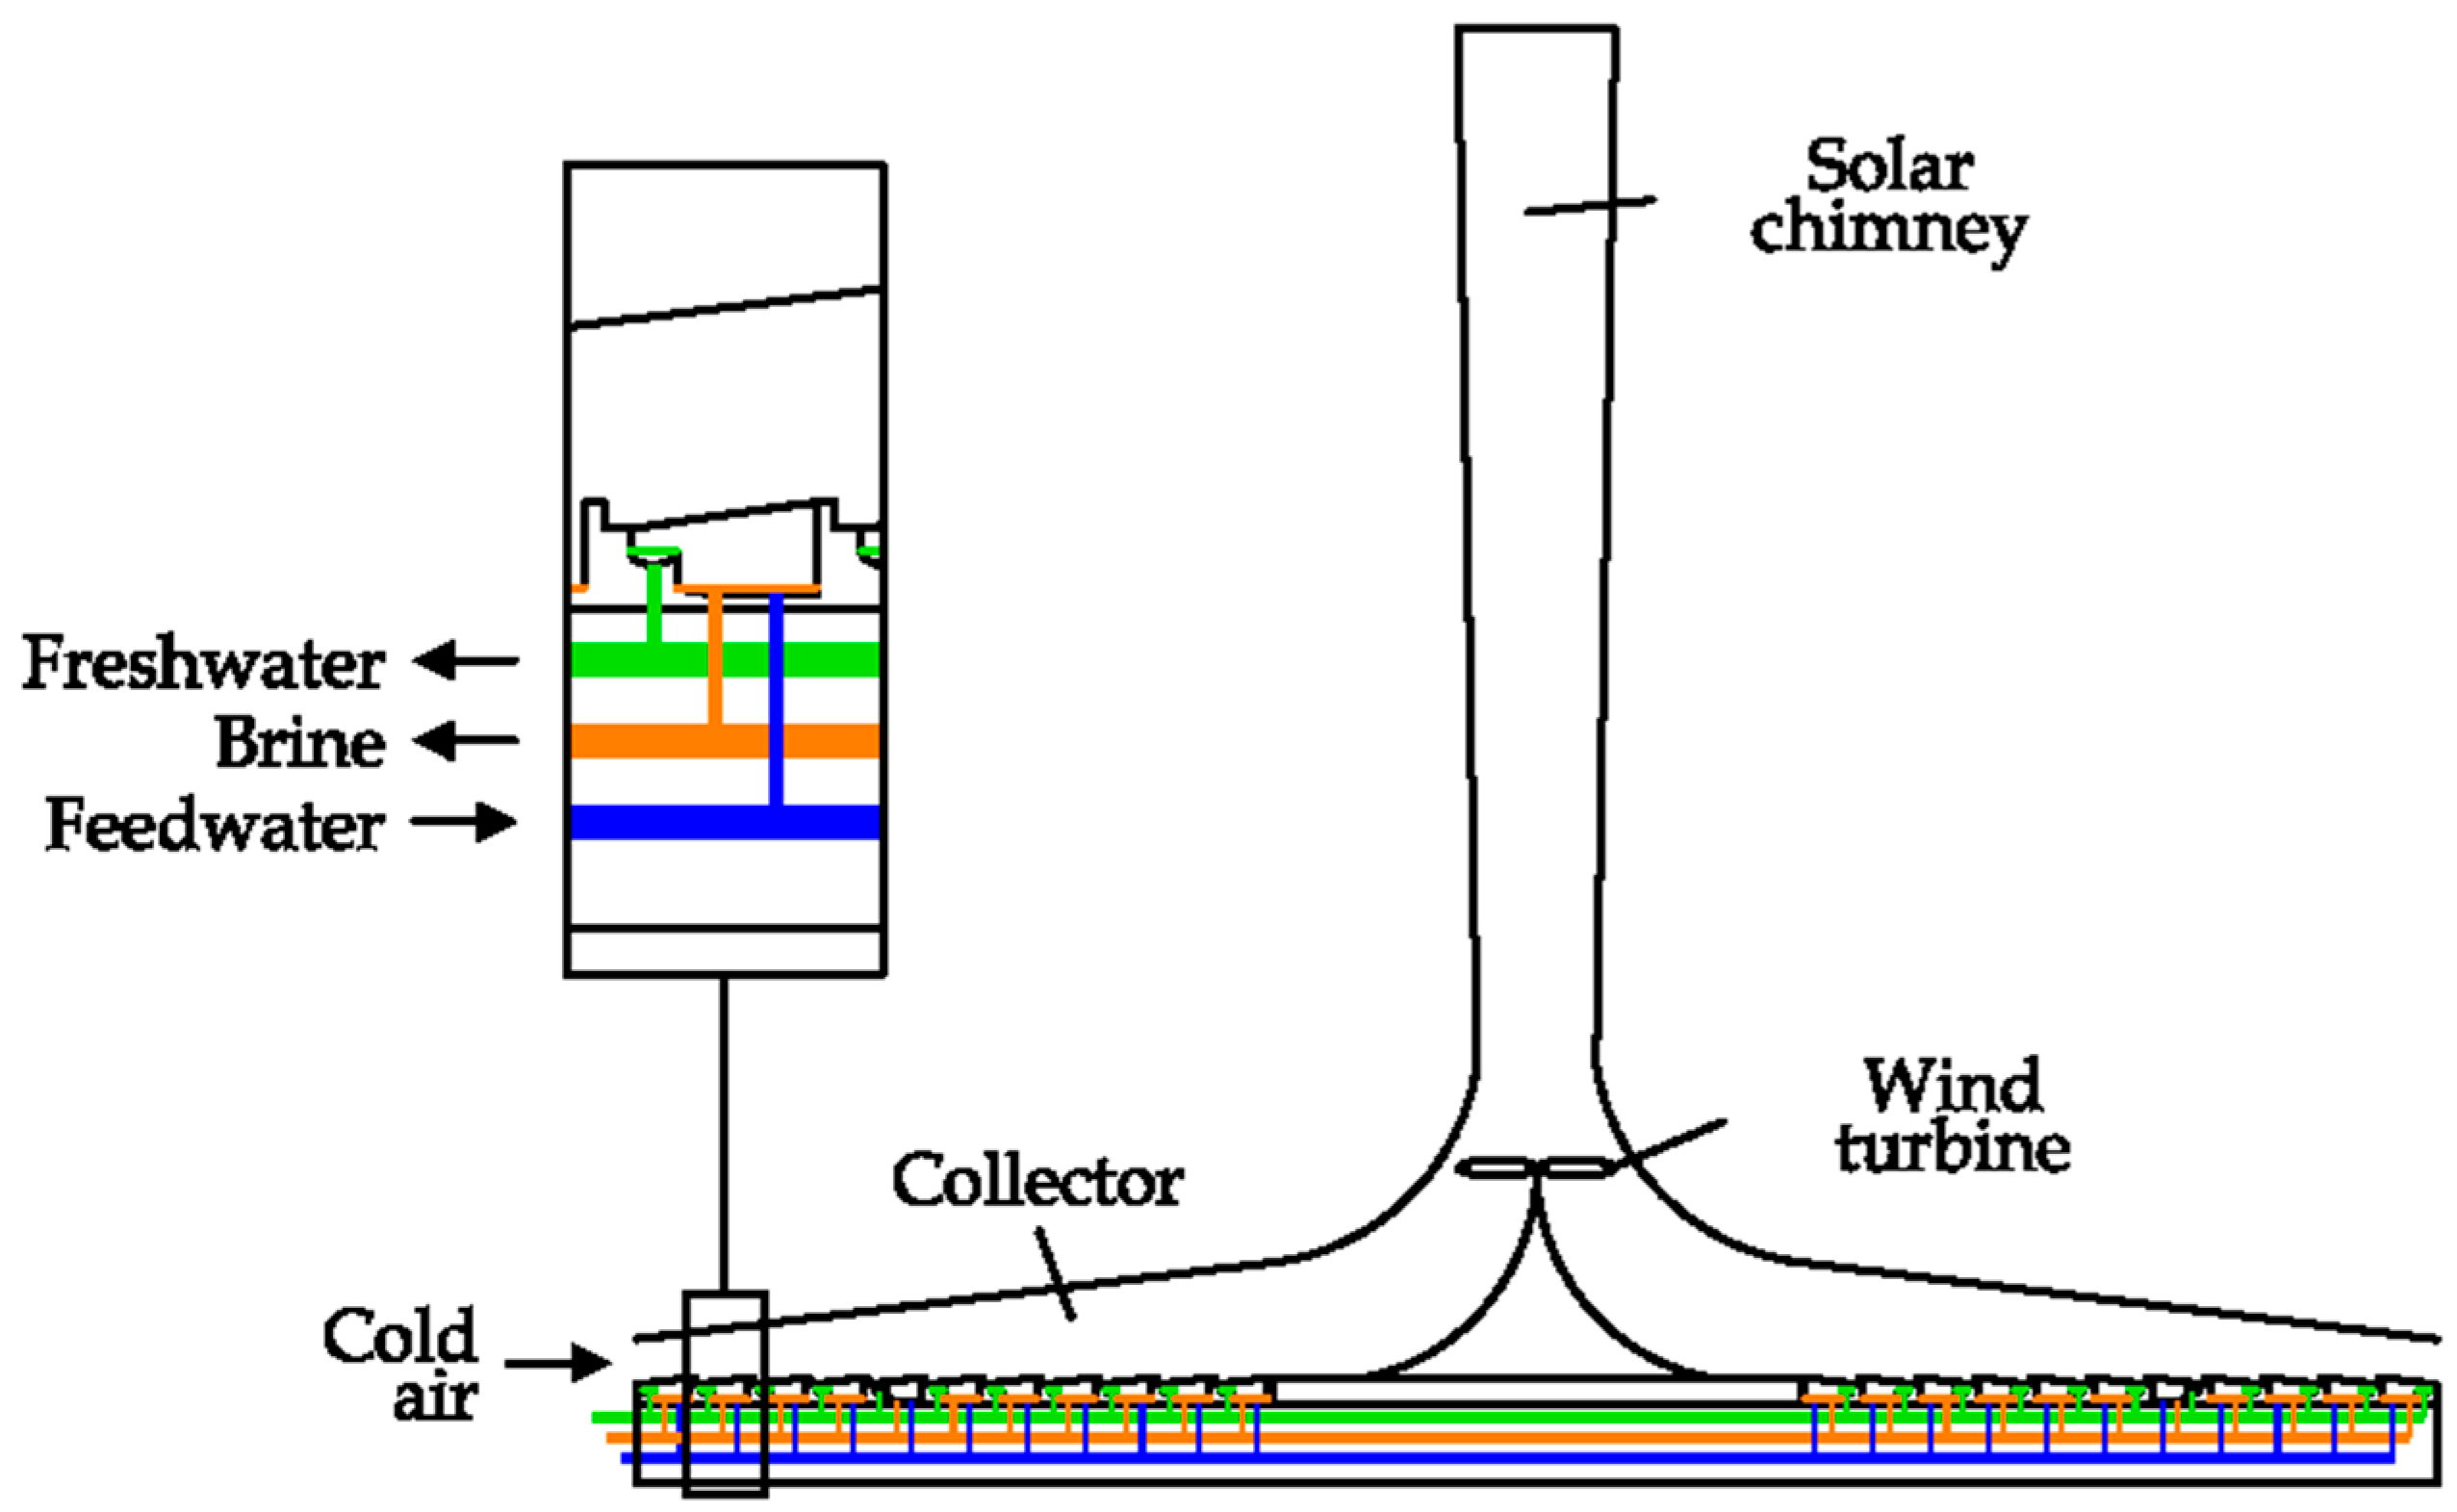
2.14. Solar Chimney (SC)
A Solar Chimney (SC) desalination unit can be assembled in the way shown in
Figure 31 [
28]. A large solar collector is used to convert the solar radiation into the kinetic energy of air, thanks to the shape of the chimney, which is realized in a transparent material (glass or plastic). The air flow inside the system can be used to produce electricity if a small wind turbine is installed [
81]. The solar collector is composed of several small SSD units; in this way the solar source is also used to produce freshwater. This technology is under investigation [
28].
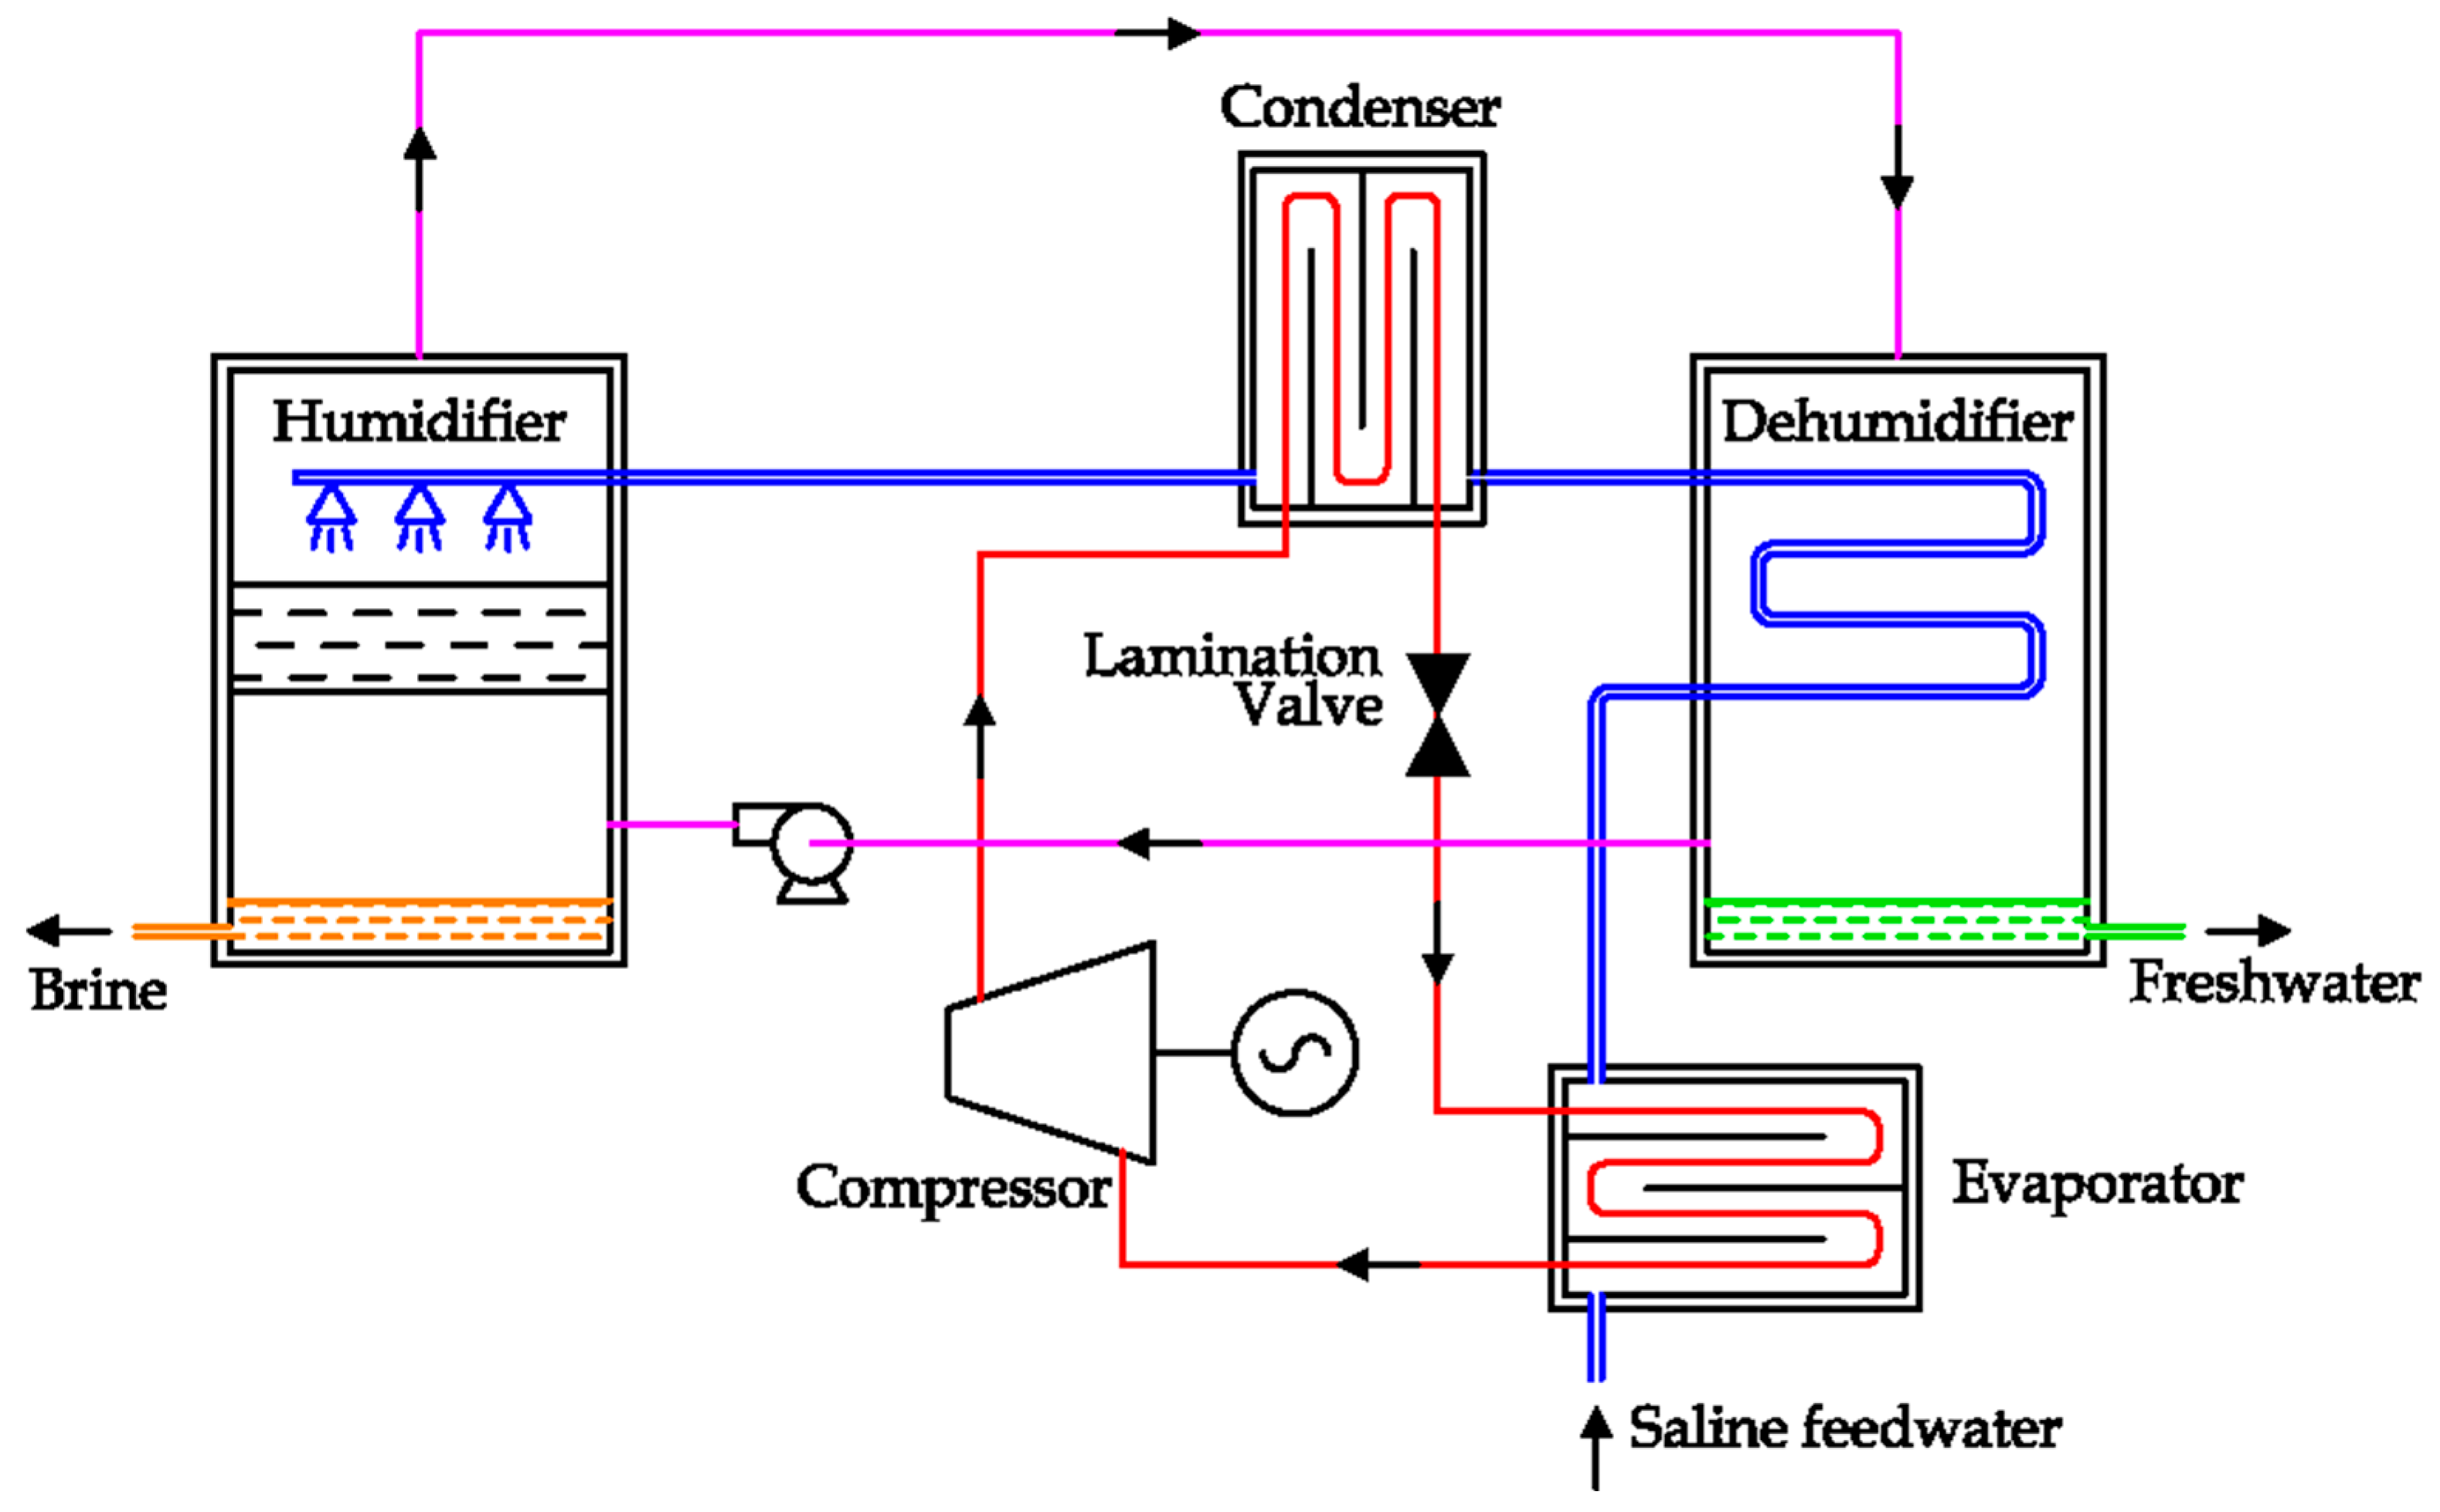
2.15. Humidification–Dehumidification (HDH)
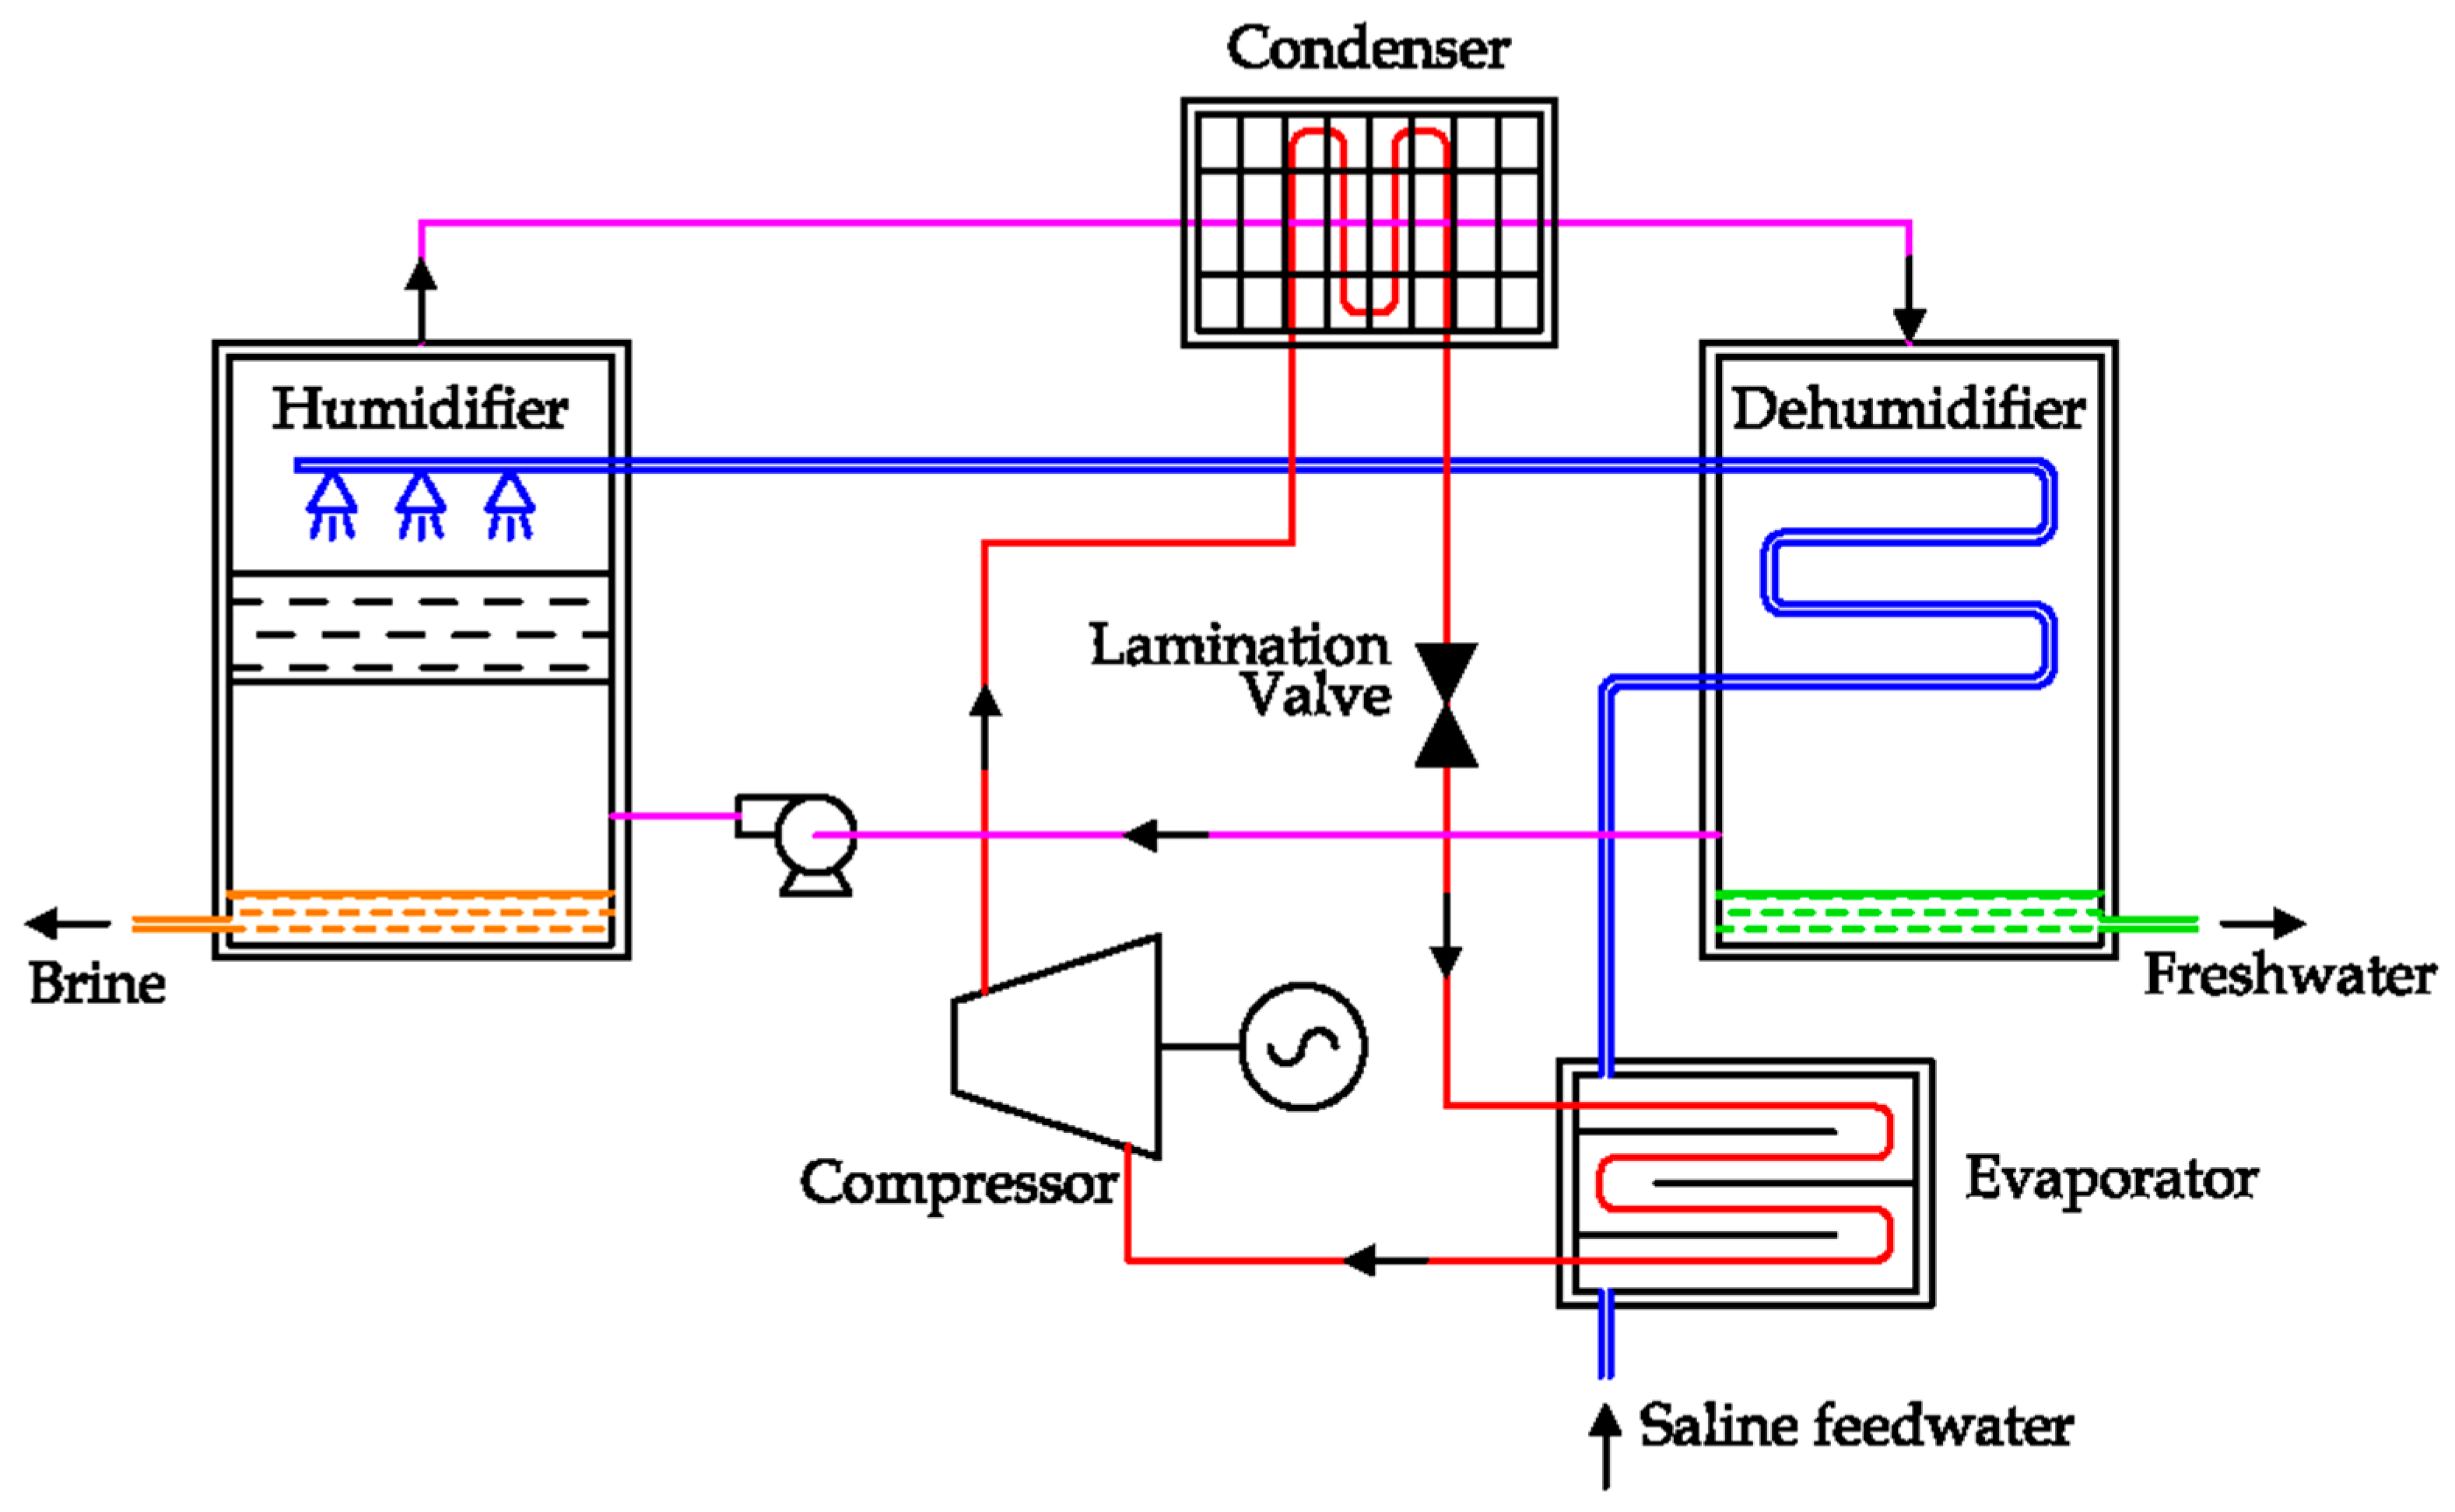
The Humidification Dehumidification (HDH) system is a recent carrier gas based thermal desalination technique. In detail, freshwater can be obtained by condensing the air humidity. The essential components are the humidifier and the dehumidifier. Lawal et al. proposed two possible solutions, adding a heat pump to improve the energy efficiency [
82].
Both solutions are equipped with three different circuits: air, water and freon. The last one is confined inside the pipes and the main components of the heat pump (compressor, condenser, lamination valve and evaporator). The air is recirculated by a fan in a close loop, going through two chambers, where the humidification and the dehumidification occur. Only the water circuit is open, as saline water is the input, while brine and freshwater are the outputs [
82].
As shown in the schema reported in
Figure 32, saline feedwater is firstly refrigerated by the condenser of the heat pump. The cold saline water is used to promote the condensation of air humidity inside the dehumidification chamber (on the right), where freshwater is produced. During this process, the saline water temperature increases. After that, saline feedwater is nebulized inside the humidification chamber (on the left), promoting the evaporation of feedwater.
In the solution reported in
Figure 32, the thermal supply from the condenser is transferred to the saline water after the dehumidifier unit.
The alternative solution proposed by the same authors is reported in
Figure 33, where the thermal supply from the condenser is transferred to the air coming from the humidifier unit [
82]. Instead of the forced air circulation, a natural air circulation system has been proposed, where the thermal supply is produced by a solar panel [
28,
83,
84]. In any case, HDH desalination is a technology under investigation.
3. Statistics on Desalination
As introduced in the previous section, several technologies have been proposed for desalination. The research is currently investigating new solutions to reduce energy consumption and improve environmental sustainability, considering renewables as an energy source to supply the process.
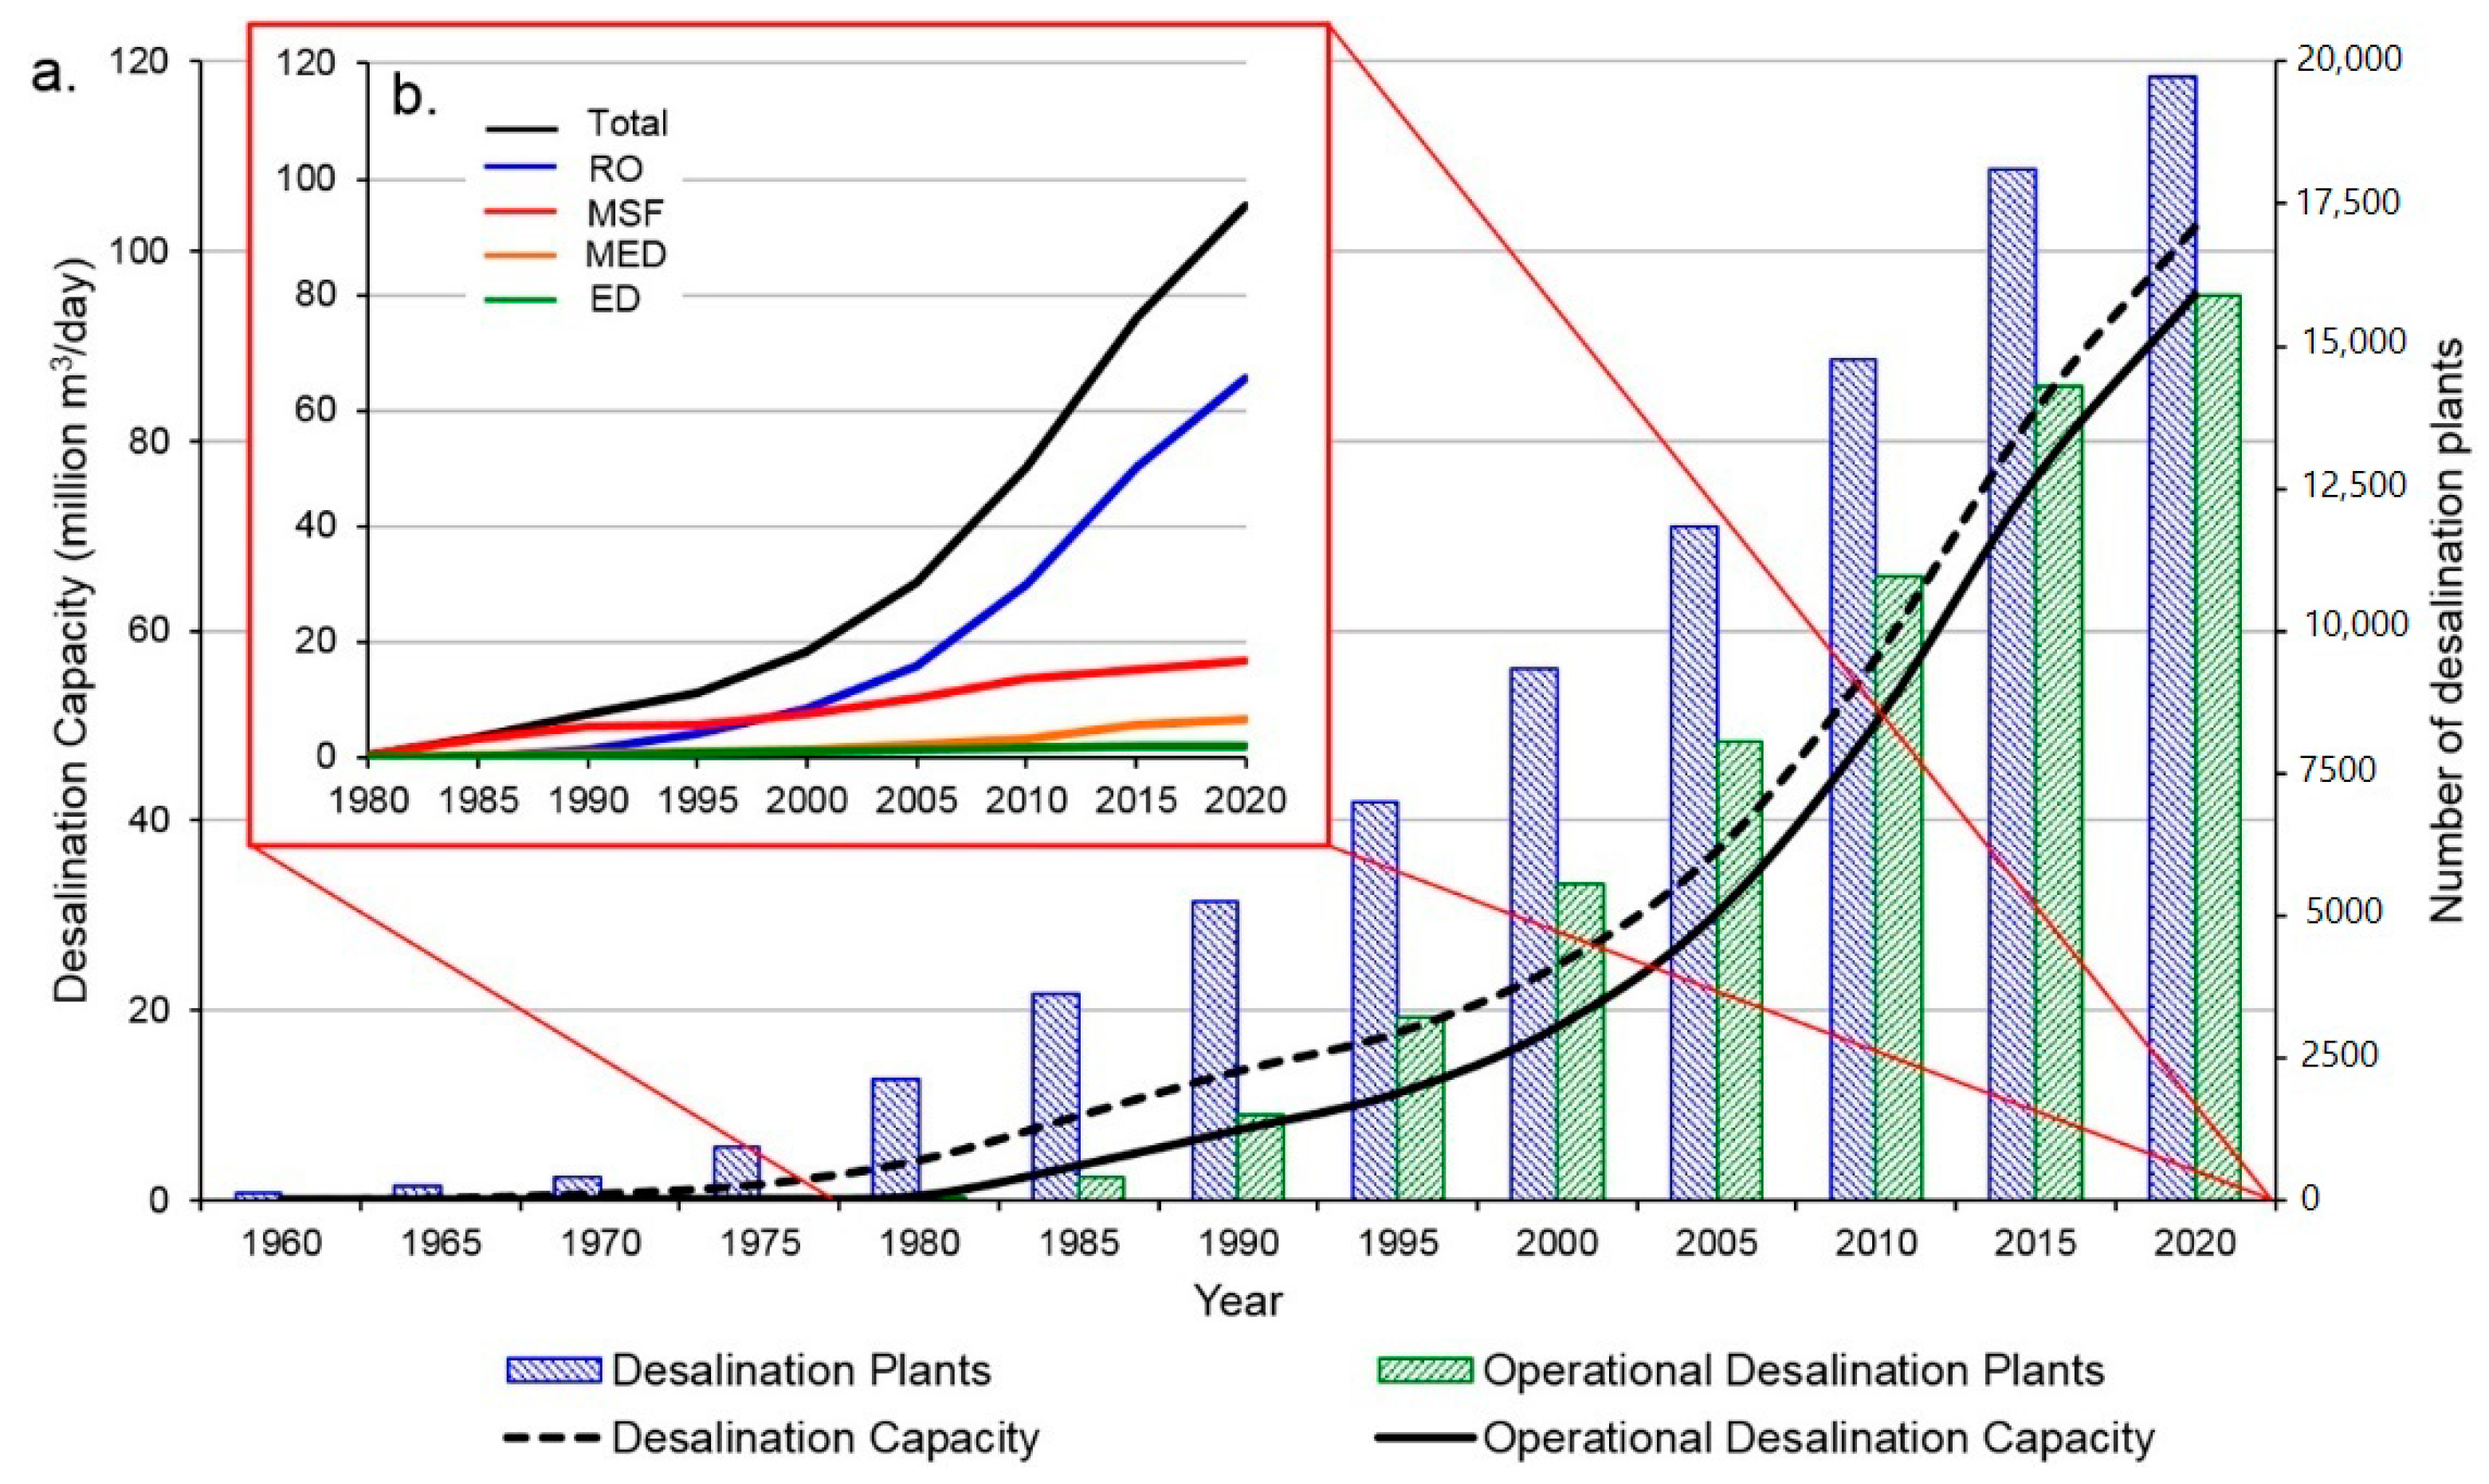
Many technologies described above are under investigation, so limited data are available. Considering the commercial technologies for desalination, the trends of the installed capacity and number of plants are reported in
Figure 34 [
12]. As introduced above, thermally driven desalination plants (MSF and MED) dominated this sector until the 1990s [
22,
36]. As the freshwater demand is still growing, new plants are being installed. MSF continues to grow linearly, while the installed capacity of RO is increasing very quickly [
85].
In [
12], Jones et al. reported some statistics on the current big desalination plants installed around the world, using data from the Global Water Intelligence (GWI) [
86]. In detail, GWI is a database containing information on the installed desalination plants, including their status, operational years, installed capacity, geographic position, technology, and water sources.
Considering the desalination technology, the global installed capacity (95.37 × 10
6 m
3/day) is composed of RO (68.7%), MSF (17.6%) MED (6.9%) NF (3.4%) ED (2.4%), and other (1.0%) [
12].
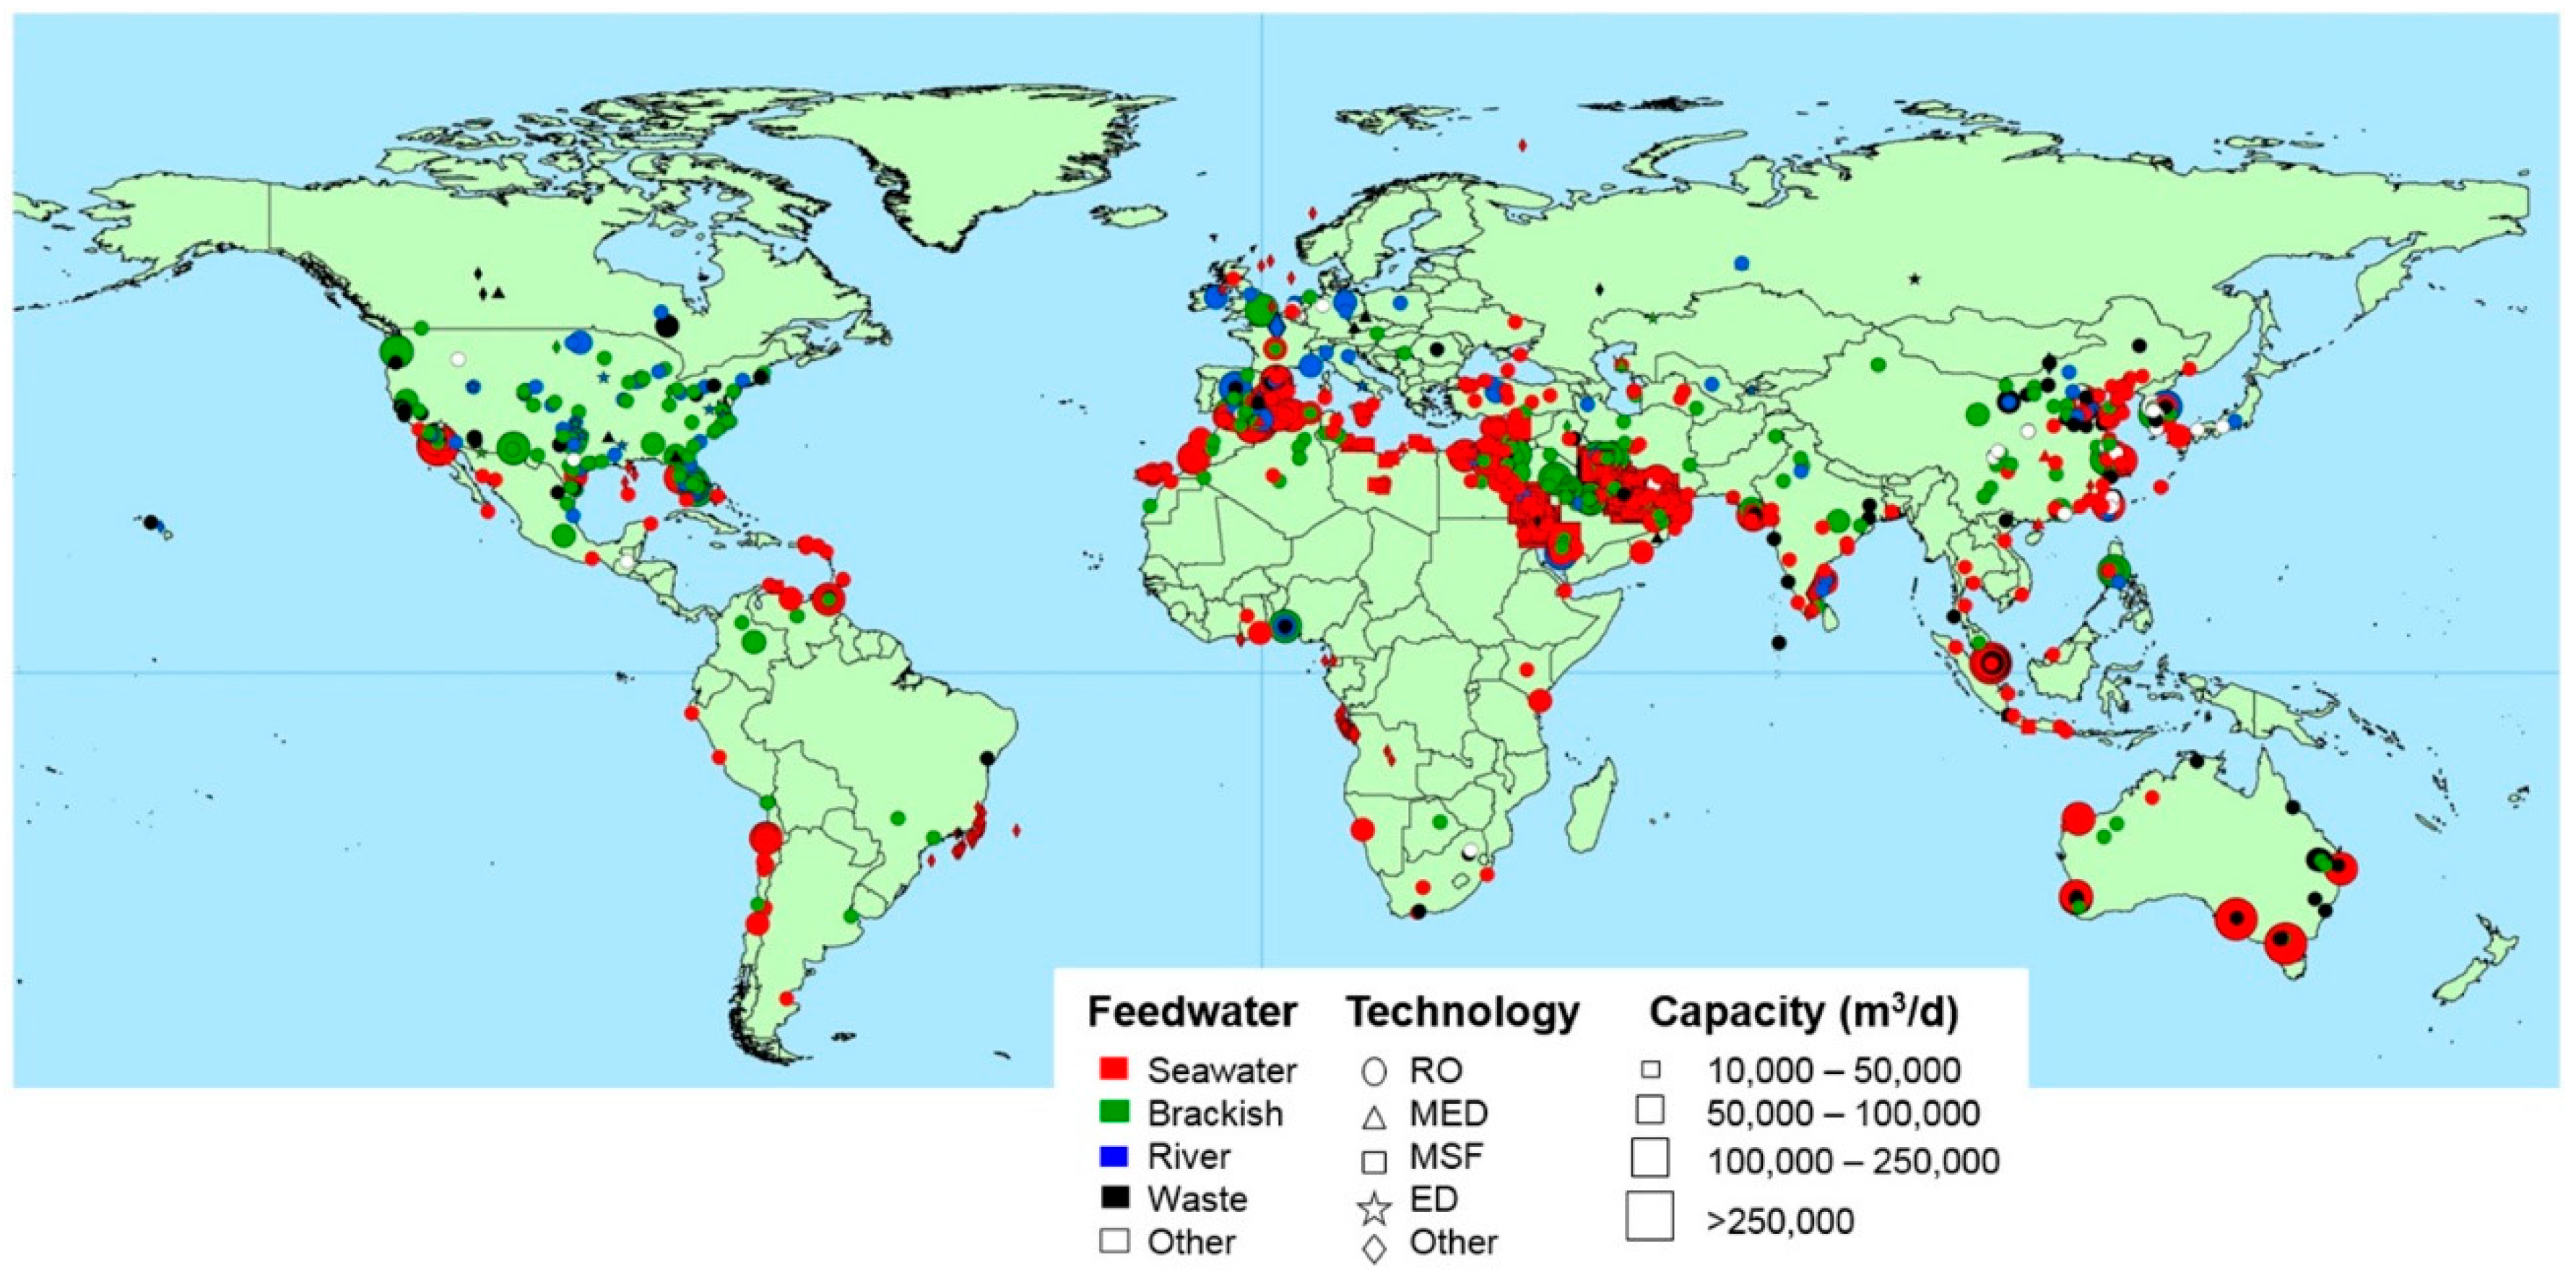
Figure 35 reports graphically the worldwide distribution of desalination plants, considering size, technology and the water source used to produce freshwater [
12].
Most of desalination plants are installed along the coastline to adopt the sea as a water source. Indeed, 60.8% of world’s installed capacity uses the sea as a water source, whereas brackish water is utilized in 20.6% of cases [
12].
The Middle East and North Africa are currently equipped with 4826 plants, with an installed capacity equal to 45.32 × 10
6 m
3/day (47.5% of the world’s installed capacity). The remaining desalination plants are distributed in the following way: 3505 plants in East Asia and the Pacific (18.4% of worldwide installed capacity), 2341 in North America (11.9%), 2337 in Western Europe (9.2%), 1373 in Latin America and the Caribbean (5.7%), 655 in Southern Asia (3.1%), 566 in Eastern Europe and Central Asia (2.4), and 303 in Sub-Saharan Africa (1.9%) [
12]. The main sectors are industry (7757 plants with a capacity of 28.8 × 10
6 m
3/day) and municipality (6055 plants, 59.39 × 10
6 m
3/day).
Table 1 shows statistics on the state of the art of operative desalination plants [
5,
12,
13,
14,
31,
87]. According to these data, RO is the most adaptable solution to exploit sea and brackish water, with an average capacity ranging from 1000 (or lower) to 320,000 m
3/day. As for the energy supply, RO exclusively requires electricity (or mechanical energy) to run the pumps along the water circuits. This feature simplifies the potential coupling with renewable energy sources, as demonstrated by several studies [
19,
36,
87,
88]. The water cost is lower than other desalination technologies, explaining its quick diffusion around the world.
To improve the energy efficiency of desalination technologies, exergy analysis has been recently proposed in several researches [
89,
90,
91,
92,
93,
94]. Introducing the Second Thermodynamic Law, exergy represents the maximal available energy related to a system, obtainable if reversible processes are only used to achieve equilibrium conditions within the environment (dead state). On the contrary, exergy also represents the minimal energy required by a system to achieve a desired condition, starting from the environmental state, and adopting only reversible processes.
In this optic, the efficiency analysis performed according to the Second Thermodynamic Law is a successful tool for suggesting solutions to improve the energy efficiency of the existing desalination technologies. A detailed exergy analysis is reported in [
89], where each component is firstly modelled and then analyzed.
In the case of desalination plants requiring a mechanical energy input (or electricity), the exergy efficiency is evaluated by Equation (3), defining
as the least work of separation required for an infinitesimal recovery ratio (RR, defined in the previous Equation (2)).
is the work required by the real desalination plant, which can be expressed as the sum of the least work, plus the total entropy generation (referred to as the Total Dead State), multiplied by the absolute environmental temperature .
According to the definition of , this value is achievable if all processes are reversible and the freshwater production is infinitesimal. As a real process is designed to produce a significant amount of freshwater, the least work demand is introduced . This term has a greater value than , as it includes the entropy generation associated with the condition RR > 0. The remaining entropy generation (related to the Restricted Dead State) is associated only to the irreversibility of the adopted technologies (finite thermal differences, pressure drops, etc.).
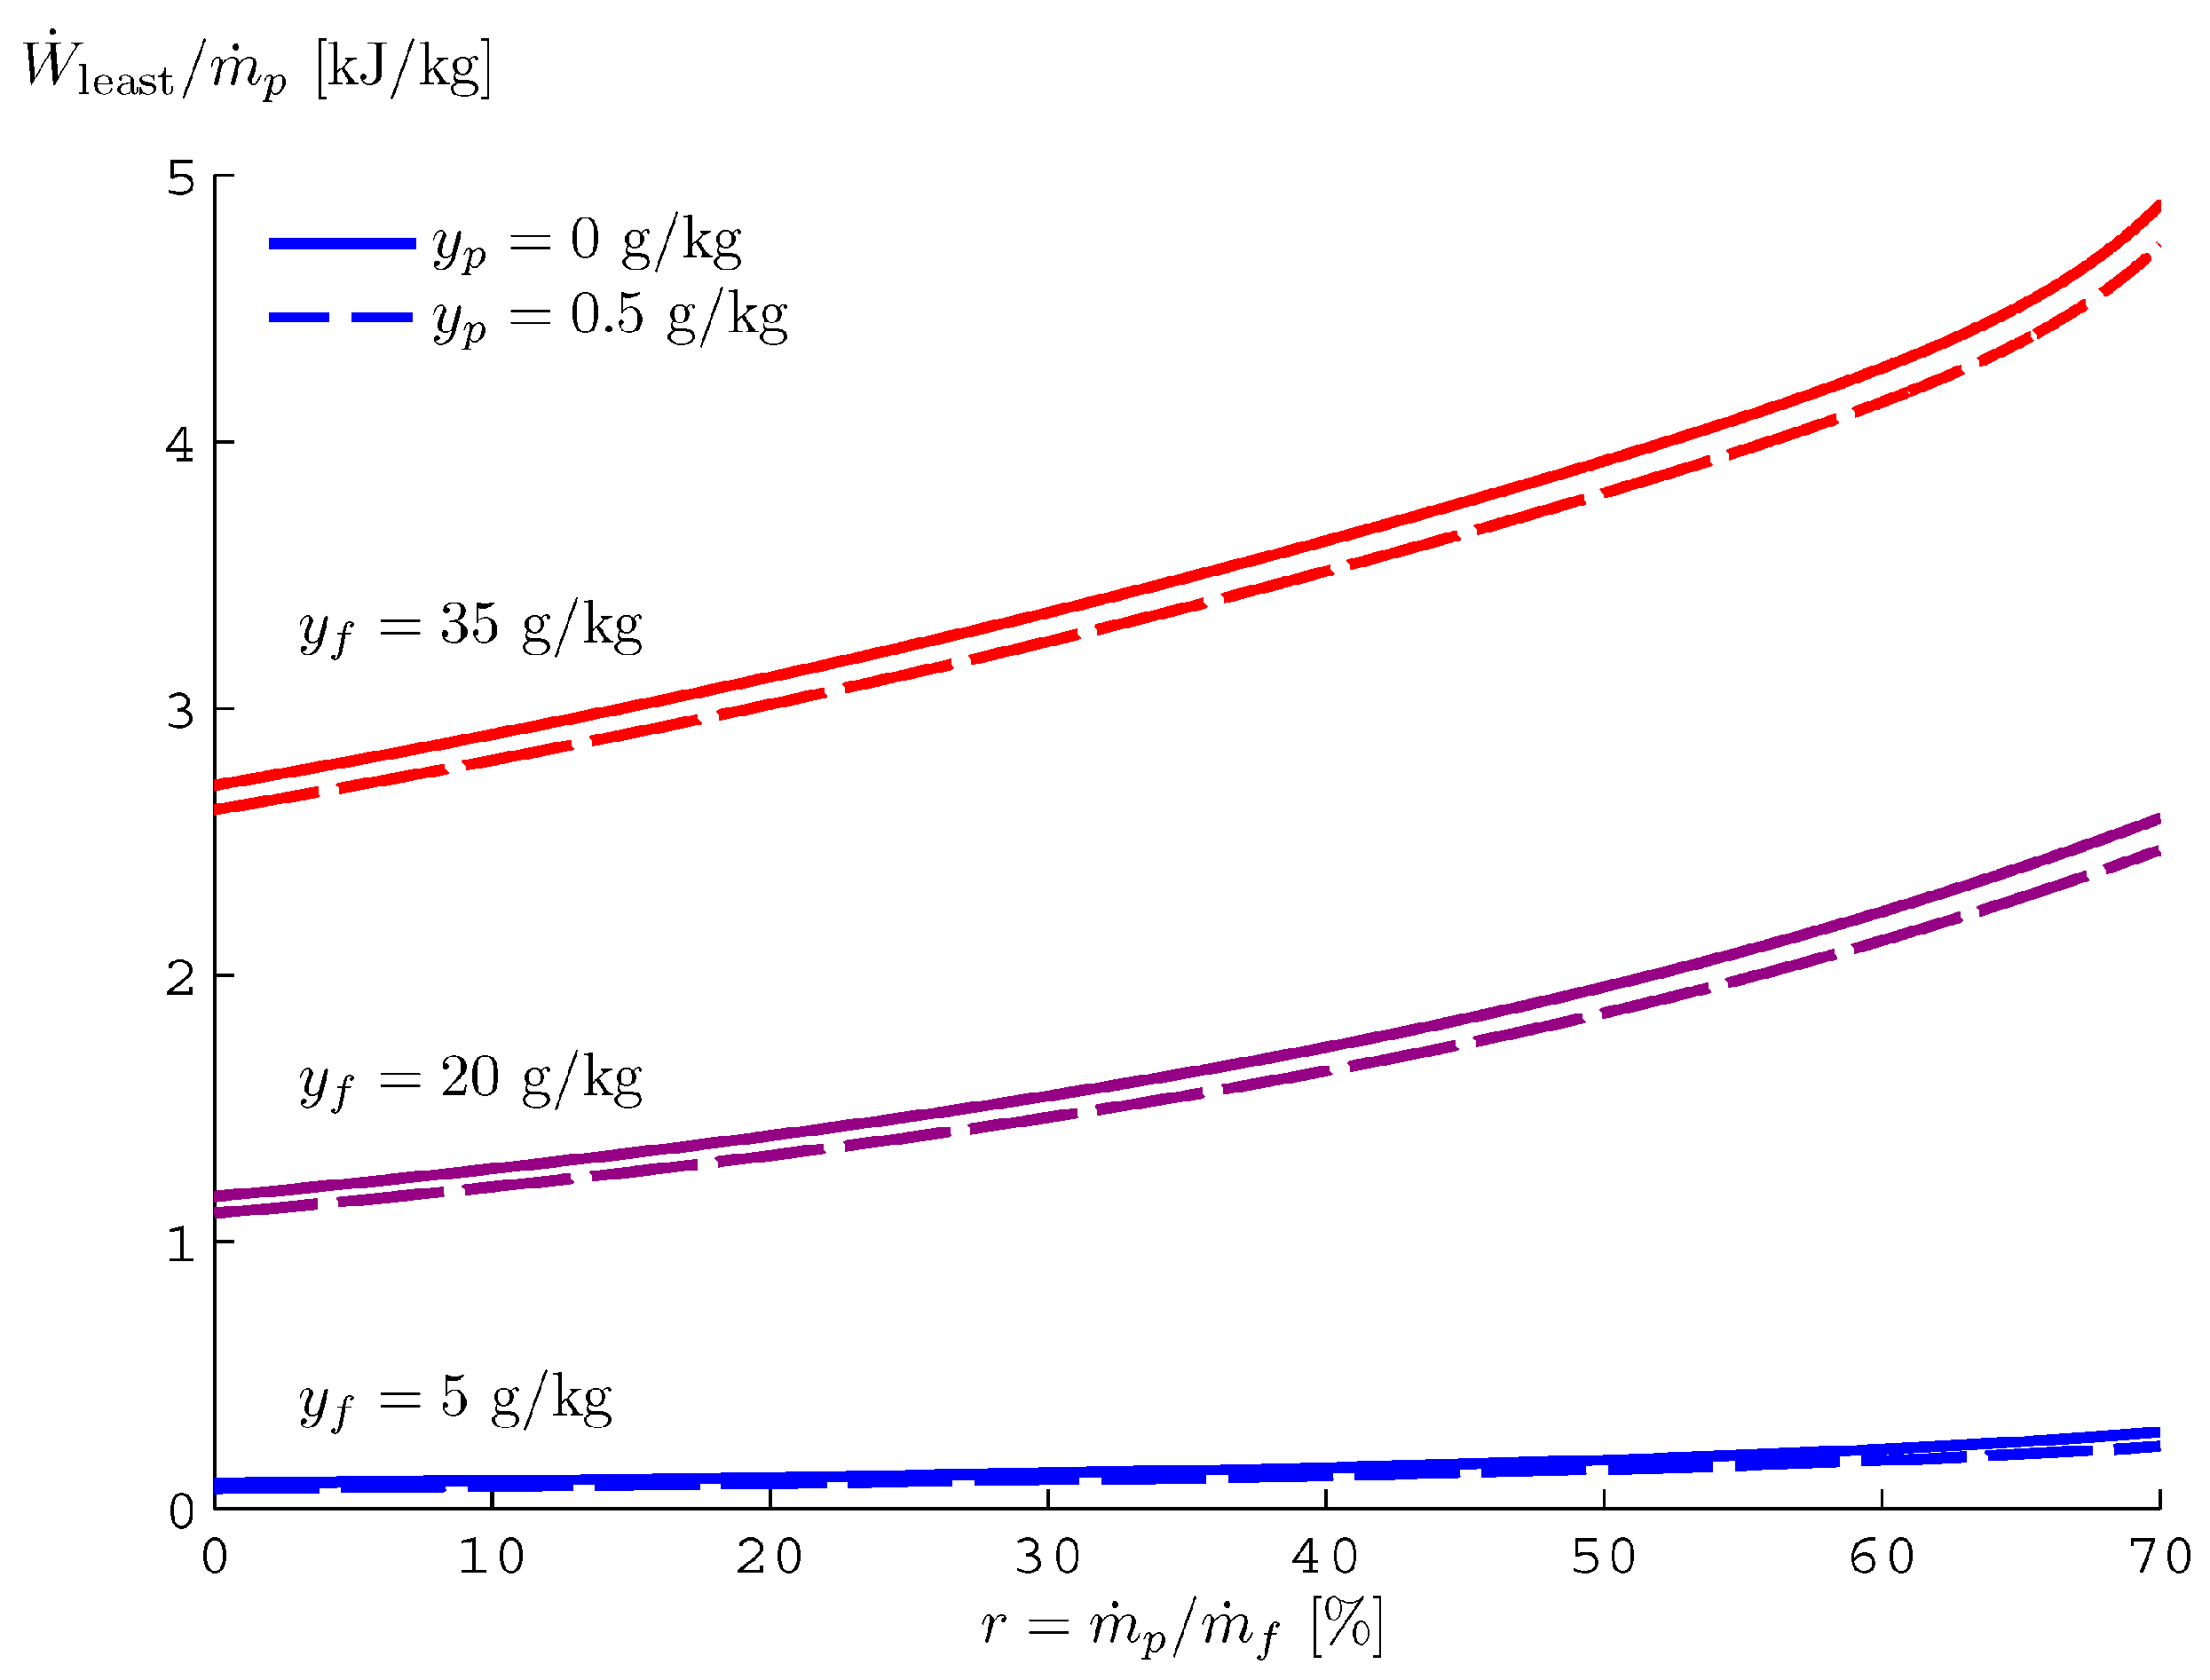
The trend of
is reported in
Figure 36, as a function of the recovery ratio and the salinity concentration of freshwater and feed water. As introduced before,
is equal to
if the recovery ratio is equal to zero. In the case of seawater (salinity 35 g/kg), zero salinity in produced freshwater and environmental temperature fixed to 25 °C,
is equal to 2.71 kJ/kg (of freshwater) [
89,
95].
In the case of desalination plants supplied by thermal energy, Equation (5) can be adopted, where
is the least thermal energy required with an infinitesimal recovery ratio. This term depends also on the temperature of the thermal source
, introducing the Carnot factor
, which physically represents the ratio of heat that can be converted into exergy, using a reversible thermal machine.
So, the exergy efficiency can be evaluated by Equation (5), defining
as the thermal requirement for the real plant.
Similarly, the term is introduced, representing the least thermal input requirement, assuming significant freshwater production (RR > 0).
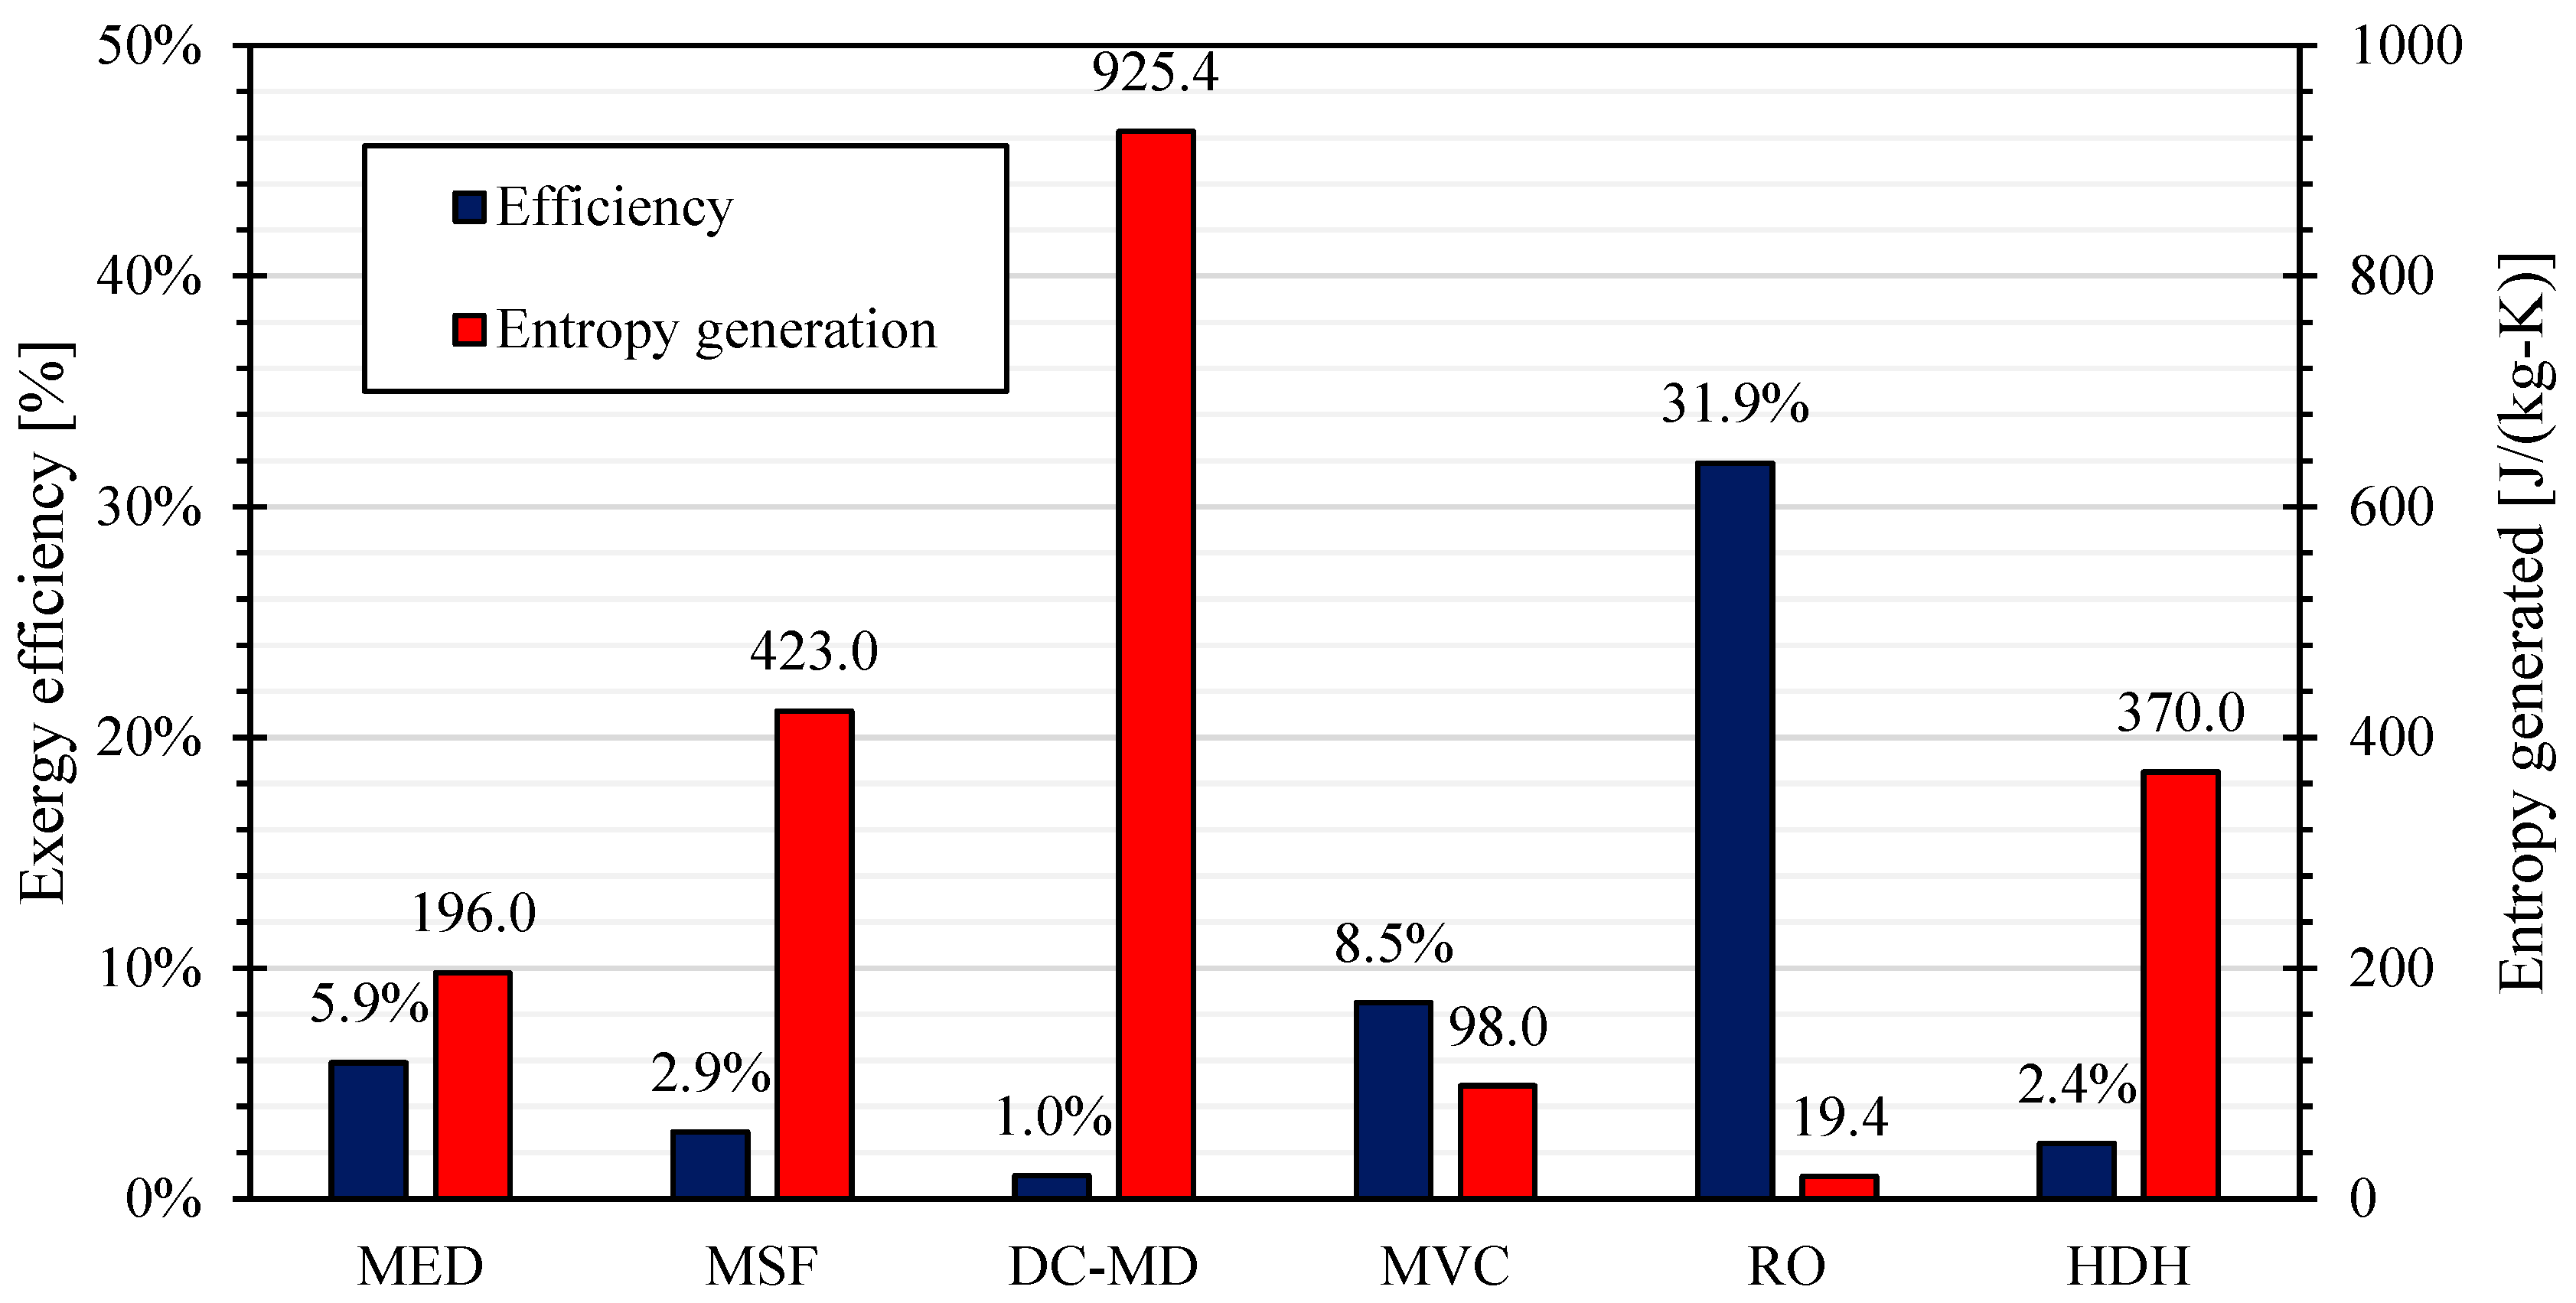
Mistry et al. analyzed the energy performances of developed desalination technologies, obtaining the results reported in
Figure 37 (based on data reported in [
89]). The graph reports the exergy efficiency according to Equation (3) for technologies requiring mechanical (or electrical) energy and Equation (5) in case of thermally supplied technologies.
The authors considered a seawater salinity equal to 4.2% in case of MED and MSF units, and 3.5% (common seawater) in the other cases. The graph emphasizes the high exergy efficiency of RO and the low value of DC-MD; but the result is contrary if entropy generation is considered as indicator [
89].
In the case of MED units, the high entropy generation is essentially related to the finite temperature differences between fluids. In fact, considering a simple unit with 6 effects, Mistry et al. demonstrated that entropy generation is essentially related to the effects (56.5%), the feed heaters (12.3%) and the condenser (21.8%).
It is significant to underline that a significant amount of energy is irreversibly wasted as the produced brine and freshwater have a higher temperature than the environmental conditions. Due to the limited temperature differences between the fluids and the environments, the entropy generation is only the 6.2% [
89].
MSF unit are also affected by the thermal gradient between fluids. It is evaluated that the entropy is mainly generated by feed heaters (73.9%) and brine heater (12.5%), where the temperature difference is higher. The temperature disequilibrium between produced freshwater and brine affects also MSF, causing an entropy generation equal to 10% [
89].
The only solution to improve the exergy efficiency of thermally driven desalination processes is the increasing of the sizes or the number of heat exchangers in order to reduce the temperature difference between primary and secondary fluids. However, this approach is limited by the fact that increasing the sizes of the heat exchangers raises the initial investment of the plant that which may not be counterbalanced by the economic value of the energy saving [
90].
The direct contact membrane distillation is a very energy consuming process. As shown in
Figure 37, the exergy efficiency is equal to 1%, with an entropy generation equal to 925.4 J/(kg-K). The entropy is essentially generated by four items: pressure drop through the module (34.5%), temperature difference in the heater (26.3%), temperature disequilibrium between feedwater, freshwater and brine (22.9%) and temperature difference inside the regenerator (16.3%).
In the case of MVC units, the entropy is essentially generated by the finite temperature difference inside the evaporator-condenser (57.2%), the irreversibility of the mechanical compressor (28.1%) and the temperature difference in the regenerator (10.9%). To improve the exergy efficiency, the main solution is the reduction of the temperature difference between the condensing steam and the evaporating brine inside the evaporator-compressor. Therefore, the irreversibility from the heat transfer and the mechanical compressor are both reduced, thanks to the reduction of the compression work. On the other side, the cost for the desalination unit is increased [
14].
According to data above reported, the RO unit represents the most efficient technology for desalination, if the energy recovery system is adopted. The exergy efficiency is equal to 31.9% in the case reported by Mistry et al. [
89]. The main irreversibility is associated to the pressure drop between the two sides of the semipermeable membrane (54.8%), the irreversibility of the main high-pressure pump (20%) and the chemical disequilibrium (15.9%). To improve further the exergy efficiency of the system, a solution is splitting the desalination process in two (or more) steps. As the osmotic pressure is function of the saline concentration of inlet and outlet fluid, in the first step a lower pressure increase is required, with a significant reduction of the pumping work. In the following step, a lower saline water is treated, achieving in the end the same final pressure in comparison with the case of a traditional RO unit [
96].
Finally, the HDH unit is essentially affected by the finite temperature difference between fluids. In particular, entropy is generated by the dehumidifier (53.6%), the humidifier (13.2%), the heater (17.3%) and the temperature disequilibrium of produced fluids with respect to the environmental condition (15.9%) [
89]. It is important to underline that this technology is currently under development, so the exergy efficiency could be increased in the next future [
82].


