
Multi-Center Healthcare Data Quality Measurement Model and Assessment Using OMOP CDM

 , , , , ,
Abstract
1. Introduction
2. Materials and Methods
- Develop a model for healthcare data quality evaluation;
- Define the quality evaluation rules to be applied to quality evaluation;
- Define the evaluation method using the quality evaluation model;
- Verify the model by using it to evaluate the CDM data of hospitals.
2.1. Healthcare Data Quality Conceptual Model Development
2.1.1. Completeness
2.1.2. Validity
2.1.3. Accuracy
2.1.4. Uniqueness
2.1.5. Consistency
2.2. Data Quality Assessment Rule Development
2.3. Data Quality Assessment Method Development
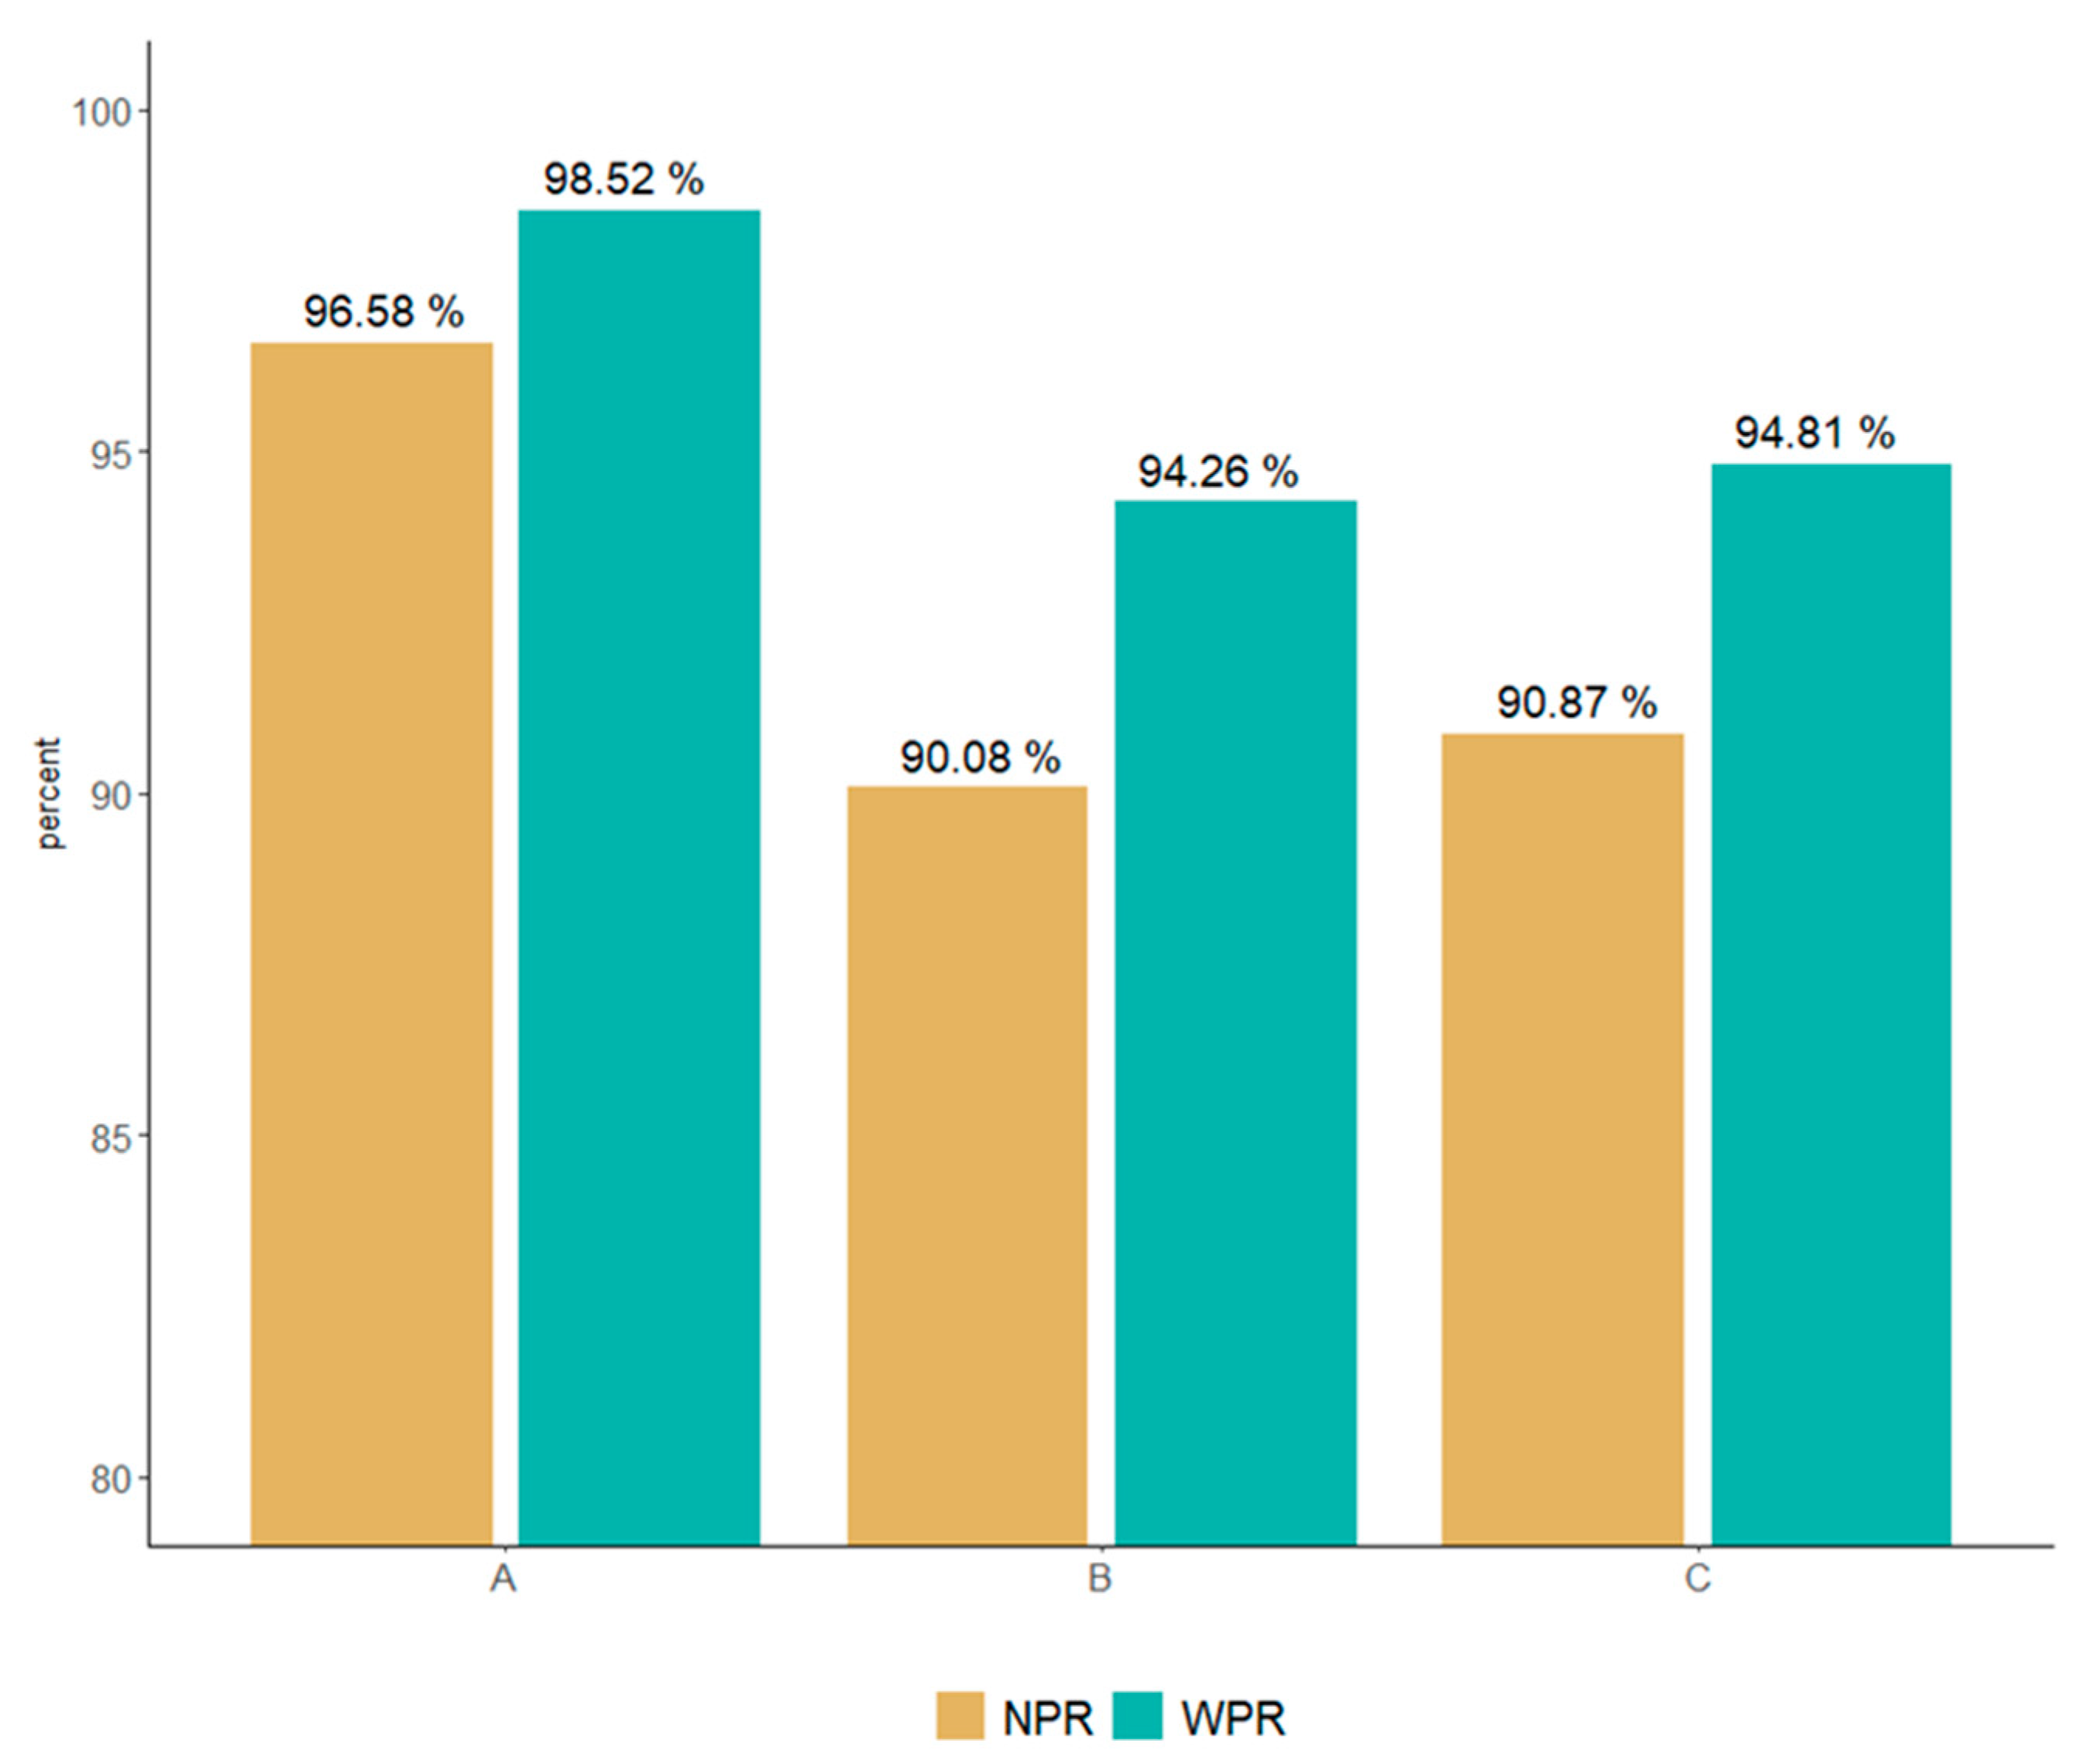
- NPR: this is a data quality evaluation index that does not reflect the weights for data errors. The NPR is calculated by subtracting 100 from the total error rate, which is the result of the data quality evaluation for each institution, and by adding the error rates of error and warning;
- WPR: this is a level evaluation index of data in which weights are applied to errors or warnings among data errors;
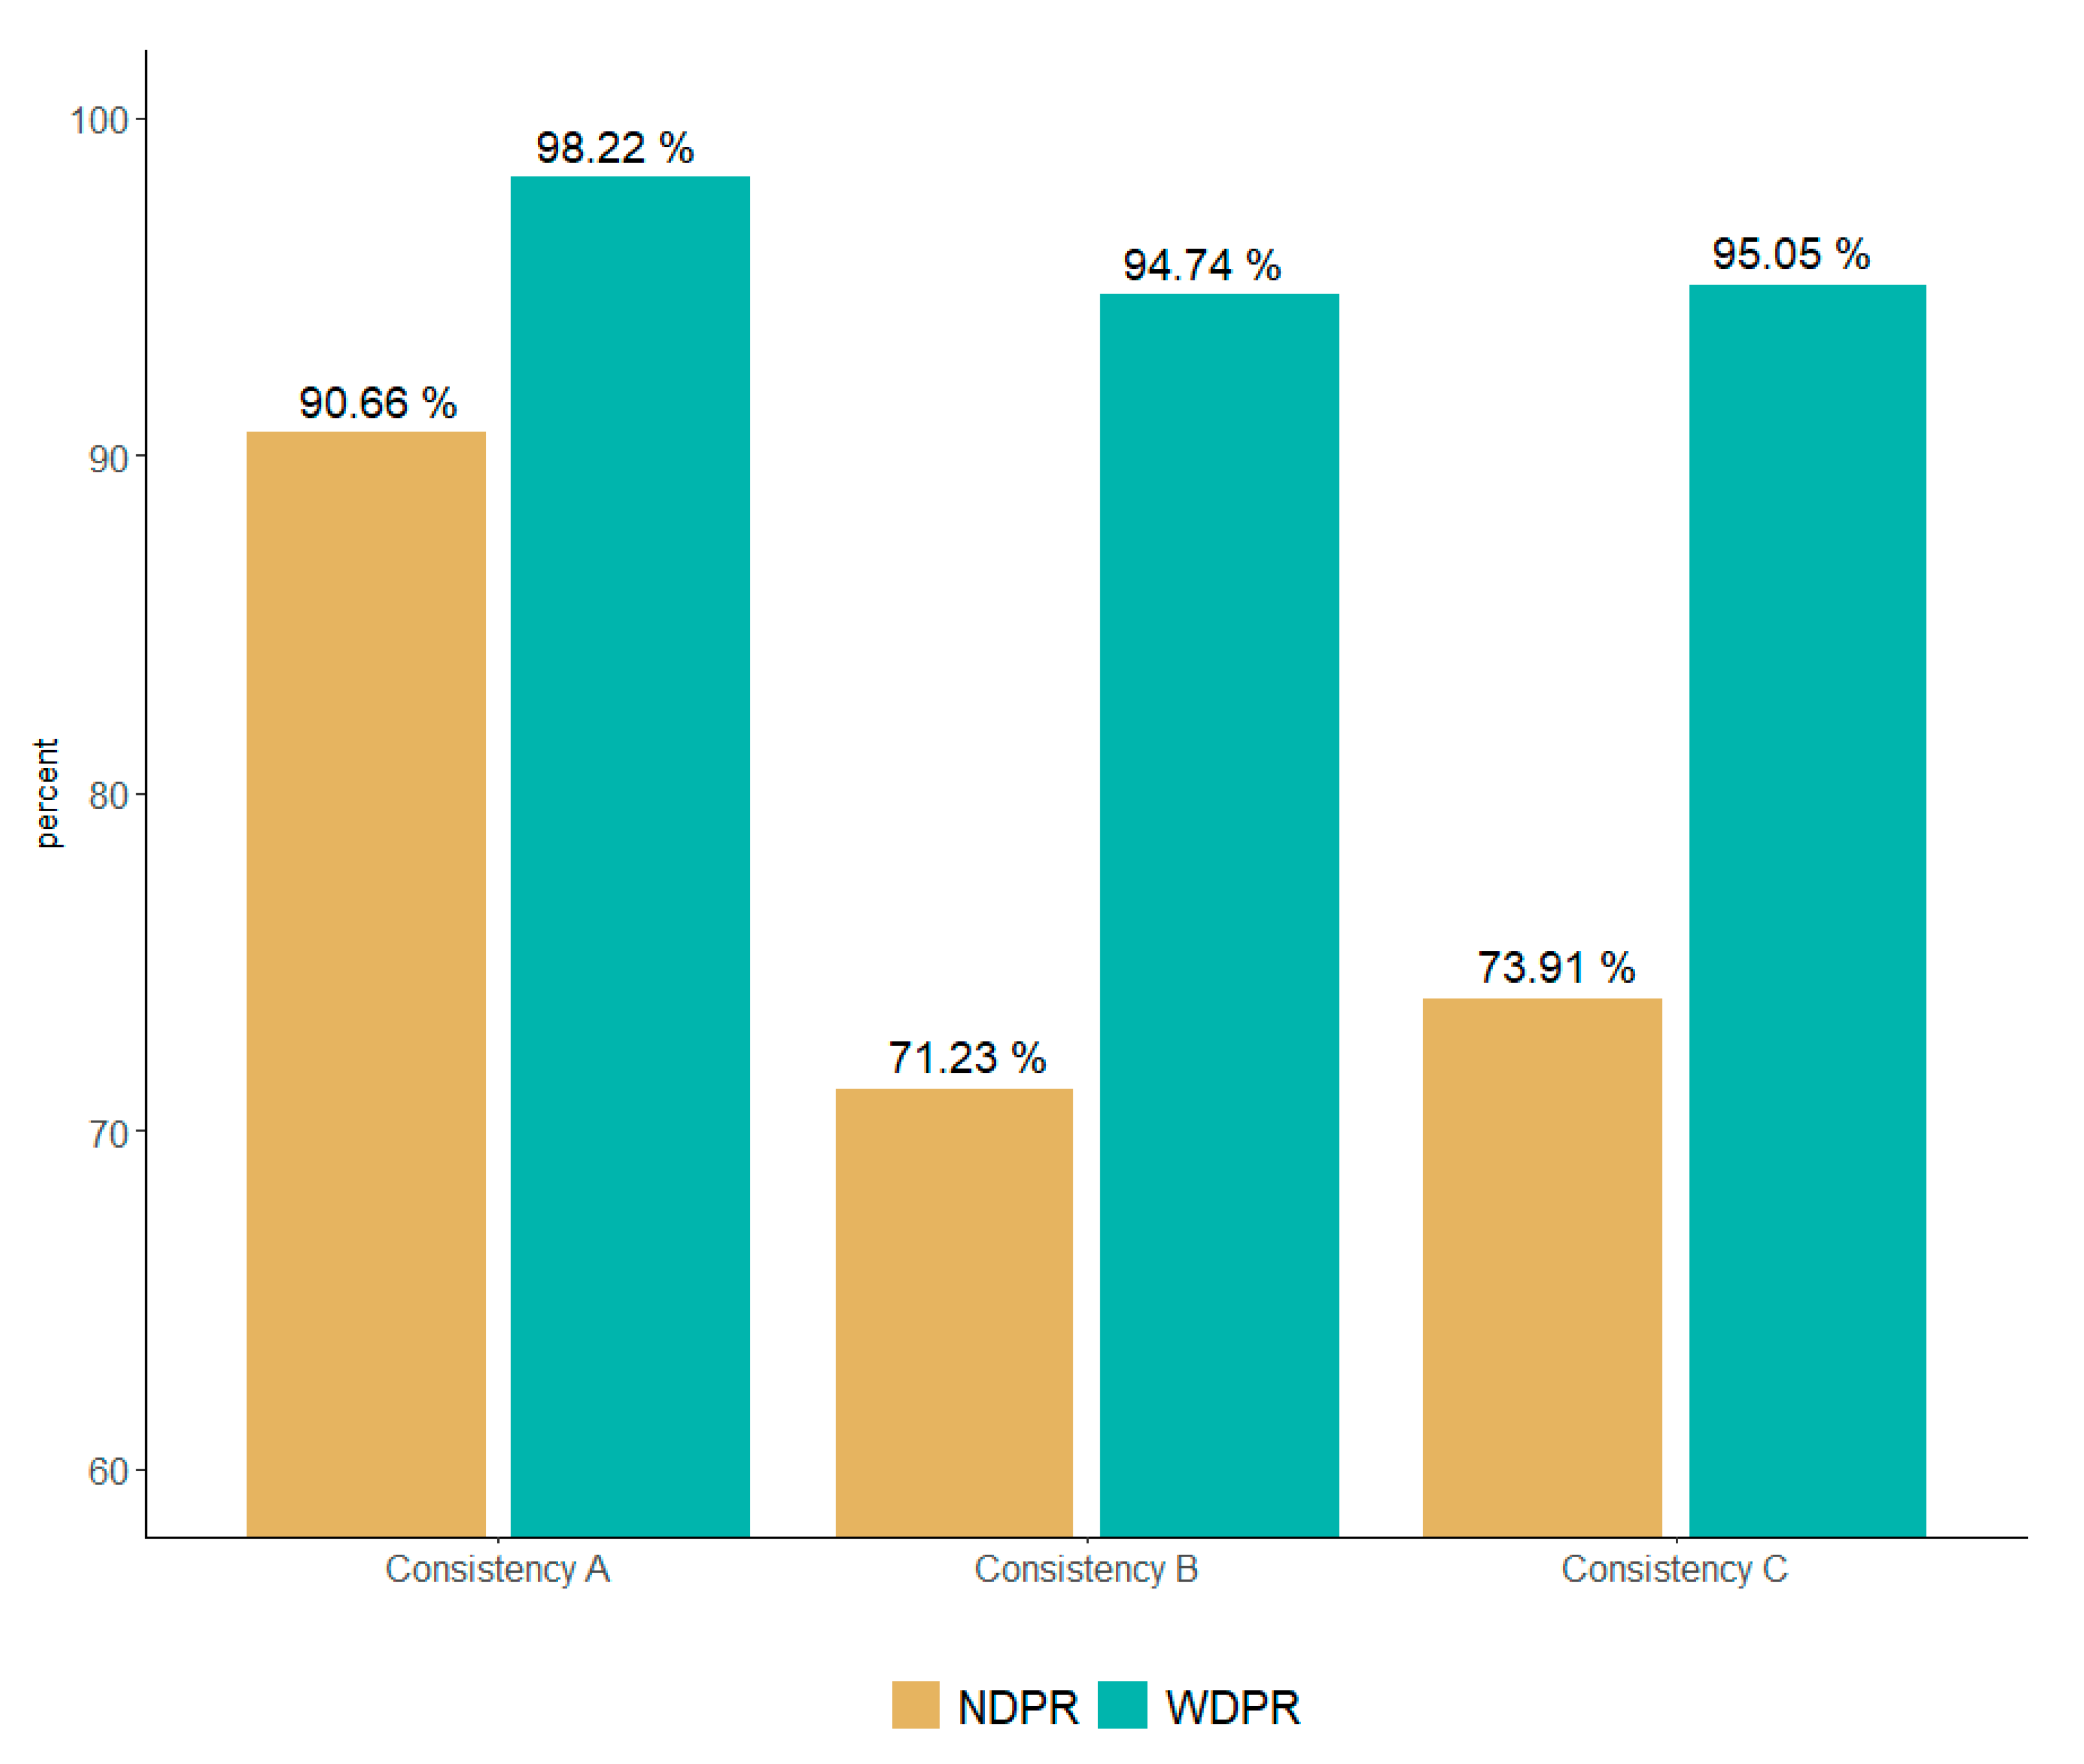
- NDPR: this is a data level evaluation index that does not reflect the weight of each index for each data error after quality is evaluated by the five dimensions. The NDPR is calculated by subtracting the error rate for each total dimension error rate, which is the data quality evaluation result for each dimension, 100;
- WDPR: this is a data level evaluation index that reflects the weights for data errors in each of the five dimensions. The WDPR evaluates the importance of each dimension by experts and sets the weight after finding the average value. Thereafter, the value obtained by multiplying the total dimension error rate by each dimension of each weight was calculated as the WDPR.
2.4. Multicenter Data Quality Assessment
3. Results
3.1. Multicenter OMOP CDM Data Quality Assessment Results
3.1.1. NPR and WPR
- We identified a type of error in which the inspection result value of the inspection information table is not an integer greater than 0, but a negative number. Obviously, there cannot be a case where a test result value exists as a negative number. As a result of tracing the source data, it was confirmed that the unmeasurable value was defined as −9999, owing to an error in the inspection machine;
- A type of error was revealed that is caused by a problem with the source data value (source_value), and it is a type of error that includes missing spelling such as “Test Name (“88888_Drug Name”, mi(misssing spelling) minor salivary gland”)”. This type of error suggests that meaningless data can be loaded, and the reliability of the data can be reduced;
- Error types that deviated from the standard term values owing to input errors between concept_id and code data values were found. In addition, the problem of mapping values to nonstandard values was also derived. The importance of mapping international standard terms is mentioned often in existing healthcare studies, suggesting that it may be a problem in multicenter studies that use OMOP CDM;
- A type of error regarding chronological relationships was also identified. This violates the precedence relationship between the patient’s date of birth and death and the observation period of each clinical information. This type of error draws attention to the implications of refining as errors that occur in the ETL process and errors that may occur in actual EHR systems;
- A type of error that violates referential integrity was revealed. This is the type identified with most errors in this study. This error occurred because of the reference relationship between patient information and the treatment/diagnosis information table in the structure of the OMOP CDM. In other words, most of the data were loaded abnormally even though the data were updated, or the patient ID was present but could not be used for actual research because there was no examination history.
3.1.2. NDPR and WDPR
4. Discussion
5. Conclusions
Author Contributions
Funding
Institutional Review Board Statement
Informed Consent Statement
Data Availability Statement
Conflicts of Interest
Appendix A

| DQ4HEALTH Dimensions | Definition | DQ Terminology | Authors | |
|---|---|---|---|---|
| Completeness | - | Evaluate missing data in the process of representing data in the real world as a system. | Completeness | [9,20,31,32,33] |
| Null Values | [34] | |||
| Incompleteness | [30] | |||
| Validity | Range | Evaluate whether it allows the scope of the data in the system. | Scope | [32] |
| Value out of range | [30] | |||
| etc. | [9,17,34] | |||
| Format | Evaluate whether the format specified in the system is correctly expressed. | Format | [32] | |
| Correctness | [20] | |||
| etc. | [17,33,34] | |||
| Accuracy | Calculation | Evaluate whether the calculation formula for items that are composed of multiple items is correct. | Accuracy | [9,32] |
| Computation Conformance | [17] | |||
| Timeliness | Evaluate time among data values expressed in the real world. | Timeliness | [9,31,32,34] | |
| Currency | [20,33] | |||
| etc. | [9,17] | |||
| Business Rule | Evaluate whether business relevance (knowledge) among data values expressed in the real world is correctly expressed. | Accuracy | [9,31,32,34] | |
| (Atemporal) Plausibility | [17,20] | |||
| etc. | [30,33] | |||
| Uniqueness | - | Evaluate whether duplicate values are allowed in the system. | Uniqueness (Plausibility) | [17,34] |
| (Non)duplication | [30,33] | |||
| Consistency | Standard | It does not evaluate the value of structural data within the system but evaluates the value of data outside the institution. | Value Conformance | [17] |
| Incompatibility | [30] | |||
| etc. | [9,20] | |||
| Relational | Evaluates whether data in the system complies with specified relational constraints. | Consistency | [31,33,34] | |
| Relationship Conformance | [17] | |||
| Etc. | [20,30,32] | |||
Appendix B
| Dimensions | Definition | OMOP CDM Rules Example | Type | Rule count | |
|---|---|---|---|---|---|
| Completeness | - | This rule verifies that there is no omission in a required column. | a. The patient number (person_id) column in the Person Table must not have a null value. | E | 85 |
| b. The Specimen Concept ID column in the Specimen table must not have a null value. | |||||
| Validity | Range | This rule verifies that a data value is within a given range. | a. The Measurement Result Value of measurement table should have a value greater than 0. | W | 10 |
| b. The month of the patient’s date of birth must have a value between 1 and 12. | E | ||||
| Format | This rule verifies that a data value conforms to the data type. | a. The year of birth in Person table should have a value in the format of a 4-digit number. | E | 9 | |
| b. The column of Measurement Time in the Measurement table should have a value in the format of 24H:MM:SS. | |||||
| Accuracy | Calculation | This rule verifies that multi-column values are the same. | a. Drug_exposure_end_date must be equal to Drug_exposure_start_date minus a value of −1. | E | 1 |
| Timeline | This rule verifies the precedence of time. | a. The value of the year of birth (YYYY) in the date of birth (Birth_Datetime) of the patient information and the value of the year of birth (year_of_birth) must have the same value. | W | 58 | |
| b. The Procedure_date in the Procedure table must occur after the date of birth and before the date of death. | E | ||||
| Business Rule | This rule verifies the hospital business rules. | a. If one’s gender is female, they cannot have a diagnosis code for male disease. | E | 145 | |
| b. The visit concept id should have a value of type of inpatient, outpatient, emergency, clinical trial, and medical examination. | W | ||||
| Uniqueness | - | This rule verifies the value corresponding to the primary key. | a. The person id in the person table must have a unique value. | E | 14 |
| Consistency | Standard | If an international standard code is used, verify the standard code. | a. The Condition concept id of the Condition table must comply with the standard mapping of Domain = Condition, Standard concept = S, of Voca table | W | 34 |
| Relationship | If there is a referential relationship between tables, referential integrity is verified. | a. Location id of Person table should have the value of Location id of Location table. | E | 44 | |
References
- Sanson-Fisher, R.W.; Bonevski, B. Limitations of the randomized controlled trial in evaluating population-based health interventions. Am. J. Prev. Med. 2007, 33, 155–161. [Google Scholar] [CrossRef]
- Wang, R.Y.; Strong, D.M. Beyond accuracy: What data quality means to data consumers. J. Manag. Inf. Syst. 1996, 12, 5–33. [Google Scholar] [CrossRef]
- Gao, J.; Xie, C. Big data validation and quality assurance—Issues, challenges, and needs. In Proceedings of the 2016 IEEE Symposium on Service-Oriented System Engineering (SOSE), Oxford, UK, 29 March–2 April 2016; IEEE: Piscataway, NJ, USA; pp. 433–441. [Google Scholar] [CrossRef]
- Berndt, D.J. Healthcare data warehousing and quality assurance. Computer 2001, 34, 56–65. [Google Scholar] [CrossRef]
- Weiner, M.G.; Embi, P.J. Toward reuse of clinical data for research and quality improvement: The end of the beginning? Ann. Intern. Med. 2009, 151, 359–360. [Google Scholar] [CrossRef]
- Kahn, M.G.; Raebel, M.A. A pragmatic framework for single-site and multisite data quality assessment in electronic health record-based clinical research. Med. Care 2012, 21–29. [Google Scholar] [CrossRef]
- Overhage, J.M. Validation of a common data model for active safety surveillance research. JAMA 2012, 19, 54–60. [Google Scholar] [CrossRef] [PubMed]
- Reimer, A.P. Data quality assessment framework to assess electronic medical record data for use in research. Int. J. Med. Inform. 2016, 90, 40–47. [Google Scholar] [CrossRef]
- Puttkammer, N. An assessment of data quality in a multi-site electronic medical record system in Haiti. Int. J. Med. Inform. 2016, 86, 104–116. [Google Scholar] [CrossRef] [PubMed]
- Noël, G. Improving the quality of healthcare data through information design. Inf. Des. J. 2017, 23, 104–122. [Google Scholar] [CrossRef][Green Version]
- Savitz, S.T. How Much Can We Trust Electronic Health Record Data? Elsevier: Amsterdam, The Netherlands, 2020; Volume 8, p. 100444. [Google Scholar] [CrossRef] [PubMed]
- Hripcsak, G. Observational Health Data Sciences and Informatics (OHDSI): Opportunities for observational researchers. Stud. Health Technol. Inform. 2015, 216, 574–578. [Google Scholar] [CrossRef] [PubMed]
- Yoon, D. Conversion and data quality assessment of electronic health record data at a Korean tertiary teaching hospital to a common data model for distributed network research. Healthc. Inform. Res. 2016, 22, 54–58. [Google Scholar] [CrossRef] [PubMed]
- Lynch, K.E. Incrementally transforming electronic medical records into the observational medical outcomes partnership common data model: A multidimensional quality assurance approach. Appl. Clin. Inform. 2019, 10, 794–803. [Google Scholar] [CrossRef]
- Huser, V. Extending Achilles Heel Data Quality Tool with New Rules Informed by Multi-Site Data Quality Comparison. Stud. Health Technol. Inform. 2019, 264, 1488–1489. [Google Scholar] [CrossRef] [PubMed]
- Maier, C. Towards implementation of OMOP in a German university hospital consortium. Appl. Clin. Inform. 2018, 9, 54–61. [Google Scholar] [CrossRef] [PubMed]
- Kahn, M.G. A harmonized data quality assessment terminology and framework for the secondary use of electronic health record data. Egems 2016, 4, 1244. [Google Scholar] [CrossRef]
- Huser, V. Multisite evaluation of a data quality tool for patient-level clinical data sets. EGEMs 2016, 4, 1239. [Google Scholar] [CrossRef] [PubMed]
- Coppersmith, N.A. Quality informatics: The convergence of healthcare data, analytics, and clinical excellence. Appl. Clin. Inform. 2019, 10, 272–277. [Google Scholar] [CrossRef]
- Weiskopf, N.G.; Weng, C. Methods and dimensions of electronic health record data quality assessment: Enabling reuse for clinical research. JAMA 2013, 20, 144–151. [Google Scholar] [CrossRef]
- Terry, A.L. A basic model for assessing primary health care electronic medical record data quality. BMC Med. Inform. Decis. Mak. 2019, 19, 1–11. [Google Scholar] [CrossRef]
- Xiao, Y. Challenges in data quality: The influence of data quality assessments on data availability and completeness in a voluntary medical male circumcision programme in Zimbabwe. BMJ Open 2017, 7, e013562. [Google Scholar] [CrossRef]
- Liu, C. Data completeness in healthcare: A literature survey. Pac. Asia J. Assoc. Inf. Syst. 2017, 9, 5. [Google Scholar] [CrossRef]
- Callahan, T.J. A comparison of data quality assessment checks in six data sharing networks. eGEMs 2017, 5, 8. [Google Scholar] [CrossRef]
- Kodra, Y. Data quality in rare diseases registries. In Rare Diseases Epidemiology: Update and Overview; Springer International Publishing: Berlin/Heidelberg, Germany, 2017; pp. 149–164. [Google Scholar] [CrossRef]
- Carle, F. Quality assessment of healthcare databases. Epidemiol. Biostat. Public Health 2017, e12901. [Google Scholar] [CrossRef]
- Lee, K. A framework for data quality assessment in clinical research datasets. Am. Med. Inform. Assoc. 2017, 2017, 1080–1089. [Google Scholar] [CrossRef]
- Muthee, V. The impact of routine data quality assessments on electronic medical record data quality in Kenya. PLoS ONE 2017, 13, e0195362. [Google Scholar] [CrossRef]
- Feder, S.L. Data quality in electronic health records research: Quality domains and assessment methods. West. J. Nurs. Res. 2018, 40, 753–766. [Google Scholar] [CrossRef]
- Zhan, W. Rule-Based data quality assessment and monitoring system in healthcare facilities. Stud. Health Technol. Inform. 2019, 257, 460–467. [Google Scholar] [CrossRef]
- Amicis, F.D. A methodology for data quality assessment on financial data. Stud. Commun. Sci. 2004, 4, 115–137. [Google Scholar] [CrossRef]
- Wand, Y.; Wang, R.Y. Anchoring data quality dimensions in ontological foundations. Commun. ACM 1996, 39, 86–95. [Google Scholar] [CrossRef]
- English, L.P. Improving Data Warehouse and Business Information Quality: Methods for Reducing Costs and Increasing Profits; John Wiley & Sons: Chicago, IL, USA, 1999. [Google Scholar] [CrossRef]
- Loshin, D. Enterprise Knowledge Management: The Data Quality Approach; Morgan Kaufmann: Burlington, NJ, USA, 2001. [Google Scholar] [CrossRef]
- Scannapieco, M. Data Quality: Concepts, Methodologies and Techniques, Data-Centric Systems and Applications; Springer: New York, NY, USA, 2006. [Google Scholar] [CrossRef]
- Batini, C.; Cappiello, C. Methodologies for data quality assessment and improvement. ACM Comput. Surv. (CSUR) 2009, 41, 1–52. [Google Scholar] [CrossRef]
- Rahm, E. Data cleaning: Problems and current approaches. IEEE Data Eng. Bull. 2000, 23, 3–13. [Google Scholar] [CrossRef]
- Bora, D.J. Big data analytics in healthcare: A critical analysis. In Big Data Analytics for Intelligent Healthcare Management; Elsevier: Amsterdam, The Netherlands, 2019; pp. 43–57. [Google Scholar] [CrossRef]


| Dimension | Sub-Dimension | Definition | Importance | Weight |
|---|---|---|---|---|
| Completeness | This rule verifies that there are no missing required columns. | 9.6 | 0.23 | |
| Validity | Range | This rule checks whether a data value is within a given range. | 7.5 | 0.18 |
| Format | This rule checks whether a data value conforms to the data type. | |||
| Accuracy | Calculation | This rule verifies whether the values of different columns are correct. | 7.7 | 0.18 |
| Timeline | This rule verifies the precedence of time. | |||
| Business Rule | This rule verifies the hospital business rules. | |||
| Uniqueness | This rule verifies the value corresponding to the primary key. | 9 | 0.22 | |
| Consistency | Standard | If an international standard code is used, this rule verifies the standard code. | 7.9 | 0.19 |
| Relationship | If there is a referential relationship between tables, this rule verifies the referential integrity. |
| Type | Definition | Importance | Weight |
|---|---|---|---|
| Error | This error is one that must be cleansed and corrected once it is identified in the validation rule. | 9.3 | 0.64 |
| Warning | This error is one that was identified in the validation rule but does not need to be corrected. | 5.3 | 0.36 |
| Center | Provider Type | Region | The Number of Bed Hospitals | The Number of OMOP CDM Person |
|---|---|---|---|---|
| A | Tertiary Hospital | Seoul | approximately 1400 | 3,598,955 |
| B | General Hospital | Gyeonggido | approximately 900 | 2,279,292 |
| C | General Hospital | Seoul | approximately 400 | 2,077,837 |
| Total Error Rate | Error Rate | Warning Rate | NPR | WPR | |
|---|---|---|---|---|---|
| A | 3.42% | 0.89% | 2.53% | 96.58% | 98.52% |
| B | 9.92% | 7.73% | 2.19% | 90.08% | 94.26% |
| C | 9.13% | 6.79% | 2.34% | 90.87% | 94.81% |
| p-value | <0.001 | <0.001 | <0.001 | <0.001 | <0.001 |
| Center | DQ4HEALTH Dimension | Total Dimension Data Count | Total Dimension Error Count | Total Dimensions Error Rate | NDPR | WDPR |
|---|---|---|---|---|---|---|
| A | Completeness | 5,460,723,980 | 8276 | 0.01% | 99.99% | 99.99% |
| Validity | 1,360,559,053 | 22,801,212 | 1.67% | 98.33% | 99.70% | |
| Accuracy | 3,570,299,098 | 59,288,628 | 1.66% | 98.34% | 99.69% | |
| Uniqueness | 840,625,891 | 239,985 | 0.03% | 99.97% | 99.99% | |
| Consistency | 5,005,238,125 | 467,936,657 | 9.34% | 90.66% | 98.22% | |
| B | Completeness | 2,619,120,230 | 1,399,297 | 0.05% | 99.95% | 99.99% |
| Validity | 644,669,318 | 11,173,281 | 1.73% | 98.27% | 99.69% | |
| Accuracy | 1,847,001,586 | 333,479 | 0.02% | 99.98% | 99.99% | |
| Uniqueness | 412,280,539 | 0 | 0% | 100% | 100 | |
| Consistency | 2,835,935,266 | 816,059,524 | 28.77% | 71.23% | 94.74% | |
| C | Completeness | 1,826,576,516 | 1,545,055 | 0.08% | 99.92% | 99.98% |
| Validity | 430,638,422 | 7,014,267 | 1.62% | 98.38% | 99.71% | |
| Accuracy | 1,270,385,522 | 302,273 | 0.00% | 99.99% | 99.99% | |
| Uniqueness | 291,598,022 | 0 | 0% | 100% | 100% | |
| Consistency | 2,003,506,197 | 522,758,437 | 26.09% | 73.91% | 95.05% |
Publisher’s Note: MDPI stays neutral with regard to jurisdictional claims in published maps and institutional affiliations. |
© 2021 by the authors. Licensee MDPI, Basel, Switzerland. This article is an open access article distributed under the terms and conditions of the Creative Commons Attribution (CC BY) license (https://creativecommons.org/licenses/by/4.0/).
Share and Cite
Kim, K.-H.; Choi, W.; Ko, S.-J.; Chang, D.-J.; Chung, Y.-W.; Chang, S.-H.; Kim, J.-K.; Kim, D.-J.; Choi, I.-Y. Multi-Center Healthcare Data Quality Measurement Model and Assessment Using OMOP CDM. Appl. Sci. 2021, 11, 9188. https://doi.org/10.3390/app11199188
Kim K-H, Choi W, Ko S-J, Chang D-J, Chung Y-W, Chang S-H, Kim J-K, Kim D-J, Choi I-Y. Multi-Center Healthcare Data Quality Measurement Model and Assessment Using OMOP CDM. Applied Sciences. 2021; 11(19):9188. https://doi.org/10.3390/app11199188
Chicago/Turabian StyleKim, Ki-Hoon, Wona Choi, Soo-Jeong Ko, Dong-Jin Chang, Yeon-Woog Chung, Se-Hyun Chang, Jae-Kwon Kim, Dai-Jin Kim, and In-Young Choi. 2021. "Multi-Center Healthcare Data Quality Measurement Model and Assessment Using OMOP CDM" Applied Sciences 11, no. 19: 9188. https://doi.org/10.3390/app11199188
APA StyleKim, K.-H., Choi, W., Ko, S.-J., Chang, D.-J., Chung, Y.-W., Chang, S.-H., Kim, J.-K., Kim, D.-J., & Choi, I.-Y. (2021). Multi-Center Healthcare Data Quality Measurement Model and Assessment Using OMOP CDM. Applied Sciences, 11(19), 9188. https://doi.org/10.3390/app11199188