
Improving the Accuracy of Predicting Bank Depositor’s Behavior Using a Decision Tree


Abstract
:1. Introduction
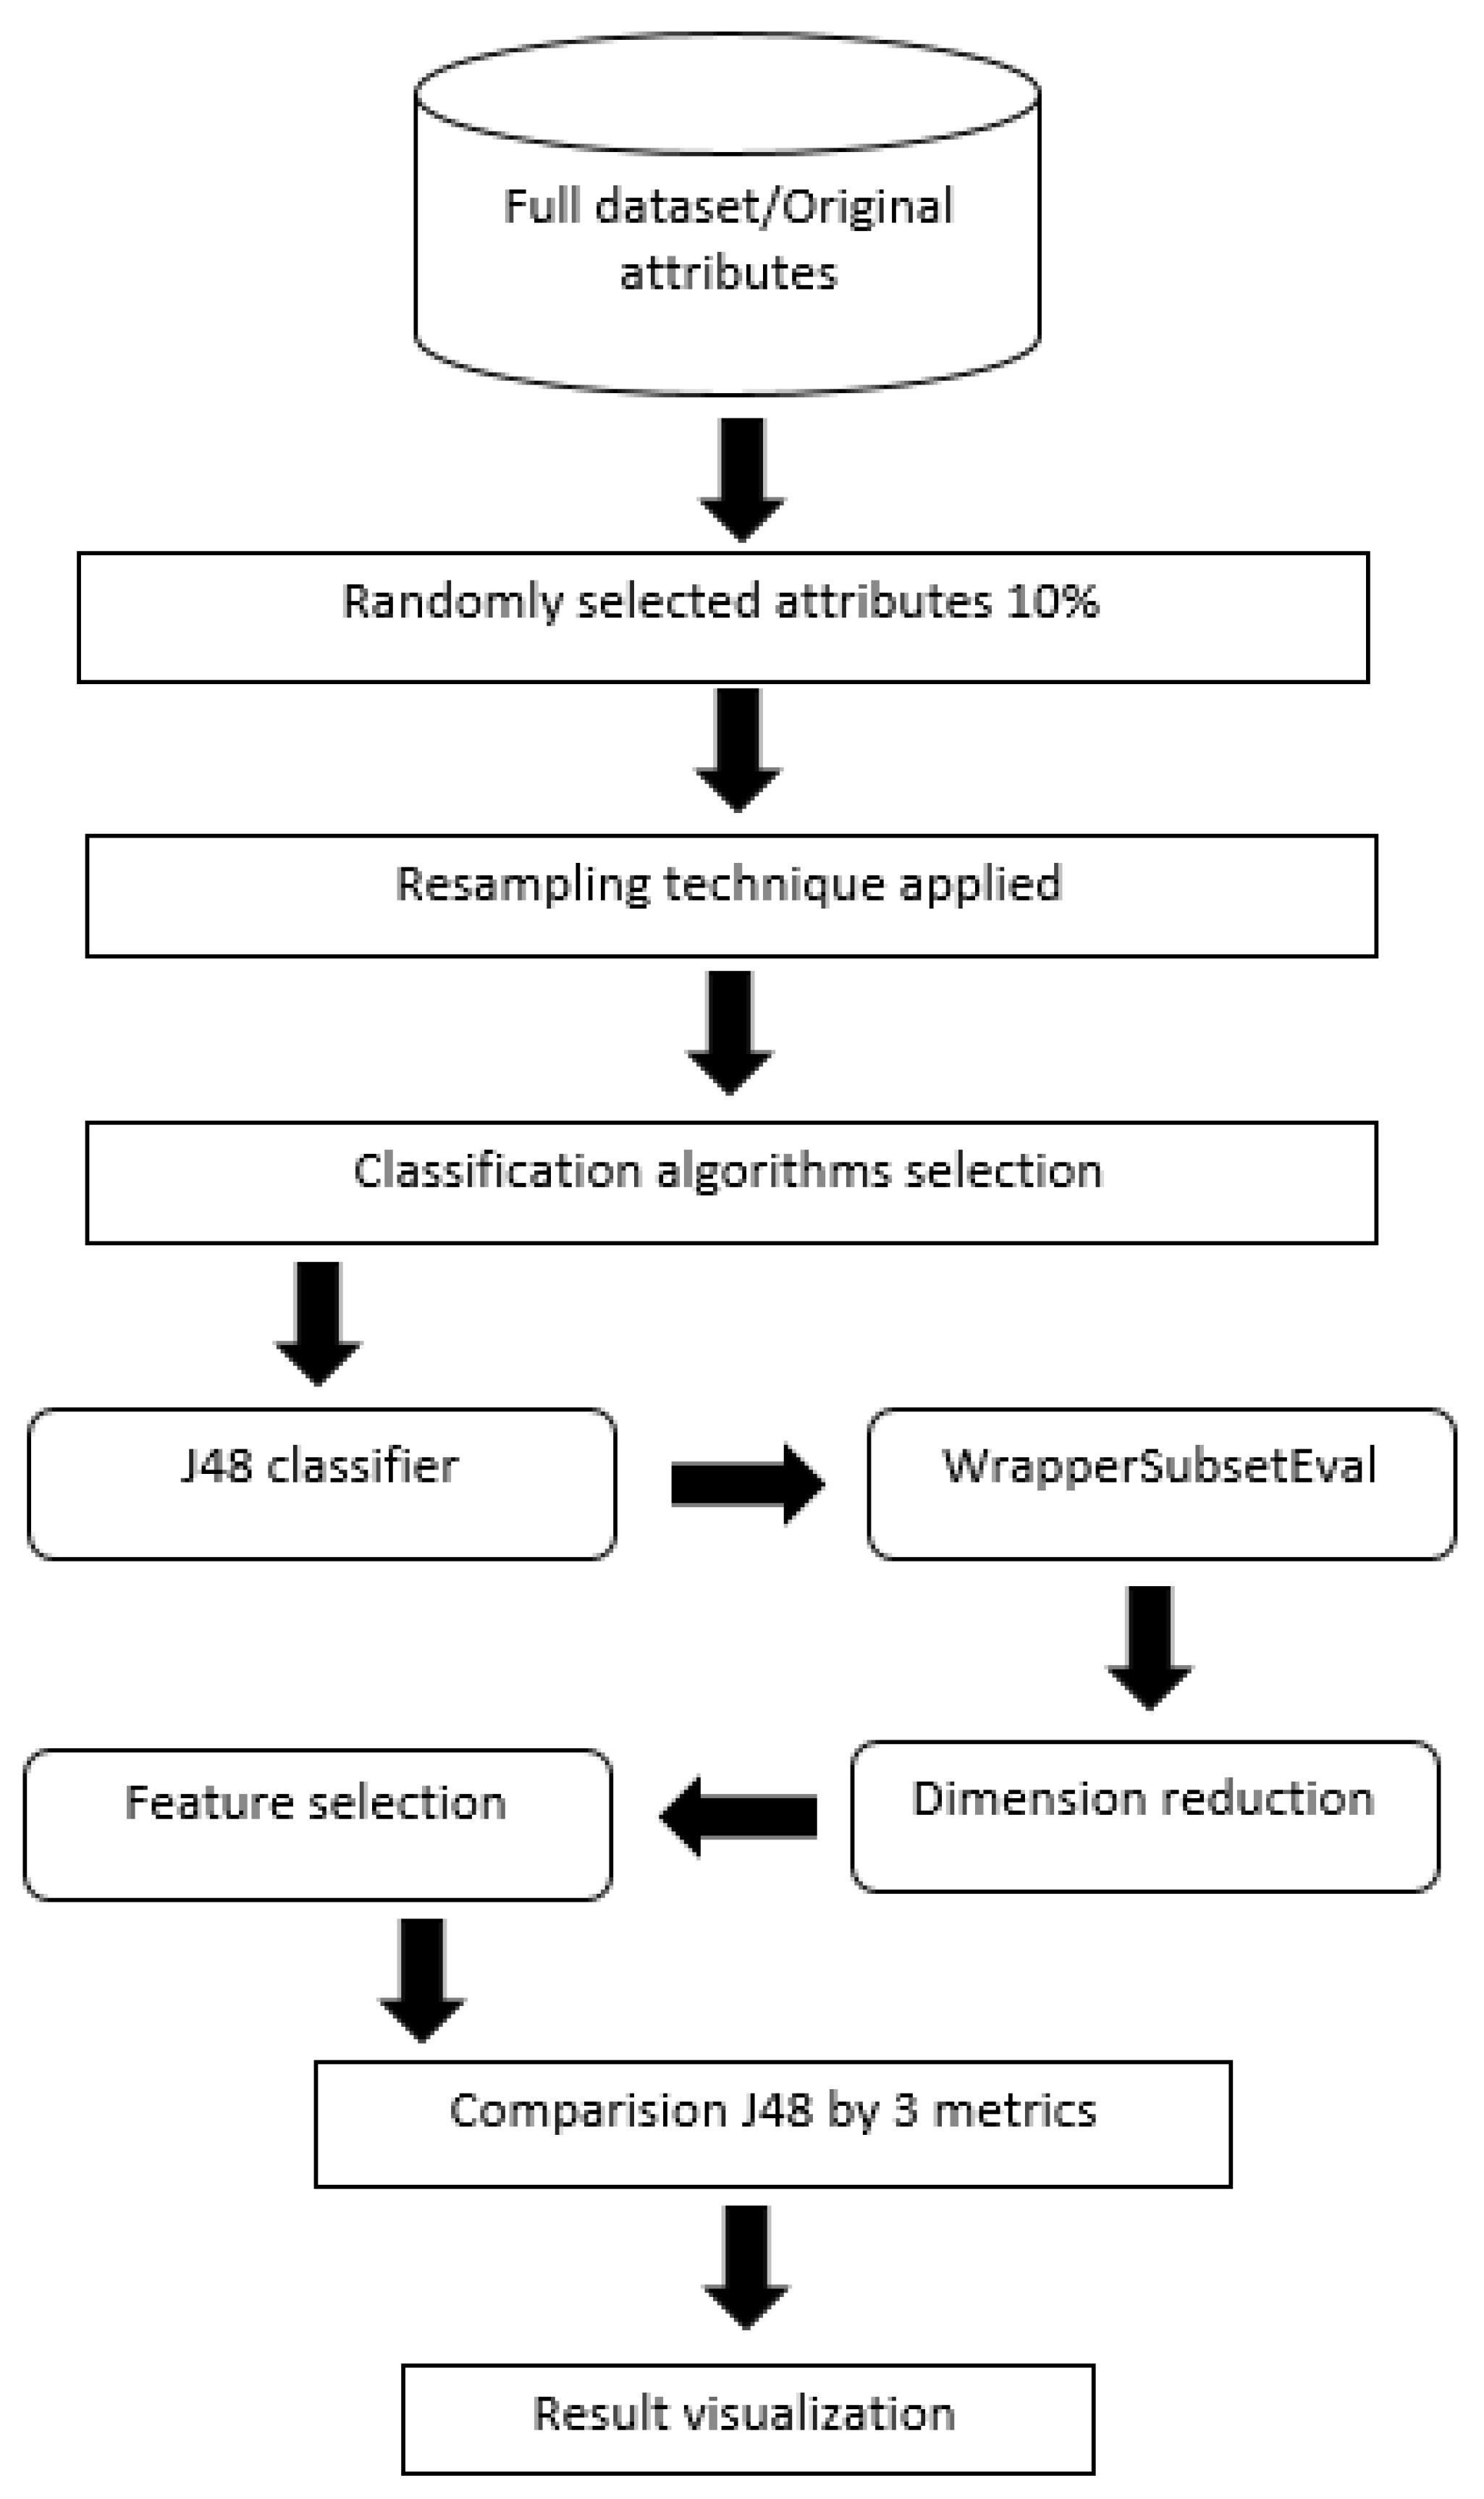
2. Materials and Methods
2.1. Bank Marketing Dataset Description
2.2. Preprocessing
2.3. Data-Driven Models
2.4. Feature Selection
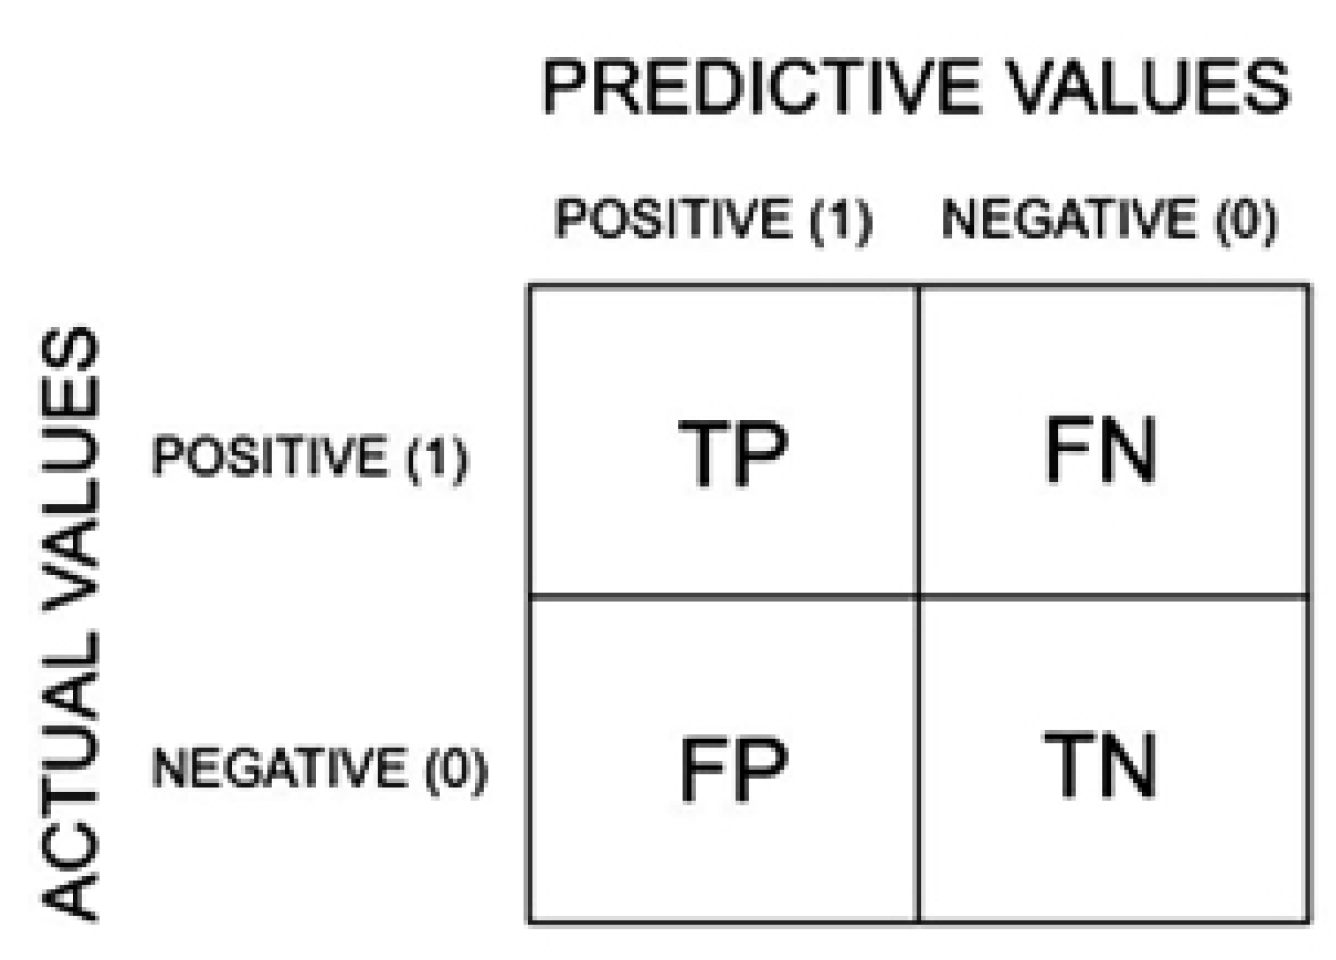
2.5. Evaluation Metrics
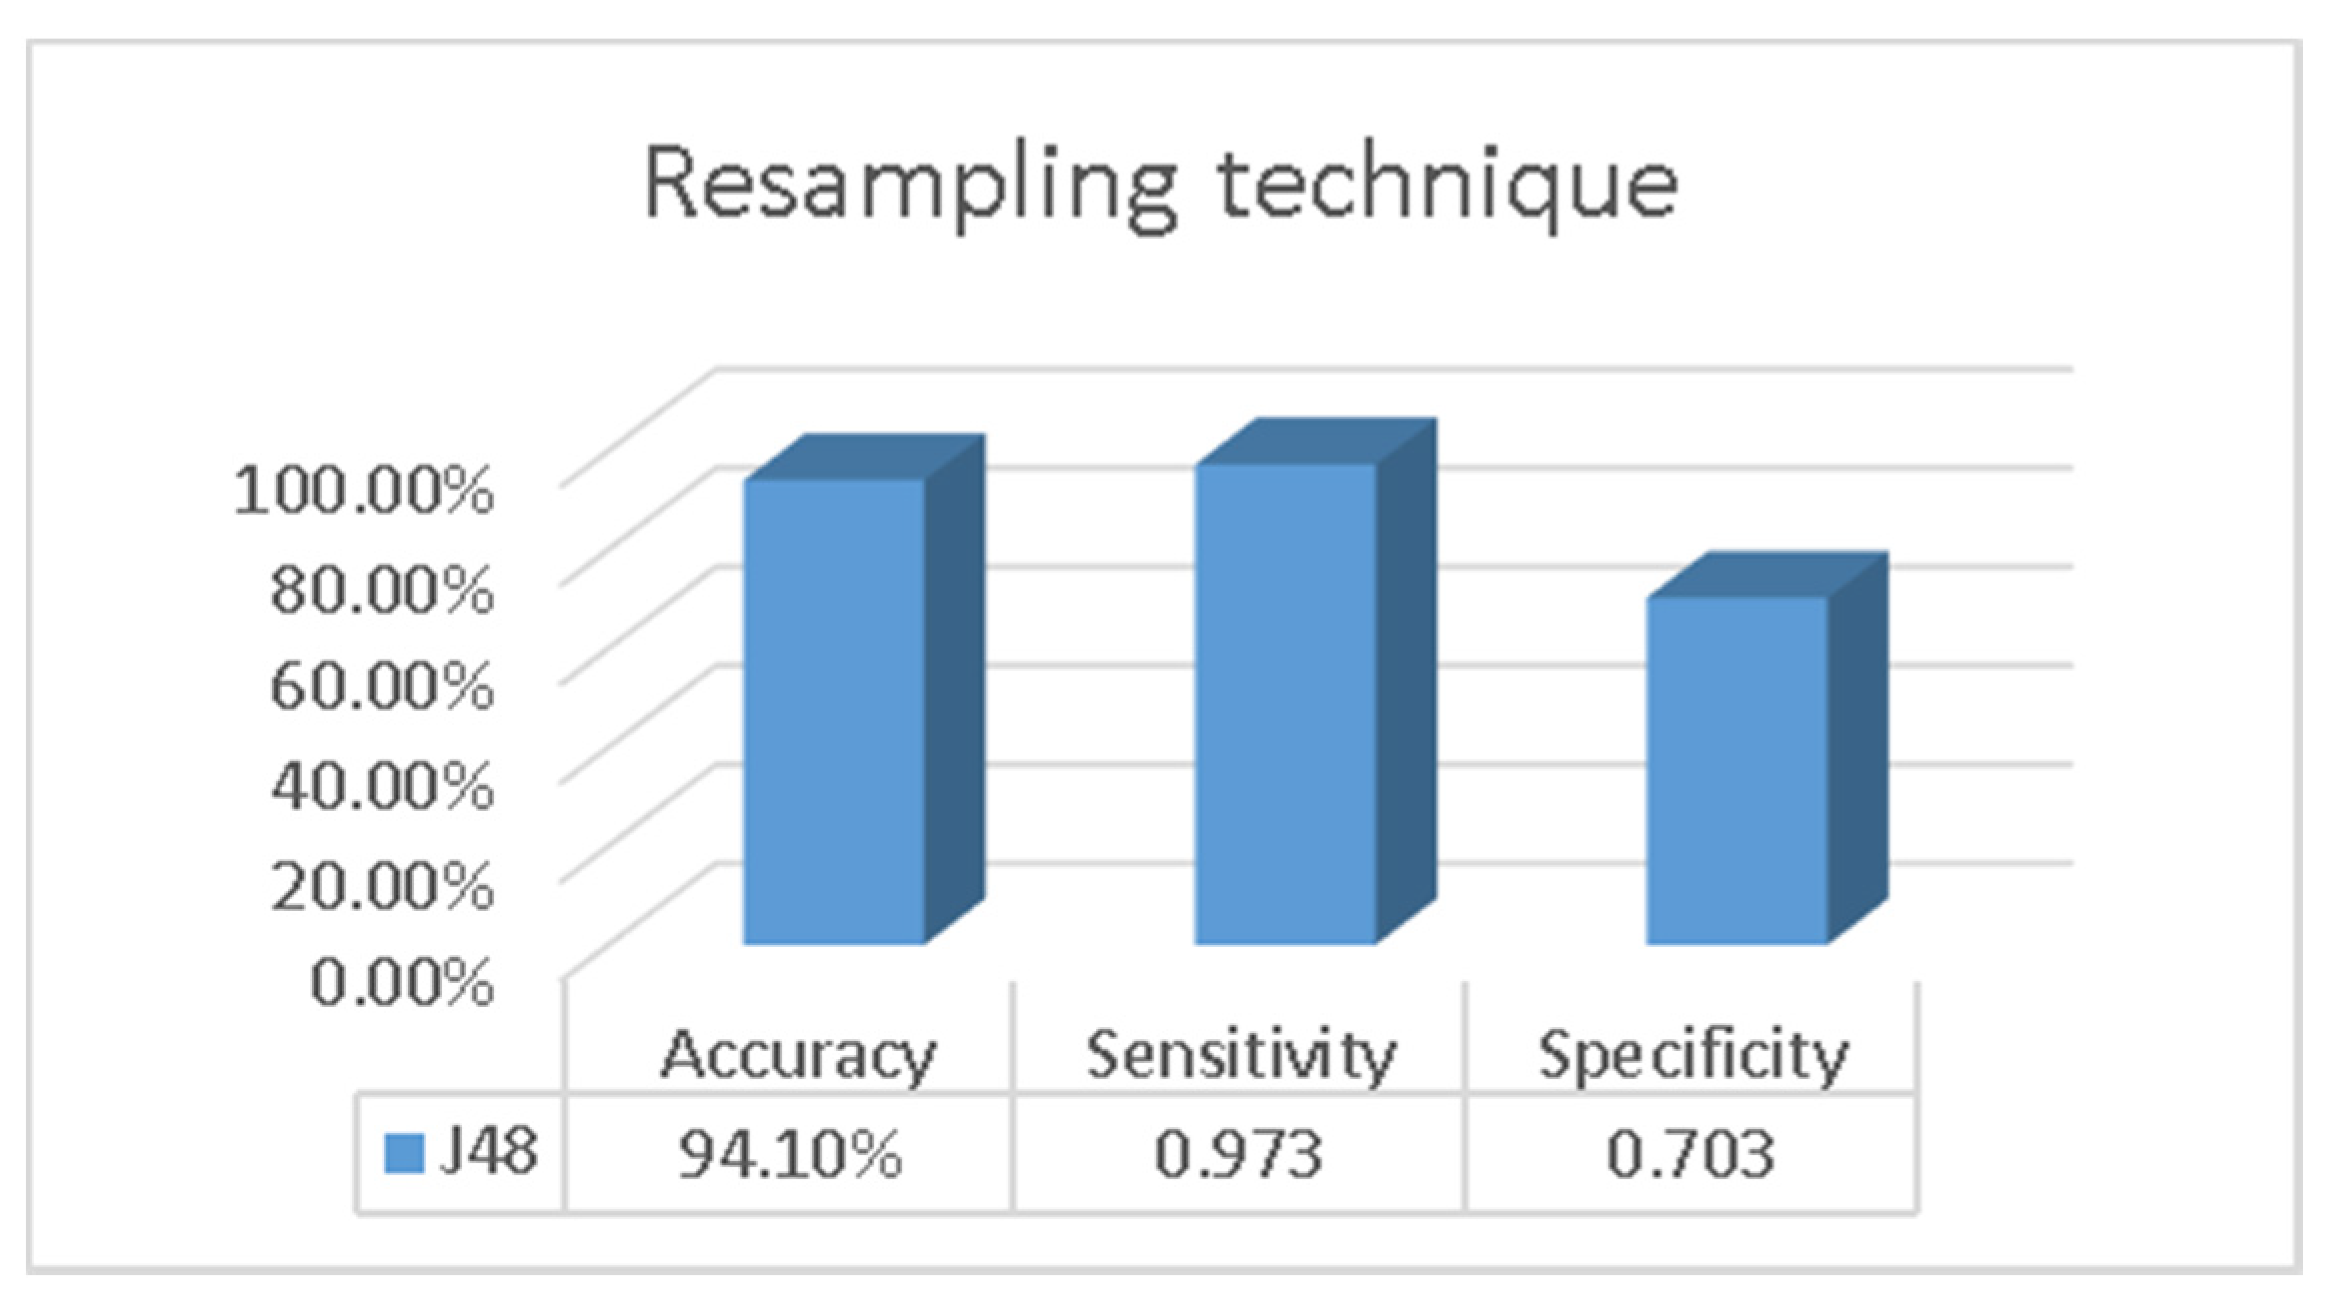
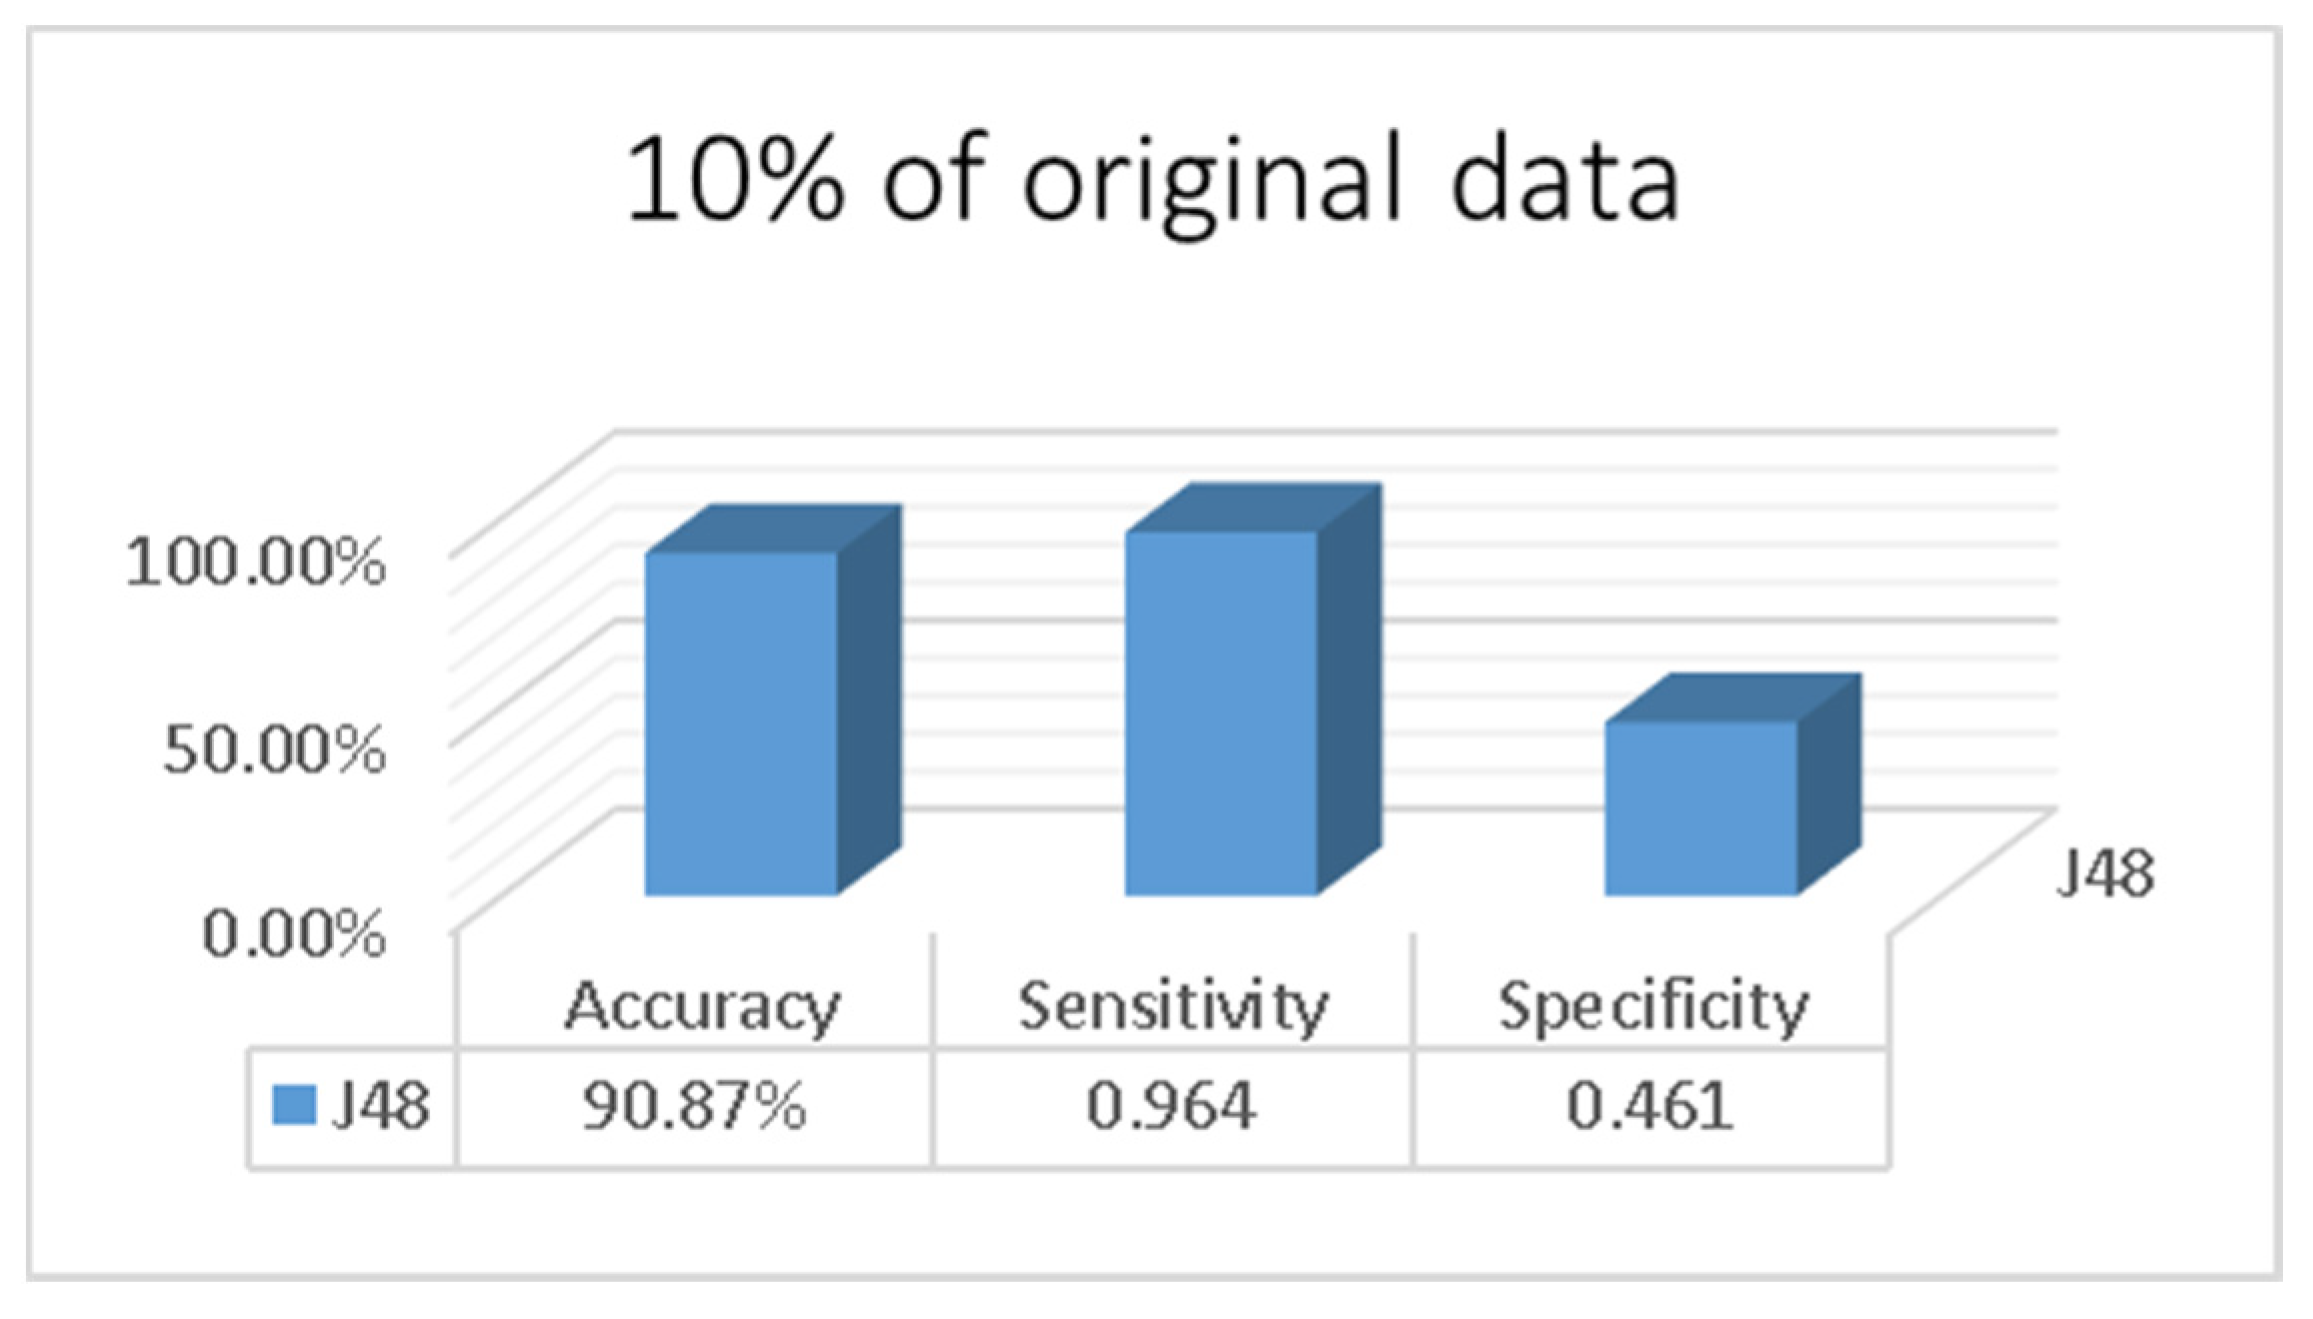
3. Results
4. Discussion
5. Conclusions
- This paper was limited to the telemarketing case—in the future, we aim to assess our approach on other marketing cases and datasets, such as direct marketing through email or instant messaging.
- While we have shown that resampling and feature selection improved the J48 algorithm beyond the results achieved by previous studies, we still do not have evidence if such an approach (resampling plus feature selection) would significantly improve other algorithms such as those based on neural networks, perhaps with results that are better than those from the J48 overall.
Author Contributions
Funding
Institutional Review Board Statement
Informed Consent Statement
Data Availability Statement
Conflicts of Interest
References
- Chen, S.Y.; Liu, X. The contribution of data mining to information science. J. Inf. Sci. 2004, 30, 550–558. [Google Scholar] [CrossRef]
- Bahari, T.F.; Elayidom, M.S. An Efficient CRM-Data Mining Framework for the Prediction of Customer Behaviour. Procedia Comput. Sci. 2015, 46, 725–731. [Google Scholar] [CrossRef] [Green Version]
- Ghatasheh, N.; Faris, H.; Altaharwa, I.; Harb, Y.; Harb, A. Business Analytics in Telemarketing: Cost-Sensitive Analysis of Bank Campaigns Using Artificial Neural Networks. Appl. Sci. 2020, 10, 2581. [Google Scholar] [CrossRef] [Green Version]
- Barraza, N.R.; Moro, S.; Ferreyra, M.; De La Peña, A. Mutual information and sensitivity analysis for feature selection in customer targeting: A comparative study. J. Inf. Sci. 2019, 45, 53–67. [Google Scholar] [CrossRef]
- Moro, S.; Cortez, P.; Rita, P. A data-driven approach to predict the success of bank telemarketing. Decis. Support Syst. 2014, 62, 22–31. [Google Scholar] [CrossRef] [Green Version]
- Silwattananusarn, T.; Kulthidatuamsuk, A.P. Data mining and its applications for knowledge management: A literature review from 2007 to 2012. Int. J. Data Min. Knowl. Manag. Process 2012, 2, 13–24. [Google Scholar] [CrossRef]
- Popelka, O.; Hřebíček, J.; Štencl, M.; Hodinka, M. Comparison of different non-statistical classification methods. In Proceedings of the 30th International Conference Mathematical Methods in Economics, Karviná, Czech Republic, 11–13 September 2012; pp. 727–732. [Google Scholar]
- Wisaeng, K. A Comparison of Different Classification Techniques for Bank Direct Marketing. Int. J. Soft Comput. Eng. (IJSCE) 2013, 3, 116–119. [Google Scholar]
- Yuksel, A.S.; Senel, F.A.; Cankaya, I.A. Classification of Soft Keyboard Typing Behaviors Using Mobile Device Sensors with Machine Learning. Arab. J. Sci. Eng. 2019, 44, 3929–3942. [Google Scholar] [CrossRef]
- Vajiramedhin, C.; Suebsing, A. Feature selection with data balancing for prediction of bank telemarketing. Appl. Math. Sci. 2014, 8, 5667–5672. [Google Scholar] [CrossRef]
- Moro, S.; Cortez, P.; Rita, P.; Lichman, M. UCI Machine Learning Repository. Irvine, CA: University of California, School of Information and Computer Science. 2013. Available online: http//archive.ics.uci.edu/ml (accessed on 18 September 2021).
- Mitik, M.; Korkmaz, O.; Karagoz, P.; Toroslu, I.H.; Yucel, F. Data Mining Approach for Direct Marketing of Banking Products with Profit/Cost Analysis. Rev. Socionetwork Strat. 2017, 11, 17–31. [Google Scholar] [CrossRef]
- Lahmiri, S. A two-step system for direct bank telemarketing outcome classification. Intell. Syst. Account. Financ. Manag. 2017, 24, 49–55. [Google Scholar] [CrossRef]
- Moro, S.; Laureano, R.; Cortez, P. Using Data Mining for Bank Direct Marketing: An Application of the CRISP-DM Methodology. 2011, pp. 117–121. Available online: http://hdl.handle.net/1822/14838 (accessed on 18 September 2021).
- Ruangthong, P.; Jaiyen, S. Bank Direct Marketing Analysis of Asymmetric Information Based on Machine Learning. In Proceedings of the 2015 12th International Joint Conference on Computer Science and Software Engineering (JCSSE), Songkhla, Thailand, 22–24 July 2015; pp. 93–96. [Google Scholar]
- Liu, Z.-Z.; Wang, Y.; Huang, P.-Q. AnD: A many-objective evolutionary algorithm with angle-based selection and shift-based density estimation. Inf. Sci. 2020, 509, 400–419. [Google Scholar] [CrossRef] [Green Version]
- Pasha, J.; Dulebenets, M.A.; Kavoosi, M.; Abioye, O.F.; Wang, H.; Guo, W. An Optimization Model and Solution Algorithms for the Vehicle Routing Problem with a “Factory-in-a-Box”. IEEE Access 2020, 8, 134743–134763. [Google Scholar] [CrossRef]
- D’Angelo, G.; Pilla, R.; Tascini, C.; Rampone, S. A proposal for distinguishing between bacterial and viral meningitis using genetic programming and decision trees. Soft Comput. 2019, 23, 11775–11791. [Google Scholar] [CrossRef]
- Panda, N.; Majhi, S.K. How effective is the salp swarm algorithm in data classification. In Computational Intelligence in Pattern Recognition; Springer: Singapore, 2020; pp. 579–588. [Google Scholar]
- Zhao, C.; Zhang, H. An online-learning-based evolutionary many-objective algorithm. Inf. Sci. 2020, 509, 1–21. [Google Scholar] [CrossRef]
- Dulebenets, M.A. An Adaptive Polyploid Memetic Algorithm for scheduling trucks at a cross-docking terminal. Inf. Sci. 2021, 565, 390–421. [Google Scholar] [CrossRef]
- Cortez, P.; Embrechts, M.J. Using sensitivity analysis and visualization techniques to open black box data mining models. Inf. Sci. 2013, 225, 1–17. [Google Scholar] [CrossRef] [Green Version]
- Salas-Zárate, M.D.P.; López-López, E.; Valencia-García, R.; Aussenac-Gilles, N.; Almela, A.; Alor-Hernández, G. A study on LIWC categories for opinion mining in Spanish reviews. J. Inf. Sci. 2014, 40, 749–760. [Google Scholar] [CrossRef] [Green Version]
- Ngai, E.W.; Xiu, L.; Chau, D. Application of data mining techniques in customer relationship management: A literature review and classification. Expert Syst. Appl. 2009, 36, 2592–2602. [Google Scholar] [CrossRef]
- Rajput, A.; Aharwal, R.P.; Dubey, M.; Saxena, S.; Raghuvanshi, M. J48 and JRIP Rules for E-Governance Data. Int. J. Comput. Sci. Secur. (IJCSS) 2011, 5, 201–207. [Google Scholar]
- Huang, M.; Chiu, C.; Tsai, C.; Lin, W. Applied Sciences on Combining Feature Selection and Over-Sampling Techniques for Breast Cancer Prediction. Bus. Inf. Rev. 2017, 34. [Google Scholar] [CrossRef]
- Parlak, B.; Uysal, A. The effects of globalisation techniques on feature selection for text classification. J. Inf. Sci. 2020. [Google Scholar] [CrossRef]
- Chetty, N.; Vaisla, K.S.; Sudarsan, S.D. Role of attributes selection in classification of Chronic Kidney Disease patients. In Proceedings of the 2015 International Conference on Computing, Communication and Security (ICCCS), Pointe aux Piments, Mauritius, 4–5 December 2015; pp. 1–6. [Google Scholar] [CrossRef]
- Phyu, T.Z.; Oo, N.N. Performance Comparison of Feature Selection Methods. In MATEC Web of Conferences; EDP Sciences: Ulis, France, 2016; Volume 42, p. 06002. [Google Scholar]
- Santra, A.K.; Christy, C.J. Genetic Algorithm and Confusion Matrix for Document Clustering. Int. J. Comput. Sci. 2012, 9, 322–328. [Google Scholar]
- Karahoca, A. Accuracy, Sensitivity and Specificity Measurement of Various Classification Techniques on Healthcare Data. IOSR J. Comput. Eng. 2013, 11, 70–73. [Google Scholar]
- Meyers, J.E.; Mauldin, T.A.; Lewis, J.K.; Meeks, C.B. High school students’ knowledge of telemarketing fraud tactics in the U.S.A. J. Consum. Stud. Home Econ. 1995, 19, 205–218. [Google Scholar] [CrossRef]
- Pan, Y.; Tang, Z. Ensemble methods in bank direct marketing. In Proceedings of the 2014 11th International Conference on Service Systems and Service Management (ICSSSM), Beijing, China, 25–27 June 2014; pp. 1–5. [Google Scholar] [CrossRef]
- Safara, F.; Doraisamy, S.; Azman, A.; Jantan, A.; Ramaiah, A.R.A. Multi-level basis selection of wavelet packet decomposition tree for heart sound classification. Comput. Biol. Med. 2013, 43, 1407–1414. [Google Scholar] [CrossRef] [PubMed]
- Safarkhani, Fereshteh and Safara, Fatemeh, 1395, Using Data Mining Techniques to Predict the Success of Bank Telemarketing, Tehran. Available online: https://civilica.com/doc/497019 (accessed on 18 September 2021).
- Karim, M.; Rahman, R.M. Decision Tree and Naïve Bayes Algorithm for Classification and Generation of Actionable Knowledge for Direct Marketing. J. Softw. Eng. Appl. 2013, 6, 196–206. [Google Scholar] [CrossRef] [Green Version]
- Islam, S.; Arifuzzaman, M.; Islam, S. SMOTE Approach for Predicting the Success of Bank Telemarketing. In Proceedings of the 2019 4th Technology Innovation Management and Engineering Science International Conference (TIMES-iCON), Bangkok, Thailand, 11–13 December 2019; pp. 1–5. [Google Scholar] [CrossRef]
- Upadhyay, S.; Sharma, C.; Sharma, P.; Bharadwaj, P.; Seeja, K. Privacy preserving data mining with 3-D rotation transformation. J. King Saud Univ. Comput. Inf. Sci. 2018, 30, 524–530. [Google Scholar] [CrossRef] [Green Version]
- Liu, M.; Yan, Y.; He, Y. A Fuzzy Support Vector Machine Algorithm and Its Application in Telemarketing. In Quantitative Logic and Soft Computing 2016; Springer: Cham, Switzerland, 2017; pp. 671–679. [Google Scholar] [CrossRef]
- Kokkula, S.; Musti, N.M. Classification and outlier detection based on topic based pattern synthesis. In Machine Learning and Data Mining in Pattern Recognition; Springer: Berlin/Heidelberg, Germany, 2013; pp. 99–114. [Google Scholar]


| Number | Dataset Attribute Description | Type | Detail |
|---|---|---|---|
| 1 | Age | Numeric | 18–88 |
| 2 | Job | Categorical | “management” “entrepreneur” “retired” “technician” “student” “blue-collar” “services” “admin.” “self-employed” “unemployed” “housemaid” “unknown” |
| 3 | Marital status | Categorical | “single” “divorced” “married” “unknown” |
| 4 | Education | Categorical | “basic.9y” “high.school” “illiterate“ “basic.6y” “professional.course” “basic.4y” “university.degree” “Unknown” |
| 5 | Default (has credit in default?) | Categorical | “no” “yes” “unknown” |
| 6 | Housing (has housing loan?) | Categorical | “no” “yes” “unknown” |
| 7 | Loan (has personal loan? related with the last contact of the current campaign) | Categorical | “no” “yes” “unknown” |
| 8 | Contact (contact communication type) | Categorical | “telephone” “cellular” |
| 9 | Month (last contact month of year) | Categorical | “Jul”–“Dec”–”Nov”–“Mar” “Aug”–“Oct”–”Apr”–“May” “Sep”–”Jun” |
| 10 | Day of week (last contact day of the week) | Categorical | “Monday” “Tuesday” “Friday” “Thursday” “Wednesday” |
| 11 | Duration (last contact duration, in seconds) | Numeric | 0–3643 |
| 12 | Campaign (number of contacts performed during this campaign and for this client) | Numeric | 42 different ones 1–56 |
| 13 | Pday (number of days that passed by after the client was last contacted from a previous campaign. 999 means client was not previously contacted) | Numeric | 27 different ones 0–999 |
| 14 | Previous | Numeric | 0–7 |
| 15 | Poutcome (outcome of the previous marketing campaign) | Categorical | “failure” “nonexistent” “success” |
| 16 | Employment variation rate (quarterly indicator) | Numeric | −0.2, −2.9, −1.7, −1.8, −3, −0.1, 1.1, −1.1, −3.4, 1.4 |
| 17 | Consumer price index (monthly indicator) | Numeric | 92.201–94.767 |
| 18 | Consumer confidence index (monthly indicator) | Numeric | −26.9, −50.8 |
| 19 | Euribor3m (Euro Interbank Offer Rate 3 month) | Numeric | 0.634–5.045 |
| 20 | Number of employees (quarterly indicator) | Numeric | 4963.65228.1 |
| Output variable | |||
| 21 | Customers term deposit (has the client subscribed a term deposit?) | Categorical | Yes–No |
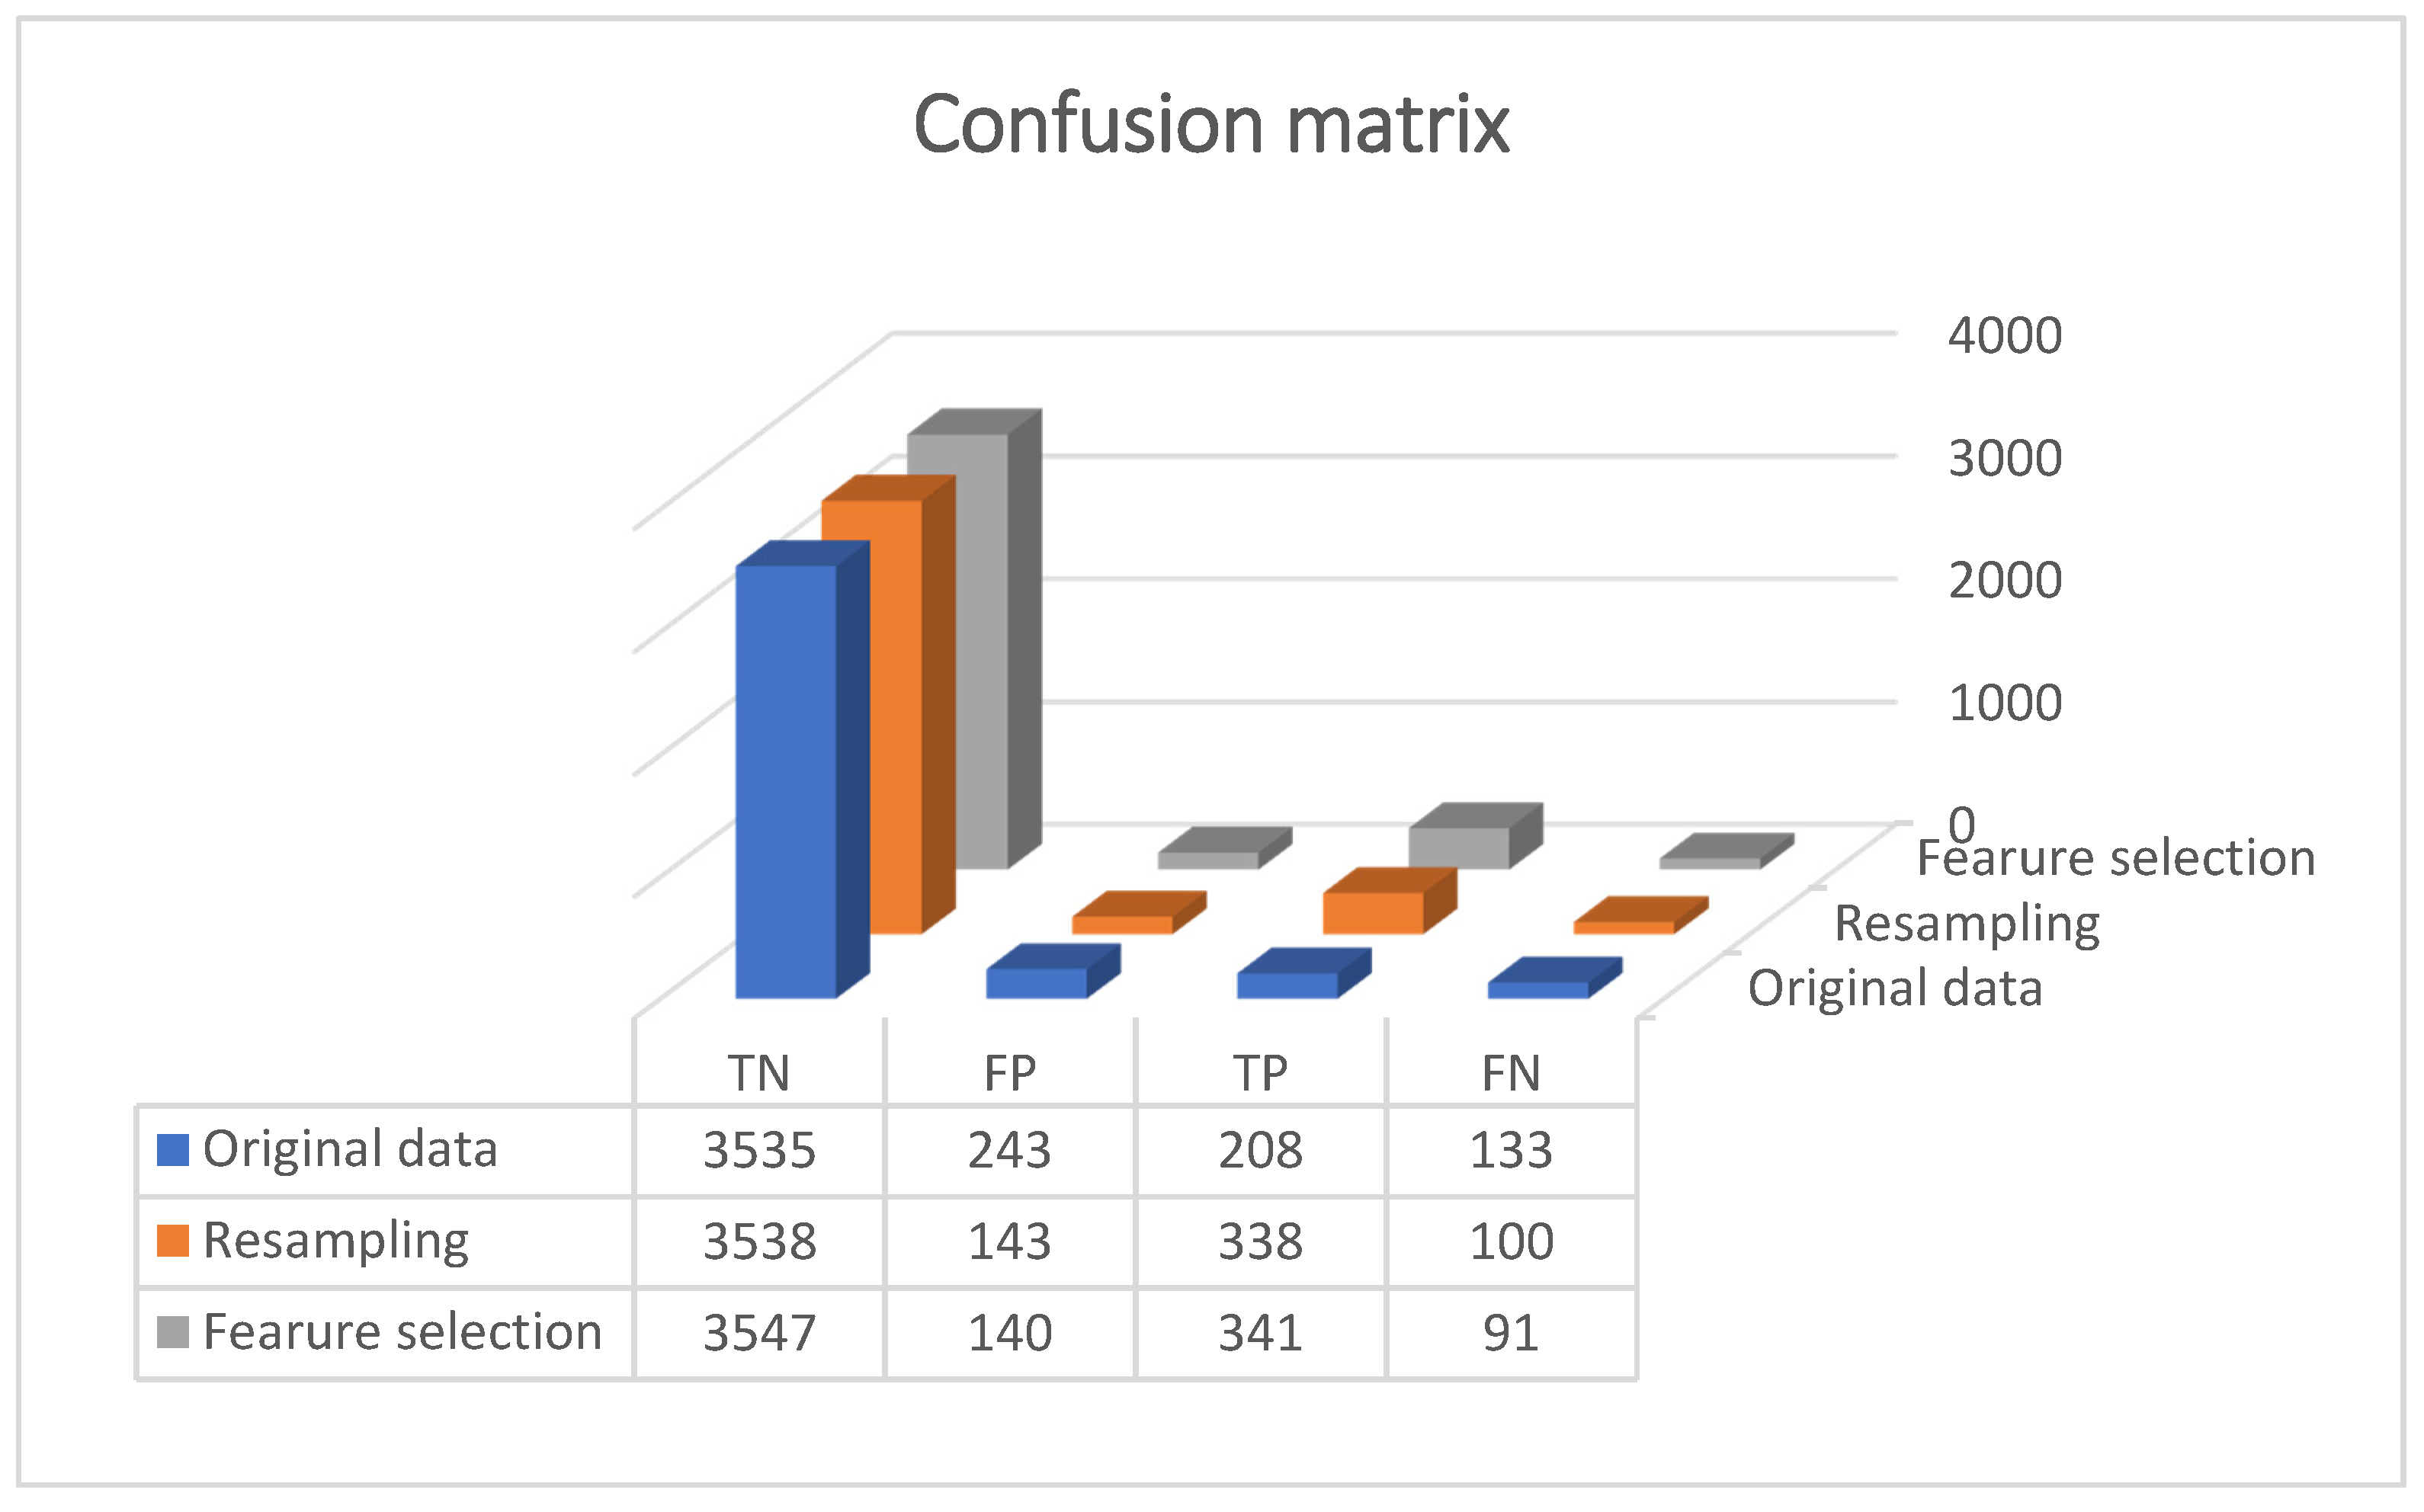
| Classifier | TN | FN | FP | TP |
|---|---|---|---|---|
| J48 | 3535 | 133 | 243 | 208 |
| NB | 3331 | 337 | 273 | 278 |
| LR | 3570 | 98 | 254 | 197 |
| J48 | |
|---|---|
| 1 | Age |
| 2 | Education |
| 3 | Contact |
| 4 | Duration |
| 5 | P days |
| 6 | Previous |
| 7 | P outcome |
| 8 | Emp.Var.Rate |
| 9 | Cons.Price.Idx |
| 10 | Cons.Conf.Idx |
| 11 | Euribor3m |
| 12 | Nr.Employed |
| 13 | Y as output |
| Categories | References | Methods | Algorithm | Best Accuracy |
|---|---|---|---|---|
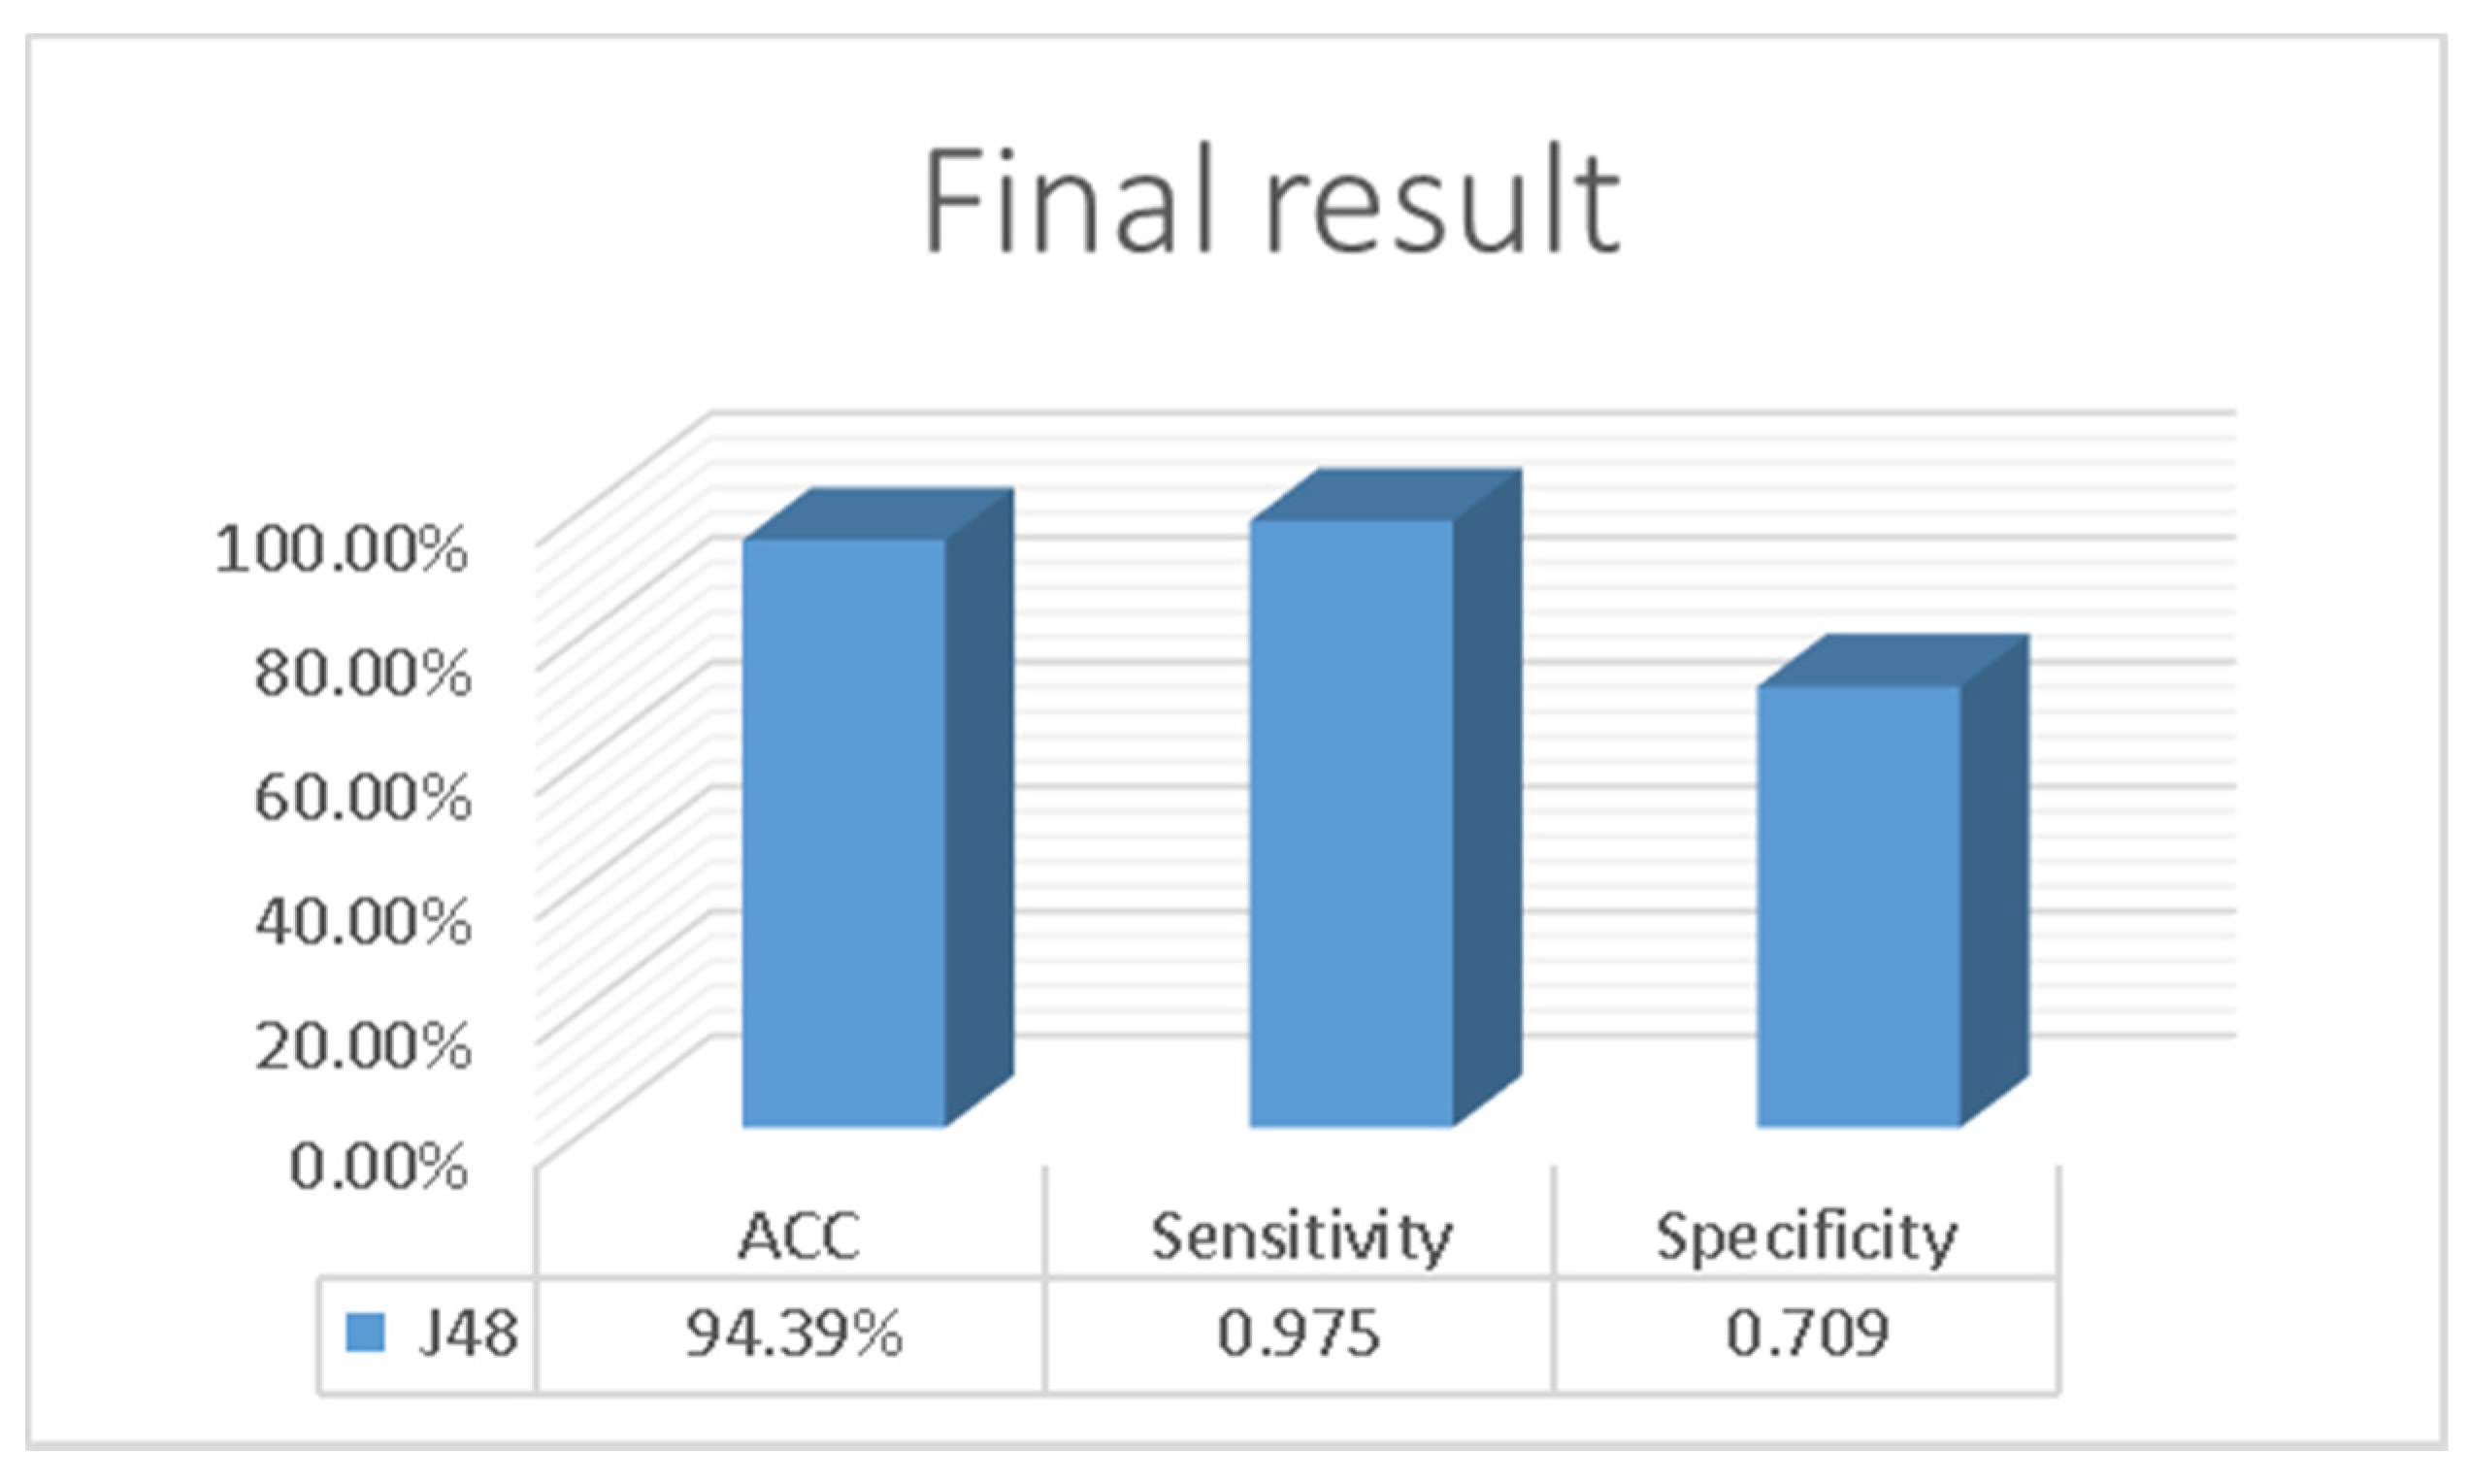
| Bank dataset [11] | Current paper | Resampling and feature selection | J48 | 94.39% |
| [35] | Training and tested | C4.5 | 93.96% | |
| [36] | Compared 5 algorithms | LR | 91.21% | |
| [37] | Data preparation by preprocessing | NB | 88.86%. | |
| [38] | Data partitioning and three-dimensional | J48 | <89% | |
| [39] | Using fuzzy algorithm model | FMLP-SVM | 92.89% | |
| [40] | Using oversampling (SMOT) | J48 | 89.43% |
Publisher’s Note: MDPI stays neutral with regard to jurisdictional claims in published maps and institutional affiliations. |
© 2021 by the authors. Licensee MDPI, Basel, Switzerland. This article is an open access article distributed under the terms and conditions of the Creative Commons Attribution (CC BY) license (https://creativecommons.org/licenses/by/4.0/).
Share and Cite
Safarkhani, F.; Moro, S. Improving the Accuracy of Predicting Bank Depositor’s Behavior Using a Decision Tree. Appl. Sci. 2021, 11, 9016. https://doi.org/10.3390/app11199016
Safarkhani F, Moro S. Improving the Accuracy of Predicting Bank Depositor’s Behavior Using a Decision Tree. Applied Sciences. 2021; 11(19):9016. https://doi.org/10.3390/app11199016
Chicago/Turabian StyleSafarkhani, Fereshteh, and Sérgio Moro. 2021. "Improving the Accuracy of Predicting Bank Depositor’s Behavior Using a Decision Tree" Applied Sciences 11, no. 19: 9016. https://doi.org/10.3390/app11199016
APA StyleSafarkhani, F., & Moro, S. (2021). Improving the Accuracy of Predicting Bank Depositor’s Behavior Using a Decision Tree. Applied Sciences, 11(19), 9016. https://doi.org/10.3390/app11199016