
Review of Advanced Implementation of Doppler Backscattering Method in Globus-M


Abstract
1. Introduction
2. Doppler Backscattering on Globus-M
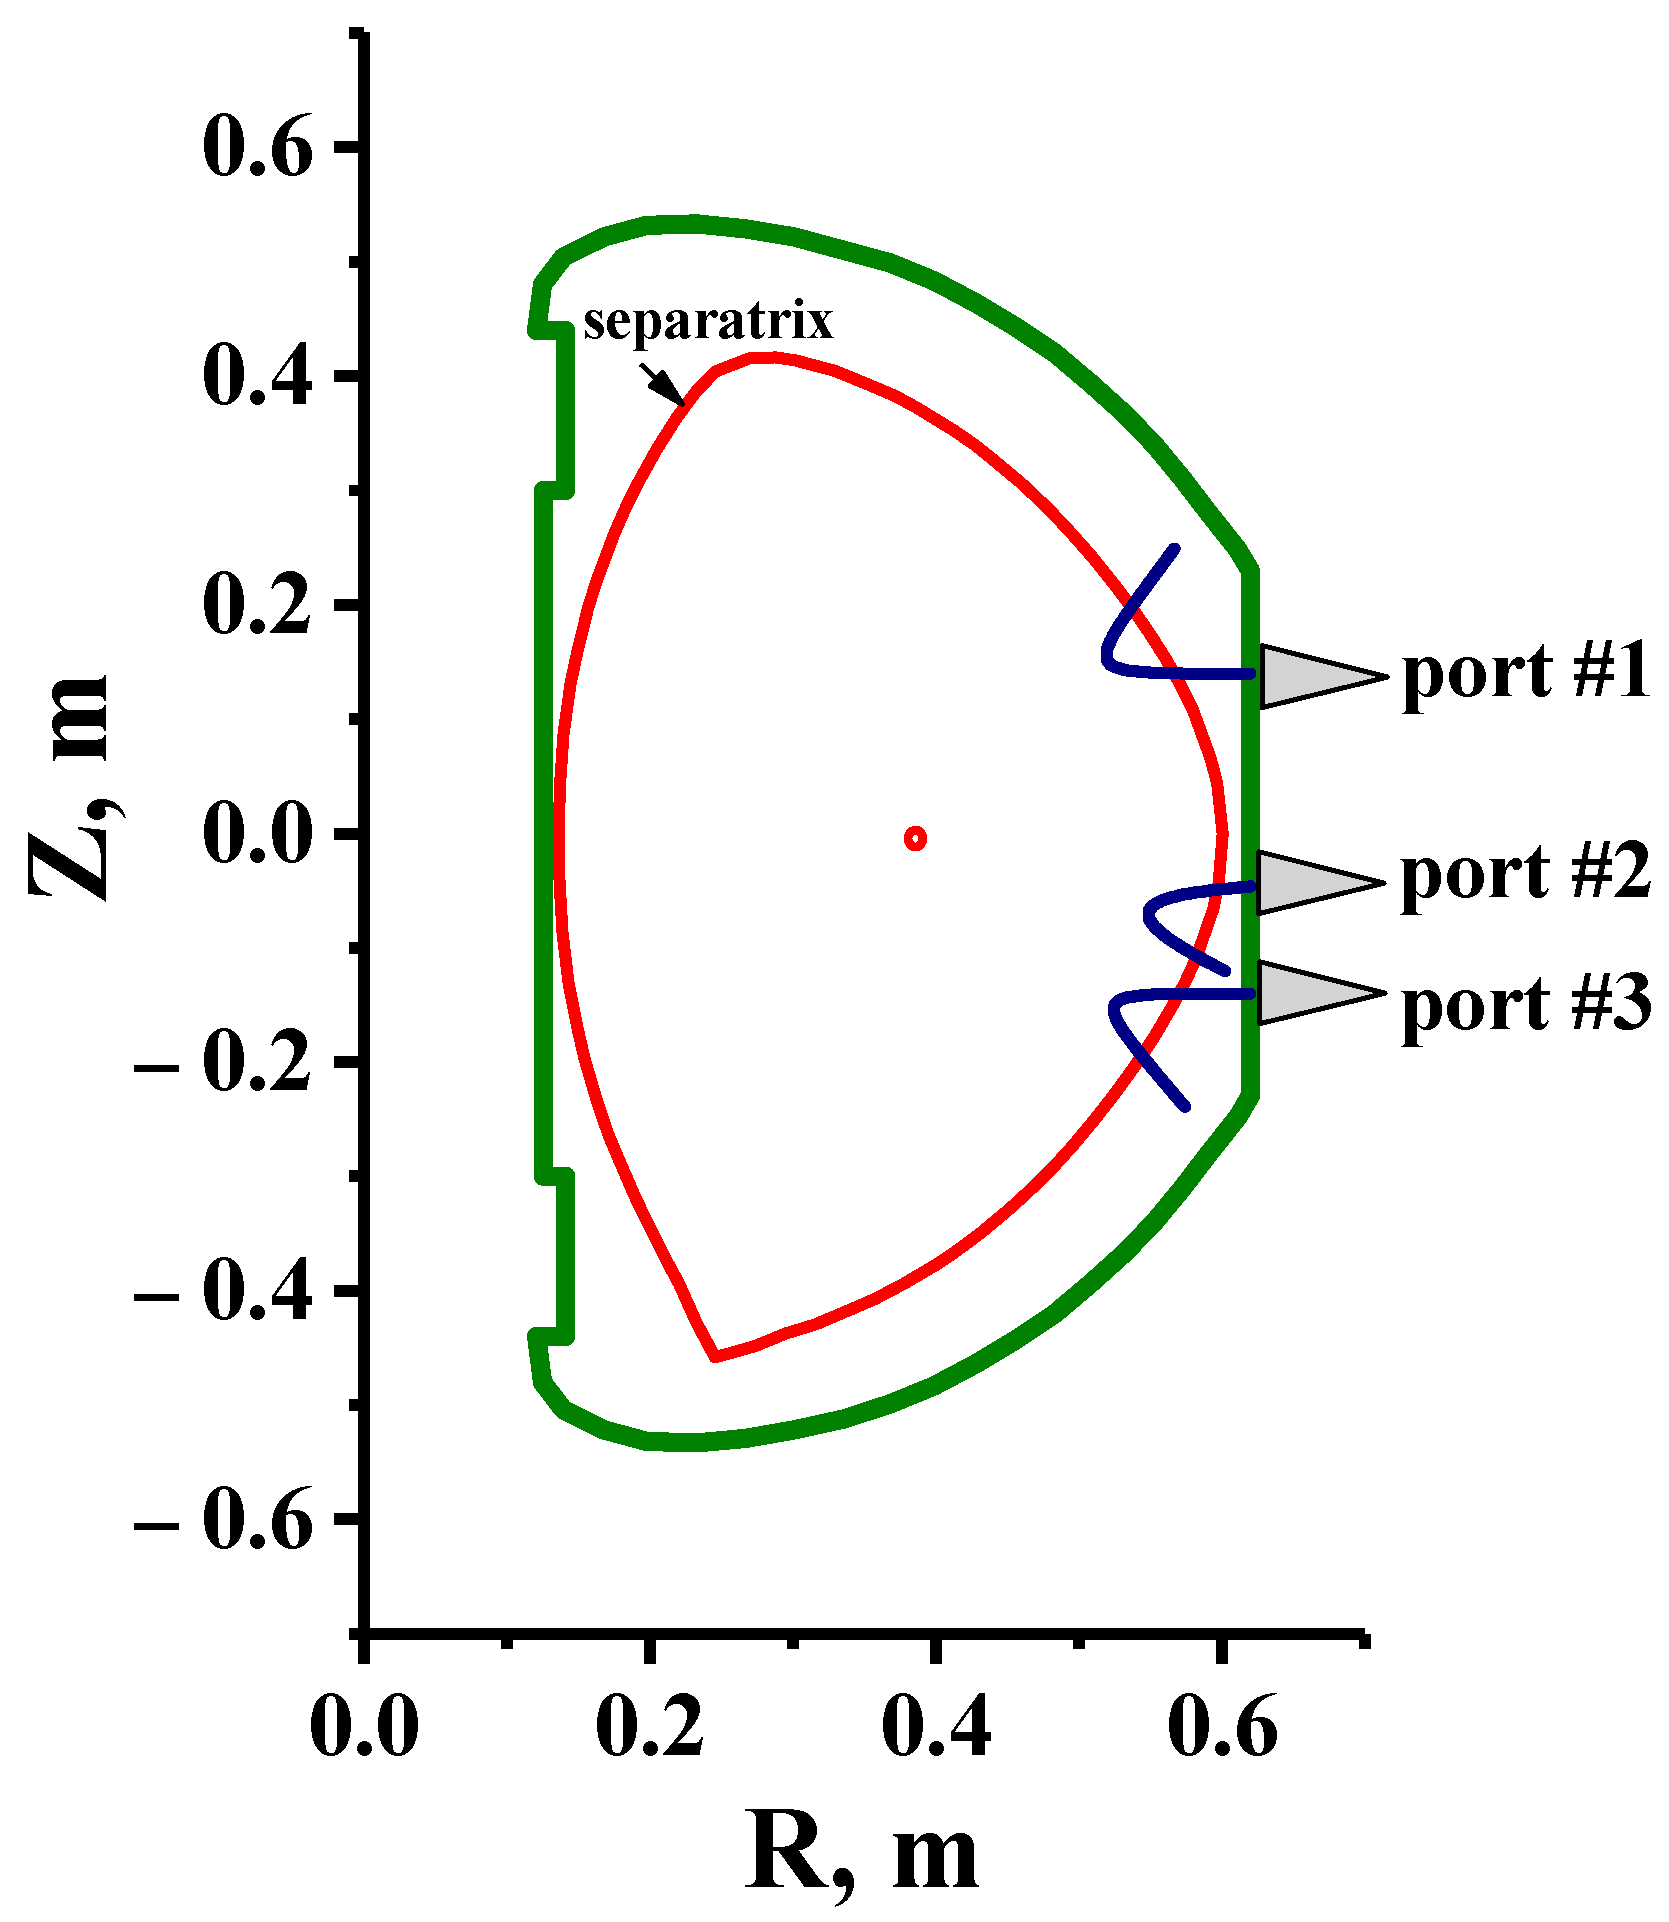
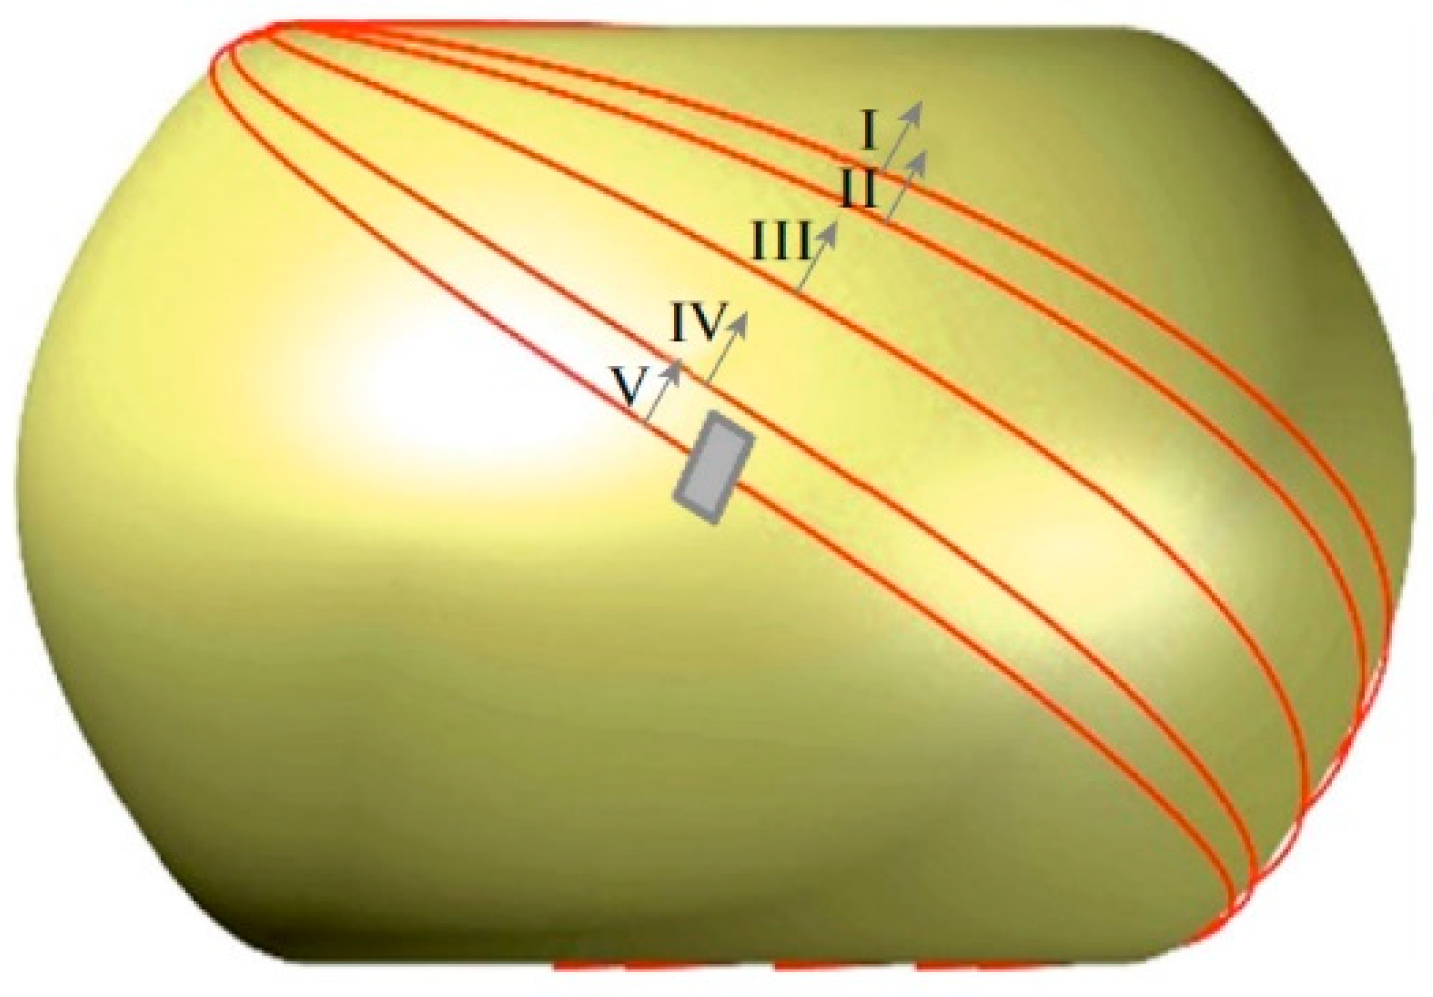
2.1. DBS Systems
2.2. Data Analysis
3. Application Results
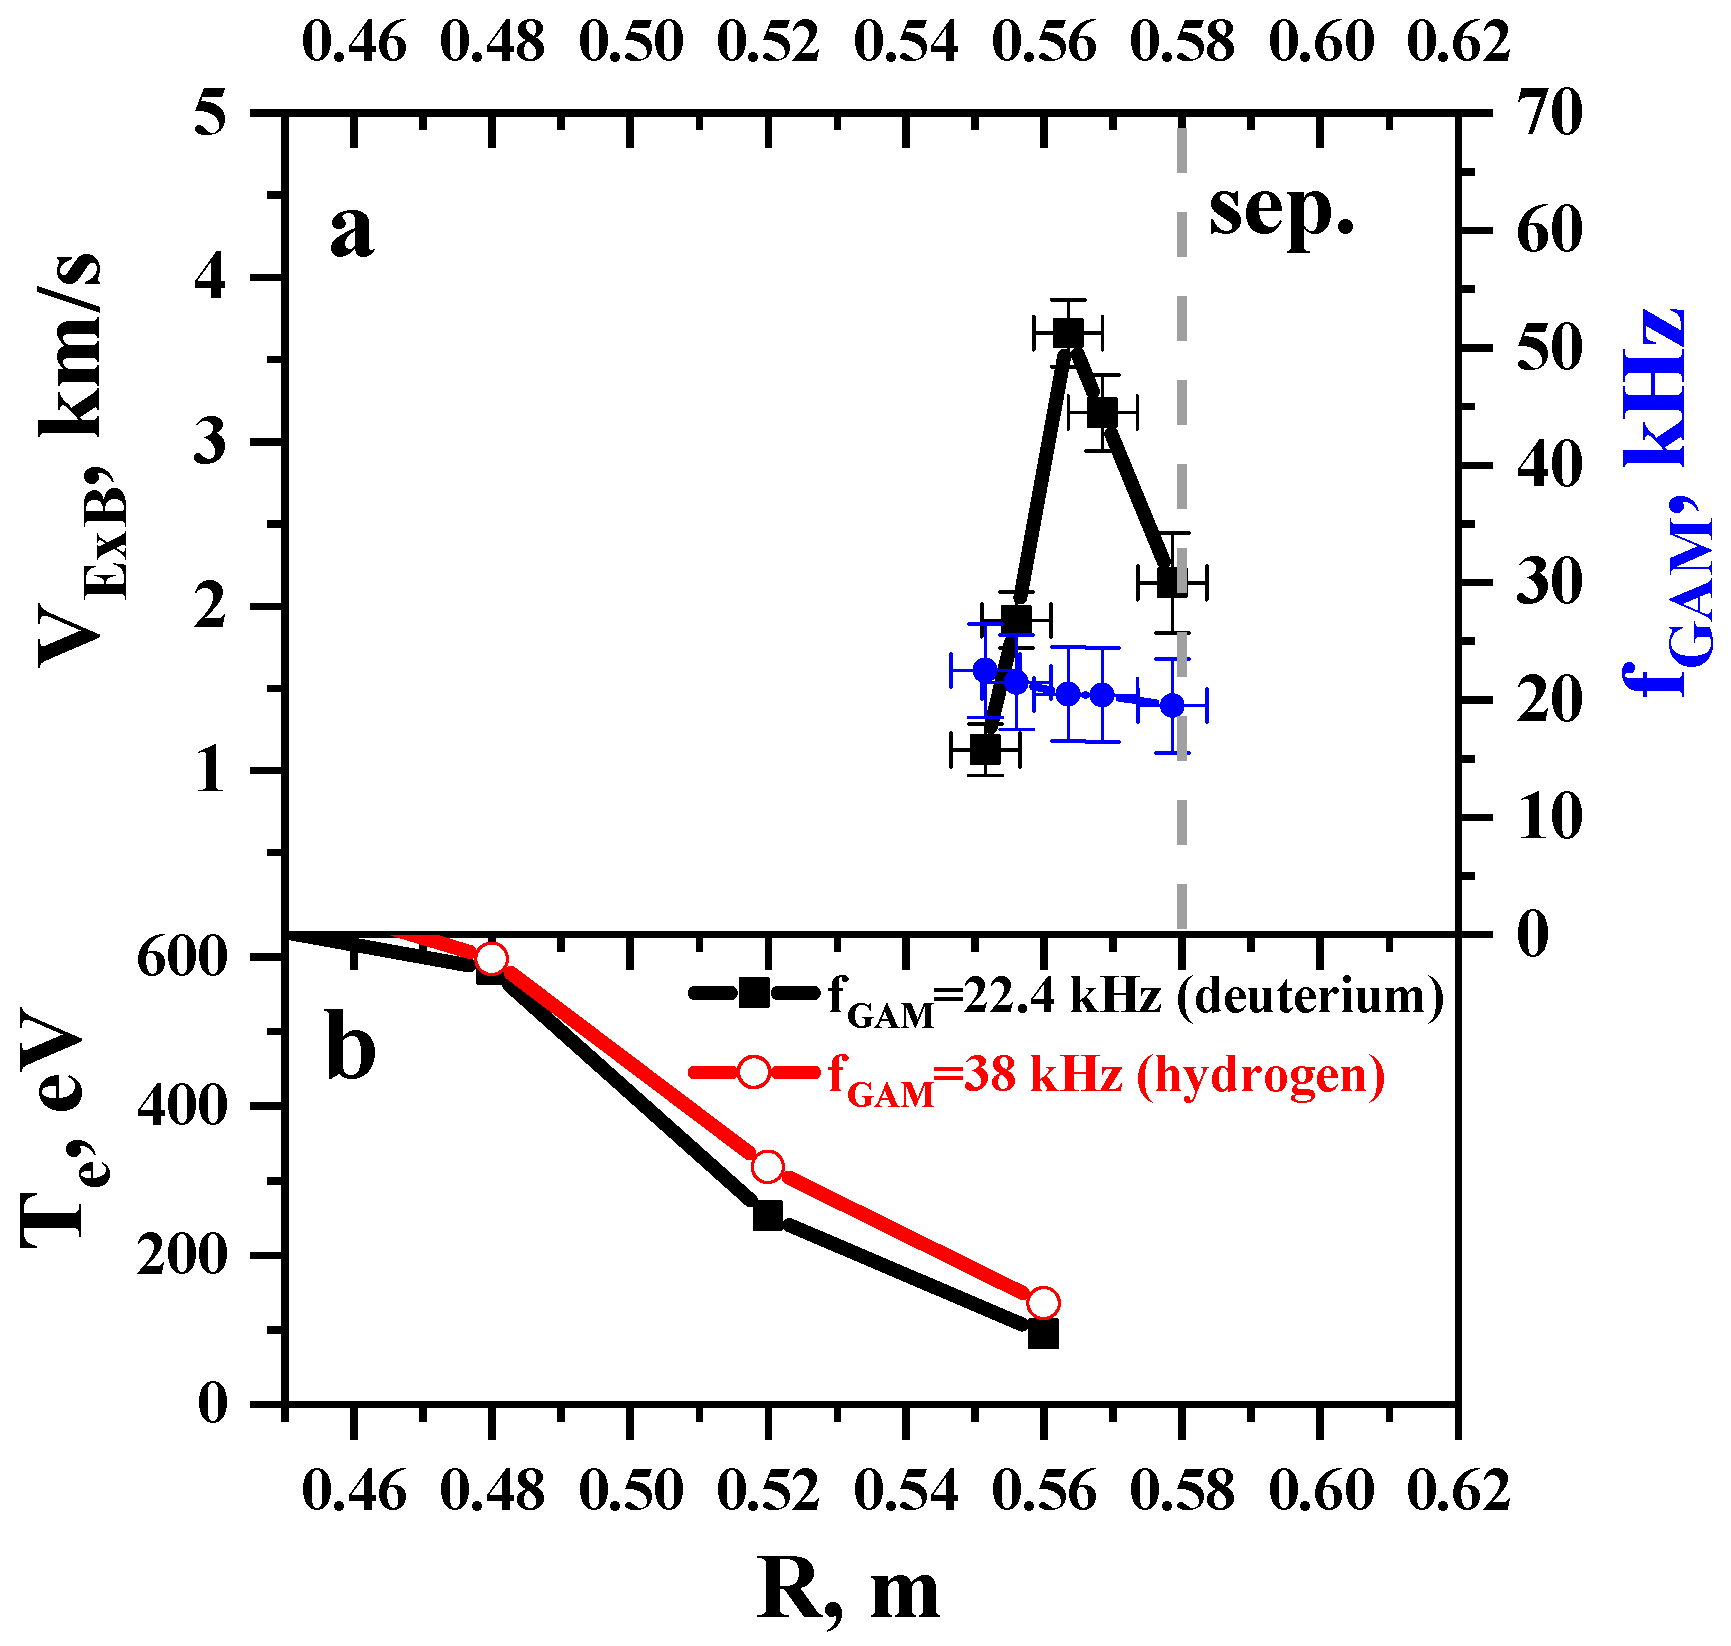
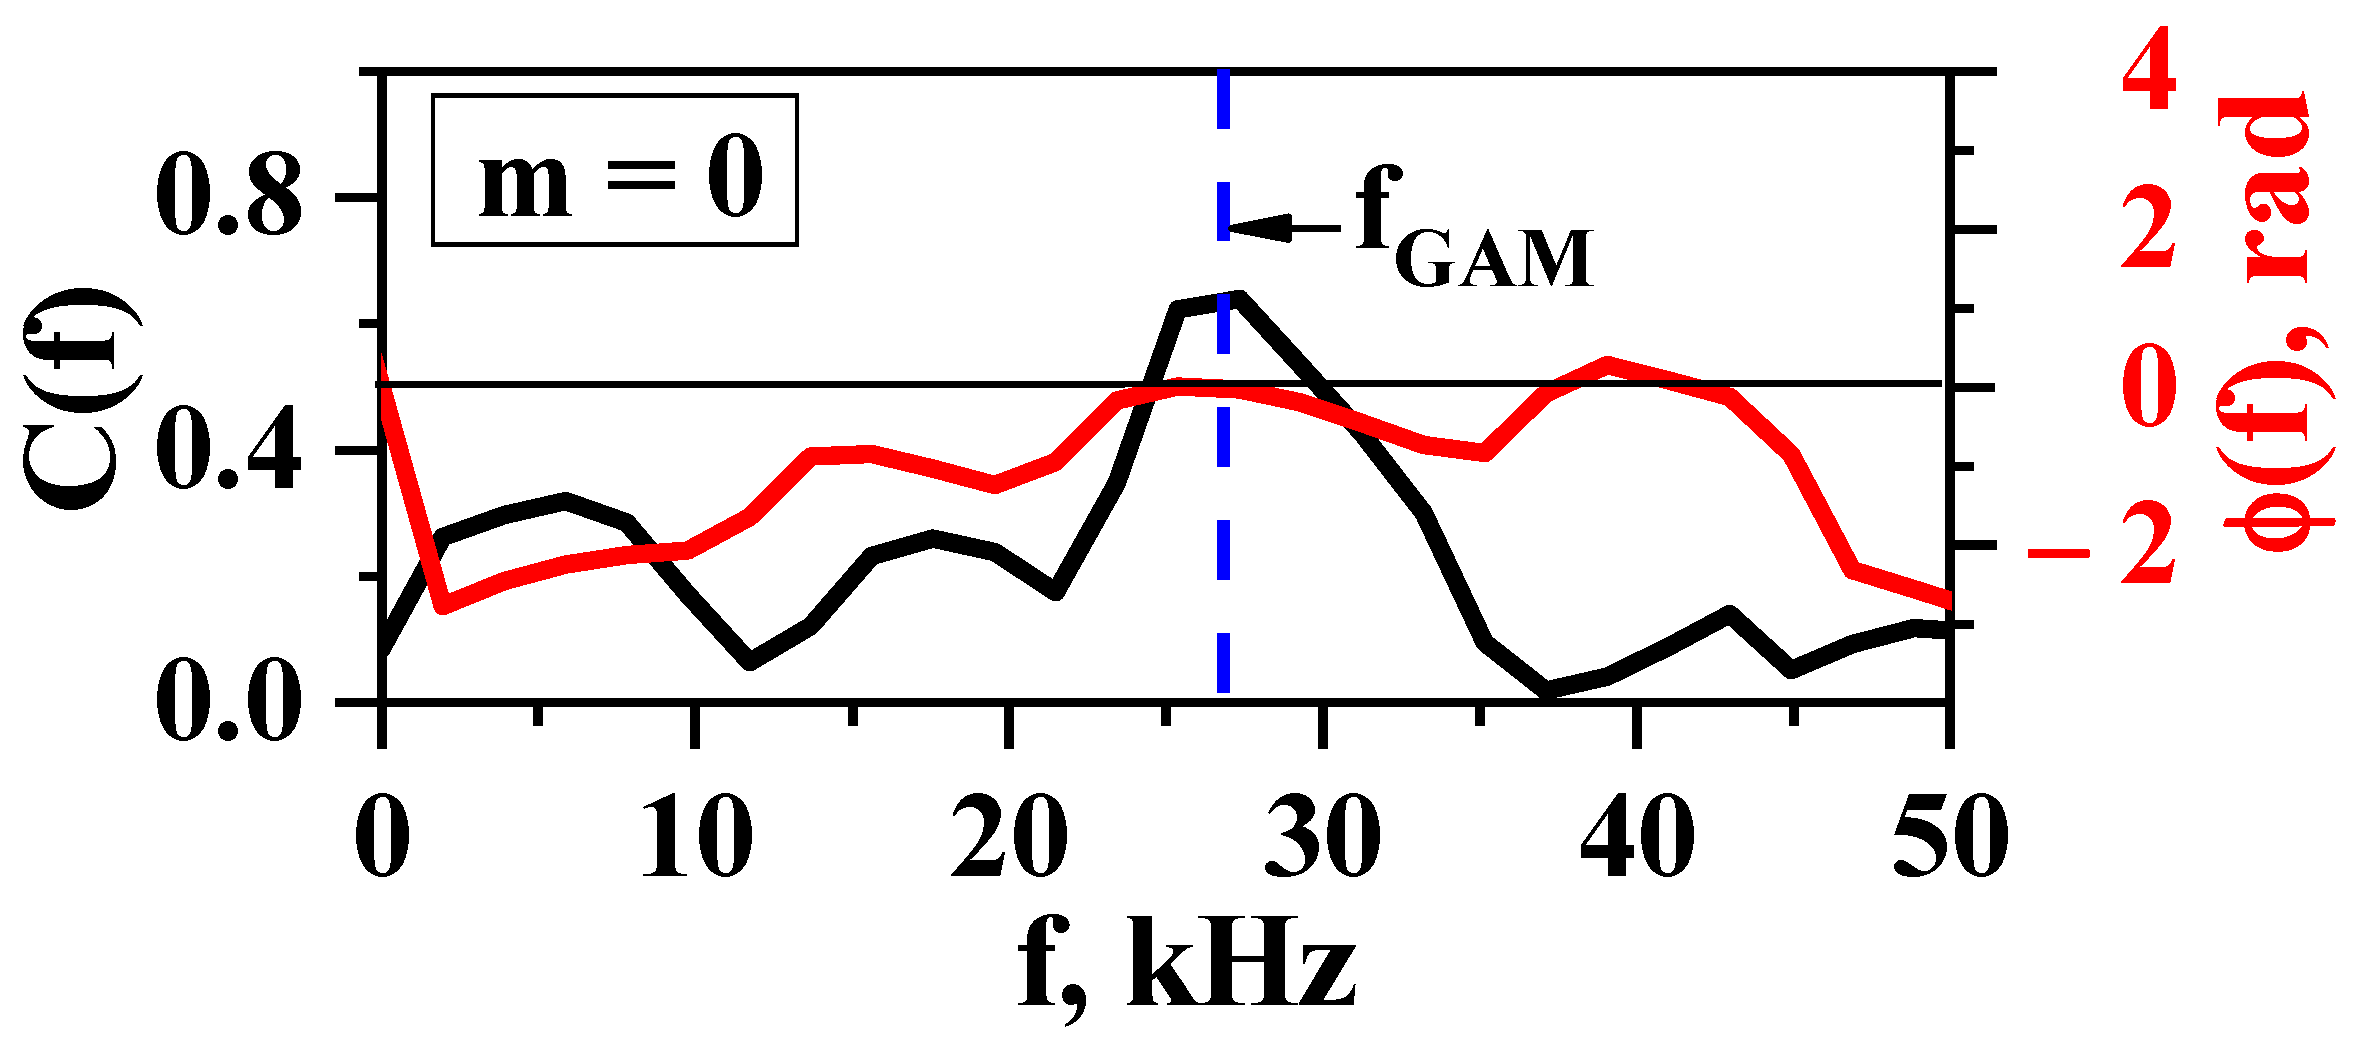
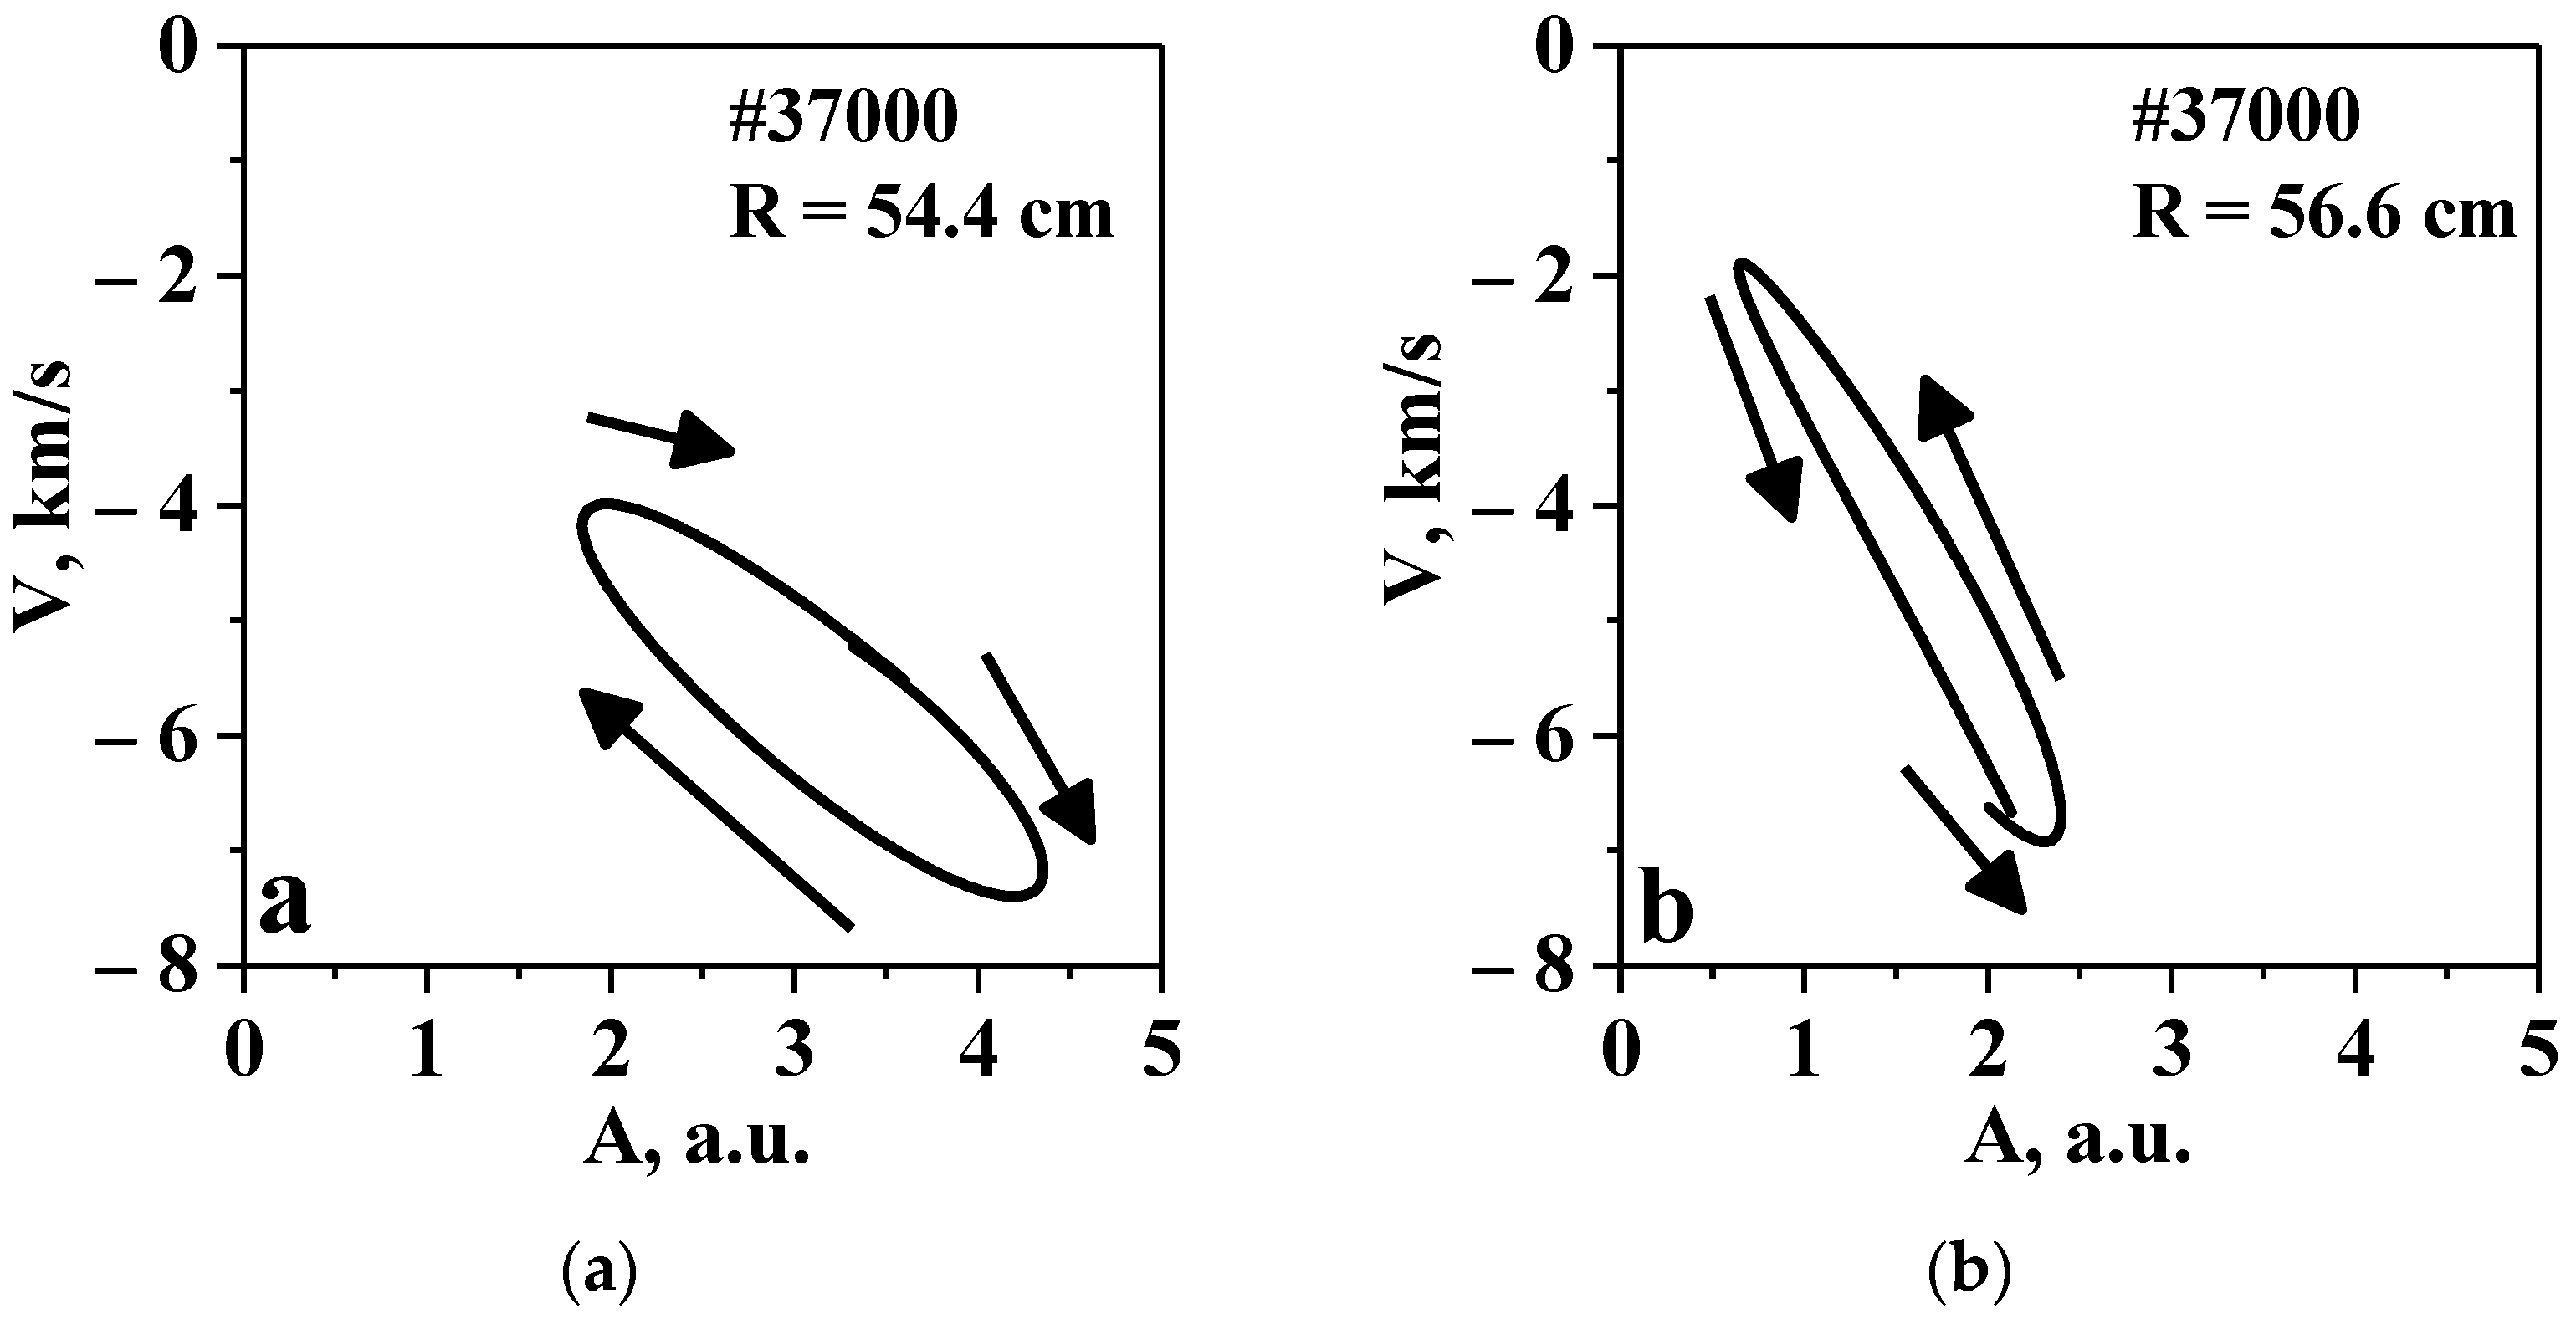
3.1. Geodesic Acoustic Mode

| Investigated Property | Range of Values | Notes |
|---|---|---|
| Mode of operation | Ohmic heating regime | not detected in H-mode |
| f, kHz | 23–28 (D) ~36 (H) | Gao formula, influenced by isotope effect [40] |
| Spectral peak width ∆f, kHz | 2–6 | consistent with the inverse of the GAM burst lifetime |
| Type | burst | Predator-prey model [41] |
| tlifetime, ms | 0.2–0.4 | determined as the time of damping of the velocity autocorrelation function |
| Modulation frequency fmod, Hz | 300 | assumption of relation to the evolution of the ion pressure gradient |
| Amplitude, kV m−1 | up to 3 | exceeds the mean radial electric field |
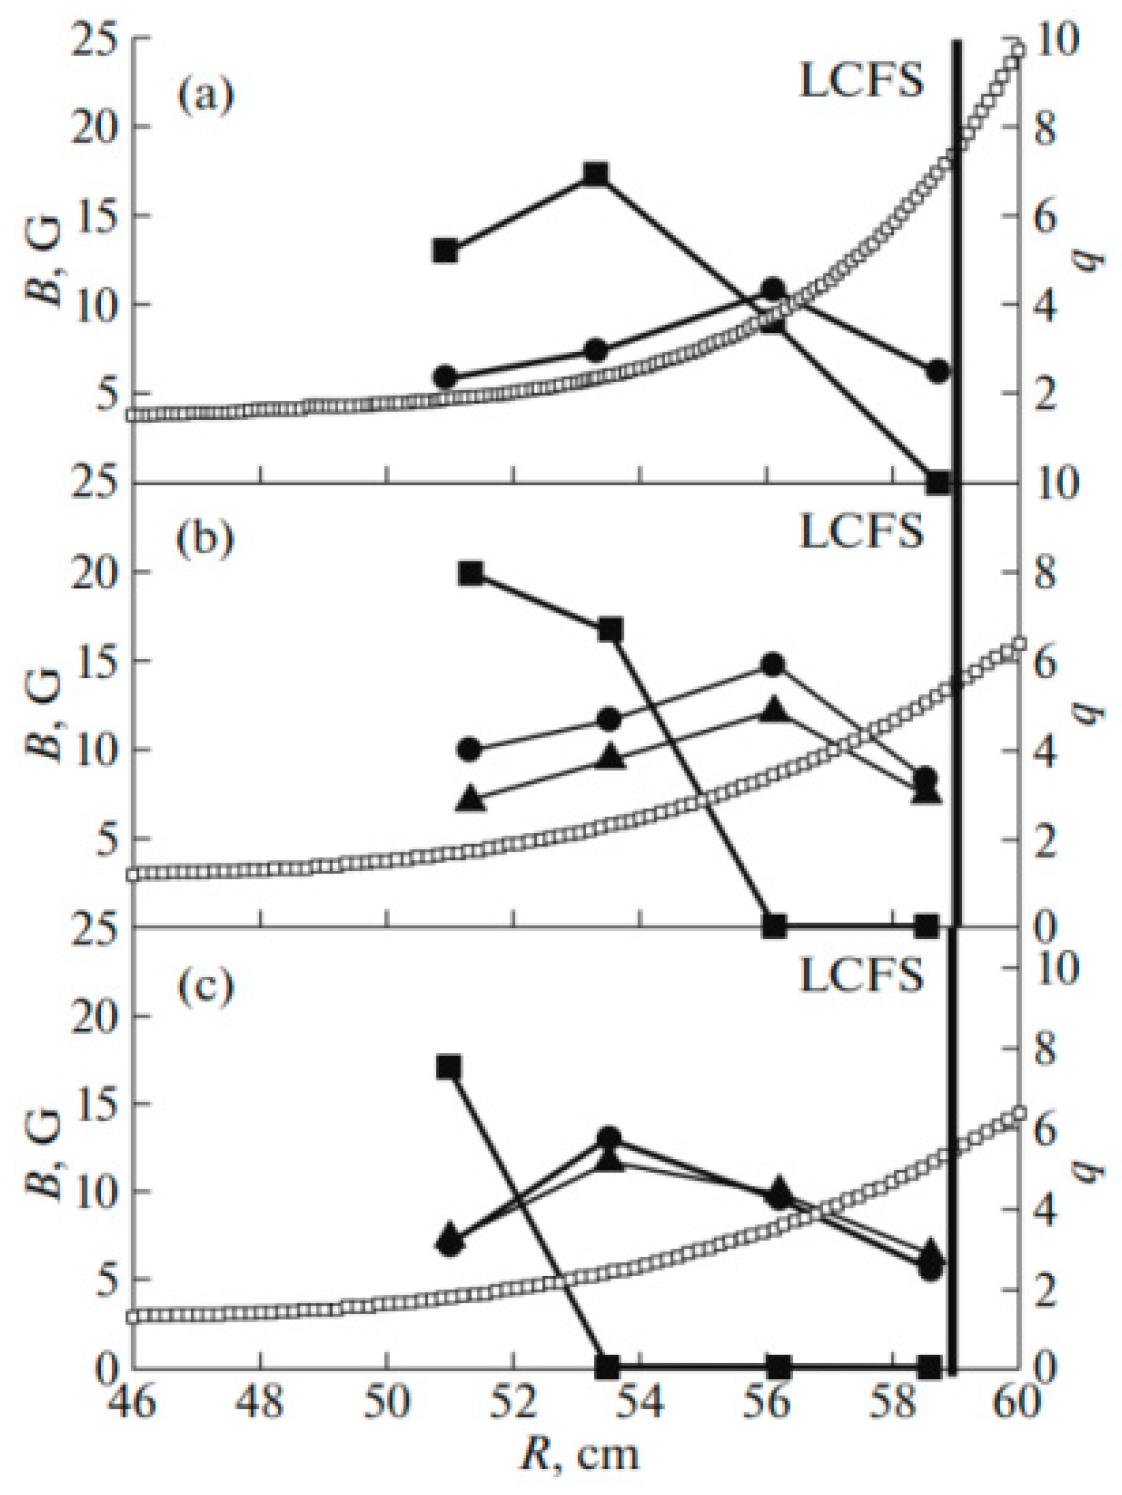
| Location R, m | 0.56 | related to the sharp decrease in the safety factor values followed by Landau damping [41] |
| Location width, cm | 1 | global GAM eigenmode nature [43] |
| Poloidal structure | m = 0 | Linear dynamics of zonal flow modes [41] |
| Non-linear interaction with turbulences | present | the influence of turbulent Reynolds stress on zonal flows or GAMs [41] |
3.2. Limit Cycle Oscillations
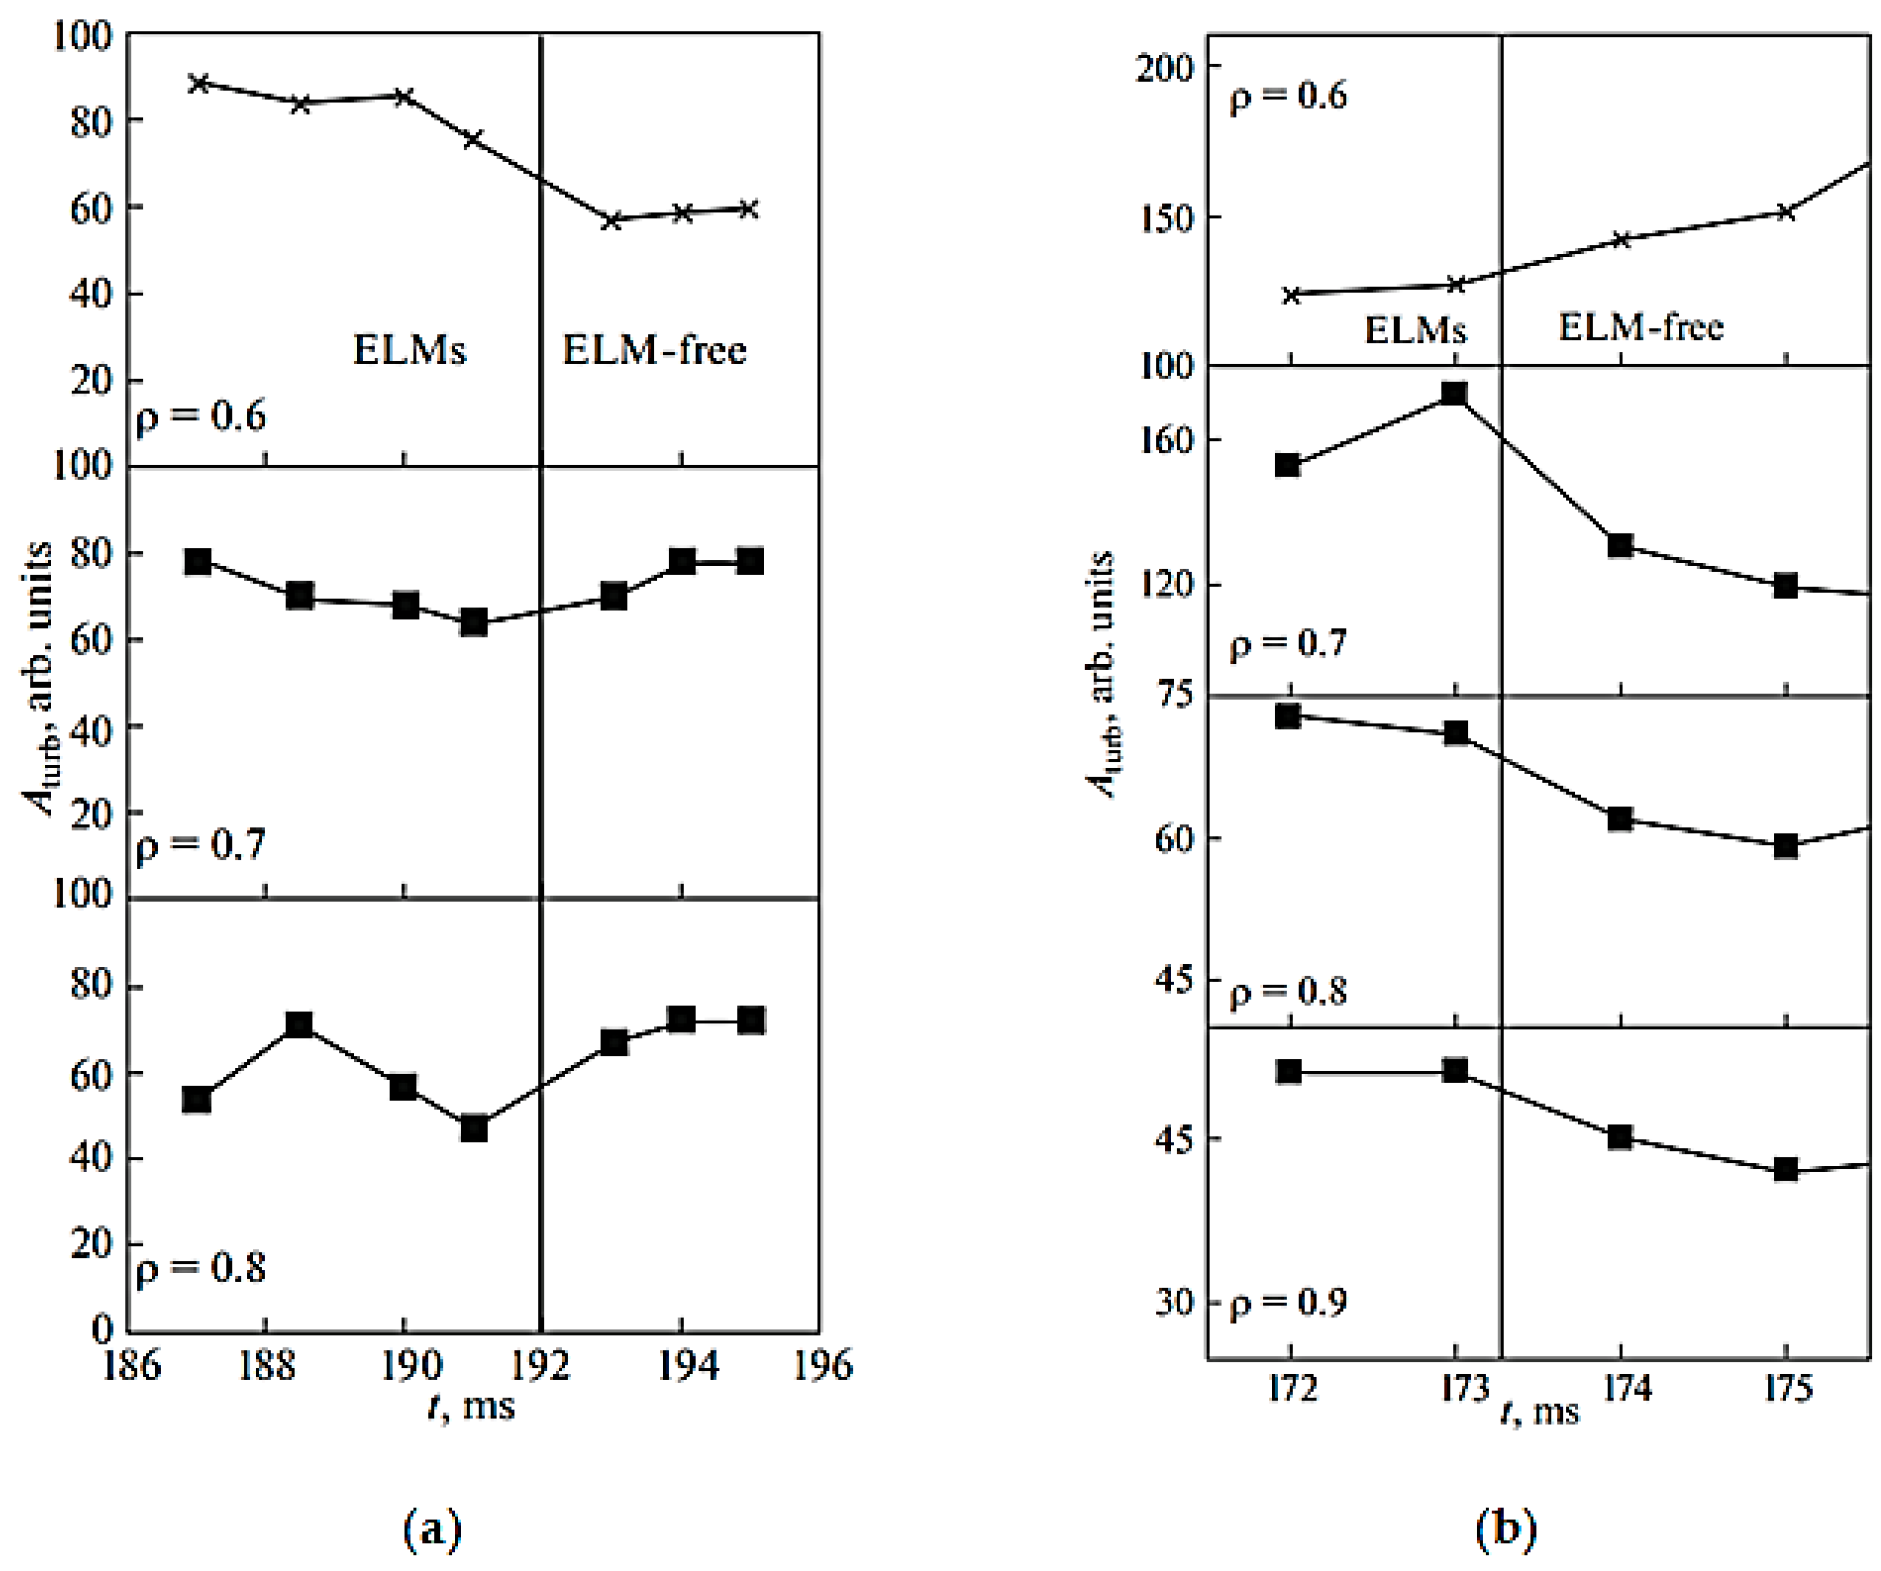
Quasi-Coherent Fluctuations
3.3. Filaments
3.4. Alfven Mode
| Investigated Property | Range of Values | Notes |
|---|---|---|
| Additional heating | NBI | only observed during NBI |
| f, kHz | ~99–160 | Alfven continuum frequency gaps [68] |
| Spectral peak width ∆f, kHz | 80 | the decrease of the TAE frequency is related to the slowing down of the Alfven wave |
| Type | continuous or burst | dependent on the injected beam parameters [69] |
| tlifetime (for burst type), ms | ~0.1–0.5 | predator-prey model [69] |
| Radial electric field amplitude, kV m−1 | ~0.5–3 | the oscillations of the Alfven magnetic field are accompanied by the oscillations of the measured electric field according to Maxwell’s equation [73] |
| Magnetic field amplitude, 10−4 T | ~6–25 | |
| Location R, m | ~0.50–0.56 | shift of TAE to the inner plasma regions is related to the increasing plasma current |
| Toroidal number, n | 1–3 | different toroidal numbers correspond to different TAE harmonics |
3.5. Turbulence
4. Conclusions
Author Contributions
Funding
Institutional Review Board Statement
Informed Consent Statement
Data Availability Statement
Acknowledgments
Conflicts of Interest
References
- Bulanin, V.V.; Lebedev, S.V.; Levin, L.S.; Roytershteyn, V.S. Study of plasma fluctuations in the Tuman-3m tokamak using microwave reflectometry with an obliquely incident probing beam. Plasma Phys. Rep. 2000, 26, 813–819. [Google Scholar] [CrossRef]
- Hirsch, M.; Holzhauer, E.; Baldzuhn, J.; Kurzan, B.; Scott, B.D. Doppler reflectometry for the investigation of propagating density perturbations. Plasma Phys. Control. Fusion 2001, 43, 1641–1660. [Google Scholar] [CrossRef]
- Conway, G.D.; Schirmer, J.; Klenge, S.; Suttrop, W.; Holzhauer, E. Plasma rotation profile measurements using Doppler reflectometry. Plasma Phys. Control. Fusion 2004, 46, 951–970. [Google Scholar] [CrossRef]
- Hennequin, P.; Honoré, C.; Truc, A.; Quéméneur, A.; Lemoine, N.; Chareau, J.-M.; Sabot, R. Doppler backscattering system for measuring fluctuations and their perpendicular velocity on Tore Supra. Rev. Sci. Instrum. 2004, 75, 3881–3883. [Google Scholar] [CrossRef]
- Happel, T.; Estrada, T.; Blanco, E.; Tribaldos, V.; Cappa, A.; Bustos, A. Doppler reflectometer system in the stellarator TJ-II. Rev. Sci. Instrum. 2009, 80, 073502. [Google Scholar] [CrossRef] [PubMed]
- Peebles, W.A.; Rhodes, T.L.; Hillesheim, J.C.; Zeng, L.; Wannberg, C. A novel, multichannel, comb-frequency Doppler backscatter system. Rev. Sci. Instrum. 2010, 81, 10D902. [Google Scholar] [CrossRef]
- Oyama, N.; Takenaga, H.; Suzuki, T.; Sakamoto, Y.; Isayama, A. Density Fluctuation Measurements Using a Frequency Hopping Reflectometer in JT-60U. Plasma Fusion Res. 2011, 6, 1402014. [Google Scholar] [CrossRef]
- Hillesheim, J.; Crocker, N.; Peebles, W.; Meyer, H.; Meakins, A.; Field, A.; Dunai, D.; Carr, M.; Hawkes, N. Doppler backscattering for spherical tokamaks and measurement of high-kdensity fluctuation wavenumber spectrum in MAST. Nucl. Fusion 2015, 55, 73024. [Google Scholar] [CrossRef]
- Hu, J.Q.; Zhou, C.; Liu, A.D.; Wang, M.Y.; Doyle, E.J.; Peebles, W.A.; Wang, G.; Zhang, X.H.; Zhang, J.; Feng, X.; et al. An eight-channel Doppler backscattering system in the experimental advanced superconducting tokamak. Rev. Sci. Instrum. 2017, 88, 073504. [Google Scholar] [CrossRef]
- Biglari, H.; Diamond, P.H.; Terry, P.W. Influence of sheared poloidal rotation on edge turbulence. Phys. Fluids B Plasma Phys. 1990, 2, 1–4. [Google Scholar] [CrossRef]
- Sauter, P.; Pütterich, T.; Ryter, F.; Viezzer, E.; Wolfrum, E.; Conway, G.; Fischer, R.; Kurzan, B.; McDermott, R.; Rathgeber, S.; et al. L- to H-mode transitions at low density in ASDEX Upgrade. Nucl. Fusion 2011, 52, 012001. [Google Scholar] [CrossRef]
- Cabrera, P.M.; Coda, S.; Porte, L.; Offeddu, N.; Lavanchy, P.; Silva, M.; Toussaint, M.; Team, T. V-band Doppler backscattering diagnostic in the TCV tokamak. Rev. Sci. Instrum. 2018, 89, 083503. [Google Scholar] [CrossRef] [PubMed]
- Tokuzawa, T.; Tsuchiya, H.; Tsujimura, T.; Emoto, M.; Nakanishi, H.; Inagaki, S.; Ida, K.; Yamada, H.; Ejiri, A.; Watanabe, K.Y.; et al. Microwave frequency comb Doppler reflectometer applying fast digital data acquisition system in LHD. Rev. Sci. Instrum. 2018, 89, 10H118. [Google Scholar] [CrossRef]
- Shi, Z.; Zhong, W.; Yang, Z.; Liang, A.; Wen, J.; Jiang, M.; Shi, P.; Fu, B.; Chen, C.; Liu, Z.; et al. A multiplexer-based multi-channel microwave Doppler backward scattering reflectometer on the HL-2A tokamak. Rev. Sci. Instrum. 2018, 89, 10H104. [Google Scholar] [CrossRef]
- Zhou, C.; Liu, A.D.; Zhang, X.H.; Hu, J.Q.; Wang, M.Y.; Li, H.; Lan, T.; Xie, J.L.; Sun, X.; Ding, W.X.; et al. Microwave Doppler reflectometer system in the Experimental Advanced Superconducting Tokamak. Rev. Sci. Instrum. 2013, 84, 103511. [Google Scholar] [CrossRef]
- Kurskiev, G.; Gusev, V.K.; Sakharov, N.; Balachenkov, I.; Bakharev, N.N.; Bulanin, V.; Chernyshev, F.; Kavin, A.; Kiselev, E.O.; Khromov, N.; et al. Tenfold increase in the fusion triple product caused by doubling of toroidal magnetic field in the spherical tokamak Globus-M2. Nucl. Fusion 2021, 61, 064001. [Google Scholar] [CrossRef]
- Silva, C.G.; Hillesheim, J.; Hidalgo, C.; Belonohy, E.; Delabie, E.; Gil, L.; Maggi, C.; Meneses, L.; Solano, E.R.; Tsalas, M.; et al. Experimental investigation of geodesic acoustic modes on JET using Doppler backscattering. Nucl. Fusion 2016, 56, 106026. [Google Scholar] [CrossRef]
- Silva, C.G.; Hillesheim, J.C.; Gil, L.; Hidalgo, C.; Maggi, C.F.; Meneses, L.; Solano, E.R.; Contributors, J. Geodesic acoustic mode evolution in L-mode approaching the L–H transition on JET. Plasma Phys. Control. Fusion 2019, 61, 075007. [Google Scholar] [CrossRef]
- Simon, P.; Conway, G.D.; Stroth, U.; Biancalani, A.; Palermo, F. Comparison of experiment and models of geodesic acoustic mode frequency and amplitude geometric scaling in ASDEX Upgrade. Plasma Phys. Control. Fusion 2016, 58, 045029. [Google Scholar] [CrossRef]
- Zhong, W.; Shi, Z.; Xu, Y.; Zou, X.; Duan, X.; Chen, W.; Jiang, M.; Yang, Z.; Zhang, B.; Shi, P.; et al. Three dimensional measurements of Geodesic Acoustic Mode with correlation Doppler reflectometers. J. Instrum. 2015, 10, P10014. [Google Scholar] [CrossRef]
- Zhou, C.; Liu, A.; Liu, Z.; Wang, M.; Xi, F.; Zhang, J.; Ji, J.; Fan, H.; Shi, T.; Liu, H.; et al. Investigation of the geodesic acoustic mode in EAST H-mode operation using Doppler backscattering systems. Nucl. Fusion 2018, 58, 106009. [Google Scholar] [CrossRef]
- Hillesheim, J.C.; Peebles, W.A.; Carter, T.; Schmitz, L.; Rhodes, T.L. Experimental investigation of geodesic acoustic mode spatial structure, intermittency, and interaction with turbulence in the DIII-D tokamak. Phys. Plasmas 2012, 19, 022301. [Google Scholar] [CrossRef]
- Bulanin, V.V.; Askinazi, L.G.; Belokurov, A.A.; Kornev, V.A.; Lebedev, V.; Petrov, A.; Tukachinsky, A.S.; Vildjunas, M.I.; Wagner, F.; Yashin, A.Y. GAM observation in the TUMAN-3M tokamak. Plasma Phys. Control. Fusion 2016, 58, 045006. [Google Scholar] [CrossRef]
- Conway, G.D.; Smolyakov, A.I.; Ido, T. Geodesic Acoustic Modes in magnetic confinement devices. Nucl. Fusion 2021. [Google Scholar] [CrossRef]
- Conway, G.D.; Angioni, C.; Ryter, F.; Sauter, P.; Vicente, J. Mean and Oscillating Plasma Flows and Turbulence Interactions across theL−HConfinement Transition. Phys. Rev. Lett. 2011, 106, 065001. [Google Scholar] [CrossRef]
- Schmitz, L.; Zeng, L.; Rhodes, T.L.; Hillesheim, J.C.; Doyle, E.J.; Groebner, R.J.; Peebles, W.A.; Burrell, K.H.; Wang, G. Role of Zonal Flow Predator-Prey Oscillations in Triggering the Transition to H-Mode Confinement. Phys. Rev. Lett. 2012, 108, 155002. [Google Scholar] [CrossRef]
- Schmitz, L.; Zeng, L.; Rhodes, T.; Hillesheim, J.; Peebles, W.; Groebner, R.; Burrell, K.; McKee, G.; Yan, Z.; Tynan, G.; et al. The role of zonal flows and predator–prey oscillations in triggering the formation of edge and core transport barriers. Nucl. Fusion 2014, 54, 073012. [Google Scholar] [CrossRef]
- Zhong, W.; Zou, X.; Shi, Z.; Duan, X.; Xu, M.; Yang, Z.; Shi, P.; Jiang, M.; Xiao, G.; Song, X.; et al. Dynamics of oscillatory plasma flows prior to the H-mode in the HL-2A tokamak. Plasma Sci. Technol. 2017, 19, 070501. [Google Scholar] [CrossRef]
- Hong, R.; Tynan, G.; Diamond, P.H.; Nie, L.; Guo, D.; Long, T.; Ke, R.; Wu, Y.; Yuan, B.; Xu, M.; et al. Edge shear flows and particle transport near the density limit of the HL-2A tokamak. Nucl. Fusion 2017, 58, 016041. [Google Scholar] [CrossRef]
- Conway, G.D.; Schirmer, J.; Klenge, S.; Suttrop, W.; Holzhauer, E. Direct measurement of zonal flows and geodesic acoustic mode oscillations in ASDEX Upgrade using Doppler reflectometry. Plasma Phys. Control. Fusion 2005, 47, 1165. [Google Scholar] [CrossRef]
- Bulanin, V.V.; Varfolomeev, V.I.; Gusev, V.K.; Ivanov, A.E.; Krikunov, S.V.; Kurskiev, G.S.; Larionov, M.M.; Minaev, V.B.; Patrov, M.I.; Petrov, A.V.; et al. Observation of filaments on the globus-M tokamak by Doppler reflectometry. Tech. Phys. Lett. 2011, 37, 340–343. [Google Scholar] [CrossRef]
- Yashin, A.; Bulanin, V.; Petrov, A.; Petrov, M.; Gusev, V.; Khromov, N.; Kurskiev, G.; Patrov, M.; Tolstyakov, S.; Prisyazhnyuk, D.; et al. Multi-diagnostic approach to geodesic acoustic mode study. J. Instrum. 2015, 10, P10023. [Google Scholar] [CrossRef]
- Bulanin, V.V.; Yashin, A.Y.; Petrov, A.V.; Gusev, V.K.; Minaev, V.B.; Patrov, M.I.; Prisiazhniuk, D.V.; Varfolomeev, V.I. Doppler backscattering diagnostic with dual homodyne detection on the Globus-M compact spherical tokamak. Rev. Sci. Instrum. 2021, 92, 033539. [Google Scholar] [CrossRef] [PubMed]
- Gusakov, E.Z.; Popov, A.Y. Scattering theory of strongly refracting microwaves in turbulent inhomogeneous plasma. Applications of the theory to the description of fluctuation reflectometry in thermonuclear fusion devices. Physics-Uspekhi 2020, 63, 1114–1139. [Google Scholar] [CrossRef]
- Askinazi, L.; Afanasyev, V.; Altukhov, A.; Bakharev, N.; Belokurov, A.; Bulanin, V.; Bykov, A.; Chernyshev, F.; Chugunov, I.; Dyachenko, V.; et al. Fusion Research in Ioffe Institute. Nucl. Fusion 2015, 55, 104013. [Google Scholar] [CrossRef]
- Gusev, V.; Bakharev, N.; Belyakov, V.; Ber, B.; Bondarchuk, E.; Bulanin, V.; Bykov, A.; Chernyshev, F.; Demina, E.; Dyachenko, V.; et al. Review of Globus-M spherical tokamak results. Nucl. Fusion 2015, 55, 104016. [Google Scholar] [CrossRef]
- Gusev, V.K.; Bakharev, N.N.; Ber, B.Y.; Bulanin, V.V.; Chernyshev, F.V.; Dyachenko, V.V.; Goncharov, P.; Gusakov, E.; Iblyaminova, A.D.; Irzak, M.A.; et al. Globus-M plasma physics research for fusion application and compact neutron source development. Plasma Phys. Control. Fusion 2016, 58, 014032. [Google Scholar] [CrossRef]
- Bulanin, V.V.; Wagner, F.; Varfolomeev, V.I.; Gusev, V.K.; Kurskiev, G.S.; Minaev, V.B.; Patrov, M.I.; Petrov, A.V.; Petrov, Y.V.; Prisyazhnyuk, D.V.; et al. Observation of geodesic acoustic modes in the Globus-M spherical Tokamak. Tech. Phys. Lett. 2014, 40, 375–377. [Google Scholar] [CrossRef]
- Yashin, A.; Bulanin, V.; Gusev, V.; Khromov, N.; Kurskiev, G.; Minaev, V.; Patrov, M.; Petrov, A.; Petrov, Y.; Prisyazhnyuk, D.; et al. Geodesic acoustic mode observations in the Globus-M spherical tokamak. Nucl. Fusion 2014, 54, 114015. [Google Scholar] [CrossRef]
- Gao, Z. Analytical Theory of the Geodesic Acoustic Mode in the Small and Large Orbit Drift Width Limits and its Application in a Study of Plasma Shaping Effect. Plasma Sci. Technol. 2011, 13, 15–20. [Google Scholar] [CrossRef]
- Diamond, P.H.; Itoh, S.-I.; Itoh, K.; Hahm, T.S. Zonal flows in plasma—A review. Plasma Phys. Control. Fusion 2005, 47, R35–R161. [Google Scholar] [CrossRef]
- Yashin, A.; Bulanin, V.; Petrov, A.; Gusev, V.; Kurskiev, G.; Minaev, V.; Patrov, M.; Petrov, Y. Recent Doppler backscattering applications in Globus-M tokamak. J. Instrum. 2019, 14, C10025. [Google Scholar] [CrossRef]
- Itoh, K.; Itoh, S.-I.; Diamond, P.H.; Fujisawa, A.; Yagi, M.; Watari, T.; Nagashima, Y.; Fukuyama, A. Geodesic Acoustic Eigenmodes. Plasma Fusion Res. 2006, 1, 037. [Google Scholar] [CrossRef][Green Version]
- Bulanin, V.; Gusev, V.; Iblyaminova, A.; Khromov, N.; Kurskiev, G.; Minaev, V.; Patrov, M.; Petrov, A.; Petrov, Y.; Sakharov, N.; et al. Geodesic acoustic mode investigation in the spherical Globus-M tokamak using multi-diagnostic approach. Nucl. Fusion 2015, 56, 016017. [Google Scholar] [CrossRef]
- Bulanin, V.V.; Askinazi, L.G.; Belokurov, A.A.; Gusev, V.K.; Kornev, V.A.; Kurskiev, G.S.; Lebedev, S.V.; Minaev, V.B.; Patrov, M.I.; Petrov, A.V.; et al. Bicoherence analysis of geodesic acoustic modes in the Tuman-3M and Globus-M Tokamaks. Tech. Phys. Lett. 2015, 41, 366–369. [Google Scholar] [CrossRef]
- Yashin, A.; Bulanin, V.; Gusev, V.K.; Kurskiev, G.; Patrov, M.; Petrov, A.; Petrov, Y.; Tolstyakov, S. Phenomena of limit-cycle oscillations in the Globus-M spherical tokamak. Nucl. Fusion 2018, 58, 112009. [Google Scholar] [CrossRef]
- Schmitz, L. The role of turbulence–flow interactions in L- to H-mode transition dynamics: Recent progress. Nucl. Fusion 2017, 57, 025003. [Google Scholar] [CrossRef]
- Kim, E.-J.; Diamond, P.H. Zonal Flows and Transient Dynamics of theL−HTransition. Phys. Rev. Lett. 2003, 90, 185006. [Google Scholar] [CrossRef]
- Manz, P.; Birkenmeier, G.; Fuchert, G.; Cavedon, M.; Conway, G.D.; Maraschek, M.; Medvedeva, A.; Mink, F.; Scott, B.D.; Shao, L.M.; et al. Poloidal asymmetric flow and current relaxation of ballooned transport during I-phase in ASDEX Upgrade. Phys. Plasmas 2016, 23, 052302. [Google Scholar] [CrossRef]
- Hahm, T.S.; Beer, M.A.; Lin, Z.; Hammett, G.; Lee, W.W.; Tang, W.M. Shearing rate of time-dependent E×B flow. Phys. Plasmas 1999, 6, 922–926. [Google Scholar] [CrossRef]
- Askinazi, L.G.; Belokurov, A.A.; Bulanin, V.V.; Gurchenko, A.D.; Gusakov, E.; Kiviniemi, T.P.; Lebedev, S.V.; Kornev, V.A.; Korpilo, T.; Krikunov, S.V.; et al. Physics of GAM-initiated L–H transition in a tokamak. Plasma Phys. Control. Fusion 2016, 59, 014037. [Google Scholar] [CrossRef]
- Vermare, L.; Hennequin, P.; Peret, M.; Honnore, C.; Bourdelle, C.; Clairet, F.; Dumont, R.; Fedorczak, N.; Goniche, M.; Gunn, J.; et al. Flow dynamics approaching L-H transition. In Proceedings of the 47th EPS Conference on Plasma Physics, Barcelona, Spain, 21–25 June 2021; p. P4.1078. Available online: http://ocs.ciemat.es/EPS2021PAP/pdf/P4.1078.pdf (accessed on 30 July 2021).
- Cheng, J.; Dong, J.; Itoh, K.; Yan, L.; Hong, W.; Zhao, K.; Huang, Z.; Ji, X.; Zhong, W.; Yu, D.; et al. Low–intermediate–high confinement transition in HL-2A tokamak plasmas. Nucl. Fusion 2014, 54, 114004. [Google Scholar] [CrossRef]
- Yashin, A.; Bulanin, V.; Gusev, V.K.; Kiselev, E.O.; Kurskiev, G.; Minaev, V.; Patrov, M.; Petrov, A.; Petrov, Y.; Ponomarenko, A.; et al. Observation of quasi-coherent fluctuations in the Globus-M spherical tokamak. Nucl. Fusion 2021, 61, 092001. [Google Scholar] [CrossRef]
- Vershkov, V.; Shelukhin, D.; Soldatov, S.; Urazbaev, A.; Grashin, S.; Eliseev, L.; Melnikov, A. Summary of experimental core turbulence characteristics in ohmic and electron cyclotron resonance heated discharges in T-10 tokamak plasmas. Nucl. Fusion 2005, 45, S203–S226. [Google Scholar] [CrossRef]
- Gusev, V.; Aminov, R.; Berezutskiy, A.; Bulanin, V.; Chernyshev, F.; Chugunov, I.; Dech, A.; Dyachenko, V.; Ivanov, A.; Khitrov, S.; et al. Investigation of beam-and wave–plasma interactions in spherical tokamak Globus-M. Nucl. Fusion 2011, 51, 103019. [Google Scholar] [CrossRef]
- Bulanin, V.V.; Gusev, V.K.; Khromov, N.A.; Krikunov, S.V.; Kurskiev, G.S.; Larionov, M.M.; Minaev, E.B.; Patrov, M.I.; Petrov, A.V.; Petrov, Y.V.; et al. Observation of filaments in the Globus-M tokamak via Doppler Reflectometry. In Proceedings of the 37th EPS Conference on Plasma Physics, Dublin, Ireland, 21–25 June 2010; p. P1.1012. Available online: http://ocs.ciemat.es/EPS2010PAP/pdf/P1.1012.pdf (accessed on 30 July 2021).
- Bulanin, V.V.; Gusev, V.K.; Khromov, N.A.; Kurskiev, G.S.; Petrov, A.V.; Petrov, Y.V.; Prisyazhnyuk, D.V.; Sakharov, N.V.; Tolstyakov, S.Y.; Yashin, A.Y.; et al. Filament structures in the Globus-M tokamak. In Proceedings of the 39th EPS Conference on Plasma Physics, Stockholm, Sweden, 2–6 July 2012; p. P2.055. Available online: http://ocs.ciemat.es/EPSICPP2012PAP/pdf/P2.055.pdf (accessed on 30 July 2021).
- Bulanin, V.V.; Gusev, V.K.; Kurskiev, G.S.; Minaev, V.B.; Patrov, M.I.; Petrov, A.V.; Petrov, Y.V.; Prisyazhnyuk, D.V.; Sakharov, N.V.; Solokha, V.V.; et al. The Effect of Low-Frequency Magnetohydrodynamic Modes on the Development of Filaments in the Globus-M Tokamak. Tech. Phys. Lett. 2019, 45, 977–980. [Google Scholar] [CrossRef]
- Solokha, V.; Kurskiev, G.S.; Patrov, M.I.; Yashin, A.Y. The ELM triggering by sawtooth oscillations. AIP Conf. Proc. 2019, 2179, 020025. [Google Scholar] [CrossRef]
- Bulanin, V.; Gusev, V.K.; Khromov, N.; Kurskiev, G.; Minaev, V.; Patrov, M.; Petrov, A.; Petrov, M.; Petrov, Y.; Prisiazhniuk, D.; et al. The study of filaments by the Doppler backscattering method in the ‘Globus-M’ tokamak. Nucl. Fusion 2019, 59, 096026. [Google Scholar] [CrossRef]
- Solokha, V.V.; Kurskiev, G.S.; Bulanin, V.V.; Petrov, A.V.; Tolstyakov, S.Y.; Mukhin, E.E.; Gusev, V.K.; Petrov, Y.V.; Sakharov, N.V.; Tokarev, V.A.; et al. Simulations of peeling-ballooning modes in the Globus-M tokamak. J. Phys. Conf. Ser. 2018, 1094, 012002. [Google Scholar] [CrossRef]
- Teplova, N.; Bulanin, V.; Gusakov, E.; Gusev, S.; Lechte, C.; Minaev, V.; Petrov, A.; Petrov, Y.; Yashin, A.; Sakharov, N.; et al. Simulation of Doppler backscattering off filaments in the Globus-M spherical tokamak. In Proceedings of the 46th EPS Conference on Plasma Physics, Milan, Italy, 8–12 July 2019; p. P4.1009. Available online: http://ocs.ciemat.es/EPS2019PAP/pdf/P4.1009.pdf (accessed on 30 July 2021).
- Bulanin, V.; Gusakov, E.; Gusev, V.; Lechte, C.; Heuraux, S.; Minaev, V.; Petrov, A.; Petrov, Y.; Yashin, A.; Sakharov, N.; et al. Full wave modeling of Doppler backscattering from filaments. AIP Conf. Proc. 2019, 2179, 020003. [Google Scholar] [CrossRef]
- Bulanin, V.V.; Gusakov, E.Z.; Gusev, V.K.; Zadvitskiy, G.; Lechte, C.; Heuraux, S.; Minaev, V.B.; Petrov, A.V.; Petrov, Y.V.; Sakharov, N.V.; et al. Full-Wave Modeling of Doppler Backscattering from Filaments. Plasma Phys. Rep. 2020, 46, 490–495. [Google Scholar] [CrossRef]
- Bakharev, N.N.; Bulanin, V.; Chernyshev, F.; Gusev, V.K.; Khromov, N.; Kiselev, E.O.; Kurskiev, G.S.; Melnik, A.D.; Minaev, V.; Mironov, M.I.; et al. The effect of increasing toroidal magnetic field in the Globus-M spherical tokamak. Nucl. Fusion 2018, 58, 126029. [Google Scholar] [CrossRef]
- Bakharev, N.; Abdullina, G.; Afanasyev, V.; Altukhov, A.; Askinazi, L.; Babinov, N.; Bazhenov, A.; Belokurov, A.; Blekhshtein, M.; Bondarchuk, E.; et al. Tokamak research at the Ioffe Institute. Nucl. Fusion 2019, 59, 112022. [Google Scholar] [CrossRef]
- Bulanin, V.V.; Gusev, V.K.; Kurskiev, G.S.; Minaev, V.B.; Patrov, M.I.; Petrov, A.V.; Petrov, M.A.; Petrov, Y.V.; Telnova, A.Y.; Yashin, A.Y. Detection of Alfvén Oscillations on the Globus-M Tokamak Using the Doppler Backscattering Method. Tech. Phys. Lett. 2017, 43, 1067–1070. [Google Scholar] [CrossRef]
- Petrov, Y.V.; Bakharev, N.N.; Gusev, V.K.; Minaev, V.B.; Kornev, V.A.; Kurskiev, G.S.; Patrov, M.I.; Sakharov, N.V.; Tolstyakov, S.Y.; Shchegolev, P.B. Effect of toroidal Alfvén eigenmodes on fast particle confinement in the spherical tokamak Globus-M. J. Plasma Phys. 2015, 81, 515810601. [Google Scholar] [CrossRef]
- Bulanin, V.V.; Gusev, V.K.; Kurskiev, G.S.; Minaev, V.B.; Patrov, M.I.; Petrov, A.V.; Petrov, M.A.; Petrov, Y.V.; Sakharov, N.V.; Yu, A.; et al. Application of Doppler backscattering for Alfvén mode investigation on the Globus-M tokamak. In Proceedings of the 45th EPS Conference on Plasma Physics, Prague, Czech Republic, 2–6 July 2018; p. P5.1003. Available online: http://ocs.ciemat.es/EPS2018PAP/pdf/P5.1003.pdf (accessed on 30 July 2021).
- Bulanin, V.V.; Gusev, V.K.; Kurskiev, G.S.; Minaev, V.B.; Patrov, M.I.; Petrov, A.V.; Petrov, Y.V.; Yashin, A.Y. Application of the Multifrequency Doppler Backscattering Method for Studying Alfvén Modes at a Tokamak. Tech. Phys. Lett. 2019, 45, 1107–1110. [Google Scholar] [CrossRef]
- Petrov, Y.V.; Bakharev, N.N.; Bulanin, V.V.; Gusev, V.K.; Kurskiev, G.S.; Martynov, A.A.; Medvedev, S.Y.; Minaev, V.B.; Patrov, M.I.; Petrov, A.V.; et al. Toroidal Alfvén Modes in the Plasma of the Globus-M Spherical Tokamak. Plasma Phys. Rep. 2019, 45, 723–731. [Google Scholar] [CrossRef]
- Bulanin, V.V.; Bakharev, N.N.; Gusev, V.K.; Kurskiev, G.S.; Minaev, V.B.; Patrov, M.I.; Petrov, A.V.; Petrov, Y.V.; Sakharov, N.V.; Shchegolev, P.B.; et al. Application of Doppler Backscattering for Alfvén Mode Study on the Globus-M Spherical Tokamak. Phys. At. Nucl. 2020, 83, 1124–1130. [Google Scholar] [CrossRef]
- Zhivulin, E.A.; Bulanin, V.V.; Gusev, V.K.; Kurskiev, G.S.; Minaev, V.B.; Patrov, M.I.; Petrov, A.V.; Yashin, A. Study of turbulence spectra in a spherical tokamak plasma. J. Phys. Conf. Ser. 2019, 1400, 077036. [Google Scholar] [CrossRef]
- Yashin, A.Y.; Bulanin, V.V.; Petrov, A.V.; Zhivulin, E.A.; Gusev, V.K.; Kurskiev, G.S.; Minaev, V.B.; Patrov, M.I.; Petrov, Y.V. Study of turbulence in the Globus-M tokamak plasma during the transition to the ELM-free H-mode. AIP Conf. Proc. 2019, 2179, 020028. [Google Scholar] [CrossRef]
- Yashin, A.Y.; Bulanin, V.V.; Petrov, A.V.; Gusev, V.K.; Kurskiev, G.S.; Minaev, V.B.; Patrov, M.I.; Petrov, Y.V. Study of Turbulence in the Globus-M Tokamak Plasma during the Transition to the ELM-Free H-Mode. Plasma Phys. Rep. 2020, 46, 683–688. [Google Scholar] [CrossRef]
- Yashin, A.Y.; Bulanin, V.V.; Petrov, A.V.; Gusev, V.K.; Kurskiev, G.S.; Minaev, V.B.; Patrov, M.I.; Ponomarenko, A.M. Study of the ELM-free regimes by Doppler backscattering in the Globus-M tokamak. In Proceedings of the 47th EPS Conference on Plasma Physics, Barcelona, Spain, 21–25 June 2021; p. P1.1070. Available online: http://ocs.ciemat.es/EPS2021PAP/pdf/P1.1070.pdf (accessed on 30 July 2021).
- Estrada, T.; Hidalgo, C.; Happel, T.; Diamond, P.H. Spatiotemporal Structure of the Interaction between Turbulence and Flows at the L-H Transition in a Toroidal Plasma. Phys. Rev. Lett. 2011, 107, 245004. [Google Scholar] [CrossRef] [PubMed]
- Hennequin, P.; Laggner, F.; Mink, F.; Wolfrum, E.; Trier, E.; Eich, T.; Bernert, M.; Berkenmeire, G.; Conway, G.D.; Happel, T.; et al. Inter-ELM Fluctuations and Flows and their evolution when approaching the density limit in the ASDEX Upgrade tokamak. In Proceedings of the 44th EPS Conference on Plasma Physics, Belfast, UK, 26–30 June 2017; p. P1.167. Available online: http://ocs.ciemat.es/EPS2017PAP/pdf/P1.167.pdf (accessed on 30 July 2021).
- Zeng, L.; Crocker, N.A.; Rhodes, T.L.; Peebles, W.A. New methodology for measuring electron density perturbations caused by plasma coherent modes using profile reflectometry: Magnitudes and radial profiles in DIII-D. Rev. Sci. Instrum. 2021, 92, 043550. [Google Scholar] [CrossRef] [PubMed]
- Bulanin, V.V.; Balachenkov, I.M.; Varfolomeev, V.I.; Gusev, V.K.; Kurskiev, G.S.; Minaev, V.B.; Patrov, M.I.; Petrov, A.V.; Petrov, Y.V.; Ponomarenko, A.M.; et al. Investigations of Alfvén Modes at the Globus-M2 Tokamak Using a V-Band Multifrequency Doppler Reflectometer. Tech. Phys. Lett. 2021, 47, 197–200. [Google Scholar] [CrossRef]


| DBS Systems | #1 | #2 | #3 |
|---|---|---|---|
| Number of systems | 1 | 2 | 1 |
| Number of frequencies | 1 | 1 | 4 |
| Frequency values, GHz | 18–26 | 27–38 | 20, 29, 39, 48 |
| Waveguide | WR-42 | WR-28 | WR-42, WR-28 |
| Wave propagation | O-mode | O-mode | O-mode |
| Poloidal tilt angles, ° | 6–9 | 6–9 | 6–9 |
| Toroidal tilt angles, ° | 2–5 | 2–5 | 2–5 |
| Probing beam angle, ° | −30, −45 | 45, −30, −45 | −30 |
| Position | port #2,3 | port #1,2,3 | port #2 |
| Cut-off radii R, m | ~0.55–0.58 | ~0.53–0.58 | ~0.51–0.59 |
| Field of study | geodesic acoustic modes, filaments | geodesic acoustic modes, filaments, Alfven eigenmodes | geodesic acoustic modes, limit cycle oscillations, filaments, Alfven eigenmodes, turbulence |
| Method | Notes | Field of Study |
|---|---|---|
| Spectral analysis | connects the time domain and the frequency domain | geodesic acoustic modes, limit cycle oscillations, quasi-coherent fluctuations, Alfven eigenmodes, turbulences, filaments |
| Coherence analysis | provides information on how strongly two signals are correlated across a frequency range | geodesic acoustic modes, quasi-coherent fluctuations |
| Correlation analysis | information on radial correlation properties of turbulence | geodesic acoustic modes, limit cycle oscillations, filaments |
| Bicoherent analysis | frequencies at which nonlinear interaction is most effective | geodesic acoustic modes, limit cycle oscillations, quasi-coherent fluctuations |
| Investigated Property | LCO in Discharges with H-Mode | LCO in Discharges without H-Mode | Notes |
|---|---|---|---|
| Additional heating | NBI | not detected in Ohmic phase | |
| f, kHz | ~6 | ~8.5 | the higher LCO frequencies predicted by Stringer spin-up [49] |
| Spectral peak width ∆f, kHz | 1.5 | 1.5 | corresponds to the calculation of spectra in a 512 ms window |
| Duration of LCO phase τ, ms | 2–20 | the duration of the LCO phase tends to be closer to the value of 2 ms in discharges with H-mode and to the values of 20 ms without H-mode | |
| Velocity shear, s−1 | order of 105–106 | order of 105 | predator-prey model [48] |
| Velocity shear behavior | a significant increase before transition to H-mode | no significant changes in behavior | |
| Turbulence suppression | present during LCO | ||
| Turbulence modulation, % | 98 | 81 | dependence of the onset of the transition on frequency corresponds to the transition appearance model developed for the case of the appearance of zonal flows [51] |
| Type | bursty dynamics | standard oscillations around a certain value | |
| Nonlinear coupling of turbulence | present | possibly, the significant coupling indicates that LCOs are dominated by zonal flows; similar results were obtained in the HL-2A tokamak in the ‘type-Y’ LCO phase [53] | |
| Location | ~0.75 | 2 cm inside the separatrix which is similar to other tokamaks | |
| Location width | ~0.4 | close to the radial wavelength of the zonal flows [41] | |
| Investigated Property | Range of Values | Notes |
|---|---|---|
| f, kHz | 110 | similar to values on other tokamaks like T-10 [55] |
| Spectral peak width ∆f, kHz | 80 | |
| Type | burst | |
| tlifetime, ms | 0.1–0.2 | modulated by LCO |
| Location | 0.65 | in the QCF location there is an observed increase in diffusion coefficient caused by ITG |
| Location width | 0.1 | |
| Mode of operation | I-phase | present only during a certain phase of LCO |
| Non-linear interaction with turbulences | present | a peak of summed bicoherence at the QCFs frequency demonstrates the existence of a relationship with turbulent fluctuations |
| Coherence of velocity fluctuations and DBS amplitude | 0.8 near QCFs frequencies | |
| Coherence of DBS amplitude and magnetic field fluctuations | less than 0.3 near QCFs frequencies | not of a magnetic nature |
| Investigated Property | ELM Filament | Inter-ELM Filament | MHD Induced Filament |
|---|---|---|---|
| Radial size, cm | 2–6 | <2 | ~1 |
| Poloidal size, cm | ~1–3 | ~1–3 | ~1–3 |
| Distance between filaments, cm | ~14 | ~7 | ~10 |
| Velocity, km s−1 | ~11–14 | ~6–12 | ~12 |
| Quasi-toroidal mode numbers | ~12 | ~25 | ~15 |
| Critical density ne, 1019 m−3 | <1.2 | 1.5 | ~2–3.5 |
| Location R, cm | 55 | 54.8 | 57 |
| Dα activity | present | not present | not present |
| Langmuir probe activity | present | not present | not present |
| Magnetic probe activity | present | not present | present |
Publisher’s Note: MDPI stays neutral with regard to jurisdictional claims in published maps and institutional affiliations. |
© 2021 by the authors. Licensee MDPI, Basel, Switzerland. This article is an open access article distributed under the terms and conditions of the Creative Commons Attribution (CC BY) license (https://creativecommons.org/licenses/by/4.0/).
Share and Cite
Yashin, A.; Bulanin, V.; Petrov, A.; Ponomarenko, A. Review of Advanced Implementation of Doppler Backscattering Method in Globus-M. Appl. Sci. 2021, 11, 8975. https://doi.org/10.3390/app11198975
Yashin A, Bulanin V, Petrov A, Ponomarenko A. Review of Advanced Implementation of Doppler Backscattering Method in Globus-M. Applied Sciences. 2021; 11(19):8975. https://doi.org/10.3390/app11198975
Chicago/Turabian StyleYashin, Alexander, Victor Bulanin, Alexander Petrov, and Anna Ponomarenko. 2021. "Review of Advanced Implementation of Doppler Backscattering Method in Globus-M" Applied Sciences 11, no. 19: 8975. https://doi.org/10.3390/app11198975
APA StyleYashin, A., Bulanin, V., Petrov, A., & Ponomarenko, A. (2021). Review of Advanced Implementation of Doppler Backscattering Method in Globus-M. Applied Sciences, 11(19), 8975. https://doi.org/10.3390/app11198975