Abstract
Patients with diffuse idiopathic skeletal hyperostosis (DISH) develop fractures of the vertebral bodies, even in minor trauma, because of the loss of flexibility, which causes difficulties in fusing vertebrae; therefore, the diagnosis of spine injuries may be delayed. We used the three-dimensional finite element method to add data on ossification to the healthy vertebral model in order to investigate how stress in intervertebral discs changes with bone shape and whether these changes present any risk factors. A healthy spine model and a DISH flat model (T8–sacrum) were generated from medical images. As an ossified hypertrophic model, T11–T12 was cross-linked with hypertrophic ossification, and hypertrophy was found to be 5 and 10 mm. An ossifying hypertrophic groove model (5 and 10 mm) was created at T11–T12 and T11–L1. A groove was created at the center of T12, and the radius of curvature of the groove was set to 1 and 2.5 mm. An extension force and flexion force were applied to the upper part of T8, assuming that external forces in the direction of flexion and extension were applied to the spine. Stresses were greater in the DISH flat model than in the healthy model. In the hypertrophic ossification model, the stress on the vertebral body was similar to greater ossification in extension and flexion. In the ossified hypertrophic groove model, the stress at the center of the groove increased. In DISH, vertebrae are more susceptible to stress. Furthermore, depending on the morphology of ossification, stresses on the vertebrae and intervertebral discs differed even with similar loads. An examination of ossification geometry may help surgeons decide the thoracolumbar spine’s stress elevated position in patients with DISH, thereby contributing to the understanding of the pathogenesis of pain.
1. Introduction
Diffuse idiopathic skeletal hyperostosis (DISH) was defined by Resnick et al. in 1975 [1]. The most commonly used diagnostic criteria are the involvement of at least four contiguous vertebrae of the thoracic spine, the preservation of intervertebral disc spaces, and the absence of gross degeneration or fusion of the apophyseal and sacroiliac joints. DISH most commonly affects the spine and often presents as back pain and stiffness. Furthermore, it is associated with fractures of the vertebral body, even with minor trauma, because of the loss of flexibility, which is problematic [2,3,4]. Computed tomography (CT) has made it possible to easily diagnose the morphology of ossification [5,6]. Previous studies added the thickness of the bony ridge as a diagnostic criterion [7]. However, the morphology of ossification in practice may be a combination of ventral overhang and flatness (Figure 1). There is currently no classification for the various forms of ossification; however, we hypothesized that under similar loads and traumatic maneuvers, the morphology of ossification and the depth of the ossification groove may vary and also that the stresses applied to the vertebrae may differ. A stress analysis using the ossification geometry of DISH has not yet been conducted. Therefore, we used the three-dimensional finite element method (3D-FEM) to add ossification to the same vertebral model in order to investigate how the stress on intervertebral discs changes with bone shape and whether these changes present any risk factors.
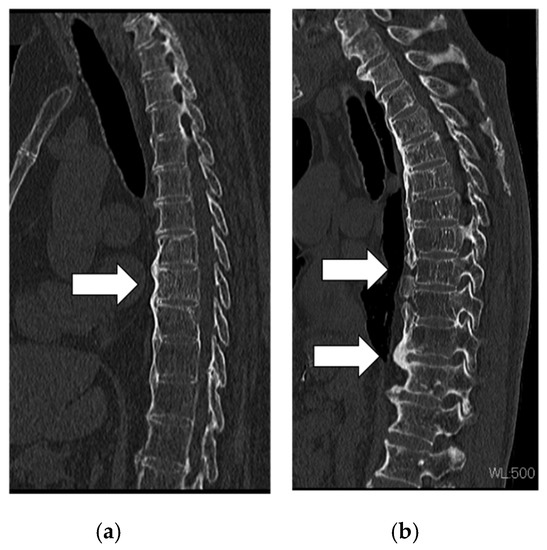
Figure 1.
Actual ossified morphology of diffuse idiopathic skeletal hyperostosis. Images from a patient showing (a) flat ossification and (b) large and discontinuous ossification.
2. Material and Methods
2.1. Patient Images
CT images (slice thickness of 0.6 mm) of the spine, from the thoracic spine to the pelvis, of an adult man were obtained with the Brilliance 64 CT scanner (Philips Healthcare, Amsterdam, the Netherlands). The present study was approved by the Ethics Committee at the Center for Clinical Research, Yamaguchi University Hospital (Ube, Japan; approval No. H28-054). Written informed consent for this study and its publication was obtained from all subjects.
2.2. FEM Model Construction
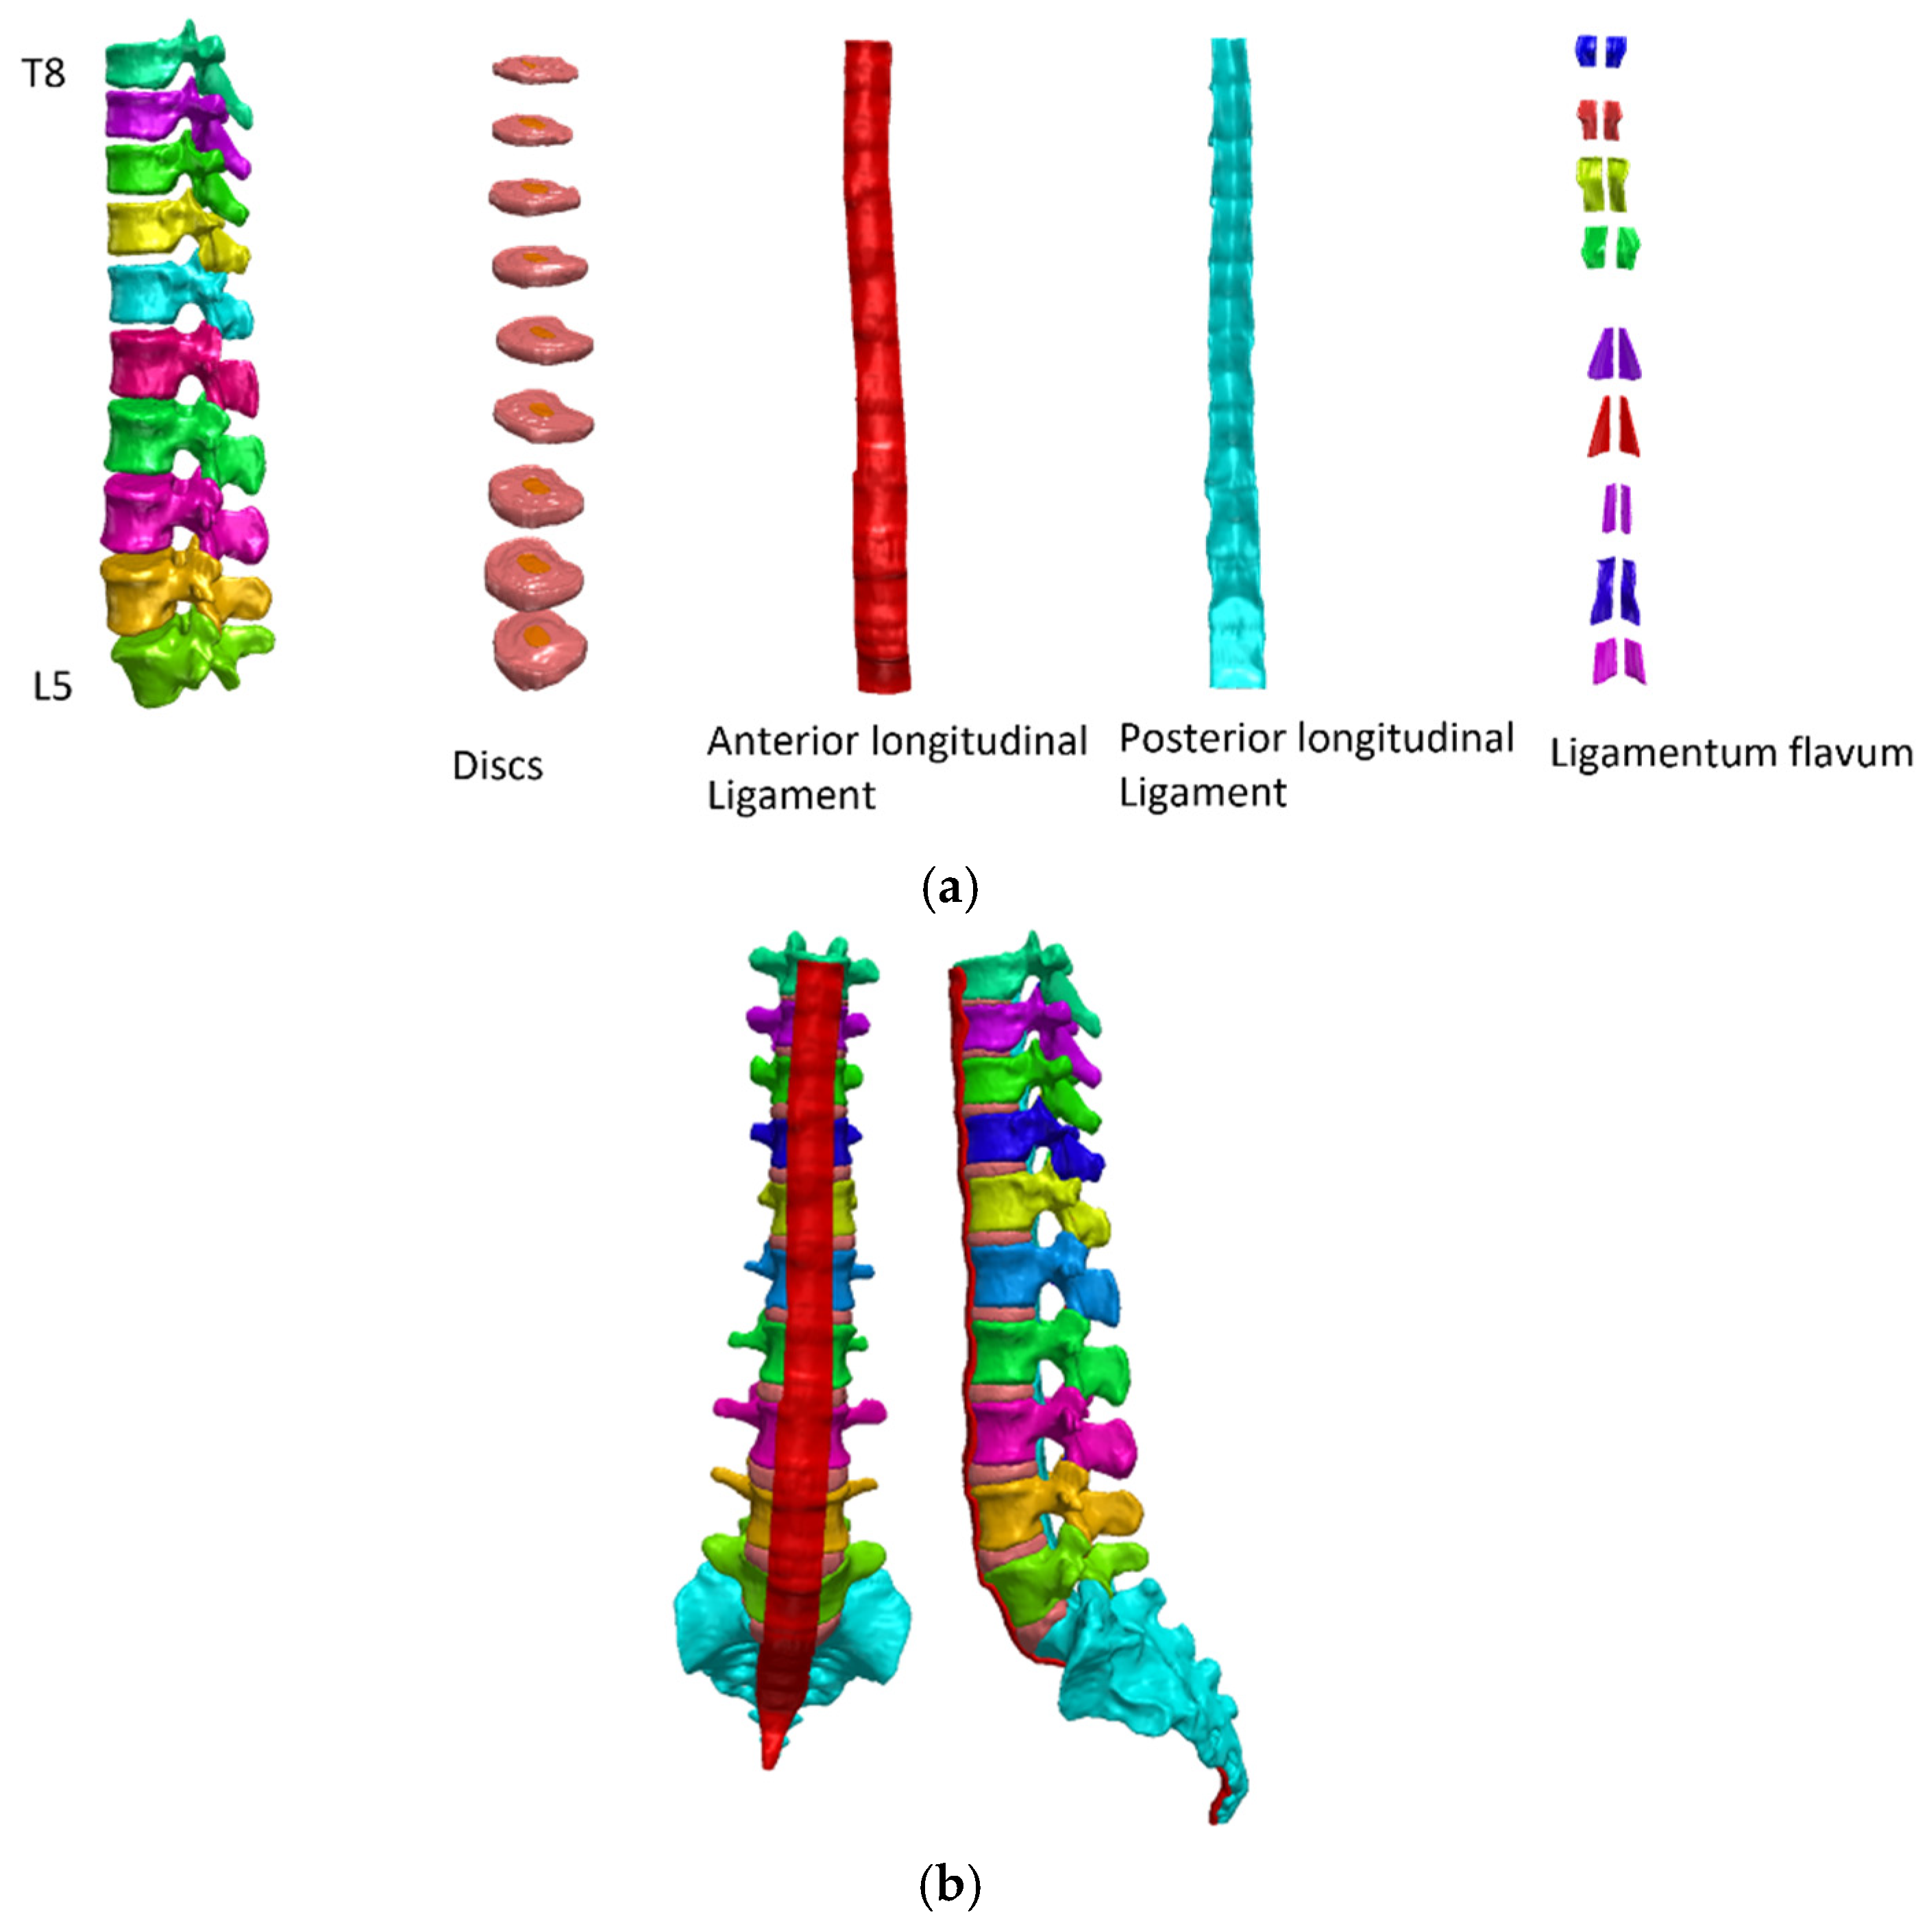
Model construction was performed using finite element analysis software (Simpleware ScanIP, version M-2017.06; Synopsys Inc., Mountain View, CA, USA). After the spine was extracted, vertebrae were mapped as cancellous and cortical bones, and the sizes of the intervertebral discs were adjusted to match the sizes of the endplates of each vertebra. When cortical and cancellous bones were being separated, cortical bone was delineated using the CT values (>1000 Hounsfield units) of cortical bone. Cancellous bone was color-coded on the assumption that it was contained within cortical bone. Due to the small size of the facet joints, the computer was unable to automatically separate them. Therefore, manual distinctions were performed when checking CT scans. A 3D whole-spine model was constructed by individually mapping all vertebrae and intervertebral discs from the thoracic to sacral regions. The gap between each vertebra and intervertebral disc was considered to be completely restricted in movement. Facet-joint spaces were created at all levels to allow each vertebra to move independently. The anterior longitudinal ligament, posterior longitudinal ligament, and ligamentum flavum were also added to the model (Figure 2).

Figure 2.
(a) T8 to the sacrum, distinguishing each vertebral body, intervertebral disc, anterior longitudinal ligament, posterior longitudinal ligament, and ligamentum flavum. (b) A spine model was created.
The contact of the intervertebral disc, vertebral body, ligament, and vertebral body/intervertebral disc were used to make translational and rotational motion as well as all other active degrees of freedom equal for a pair of surfaces. Moreover, all facet joints were independently constructed. Each facet joint was separated from the other facet, and the surface was set to have a coefficient of friction of 0 in order to account for joint fluid in case of contact. This model was used as the healthy spine model. In this analysis, the cranial end was T8 and the caudal side was the sacrum. All elements were considered to be linear elastic materials. Young’s modulus was used as a reference, as previously described [8,9,10,11,12,13] (Table 1).

Table 1.
Young’s modulus and Poisson’s ratio.
2.3. Model for DISH
In the DISH flat model, the physical properties of the whole anterior longitudinal ligament were changed to Young’s modulus of cortical bone (Figure 3A).
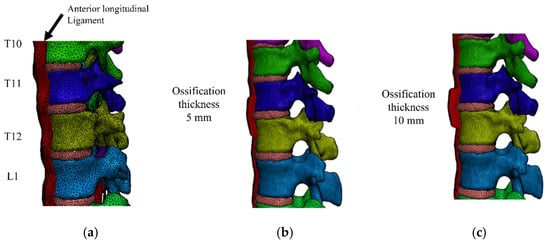
Figure 3.
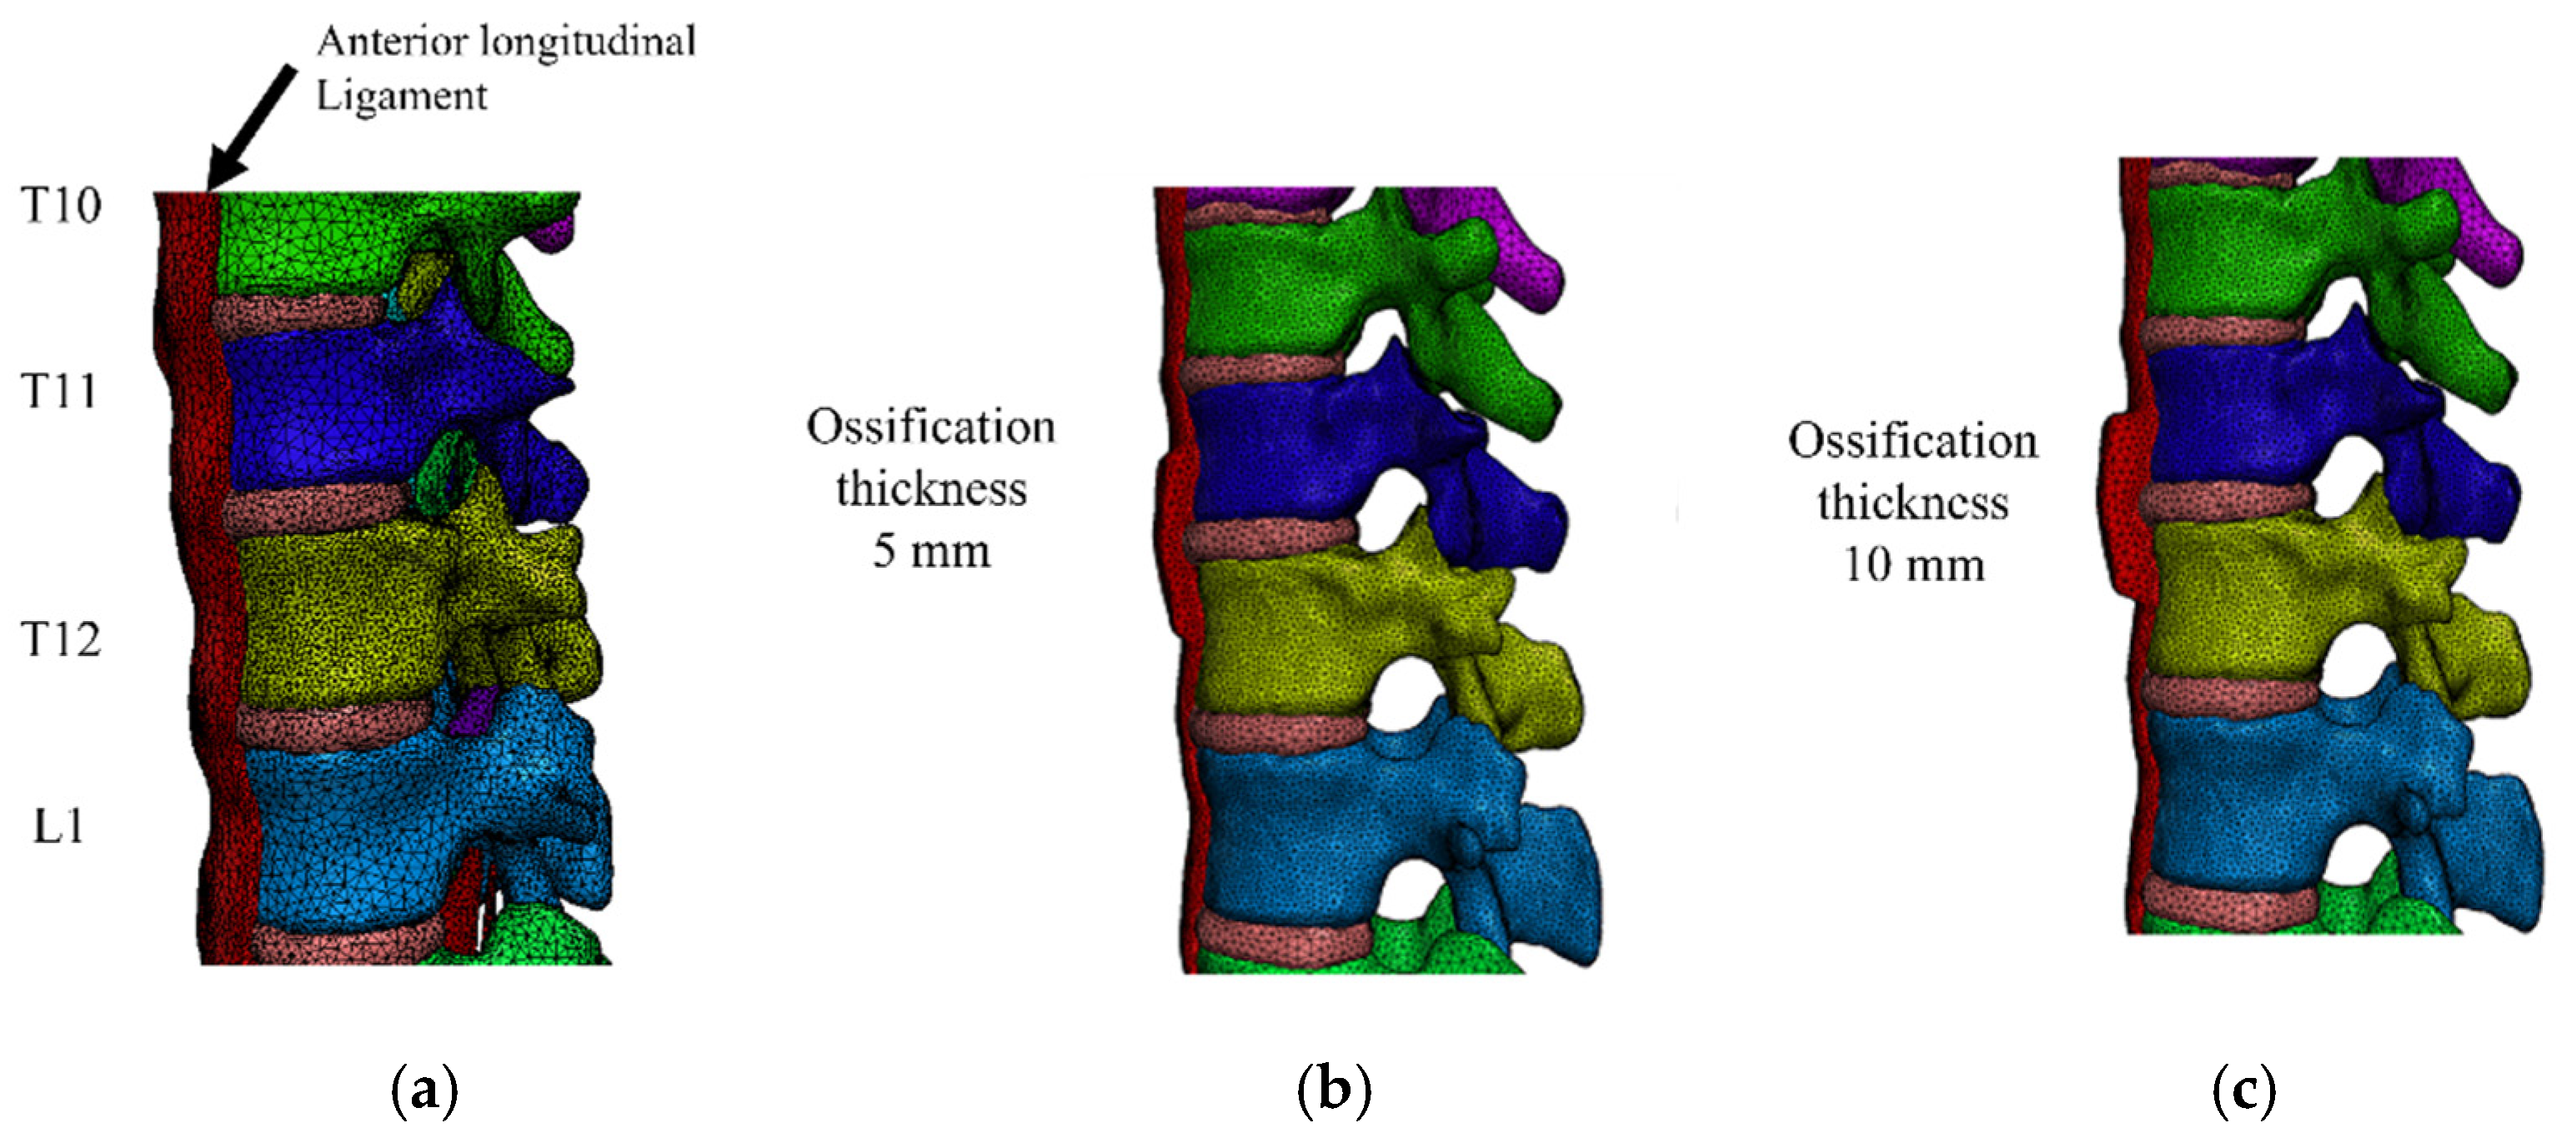
(a) In the diffuse idiopathic skeletal hyperostosis model, the anterior longitudinal ligament had the property of cortical bone. In addition, the thickness of ossification of T11–T12 was created at (b) 5 mm and (c) 10 mm.
As an ossified hypertrophic model, T11–T12 was cross-linked with hypertrophic ossification, and hypertrophy was modeled with a thickness of 5 mm (T-5) (Figure 3b) and 10 mm (T-10) (Figure 3c). In addition, an ossifying hypertrophic groove model (5 and 10 mm) was created at T11–T12 and T12–L1. A groove was created at the center of T12, and the radius of curvature of this groove was set to 1 and 2.5 mm (D-5/R-2.5, D-10/R-2.5, D-5/R-1, D-10/R-1, respectively) (Figure 4a,b).
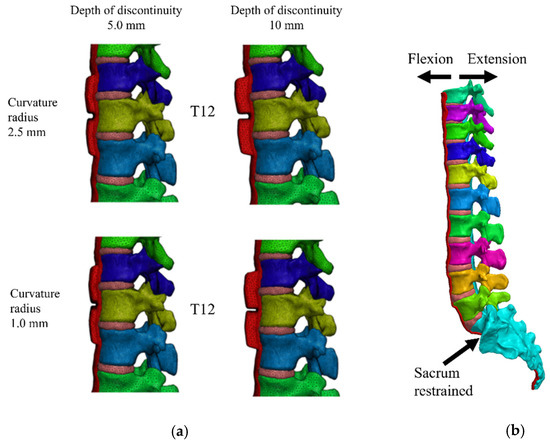
Figure 4.
Ossifying hypertrophic grooves at 5 (a) and 10 mm (b) were created at T11–T12 and T12–L1. In these diffuse idiopathic skeletal hyperostosis models, the sacrum was fixed and the cranial endplate of T8 was displaced in the direction of flexion and extension.
In the healthy spine model, the total numbers of elements and nodes were 903,621 and 203,312 using tetrahedral elements, respectively. The mesh in the groove area was small to allow the analysis to converge (Table 2).
Table 2.
Elements of the nodes of each model are shown.
2.4. Load Application
With the sacrum completely restrained in all directions, a forced displacement of 30 mm to ventral and dorsal direction was applied to the cranial endplate of T8, assuming extension and flexion (Figure 4b).
An analysis was performed using Patran and MARC (MSC Software, Newport Beach, CA, USA). Sixteen different compression combinations were evaluated, a mechanical analysis of vertebral bodies and discs was performed based on the visual findings, and the highest value for maximum von Mises stress was recorded for each combination. The unit is the megapascal (MPa).
3. Results
3.1. Extension
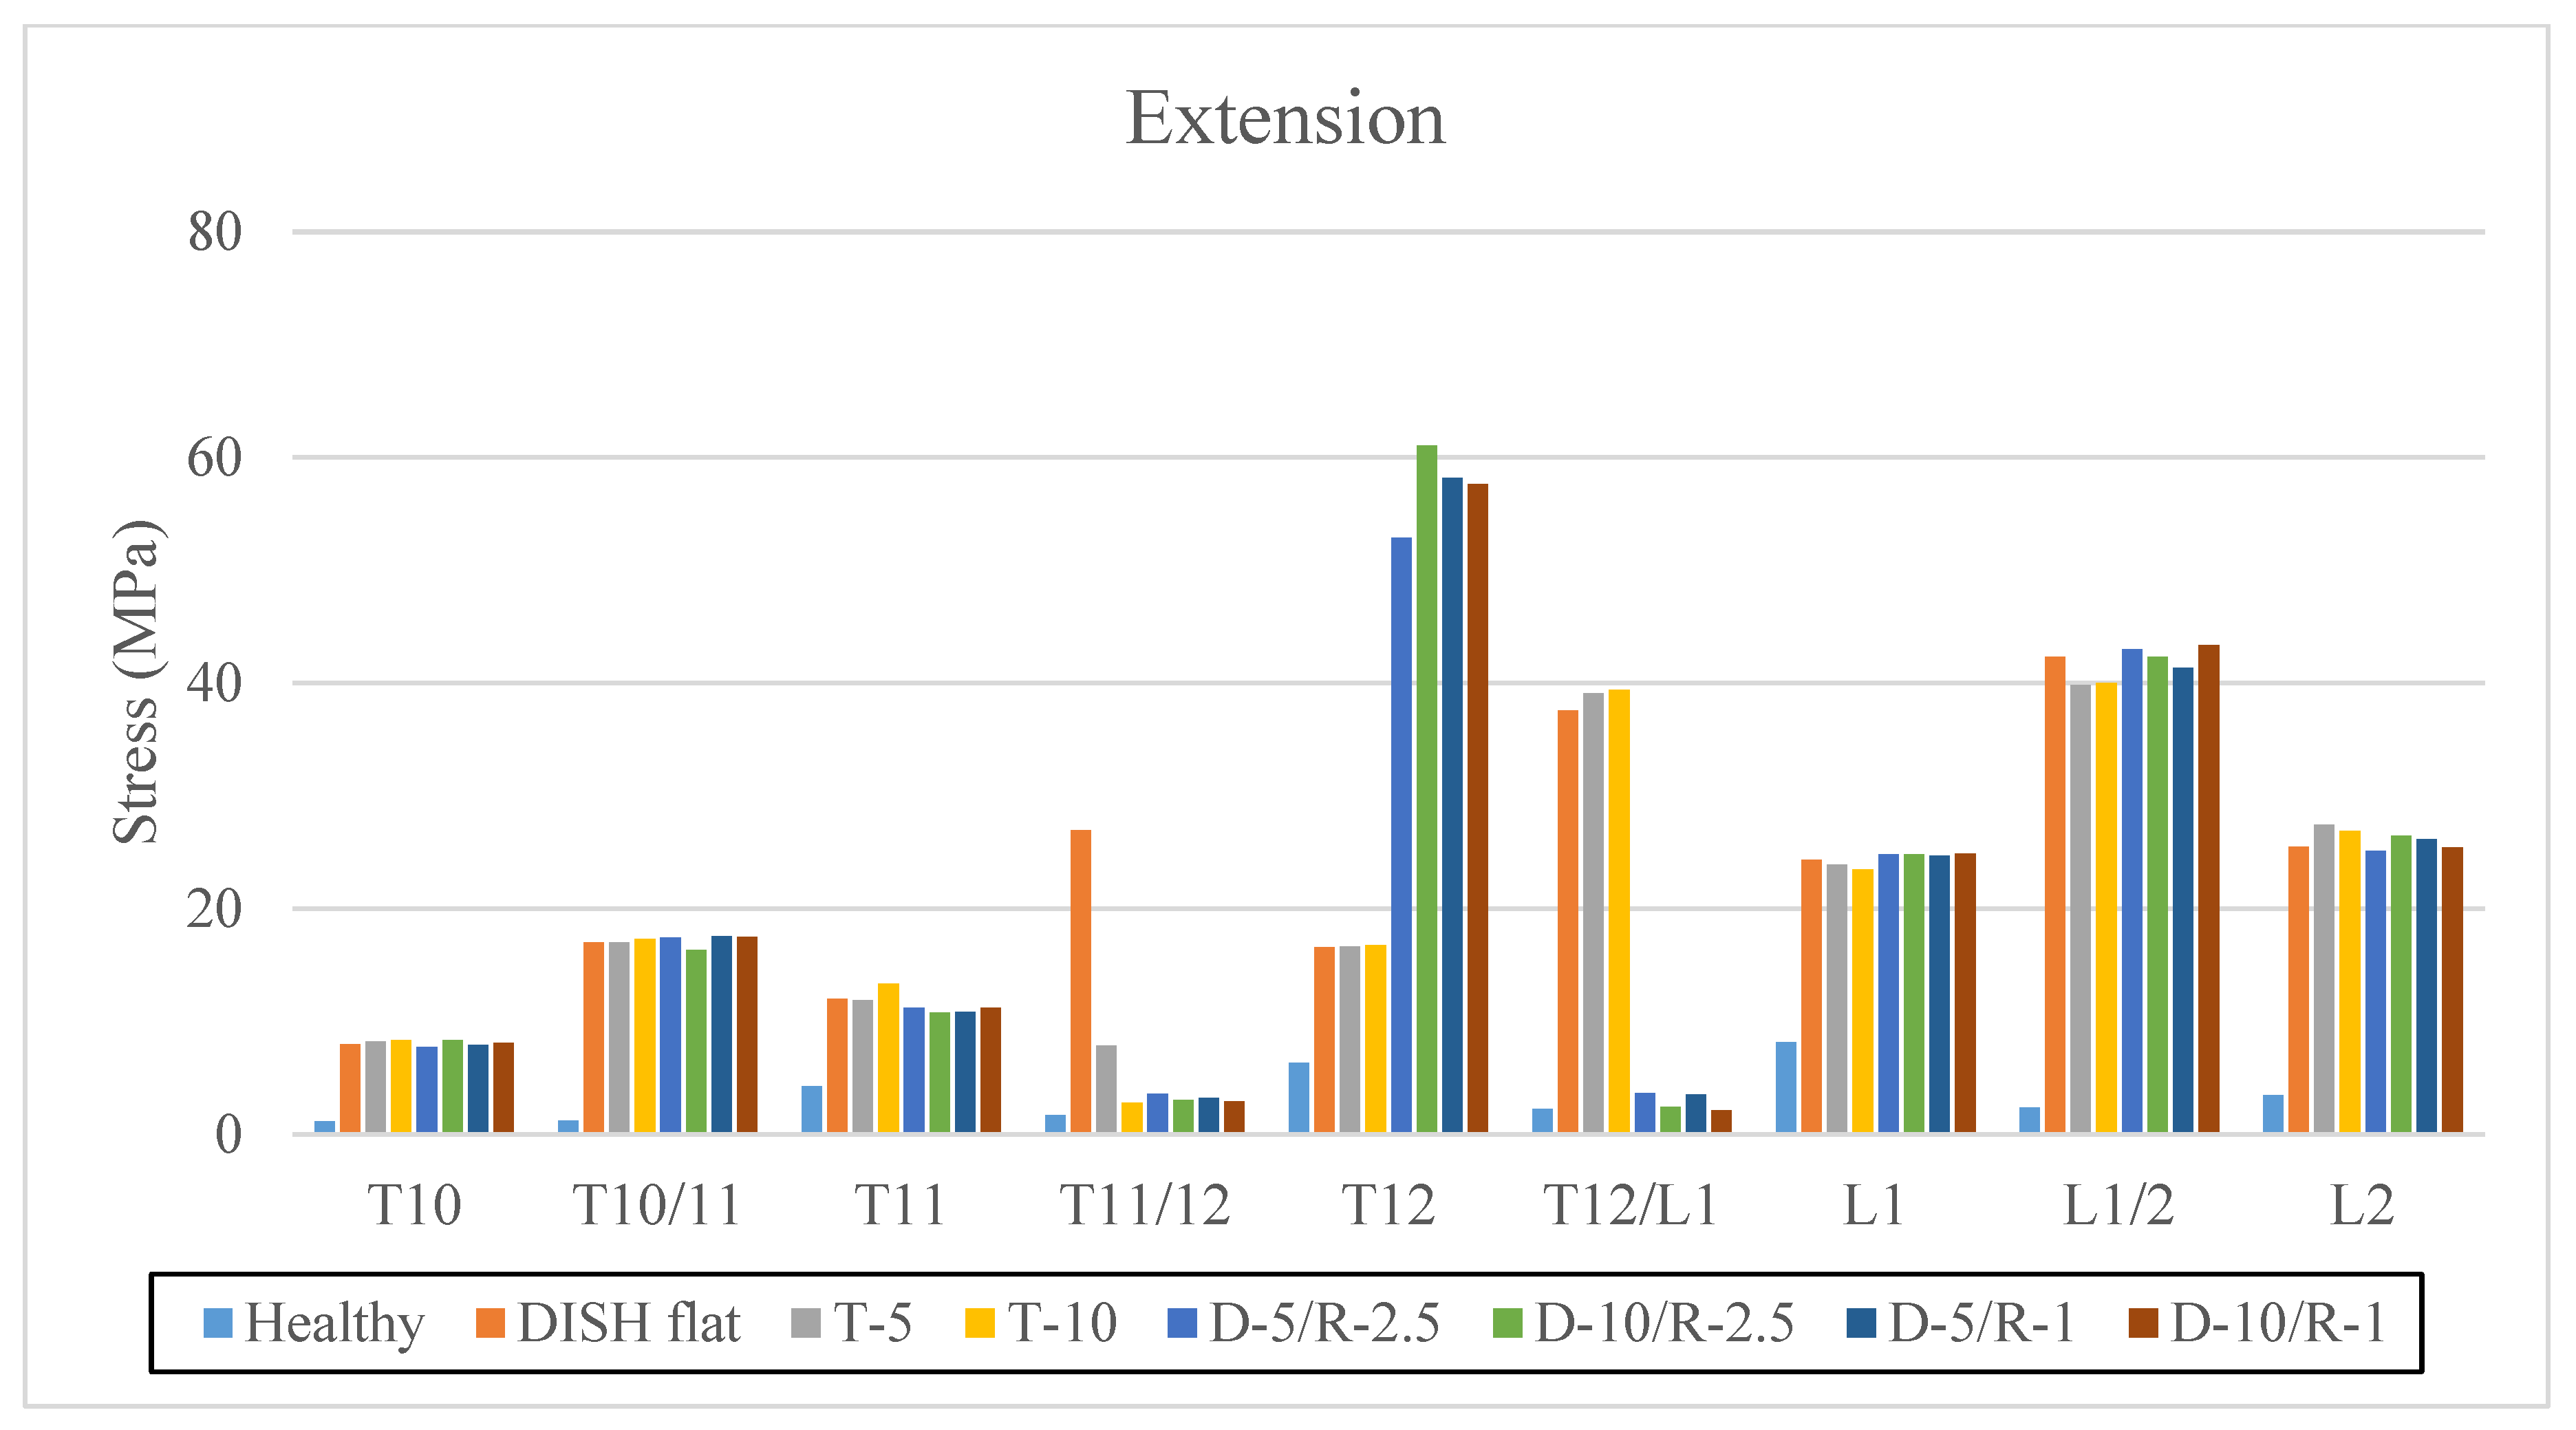
Maximum stress values at the center of the vertebral body and intervertebral disc from T10 to L2 vertebrae are shown in extension (Table 3 and Figure 5).
Table 3.
The highest value for maximum von Mises stress on the vertebral body and intervertebral disc (MPa).

Figure 5.
The highest value for maximum von Mises stress on the vertebral body and intervertebral disc (MPa) in extension. The vertical axis is stress (MPa), and the horizontal axis is each vertebral body and intervertebral level.
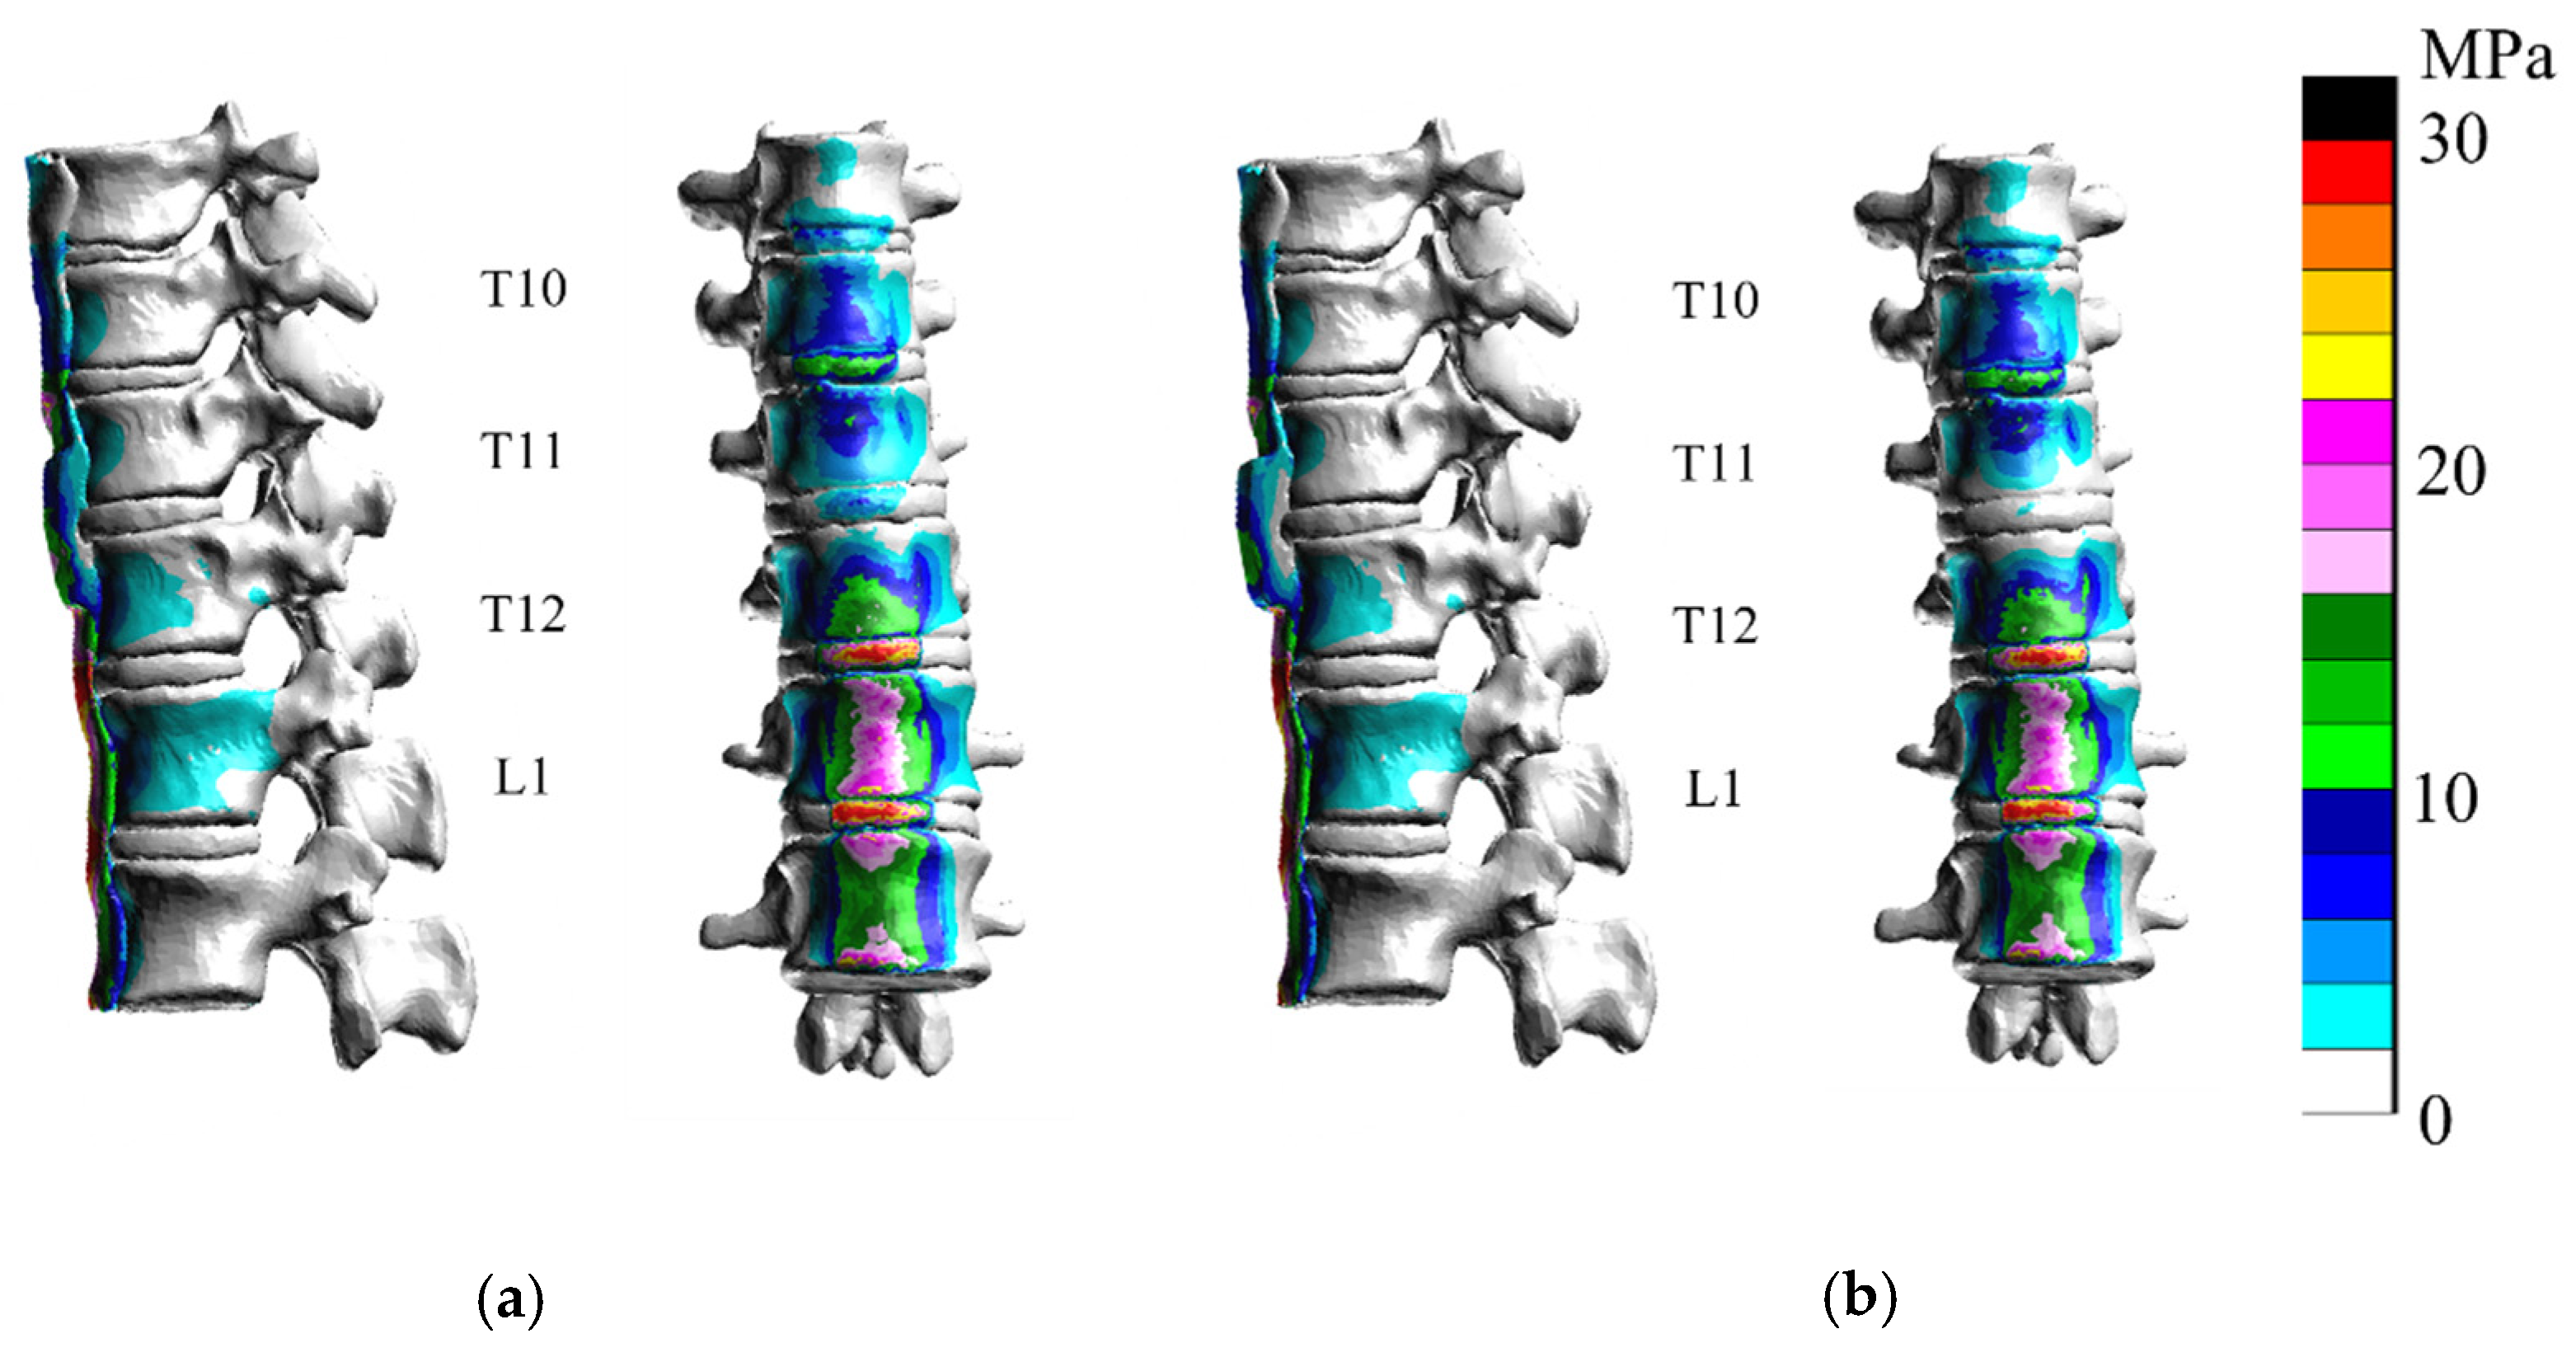
Comparisons between the healthy model and DISH flat model showed that stresses were greater on the vertebral body and intervertebral disc from T10 to L2 in extension (Figure 6) than in the healthy model.
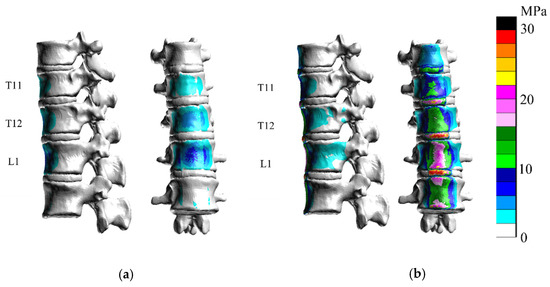
Figure 6.
Only vertebral bodies and discs are shown for clarity. The right bar is color-coded according to stress (MPa). Stress diagrams of (a) the healthy model and (b) the diffuse idiopathic skeletal hyperostosis (DISH) flat model. Stresses were greater in the flat model in extension than in the healthy model.
In the T-5 model and T-10 model, the stress on the vertebral body was similar with greater ossification in extension (Figure 7). As the thickness of ossification increased, stress on the intervertebral disc decreased.

Figure 7.
In extension analyses of the hypertrophic ossification models T-5 (a) and T-10 (b), the stress on the intervertebral disc at T11–T12 was reduced, whereas stress on the vertebral body was unchanged.
In the ossified hypertrophic groove 2.5 mm model (D-5/R-2.5 and D-10/R-2.5) (Figure 8), the stress at the center of T12 increased as the groove at the discontinuity became deeper. The maximum stress at the center of each T12 vertebral body is shown in Figure 5 and Figure 8. In extension, the stress on the T11/12 and T12/L1 discs was less than that in the DISH model.
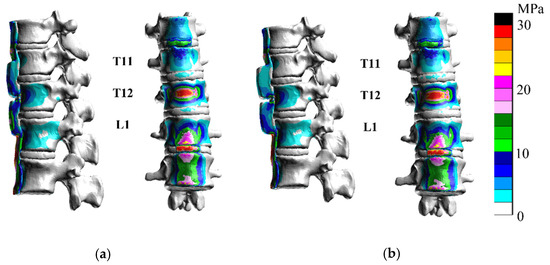
Figure 8.
In D-5/R-2.5 (a) and D-10/R-2.5 (b), the stress at the center of T12 increased at the discontinuity in extension.
In D-5/R-1 and D-10/R-1 (Figure 9), the stress at the center of T12 increased. Maximum stress at the center of each T12 vertebral body is shown in Figure 5 and Figure 10. In the analysis of D-5/R-1, stress on the T12 vertebral body was greater than that of D-5/R-2.5, even with the same depth of ossification. However, with D-10/R-1, the stress on the T12 vertebral body was less than that at D-5/R-1 and at D-10/R-1 in extension.

Figure 9.
In D-5/R-1 (a) and D-10/R-1 (b), the stress at the center of T12 increased at the discontinuity in extension.

Figure 10.
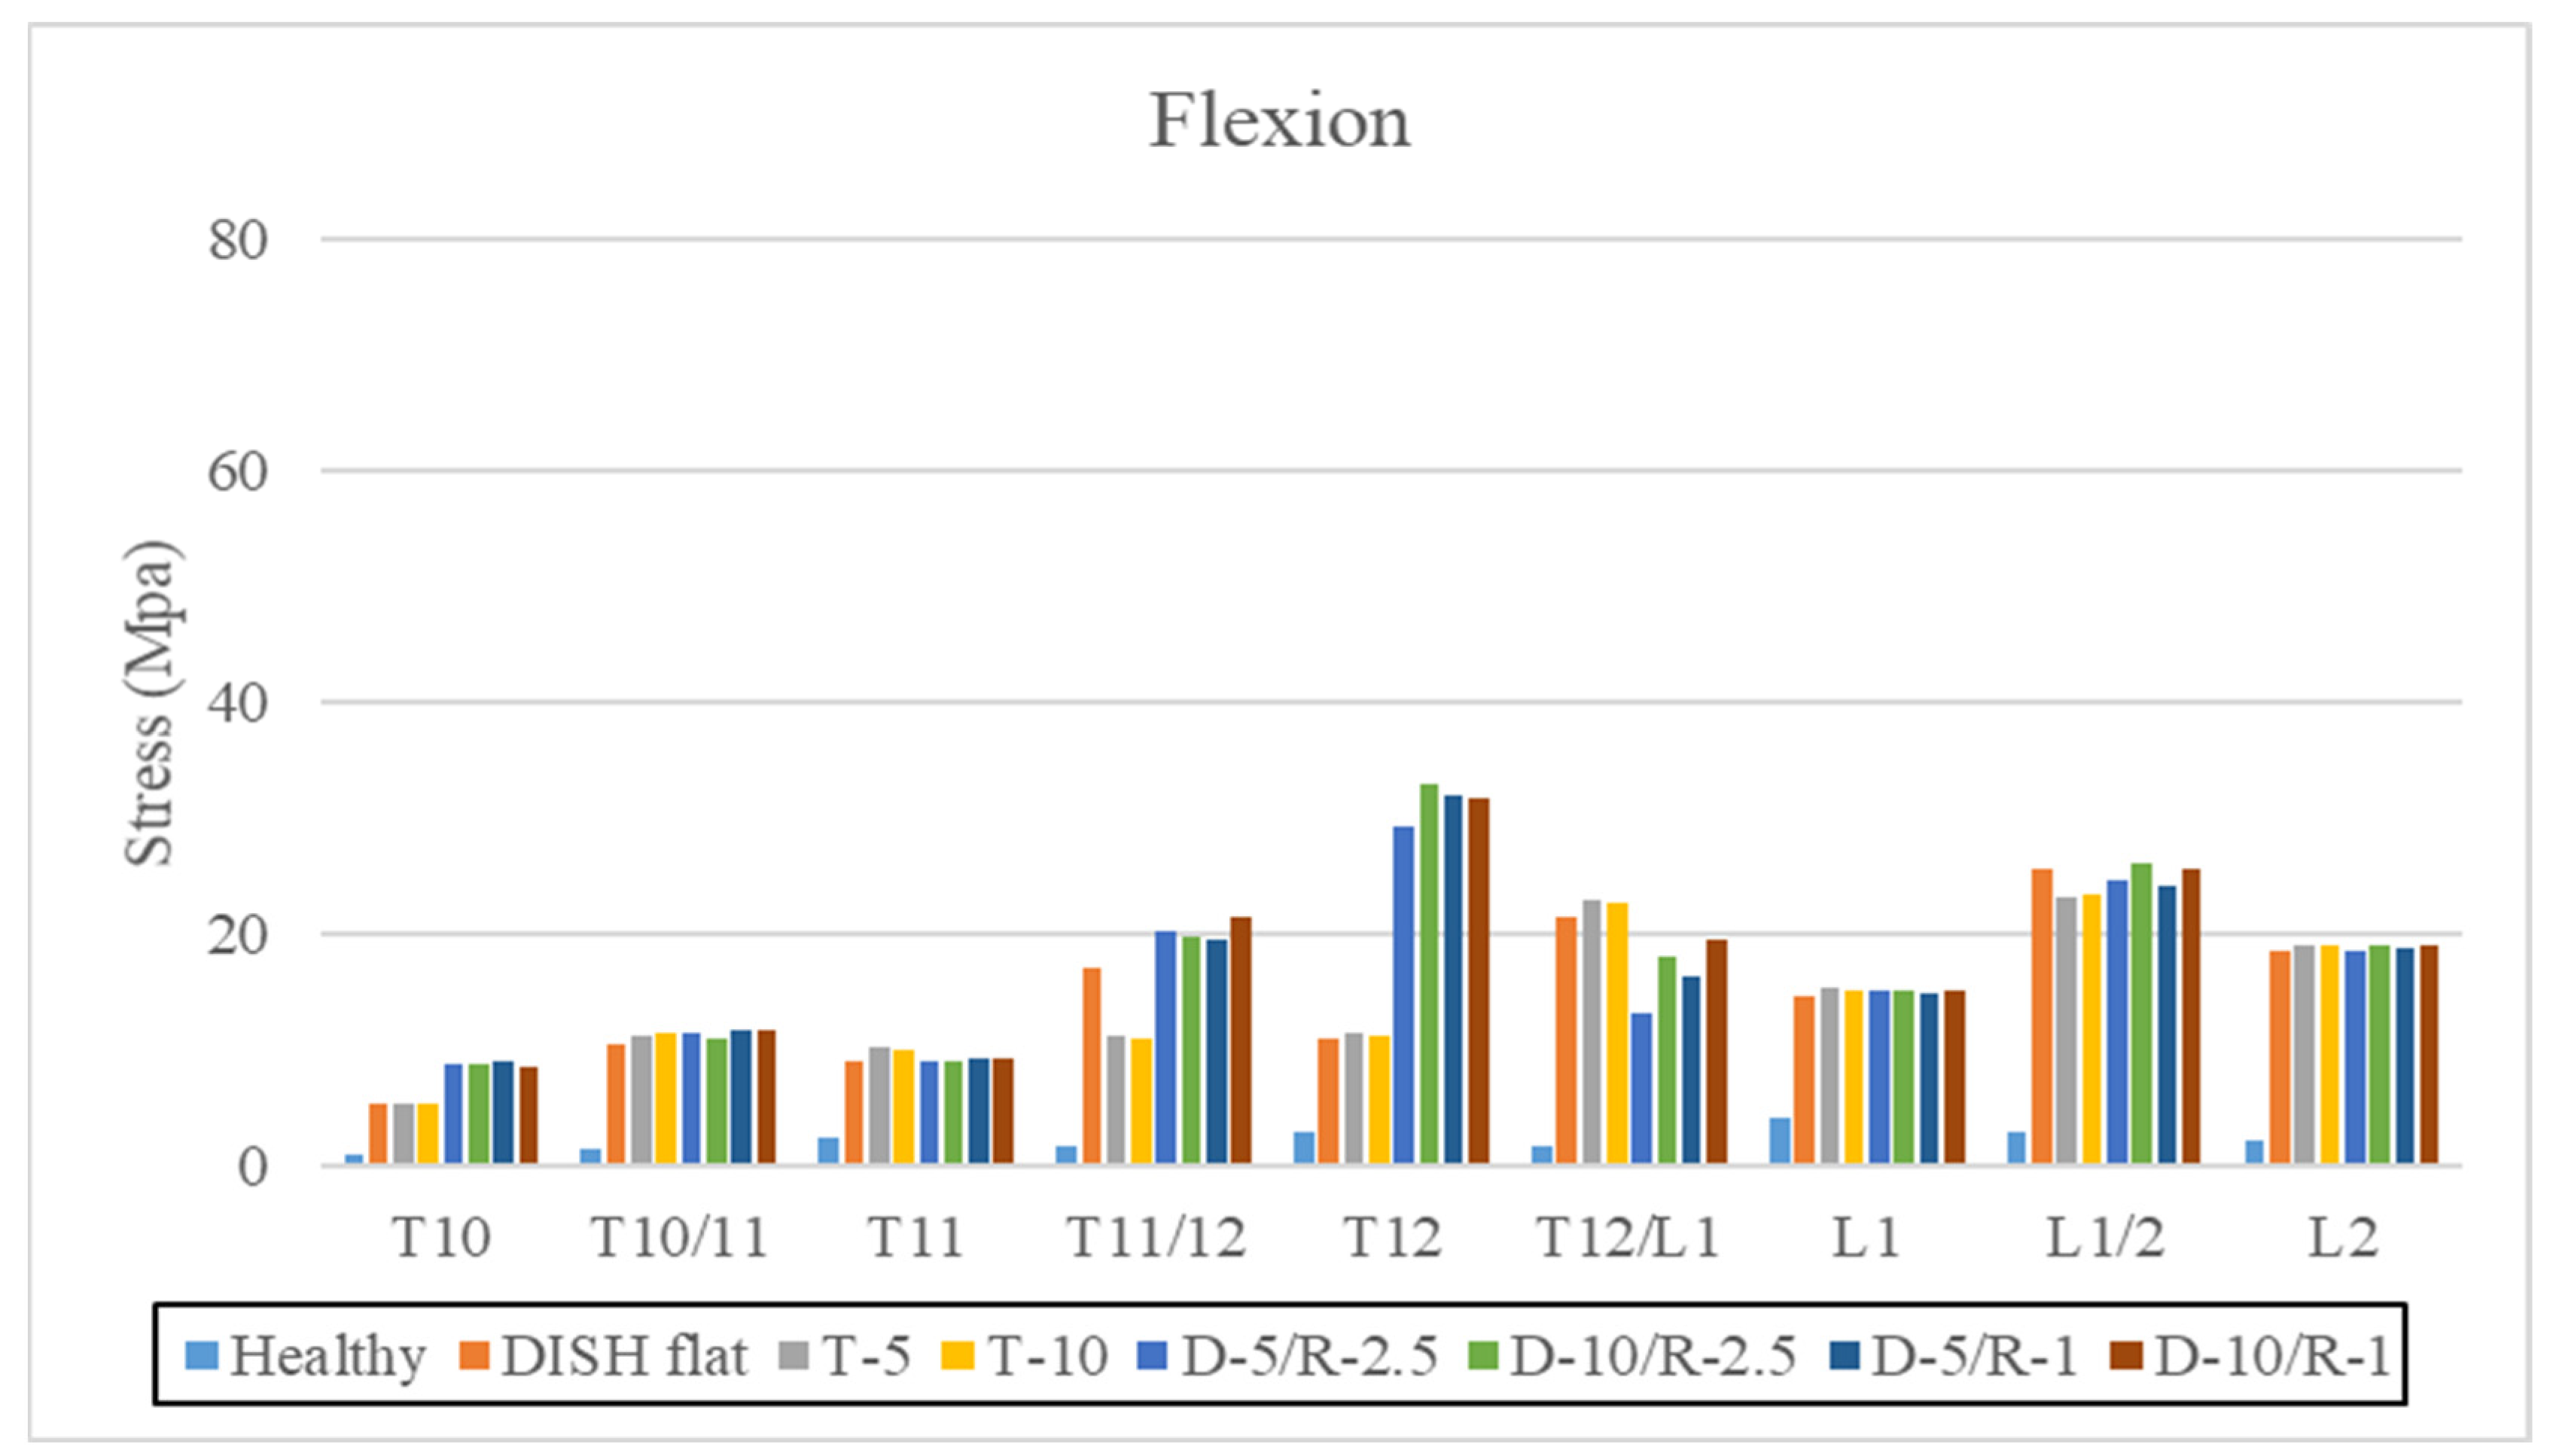
The highest value for maximum von Mises stress on the vertebral body and intervertebral disc (MPa) in flexion. The vertical axis is stress (MPa), and the horizontal axis is each vertebral body and intervertebral level.
3.2. Flexion
Maximum stress values at the center of the vertebral body and intervertebral disc from T10 to L2 vertebrae are shown in flexion (Table 4 and Figure 10).
Table 4.
The highest value for maximum von Mises stress on the vertebral body and intervertebral disc (MPa).
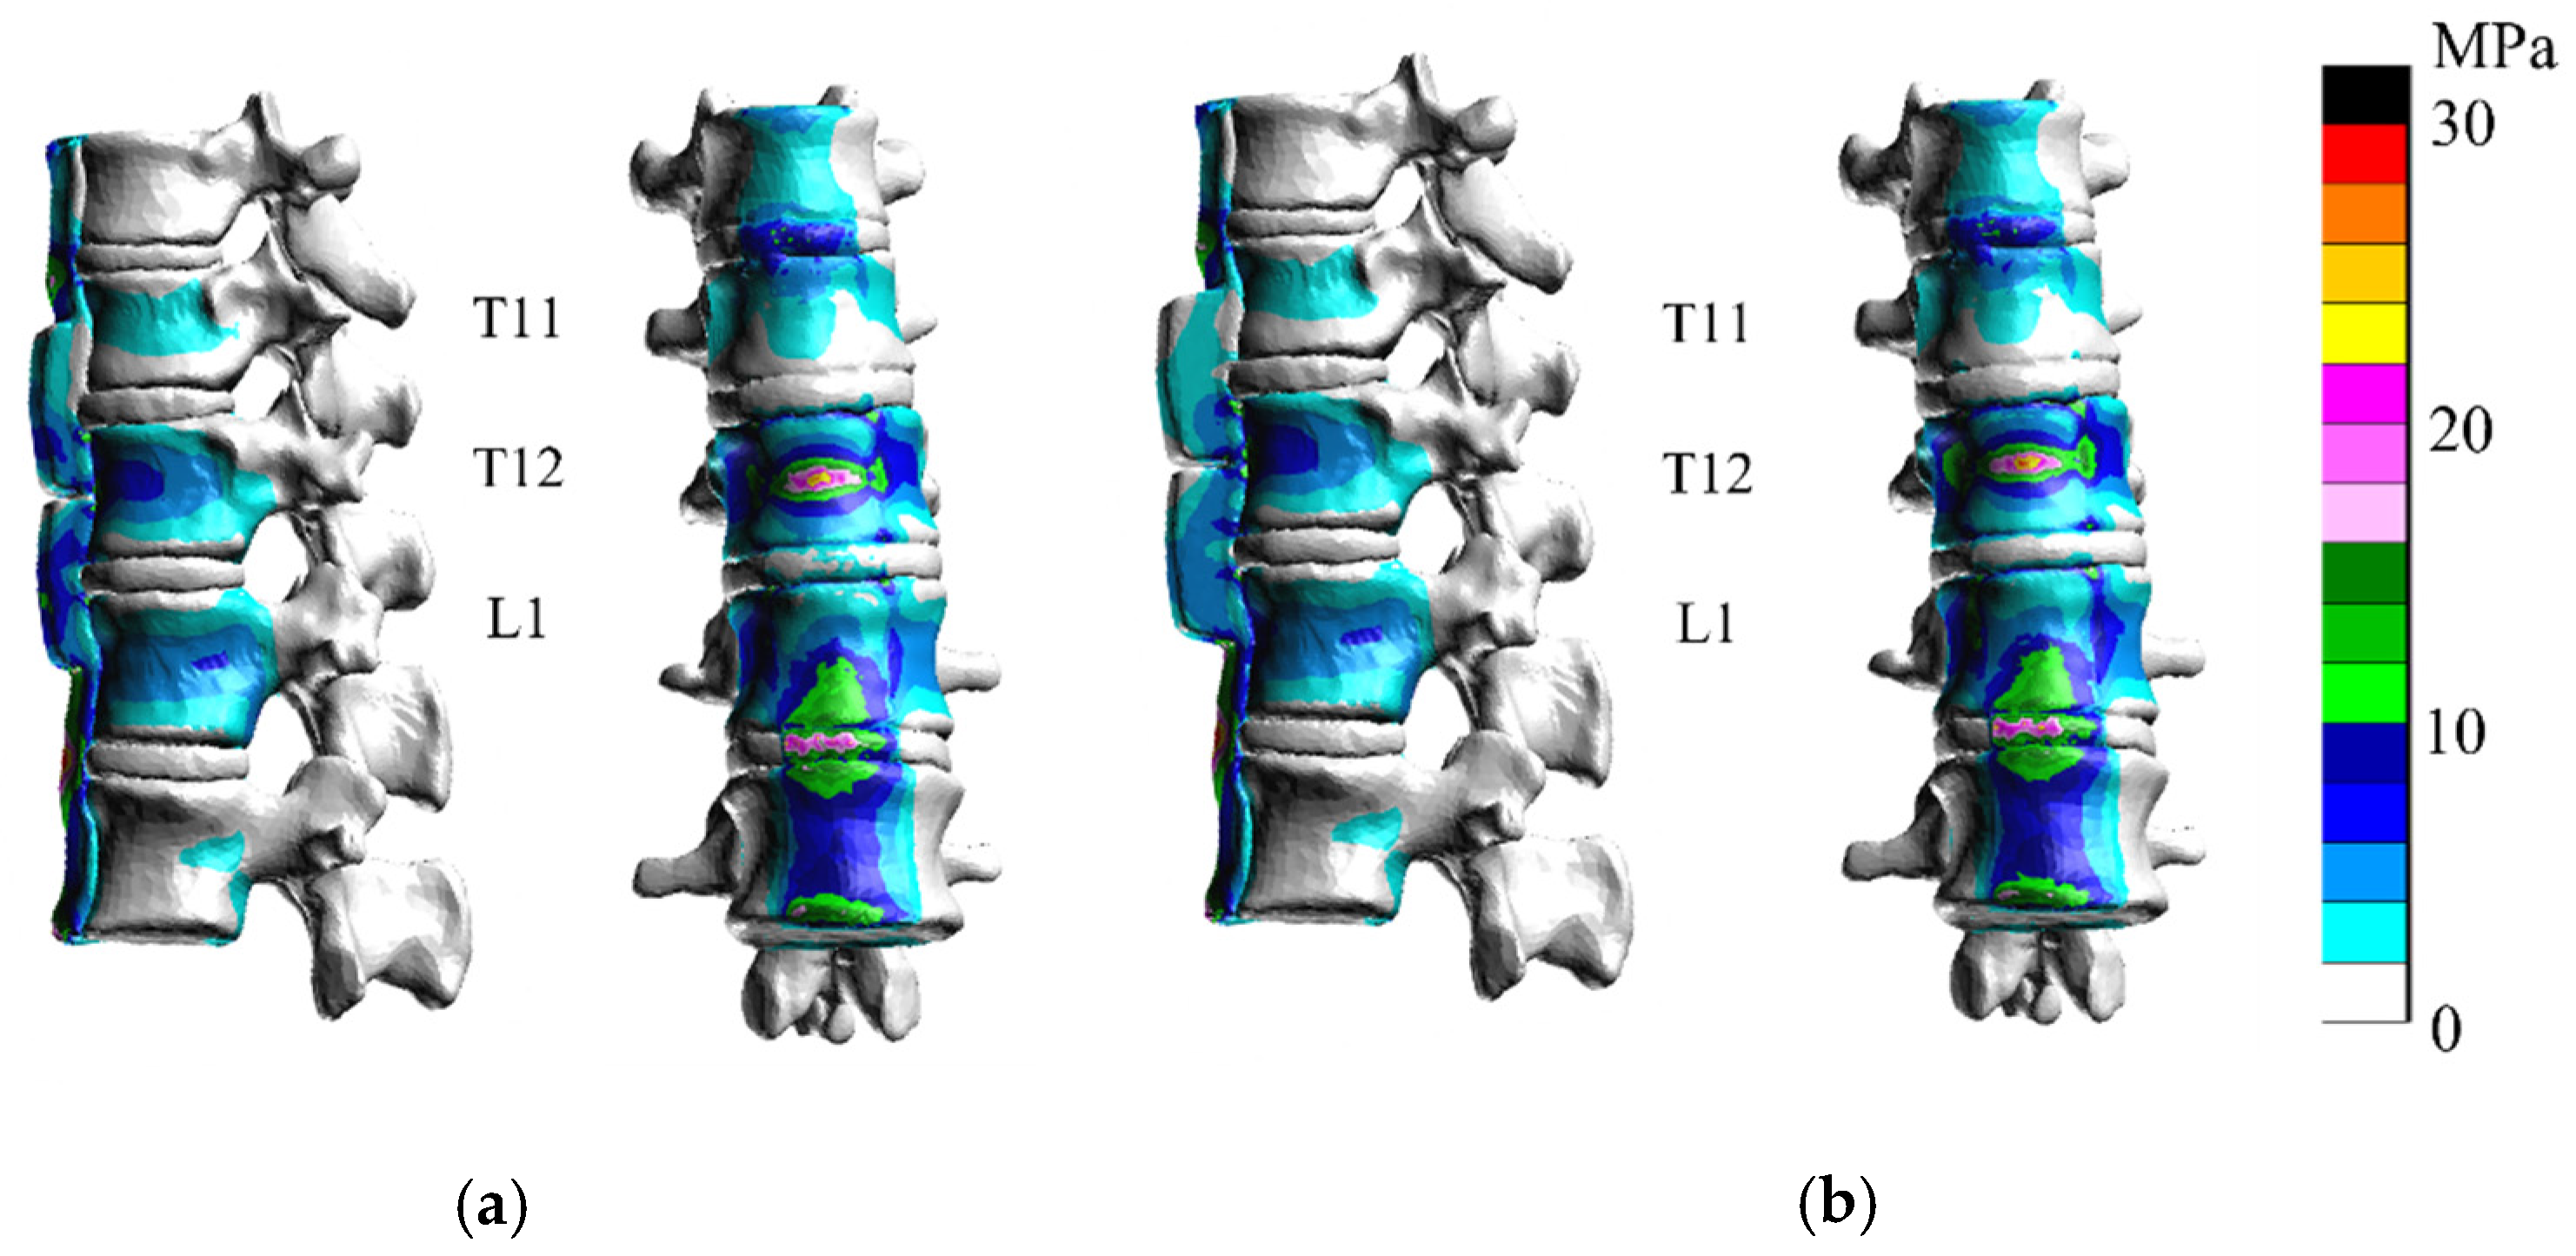
Comparisons between the healthy model and DISH flat model showed that stresses were greater on the vertebral body and intervertebral disc from T10 to L2 in flexion (Figure 11) than in the healthy model.

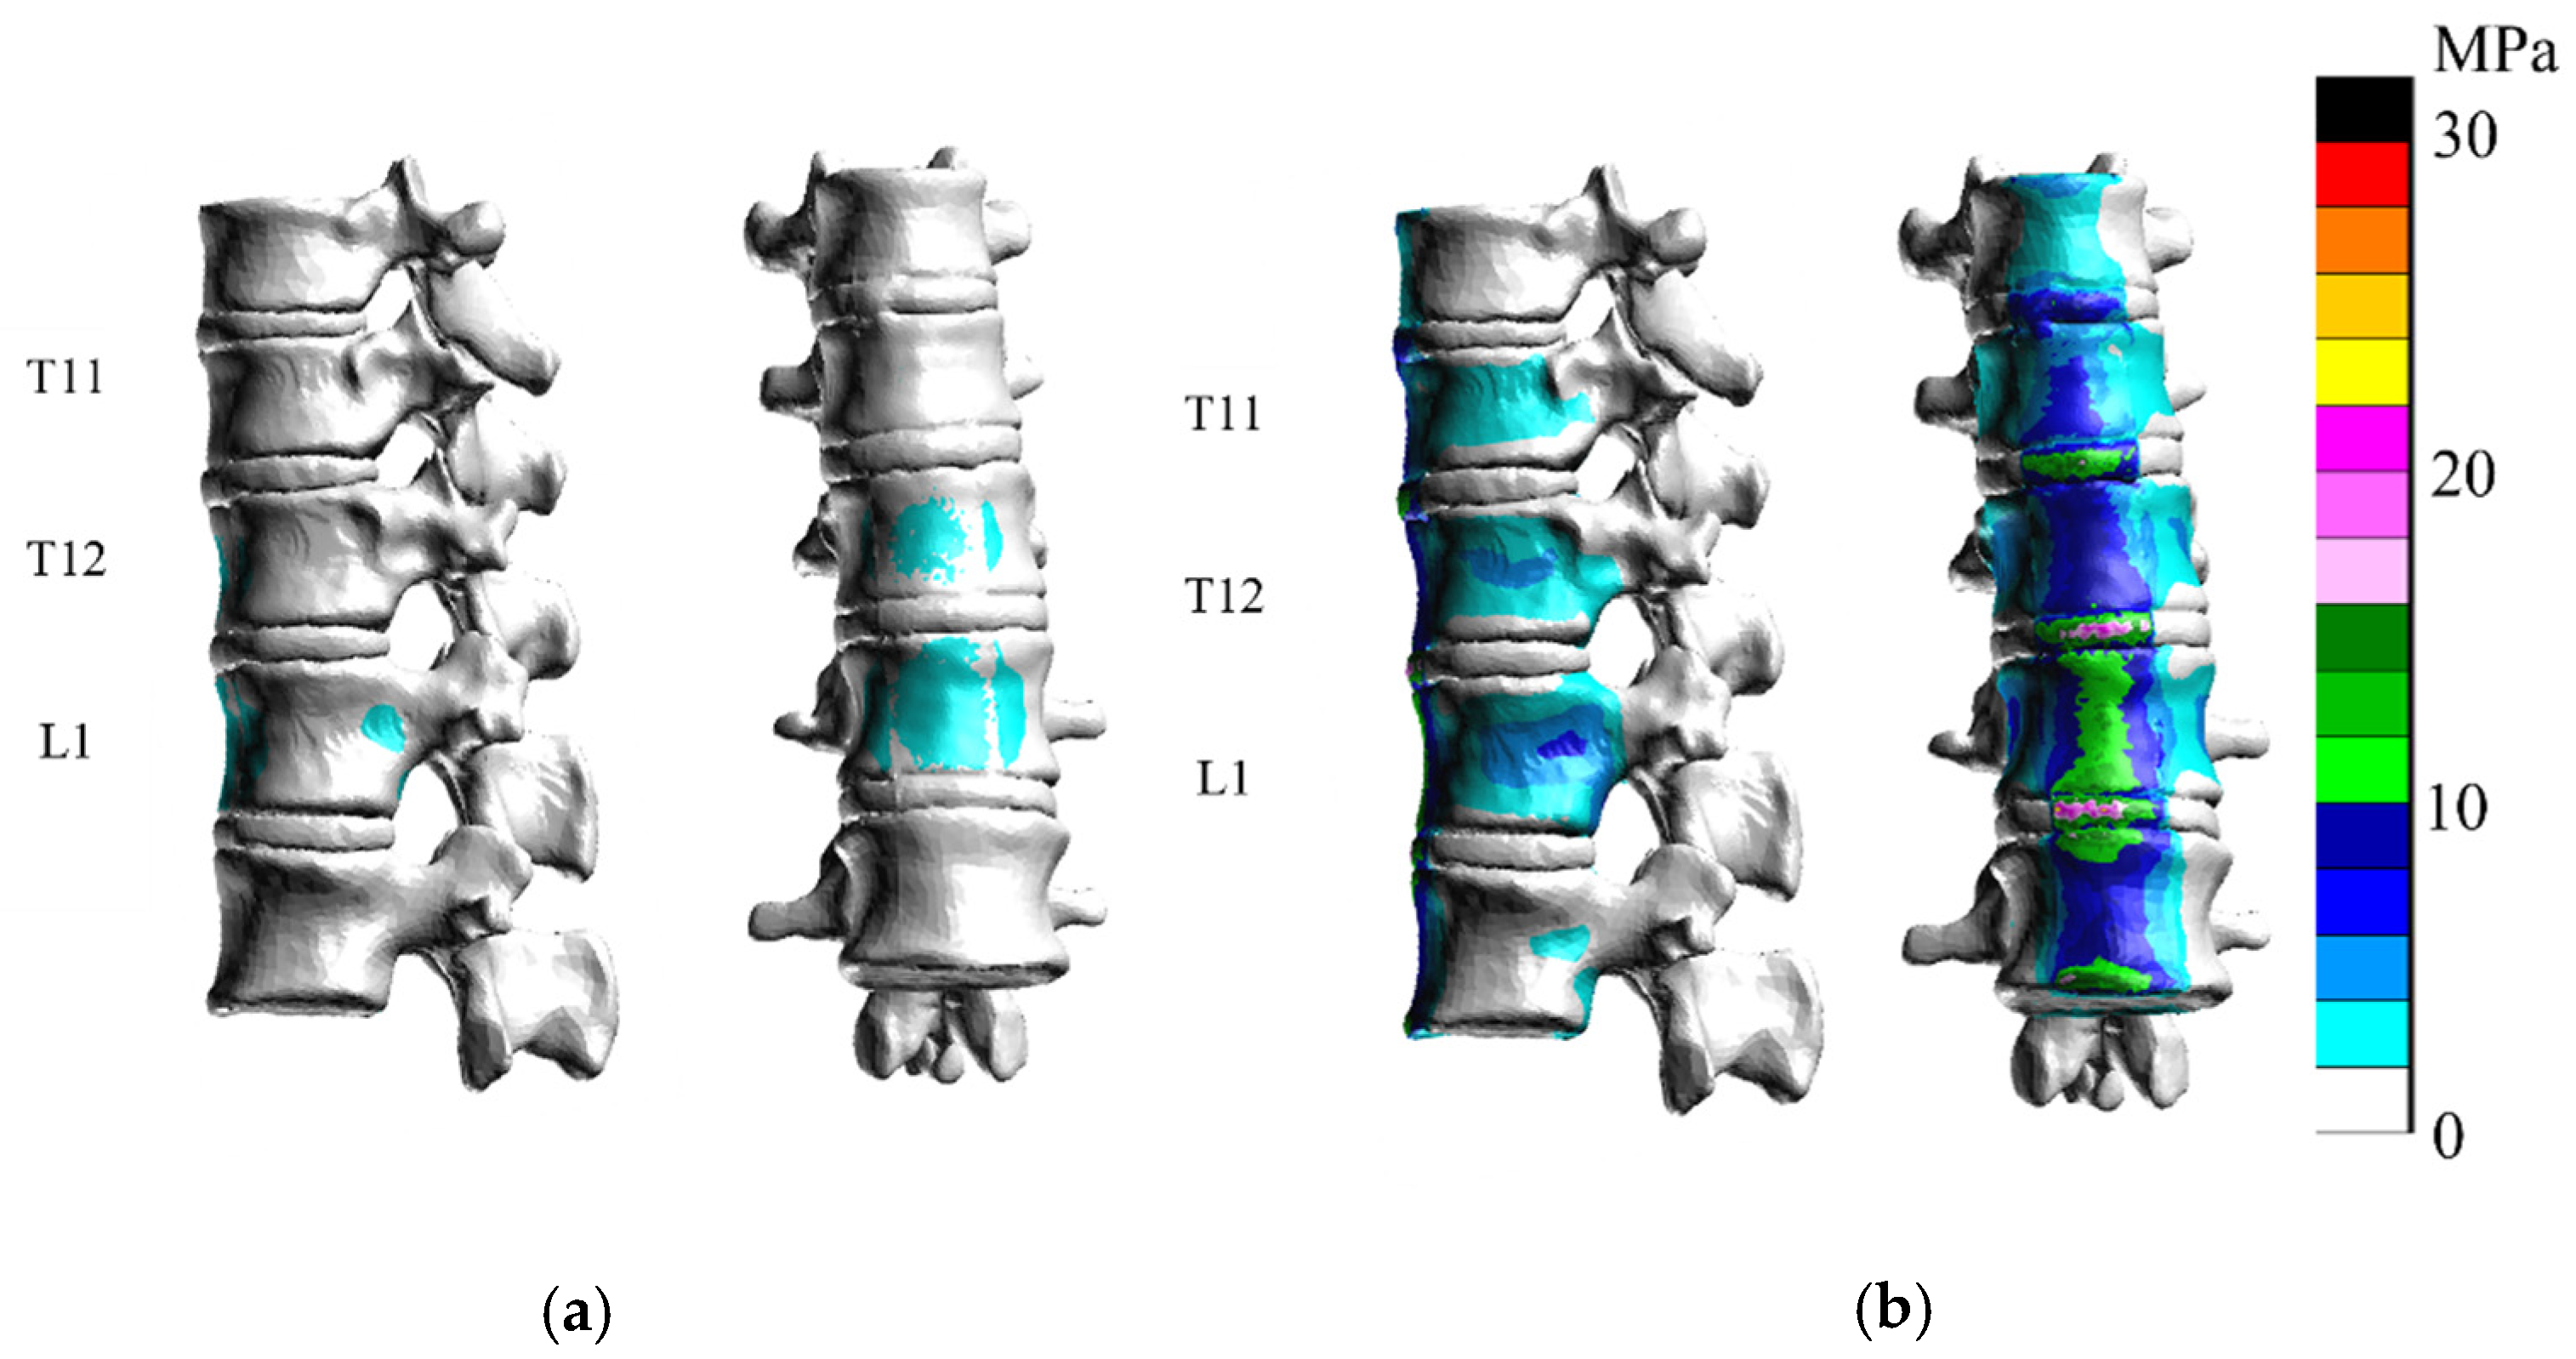
Figure 11.
Only vertebral bodies and discs are shown for clarity. The right bar is color-coded according to stress (MPa). Stress diagrams of (a) the healthy model and (b) the DISH flat model. Stresses were greater in the flat model in flexion than in the healthy model.
In the T-5 model and T-10 model, the stress on the vertebral body was similar with greater ossification in flexion; no significant differences were observed in stress, except for a decrease in intervertebral disc stress at T11–T12 (Figure 12).
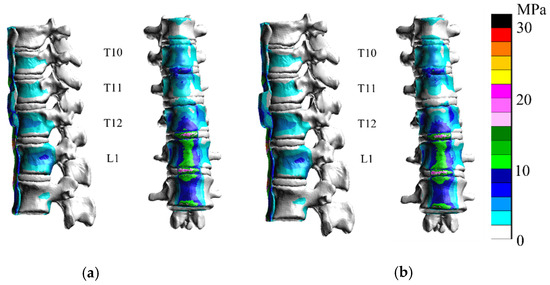
Figure 12.
In flexion analyses of T-5 (a) and T-10 (b), the stress on the intervertebral disc at T11–T12 was reduced, whereas that on the vertebral body was unchanged.
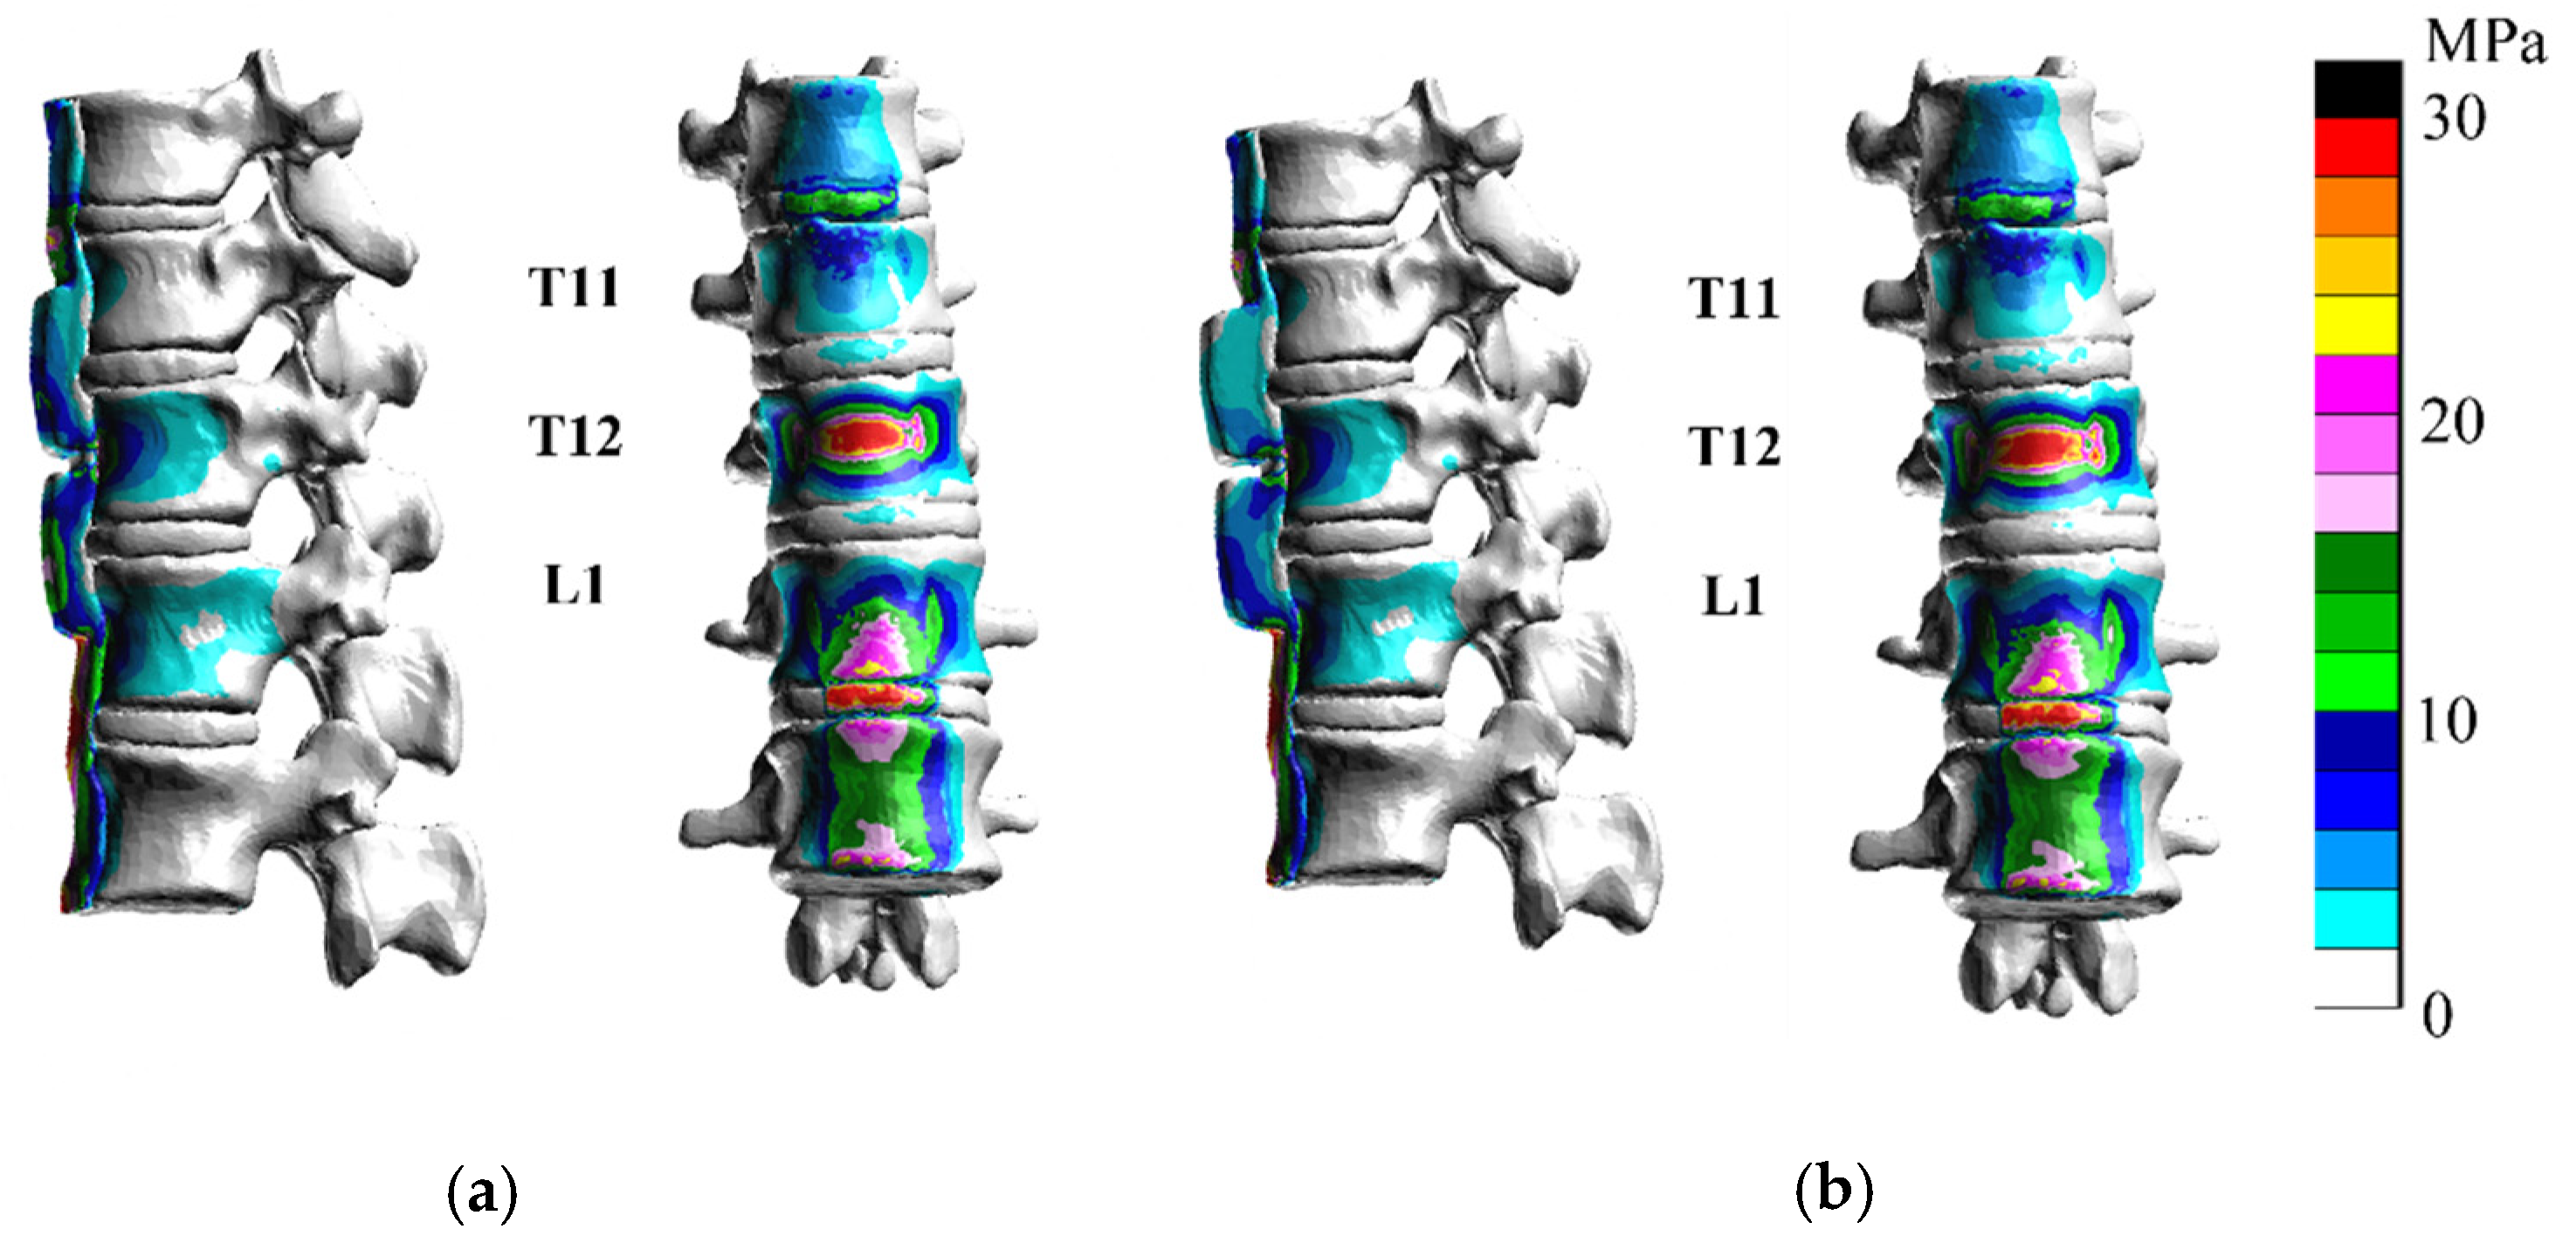
In D-5/R-2.5 and D-10/R-2.5 (Figure 13), the stress at the center of T12 increased as the groove at the discontinuity became deeper. The maximum stress at the center of each T12 vertebral body is shown in Figure 13. The results of the flexion analysis were similar to those obtained for the T12 vertebral body. The stress on the T11/12 disc was greater, while that on T12/L1 disc was less than that in the DISH model and the hypertrophic ossification model in flexion.
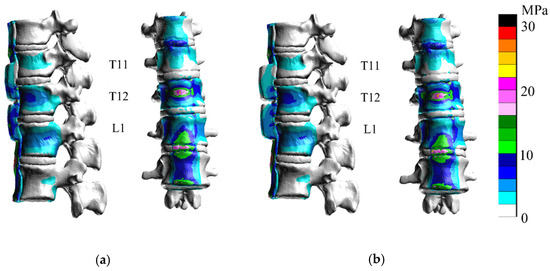
Figure 13.
In D-5/R-2.5 (a) and D-10/R-2.5 (b), the stress at the center of T12 increased at the discontinuity in flexion.
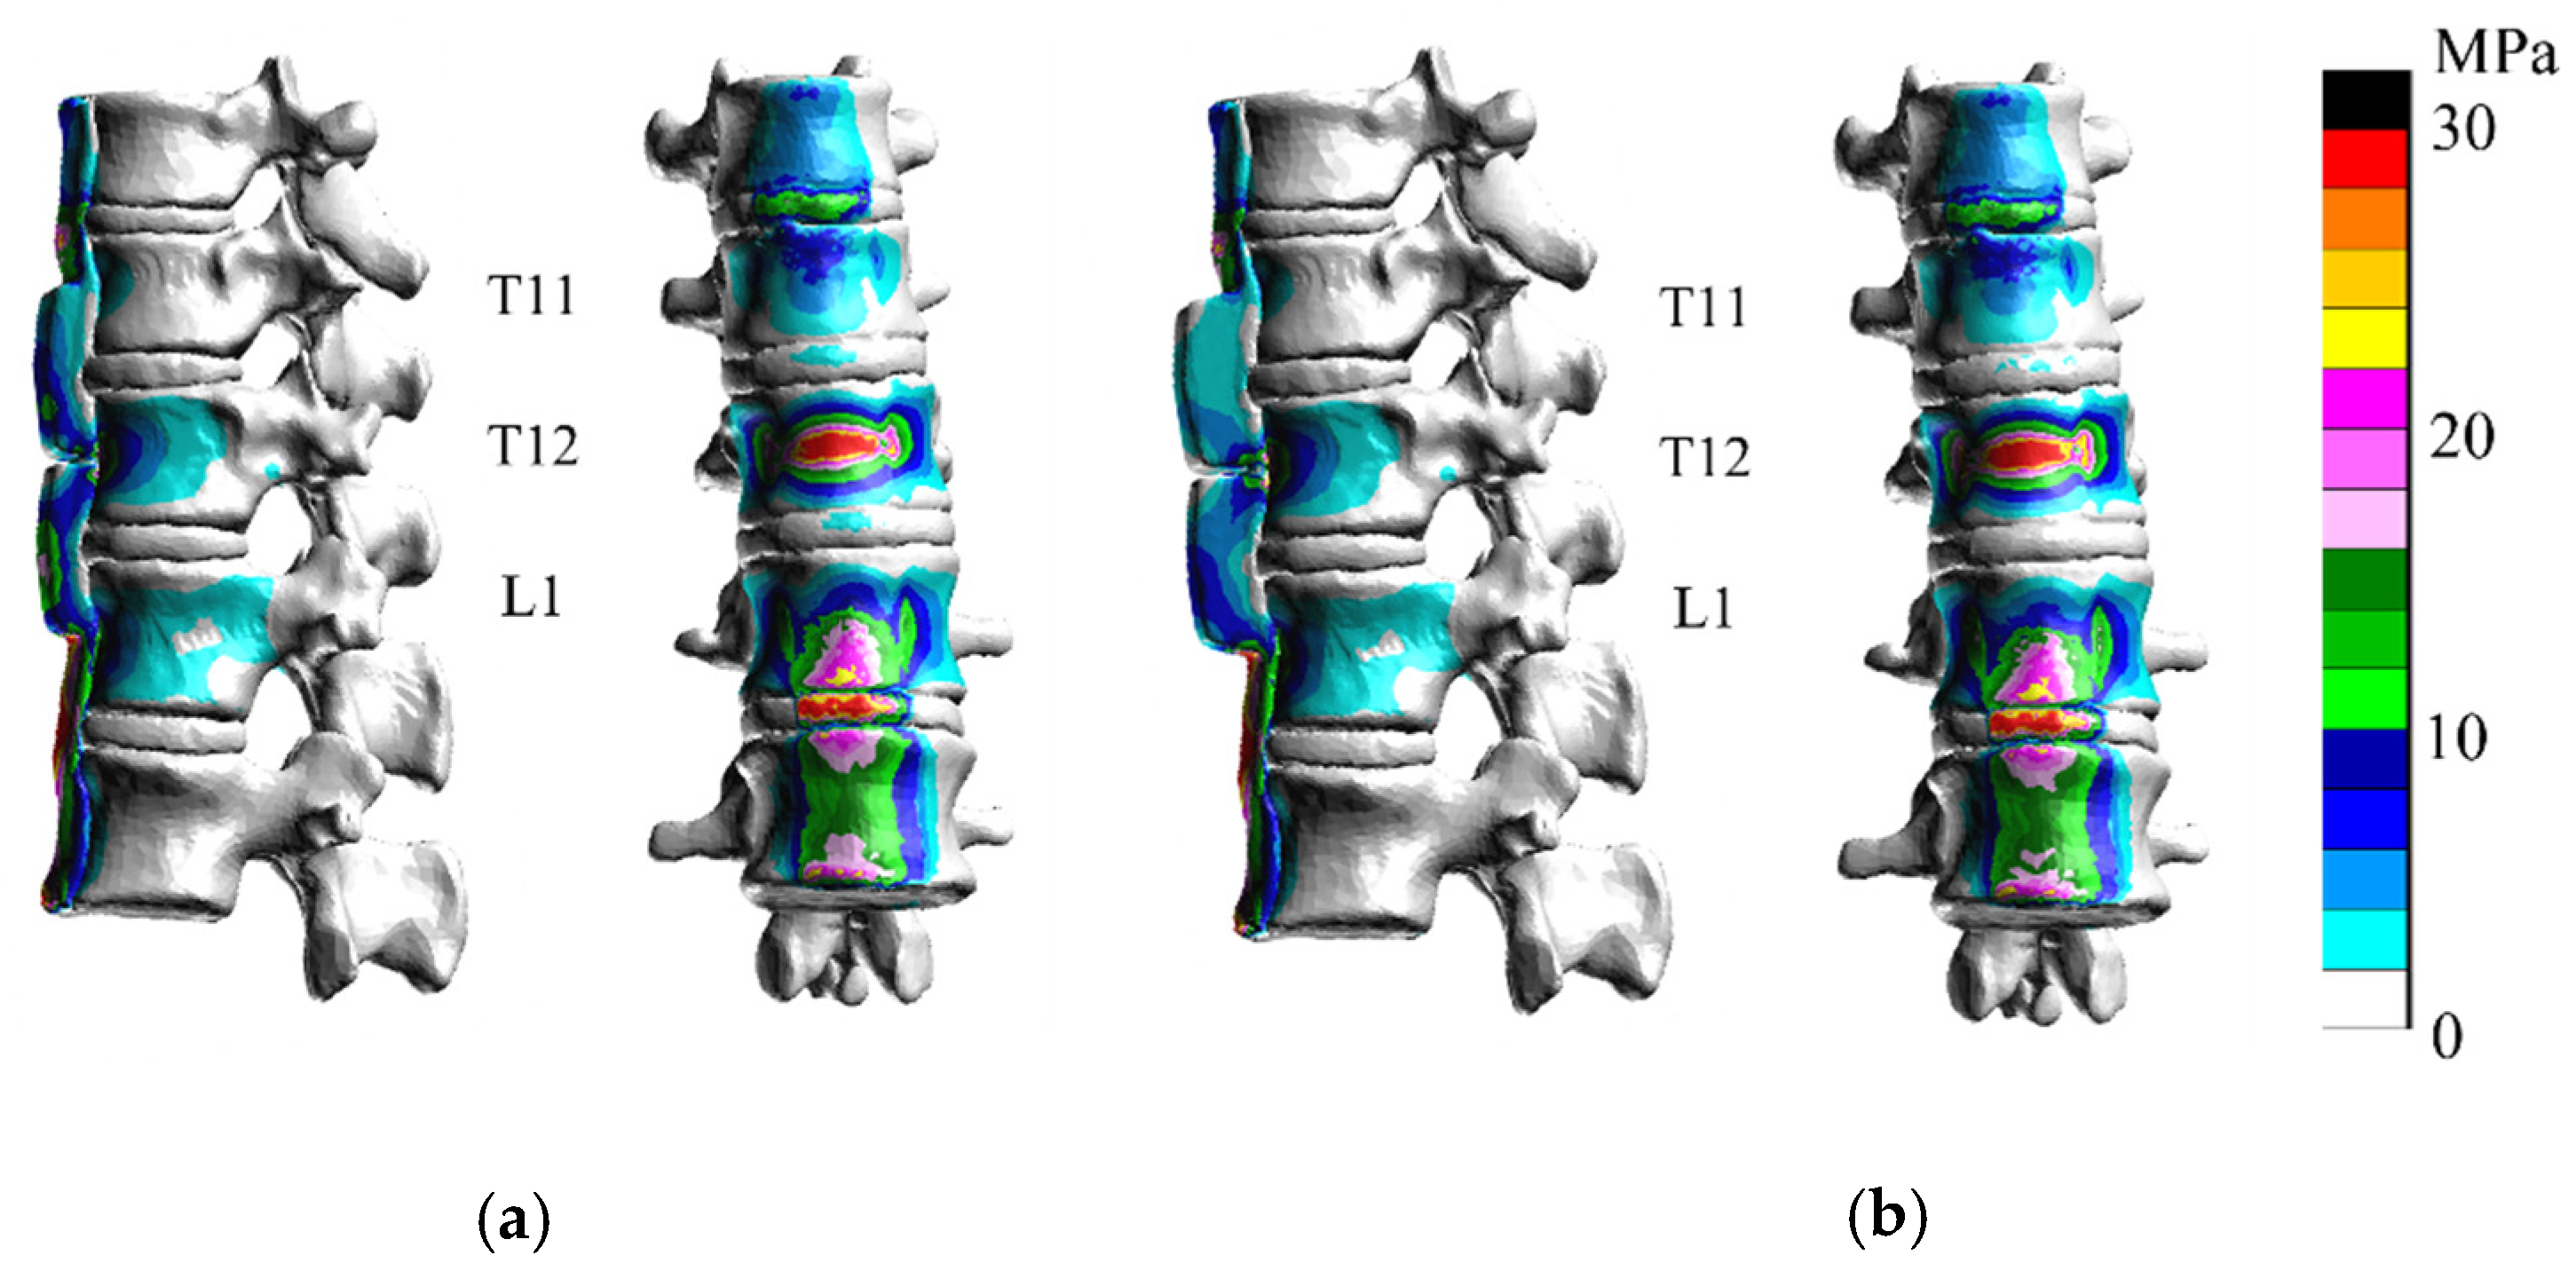
In D-5/R-1 and D-10/R-1 (Figure 14), the stress at the center of T12 increased. Maximum stress at the center of each T12 vertebral body is shown in Figure 14.
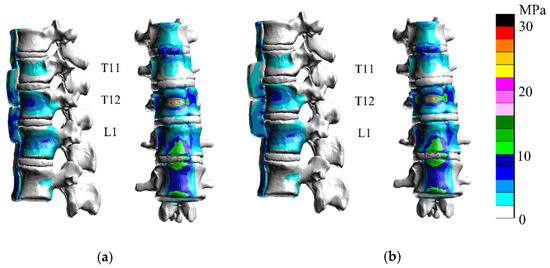
Figure 14.
In D-5/R-1 (a) and D-10/R-1 (b), the stress at the center of T12 increased at the discontinuity in flexion.
In the analysis of D-5/R-1, stress on the T12 vertebral body was greater than that in D-5/R-2.5, even with the same depth of ossification. However, with D-10/R-1, the stress on the T12 vertebral body was less than that with D-10/R-2.5 and D-5/R-1 in flexion. On the other hand, with D-5/R-1 and D-10/R-1, the stress on the T11/12 and T12/L1 discs increased. The stresses on other vertebral bodies and discs were similar.
4. Discussion
DISH is diagnosed based on the continuous calcification of four or more vertebrae, a maintained intervertebral disc height, or no intervertebral joint rigidity [1]. DISH restrains spinal range of motion and causes low back pain [14]. DISH may easily cause fracture in an inflexible spine and spinal damage [15]. This trauma must not be overlooked because the rate of bone union is low and the attenuation of neurological symptoms is difficult to achieve with conservative treatment [2]. However, in contrast to other spine injuries, the diagnosis of DISH is delayed [3,4,16]. One of the factors that make diagnosis difficult is that pre-existent abnormalities on spine radiographs may mask or obscure minimally displaced fractures [3]. Although previous studies reported good outcomes and minimally invasive surgery [17,18,19], the misdiagnosis of fractures and diagnostic delays need to be avoided. Because more than 50% of the patients were neurologically intact immediately after the injury, later neurological deterioration occurred in approximately 30% of the total patients [15]. Some previous studies have reported on the risks of trauma of DISH [3,4,16]. However, no report has evaluated the impact of ossification thickness and shape on the spine. Therefore, we considered it important to understand the biomechanics of DISH by analyzing the type of force applied to the vertebral body with different ossification shapes and thicknesses. Although cervical vertebrae are the most frequently injured, we analyzed the thoracolumbar spine transition area because the majority of spinal fractures occur in the thoracolumbar spine [17,20,21].
Recent studies conducted a fracture analysis via 3D-FEM of the vertebral region. Sairyo et al. performed an analysis of lumbar spondylolysis [22]. In addition, Zhao et al. [23] reported the findings of an analysis of compression fractures, while Liang et al. [24] conducted a 3D-FEM analysis of the effects of balloon kyphoplasty; however, only a few intervertebral analyses have been performed to date. Okamoto et al. [25] assessed pressure fractures at different angles of the spine. Nishida et al. [26] and Nakashima et al. [27] conducted a compression fracture analysis of a whole-spine model generated from medical images. However, an analysis and visualization of the stress applied to the vertebral body by changing the ossification pattern around the vertebral body, such as that which occurs in DISH, has not yet been performed. A more detailed understanding of the shapes and discontinuities that are most likely to cause damage may contribute to the prevention of misdiagnoses.
The present study is the first to demonstrate that the stress on the vertebral body was greater with ossification of the anterior longitudinal ligament than with a healthy ligament. The results obtained herein showed the effects of reduced flexibility. Calcification or ossification of the ligament was identified as a contributing factor to increased stress, which may induce vertebral fractures. Okada et al. reported that all of the subjects had anterior and middle column fractures [15]. In this analysis, the greatest increase in stress was from the anterior in both flexion and extension. We found that the partial hypertrophy of ossification did not affect vertebral stress in the ossified area during extension and flexion, where it had an impact on intervertebral discs. The thickness of local ossification did not appear to affect the vertebral body. Furthermore, stresses were more likely to increase at the center of vertebrae with greater ossification and discontinuity such as cases with D-5/R-2.5, D-5/R-1, and D-10/R-2.5. Therefore, if external forces are applied to a case with large ossification and discontinuities, the vertebral groove may fracture. However, this hypothesis was not applied to cases with D-10/R-1. This may be due to the thickness of ossification and the small gap in the curvature, which may have stabilized the vertebral body. On the other hand, the stresses on the cranial and caudal intervertebral discs of discontinuity may have increased during flexion. Okada et al. reported that later neurological deterioration can occur due to a marked instability between the rostral and caudal fused segments [15]. Because some predictions are possible in this analysis, the vertebral body and intervertebral disc around the ossification need to be fully evaluated based on the shape and depth of the bone and the injury mechanism.
The present study had some limitations: Only one type of ossification level, one type of load, one type of bone strength, and one type of spinal alignment were considered. The load was not assumed to be in various alignments, the load of body weight was not analyzed, and the external force was assumed to be a rapid shearing force, not a vertical trauma, such as a buttock injury. Ossification sites are often located to the anterior right of the vertebral body, but not in the middle [28]. Therefore, stresses may change depending on the ossification site. It is not limited to this analysis, but it is a level where increased stress does not necessarily mean fracture. The anterior longitudinal ligament on the caudal side of the vertebral head is ossified and continuous, and posterior elements, such as the vertebral arch, are not turgid. This analysis takes several months to create and analyze a model, which is not at a level that allows for tailor-made diagnosis and treatment. This resolution will require future development of analysis.
However, our analysis showed that the spine is less flexible and more prone to the increased stress of the vertebral body and disc in patients with DISH. Furthermore, the size of ossification and the shape of the groove make it easier to predict levels of increased stress, and an awareness of the possible level of pain and fractures may be useful for clinicians.
5. Conclusions
The vertebrae of patients with DISH are more susceptible to stress. Furthermore, depending on the morphology of ossification, the stresses on the vertebrae and intervertebral discs differ even with similar loads. Though there is no confirmation concerning effective treatment and diagnosis, an examination of ossification geometry may help surgeons decide the thoracolumbar spine’s stress elevated position in patients with DISH, thereby contributing to the understanding of the pathogenesis of pain.
Author Contributions
Conceptualization, N.N.; data curation, Y.Y., R.K. and R.T.; formal analysis, M.F. (Masahiro Fuchida), R.T. and F.J.; funding acquisition, N.N.; methodology, N.N., Y.I., H.S. and M.F. (Masahiro Funaba) project administration, N.N. and X.C.; supervision, T.S.; validation, M.F. (Masahiro Fuchida), R.T., and N.N.; visualization, T.S.; writing—original draft, N.N.; writing—review and editing, X.C., J.O. and Y.I. All authors have read and agreed to the published version of the manuscript.
Funding
This work was supported by JSPS KAKENHI grant JP 15K20002 and a translational promotion grant from Yamaguchi University School of Medicine Affiliated Hospital.
Institutional Review Board Statement
The present study was approved by the Ethics Committee at the Center for Clinical Research, Yamaguchi University Hospital (Ube, Japan; approval No. H28-054). Written informed consent for this study and its publication was obtained from all subjects.
Informed Consent Statement
Informed consent was obtained from all subjects involved in the study.
Data Availability Statement
The data presented in this study are available.
Acknowledgments
Katharine O’Moore-Klopf, ELS (East Setauket, NY, USA), a medical editor provided professional English language editing of the manuscript.
Conflicts of Interest
The authors declare no conflict of interest.
References
- Resnick, D.; Guerra, J., Jr.; Robinson, C.A.; Vint, V.C. Association of diffuse idiopathic skeletal hyperostosis (DISH) and calcification and ossification of the posterior longitudinal ligament. AJR Am. J. Roentgenol. 1978, 131, 1049–1053. [Google Scholar] [CrossRef] [Green Version]
- Okada, E.; Shiono, Y.; Nishida, M.; Mima, Y.; Funao, H.; Shimizu, K.; Kato, M.; Fukuda, K.; Fujita, N.; Yagi, M.; et al. Spinal fractures in diffuse idiopathic skeletal hyperostosis: Advantages of percutaneous pedicle screw fixation. J. Orthop. Surg. (Hong Kong) 2019, 27, 2309499019843407. [Google Scholar] [CrossRef] [Green Version]
- Westerveld, L.A.; van Bemmel, J.C.; Dhert, W.J.; Oner, F.C.; Verlaan, J.J. Clinical outcome after traumatic spinal fractures in patients with ankylosing spinal disorders compared with control patients. Spine J. 2014, 14, 729–740. [Google Scholar] [CrossRef]
- Westerveld, L.A.; Verlaan, J.J.; Oner, F.C. Spinal fractures in patients with ankylosing spinal disorders: A systematic review of the literature on treatment, neurological status and complications. Eur. Spine J. 2009, 18, 145–156. [Google Scholar] [CrossRef] [Green Version]
- Bruges-Armas, J.; Couto, A.R.; Timms, A.; Santos, M.R.; Bettencourt, B.F.; Peixoto, M.J.; Colquhoun, K.; McNally, E.G.; Carneiro, V.; Herrero-Beaumont, G.; et al. Ectopic calcification among families in the Azores: Clinical and radiologic manifestations in families with diffuse idiopathic skeletal hyperostosis and chondrocalcinosis. Arthritis Rheum. 2006, 54, 1340–1349. [Google Scholar] [CrossRef]
- Oudkerk, S.F.; de Jong, P.A.; Attrach, M.; Luijkx, T.; Buckens, C.F.; Mali, W.P.; Oner, F.C.; Resnick, D.L.; Vliegenthart, R.; Verlaan, J.J. Diagnosis of diffuse idiopathic skeletal hyperostosis with chest computed tomography: Inter-observer agreement. Eur Radiol 2017, 27, 188–194. [Google Scholar] [CrossRef] [Green Version]
- Fujimori, T.; Watabe, T.; Iwamoto, Y.; Hamada, S.; Iwasaki, M.; Oda, T. Prevalence, Concomitance, and Distribution of Ossification of the Spinal Ligaments: Results of Whole Spine CT Scans in 1500 Japanese Patients. Spine (Phila Pa 1976) 2016, 41, 1668–1676. [Google Scholar] [CrossRef]
- Galbusera, F.; Bellini, C.M.; Anasetti, F.; Ciavarro, C.; Lovi, A.; Brayda-Bruno, M. Rigid and flexible spinal stabilization devices: A biomechanical comparison. Med. Eng. Phys. 2011, 33, 490–496. [Google Scholar] [CrossRef]
- Lu, Y.M.; Hutton, W.C.; Gharpuray, V.M. Can variations in intervertebral disc height affect the mechanical function of the disc? Spine (Phila Pa 1976) 1996, 21, 2208–2216; discussion 2217. [Google Scholar] [CrossRef]
- Cowin, S.C. The mechanical and stress adaptive properties of bone. Ann. Biomed. Eng. 1983, 11, 263–295. [Google Scholar] [CrossRef]
- Cowin, S.C. Mechanical modeling of the stress adaptation process in bone. Calcif. Tissue Int. 1984, 36 (Suppl. 1), S98–S103. [Google Scholar] [CrossRef]
- Périé, D.; Hobatho, M.C.; Baunin, C.; Sales De Gauzy, J. Personalised mechanical properties of scoliotic vertebrae determined in vivo using tomodensitometry. Comput. Methods Biomech. Biomed. Eng. 2002, 5, 161–165. [Google Scholar] [CrossRef]
- Ottardi, C.; Galbusera, F.; Luca, A.; Prosdocimo, L.; Sasso, M.; Brayda-Bruno, M.; Villa, T. Finite element analysis of the lumbar destabilization following pedicle subtraction osteotomy. Med. Eng. Phys. 2016, 38, 506–509. [Google Scholar] [CrossRef]
- Holton, K.F.; Denard, P.J.; Yoo, J.U.; Kado, D.M.; Barrett-Connor, E.; Marshall, L.M. Diffuse idiopathic skeletal hyperostosis and its relation to back pain among older men: The MrOS Study. Semin Arthritis Rheum. 2011, 41, 131–138. [Google Scholar] [CrossRef] [Green Version]
- Okada, E.; Yoshii, T.; Yamada, T.; Watanabe, K.; Katsumi, K.; Hiyama, A.; Watanabe, M.; Nakagawa, Y.; Okada, M.; Endo, T.; et al. Spinal fractures in patients with Diffuse idiopathic skeletal hyperostosis:A nationwide multi-institution survey. J. Orthop. Sci. 2019, 24, 601–606. [Google Scholar] [CrossRef]
- Sedney, C.L.; Daffner, S.D.; Obafemi-Afolabi, A.; Gelb, D.; Ludwig, S.; Emery, S.E.; France, J.C. A Comparison of Open and Percutaneous Techniques in the Operative Fixation of Spinal Fractures Associated with Ankylosing Spinal Disorders. Int. J. Spine Surg. 2016, 10, 23. [Google Scholar] [CrossRef] [PubMed] [Green Version]
- Caron, T.; Bransford, R.; Nguyen, Q.; Agel, J.; Chapman, J.; Bellabarba, C. Spine fractures in patients with ankylosing spinal disorders. Spine (Phila Pa 1976) 2010, 35, E458–E464. [Google Scholar] [CrossRef] [PubMed]
- Krüger, A.; Frink, M.; Oberkircher, L.; El-Zayat, B.F.; Ruchholtz, S.; Lechler, P. Percutaneous dorsal instrumentation for thoracolumbar extension-distraction fractures in patients with ankylosing spinal disorders: A case series. Spine J. 2014, 14, 2897–2904. [Google Scholar] [CrossRef] [PubMed]
- Ishii, K.; Shiono, Y.; Funao, H.; Singh, K.; Matsumoto, M. A Novel Groove-Entry Technique for Inserting Thoracic Percutaneous Pedicle Screws. Clin. Spine Surg. 2017, 30, 57–64. [Google Scholar] [CrossRef]
- Hendrix, R.W.; Melany, M.; Miller, F.; Rogers, L.F. Fracture of the spine in patients with ankylosis due to diffuse skeletal hyperostosis: Clinical and imaging findings. AJR Am. J. Roentgenol. 1994, 162, 899–904. [Google Scholar] [CrossRef] [Green Version]
- Okada, E.; Tsuji, T.; Shimizu, K.; Kato, M.; Fukuda, K.; Kaneko, S.; Ogawa, J.; Watanabe, K.; Ishii, K.; Nakamura, M.; et al. CT-based morphological analysis of spinal fractures in patients with diffuse idiopathic skeletal hyperostosis. J. Orthop. Sci. 2017, 22, 3–9. [Google Scholar] [CrossRef]
- Sairyo, K.; Goel, V.K.; Masuda, A.; Vishnubhotla, S.; Faizan, A.; Biyani, A.; Ebraheim, N.; Yonekura, D.; Murakami, R.; Terai, T. Three-dimensional finite element analysis of the pediatric lumbar spine. Part I: Pathomechanism of apophyseal bony ring fracture. Eur Spine J. 2006, 15, 923–929. [Google Scholar] [CrossRef] [Green Version]
- Zhao, W.T.; Qin, D.P.; Zhang, X.G.; Wang, Z.P.; Tong, Z. Biomechanical effects of different vertebral heights after augmentation of osteoporotic vertebral compression fracture: A three-dimensional finite element analysis. J. Orthop. Surg. Res. 2018, 13, 32. [Google Scholar] [CrossRef] [Green Version]
- Liang, D.; Ye, L.Q.; Jiang, X.B.; Yang, P.; Zhou, G.Q.; Yao, Z.S.; Zhang, S.C.; Yang, Z.D. Biomechanical effects of cement distribution in the fractured area on osteoporotic vertebral compression fractures: A three-dimensional finite element analysis. J. Surg. Res. 2015, 195, 246–256. [Google Scholar] [CrossRef]
- Okamoto, Y.; Murakami, H.; Demura, S.; Kato, S.; Yoshioka, K.; Hayashi, H.; Sakamoto, J.; Kawahara, N.; Tsuchiya, H. The effect of kyphotic deformity because of vertebral fracture: A finite element analysis of a 10° and 20° wedge-shaped vertebral fracture model. Spine J. 2015, 15, 713–720. [Google Scholar] [CrossRef]
- Nishida, N.; Ohgi, J.; Jiang, F.; Ito, S.; Imajo, Y.; Suzuki, H.; Funaba, M.; Nakashima, D.; Sakai, T.; Chen, X. Finite Element Method Analysis of Compression Fractures on Whole-Spine Models Including the Rib Cage. Comput. Math. Methods Med. 2019, 2019, 8348631. [Google Scholar] [CrossRef] [Green Version]
- Nakashima, D.; Kanchiku, T.; Nishida, N.; Ito, S.; Ohgi, J.; Suzuki, H.; Imajo, Y.; Funaba, M.; Chen, X.; Taguchi, T. Finite element analysis of compression fractures at the thoracolumbar junction using models constructed from medical images. Exp. Ther. Med. 2018, 15, 3225–3230. [Google Scholar] [CrossRef]
- Belanger, T.A.; Rowe, D.E. Diffuse idiopathic skeletal hyperostosis: Musculoskeletal manifestations. J. Am. Acad. Orthop. Surg. 2001, 9, 258–267. [Google Scholar] [CrossRef]


Publisher’s Note: MDPI stays neutral with regard to jurisdictional claims in published maps and institutional affiliations. |
© 2021 by the authors. Licensee MDPI, Basel, Switzerland. This article is an open access article distributed under the terms and conditions of the Creative Commons Attribution (CC BY) license (https://creativecommons.org/licenses/by/4.0/).