Article

Improving Utilization Efficiency and Drivers’ Degree of Satisfaction in Urban Complex Parking Lot through Modelling the Dynamic Allocation of Parking Spaces

1
Jiangsu Key Laboratory of Urban ITS, Southeast University, Nanjing 211189, China
2
Jiangsu Province Collaborative Innovation Center of Modern Urban Traffic Technologies, Southeast University, Nanjing 211189, China
3
School of Transportation, Southeast University, Nanjing 211189, China
4
National Demonstration Center for Experimental Road and Traffic Engineering Education, Southeast University, Nanjing 211189, China
5
Nanjing Parking Domain Technology Institute, Nanjing 210019, China
*
Author to whom correspondence should be addressed.
Appl. Sci. 2021, 11(18), 8680; https://doi.org/10.3390/app11188680
Submission received: 28 August 2021 / Revised: 13 September 2021 / Accepted: 13 September 2021 / Published: 17 September 2021
(This article belongs to the Topic Intelligent Transportation Systems)

Abstract

:
There are significant differences in the utilization efficiency of parking spaces in different spatial locations within the complex parking lots, which reduces the utilization efficiency of parking resources. For the above problem, a parking spaces supply demand characteristics indexes system was constructed. The Metro City complex was taken as an example, and its parking demand utilization characteristics were analyzed to judge the problem of parking spaces utilization. On this basis, a model of the dynamic allocation of parking spaces for parking spaces was constructed to improve drivers’ degree of degree of satisfaction and balance the occupancy rates for parking spaces in different zones. The simulation results show that after the implementation of the dynamic allocation of parking spaces, the differences of the parking spaces’ demand characteristic indexes between two different parking zones are significantly reduced. It was specifically observed that the differences between parking zones A and B in terms of turnover number, total parking time and average parking time were reduced from 2.24 times to 0.03 times, 1.3 h to 0.6 h and 2.2 h to 0.1 h, respectively, and the average interval time of parking spaces became smaller and more evenly distributed. It can be seen that this model can improve the overall utilization efficiency of the complex parking lot and drivers’ degrees of satisfaction.

1. Introduction

At present, with the continuous advancement of urbanization, urban land resources are increasingly scarce. In order to utilize urban land resources intensively and achieve more urban service functions with limited land resources, the development and construction of the “urban complex” has become the mainstream trend in large cities. An “urban complex” is an organic combination of different activity spaces (e.g., commerce, office, entertainment, hotel, residence, etc.), which is realized based on a group of buildings [1]. Taking Shanghai, China, as an example, 225 “urban complexes” had been built by the end of 2017, and the total building area, annual passenger flow volume and parking spaces number reached 16.37 million square meters, 2.13 billion-person times and 145,000, respectively. It reveals that the “urban complex” has become an important, comprehensive, activity dense region in the city [2].
These “urban complex” developments need to construct larger parking lots to meet their own parking demand. However, due to the large scale of parking spaces, the low level of parking guidance facilities, the unreasonable spatial layout of parking spaces and supporting facilities (e.g., entrance and exit, elevator, passageway, etc.), and differences in the parking behaviors of drivers with different travel purposes, there are significant utilization efficiency differences of parking spaces in different spatial locations within the complex parking lot [3,4,5,6]. Parking in some zones is oversaturated; however, some zones’ parking spaces are wasted. It is difficult to effectively improve the overall service capacity of the parking lot and realize the expected social and economic values of parking spaces.
When considering the above problems arising in complex parking lots, scholars have so far mainly studied the changes of parking spaces demand characteristics, the influencing factors of parking space choice behavior, and optimization and regulation methods for parking space allocation. In terms of the changes of parking spaces demand characteristics, some scholars have used video monitoring, manual survey or other methods to analyze the utilization characteristics of parking spaces in different spatial locations within a parking lot, and constructed relevant indexes to describe the utilization efficiency differences of parking spaces. The indexes include parking spaces utilization efficiency, parking space search efficiency, the occupancy of parking spaces in parking zones, etc. [3,4,5]. The above research results can identify the parking problems of the parking lot (e.g., number of parking spaces, parking lot space layout, drivers’ parking flow line), and guide the design of the parking guidance (e.g., parking space allocation, guidance route allocation) and the spatial optimization design of the parking lot (e.g., vehicle entrance and exit, pedestrian entrance and exit, parking space layout, parking flow line organization, passage design). Since only a few demand characteristics indexes are proposed, the index categories should be further enriched to reveal the demand characteristics of parking spaces, such as parking time, turnover number, parking interval time, etc.
In regard to the influencing factors of parking space choice behavior, some scholars have analyzed parking space choice preference and its influencing factors based on objective parking data (e.g., parking lot access control data, spatial-temporal utilization characteristics data of parking spaces, parking flow line) and questionnaire data. The relevant influencing factors mainly include the distance between parking space and vehicle entrance and exit, the distance between parking space and pedestrian entrance and exit, traffic congestion on the driving route, security (the distance between parking space and monitoring equipment), parking space type (e.g., vertical, parallel, diagonal), etc. [7,8,9,10].
The construction cost of a complex parking lot is high and its space occupation is large. How to efficiently utilize spatial-temporal parking resources and improve the performance of service processes are current important research directions. Three kinds of optimization objectives, including improving the utilization efficiency of parking spaces, improving the degree of satisfaction of drivers and improving the economic benefits of the parking lot were proposed to optimize the allocation of parking space resources. (1) In order to improve the utilization efficiency of parking spaces, some scholars have utilized the methods of parking space layout optimization [3], the dynamic allocation of parking spaces model [11,12], and parking control management strategies (parking fee adjustment, parking time limit, etc.) [7,13]. For example, based on the multiagent parking lot simulation model, Vo et al. pointed out that limiting drivers’ parking time could increase the number of short-stay drivers and improve the average occupancy rate of parking lot [7]. (2) In order to improve the degree of satisfaction of drivers, some scholars have adopted the methods of parking lot layout optimization [14,15], parking space intelligent allocation [16,17] and parking control management strategy (e.g., parking space utilization authority management, restrictive and demand-oriented parking policies, etc.) [18,19] to allow drivers to park and leave easily. For example, Adevumi et al. took into account the type of driver (reservation user, non-reservation user), the distance between each sub-parking lot and sub-building, parking capacity and other factors, and established a model of the dynamic allocation of parking spaces, which can reduce the time cost to drivers [16]. (3) In order to improve the economic benefits of the parking lot, some scholars have tried to achieve the profit target by optimizing the parking fee [20,21,22] and the quantitative proportion [22] of the different types of parking spaces. For instance, Zhang studied the pricing optimization model for different types of parking spaces (temporary, long rent) under the condition that the parking spaces layout can be adjusted or not [22]. However, the majority of research is based on the single optimization objective. There is a lack of research on double objectives or multiobjectives optimization.
By analyzing the inadequacy of the current research into parking problems in the complex parking lot, in this paper, a parking spaces supply demand characteristics indexes system from the perspective of “parking space level” (single parking space) was built. The demand utilization characteristics of parking spaces in different spatial locations and the parking spaces utilization problems were analyzed. On this basis, the double optimization objectives (improving the degree of degree of satisfaction of drivers and improving the overall utilization efficiency of the parking lot) were considered. Moreover, a model of the dynamic allocation of parking spaces was proposed. The research results can be applied to the parking guidance in complex parking lots, which can not only improve the satisfaction of drivers, but will also balance the utilization efficiency of parking spaces in different zones of the parking lot. The social benefits of the parking lot can be improved.

2. Reconstruction of the Parking Spaces Supply Demand Characteristics Indexes System Based on “Parking Space Level”

Most existing research focuses on the analysis of the utilization characteristics and planning management of parking lots; however, there is lack of research exploring the demand utilization characteristics of parking spaces in different spatial-temporal locations within the parking lot from the perspective of “parking space level”. The existing research papers make it difficult to accurately analyze the parking problems and support the optimization of space design and parking service (e.g., parking guidance, parking reservation, etc.). With the rapid development of information technology and Internet of Things technology, there are some technical means for monitoring the conditions and use of a single parking space [23,24,25]. Mining, analyzing and applying the data of “parking time, vacancy time, turnover number” of parking spaces in different spatial locations can provide a new path to improve the overall parking spaces utilization efficiency and parking satisfaction degree. On the basis of the literature review, the supply demand characteristics of parking spaces were further excavated, as shown in (Table 1). By analyzing these indexes, the supply–demand characteristics of parking spaces in different spatial locations within the parking lot were revealed.
In order to further elaborate and visualize the above demand characteristics indexes of parking spaces, the Metro City complex in Shanghai, China was taken as a case to illustrate. The Metro City complex is located in Xujiahui district, Shanghai. It is an urban complex of retail, catering, leisure entertainment and service supporting facilities. There are 10 floors in the complex. The first basement floor, first floor, second floor and third floor are for retail and catering. The fourth floor is for retail, catering, leisure, entertainment and supporting service facilities (photography, beauty salon). The fifth floor is for catering, leisure entertainment (cinema, theater) and service supporting (beauty salon). The sixth floor is for catering. The seventh floor is for leisure and entertainment (karaoke). The eighth floor is for catering and leisure entertainment (yoga). The second basement floor is a parking lot with 185 parking spaces. The parking lot is divided into two parking zones: A and B. The vehicle entrance is in the south of the complex, and the vehicle exit is in the middle part of the complex. There is an elevator L9 in zone B, which stops from the first floor to the fifth floor. There are four elevators in zone A: among them, L10, L11 and L12 reach all floors, while L14 cannot reach the basement first floor or the seventh and eighth floors. According to the plan structure diagram of the parking lot, the GIS model of the parking lot is constructed, as shown in Figure 1, which describes the locations of the entrance and exit, the elevators, and the drivers’ driving flow line.
In order to obtain the demand characteristic indexes of the parking spaces, it is necessary to investigate the utilization characteristics of the parking spaces in the parking lot. The vehicle plate number, entry time and departure time are identified by the parking lot access control data. The occupation conditions and information about the vehicles parked in the parking spaces are identified by the video patrol method. In addition, in order to analyze drivers’ preferences for parking spaces, a parking space choice preference questionnaire was designed. Based on the literature [7,8,9,10], the factors that affect drivers’ choice of parking space mainly include “the distance between parking space and entrance”, “the distance between parking space and elevator” and “occupancy of parking spaces on both sides of parking space”. The respondents were required to score the three factors on a scale of 1 to 5 [26]. A total of 96 valid questionnaires were obtained, and the recovery rate was 91%. The respondents were drivers who entered the parking lot. The survey took place between 10:00 and 20:00 on 27 March 2020. According to the survey data, the parking demand characteristics indexes are obtained.
(1)
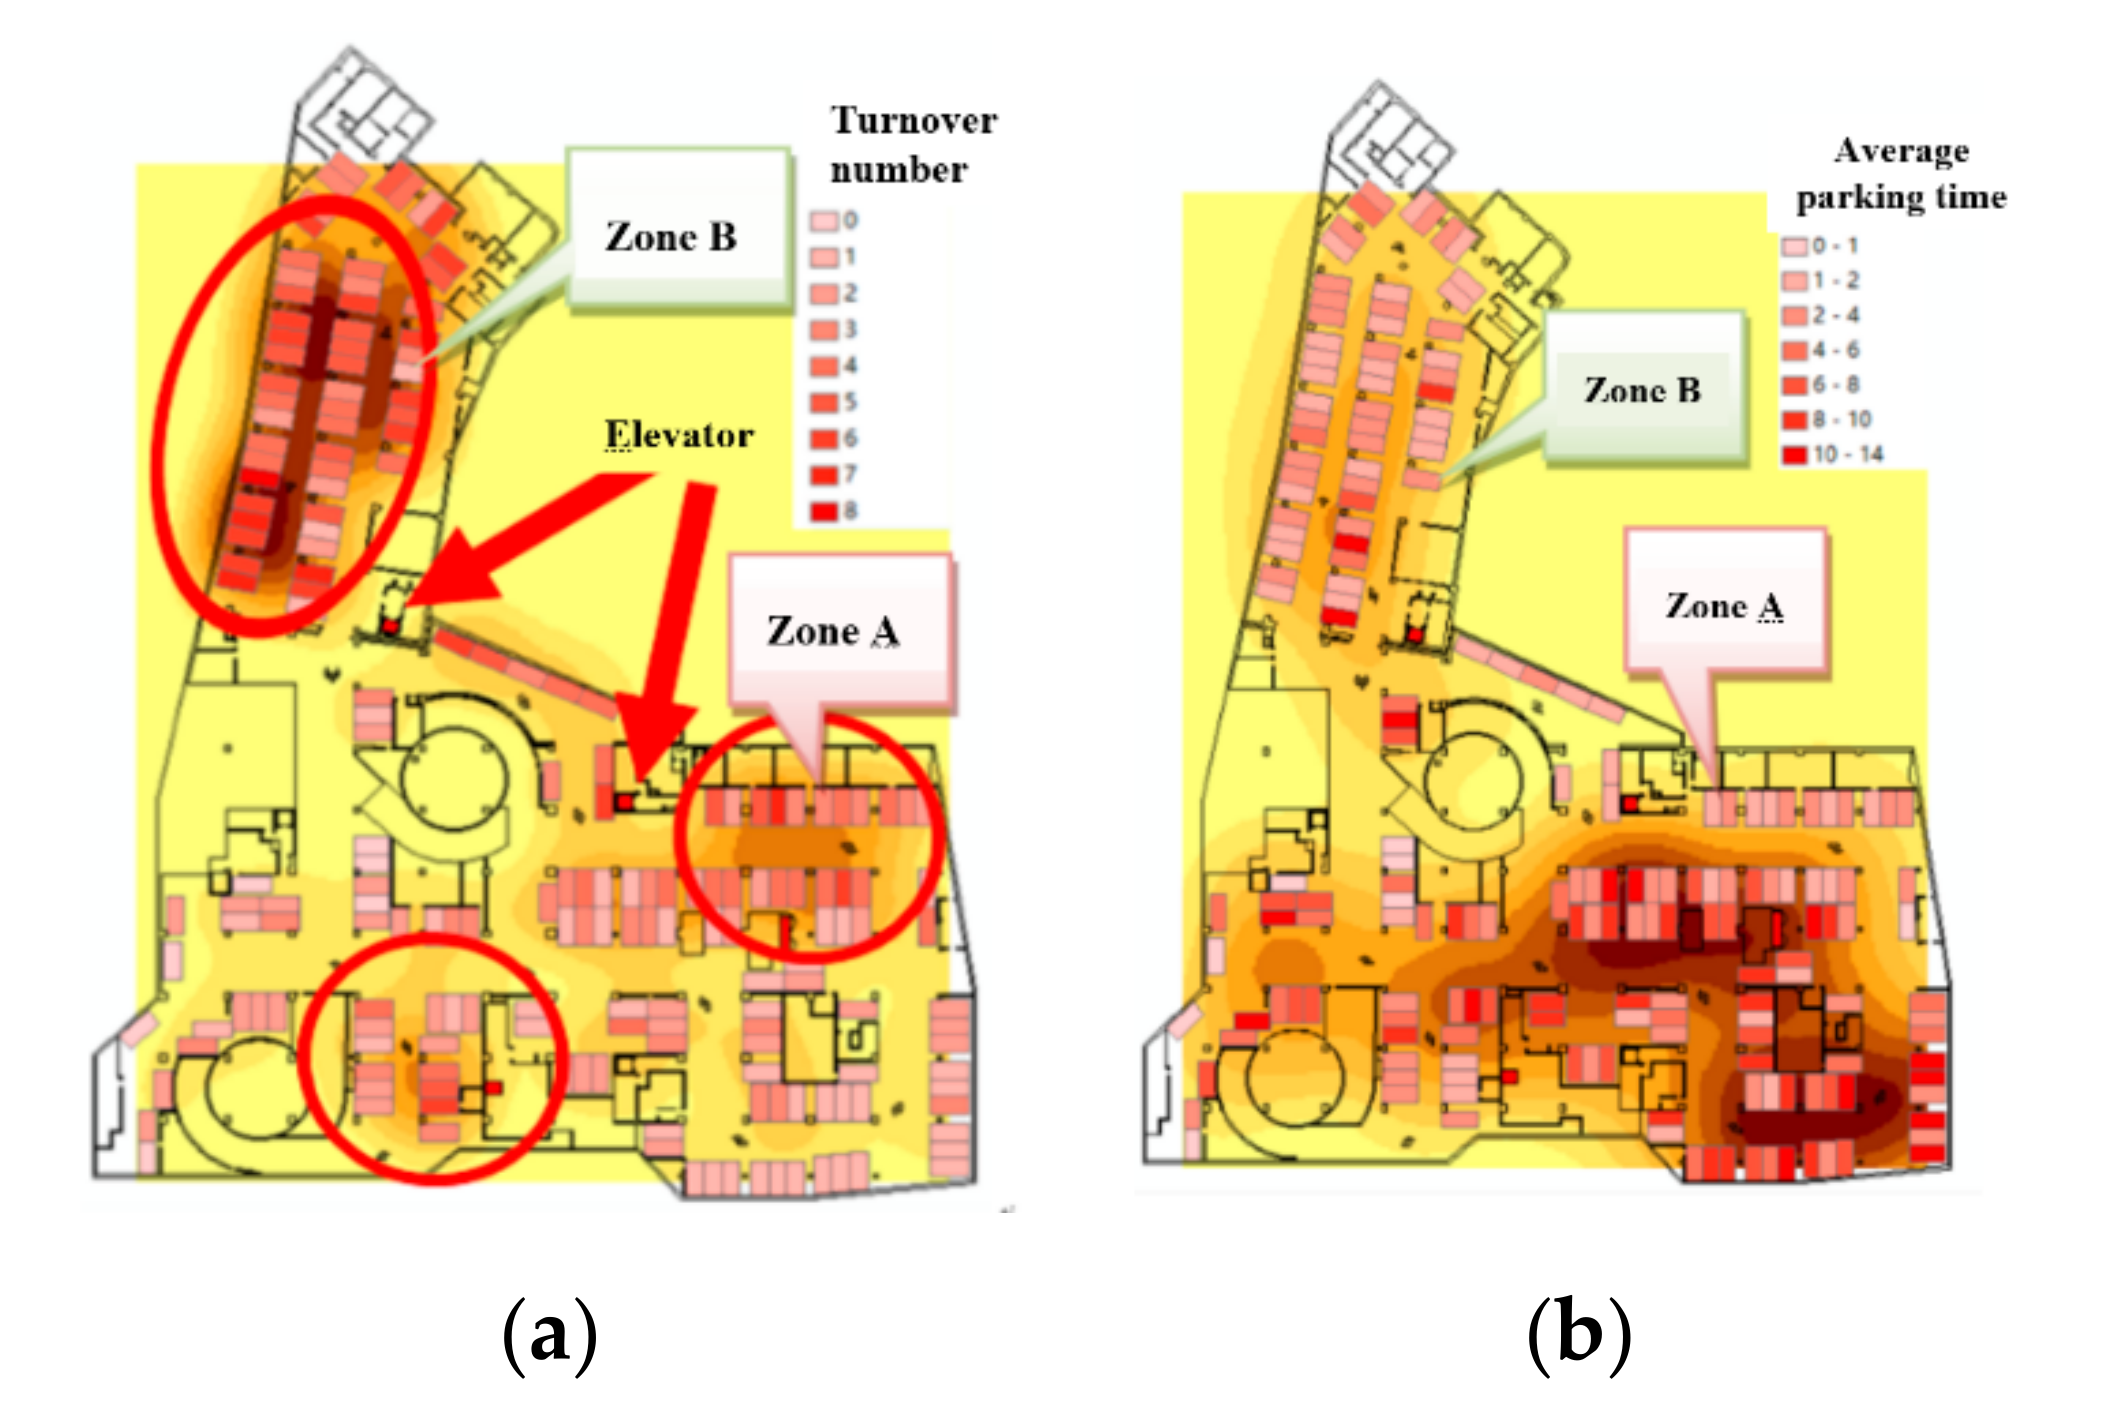
Parking space turnover number. During the survey period, the turnover number of parking spaces in the parking lot ranged from 0 to 8 times, as shown in Figure 2a. The turnover number of parking spaces in zone B is generally high, with an average of 4.50 times. The turnover number of 20 parking spaces in the upper right corner of zone A is also high, with an average of 3.75 times. The average turnover number of parking spaces in zone A is low, with an average of 2.26 times. The above phenomenon is mainly caused by the drivers’ driving flow line, the occupancy of parking spaces near the driving flow line, and the sequence of the elevators. According to drivers’ driving flow line in Figure 1, when drivers enters the parking lot, they will mainly pass through zone B first and then arrive at zone A. In zone B, some drivers will find the first elevator, L9, so they will give priority to parking in zone B. When the occupancy of parking spaces in zone B tends to be saturated, some drivers will choose to go to zone A and park near the first elevator, L12; that is, the parking spaces in the upper right corner of zone A. After that, the turnover number of parking spaces near the elevators (L10, L11) in zone A is relatively small. In addition, the turnover number of 11 parking spaces around the entrance is also high, with an average of 3.10 times. We speculate that the cause of high parking space turnover number near the entrance is due to the shortage of parking spaces at peak times, with some drivers hoping to park as soon as possible.
(2)
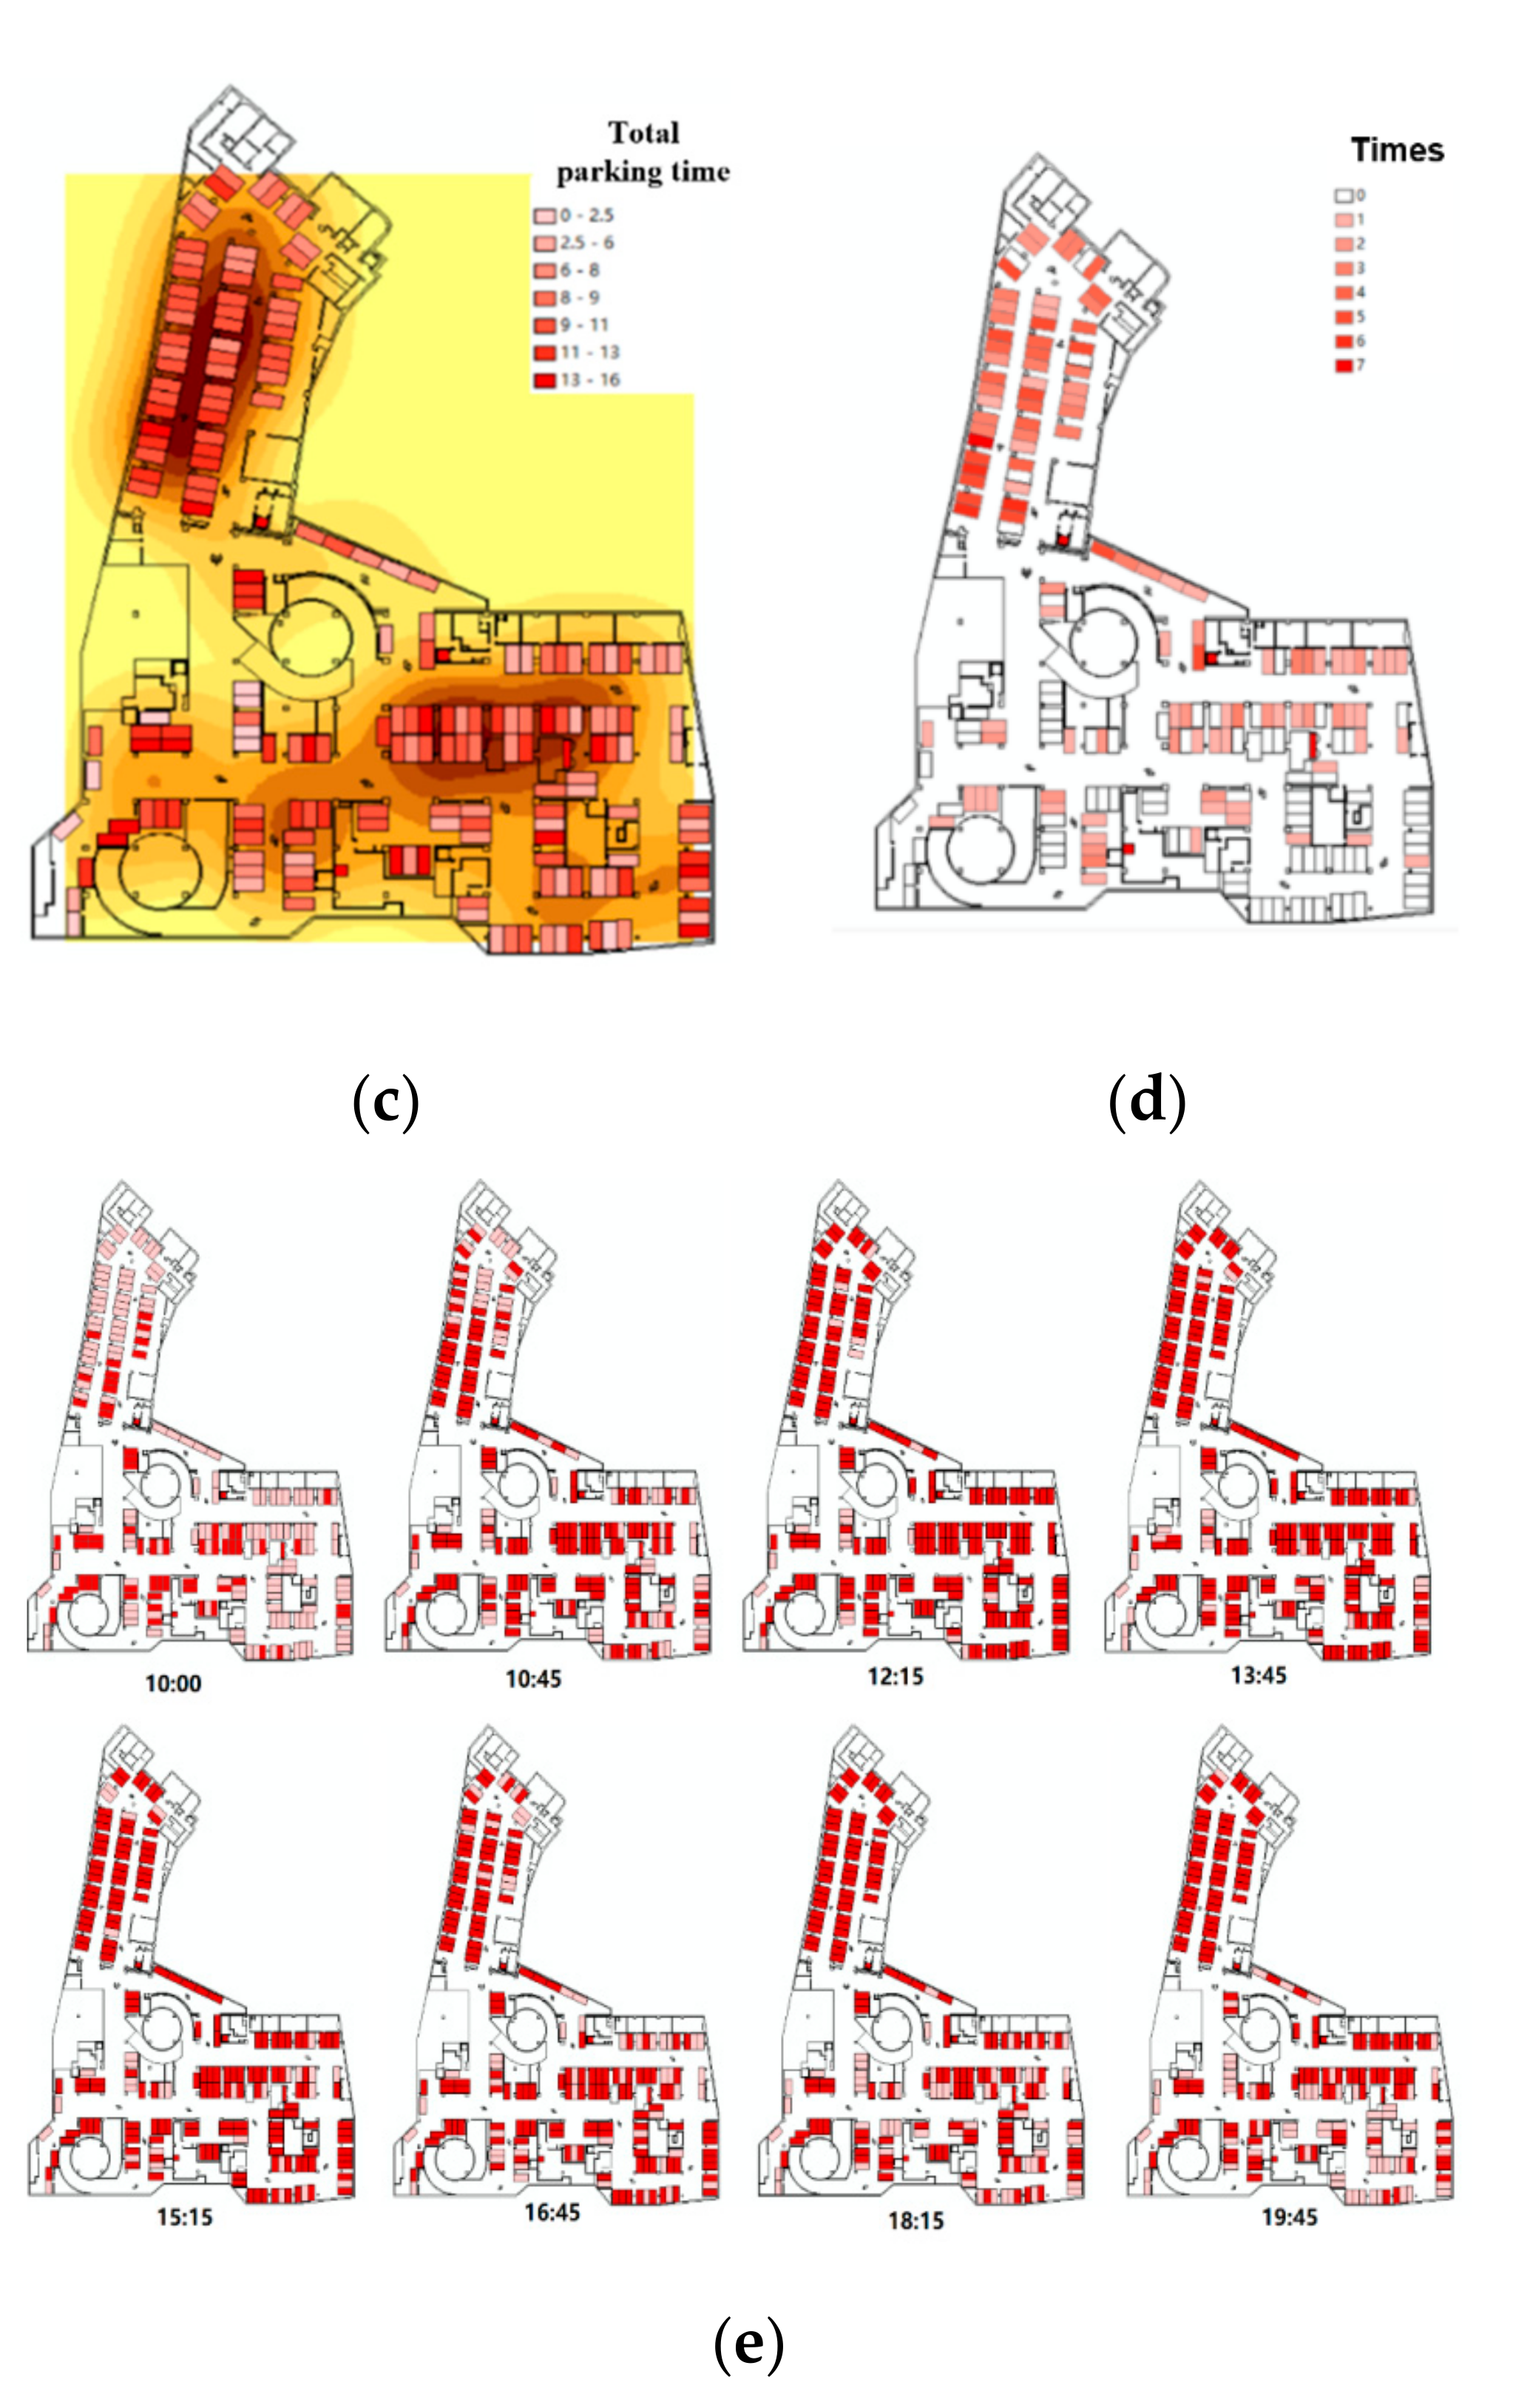
Parking space average parking time. Through the analysis of data, the average parking time and total parking time are divided into 7 categories, as shown in Figure 2b,c. Figure 2b suggests that most vehicles stay for long times in zone A. The average parking time in zone A is 5.0 h, while that in zone B is 2.8 h. The average total parking time of parking spaces in zone B is 9.7 h, and that in zone A is 8.4 h.
(3)
Parking interval time. When there is more than one vehicle parked in a parking space, there is an interval time between the entry time of the rear vehicle and the departure time of the front vehicle. If the interval time is shorter, the more popular the parking space is, and the higher the utilization rate of the parking space is. This paper defines the parking space is fully used when the interval time is less than 0.5 h. Times of every parking space which was fully used are calculated, as shown in Figure 2d. In Figure 2d, the possible conditions of time = 0 are as follows: the interval time is greater than 0.5 h; there is no vehicle parked; no other vehicle parked after the front vehicle left;, and one vehicle is always parked in the parking space. In these cases, the parking spaces are not fully utilized.
(4)
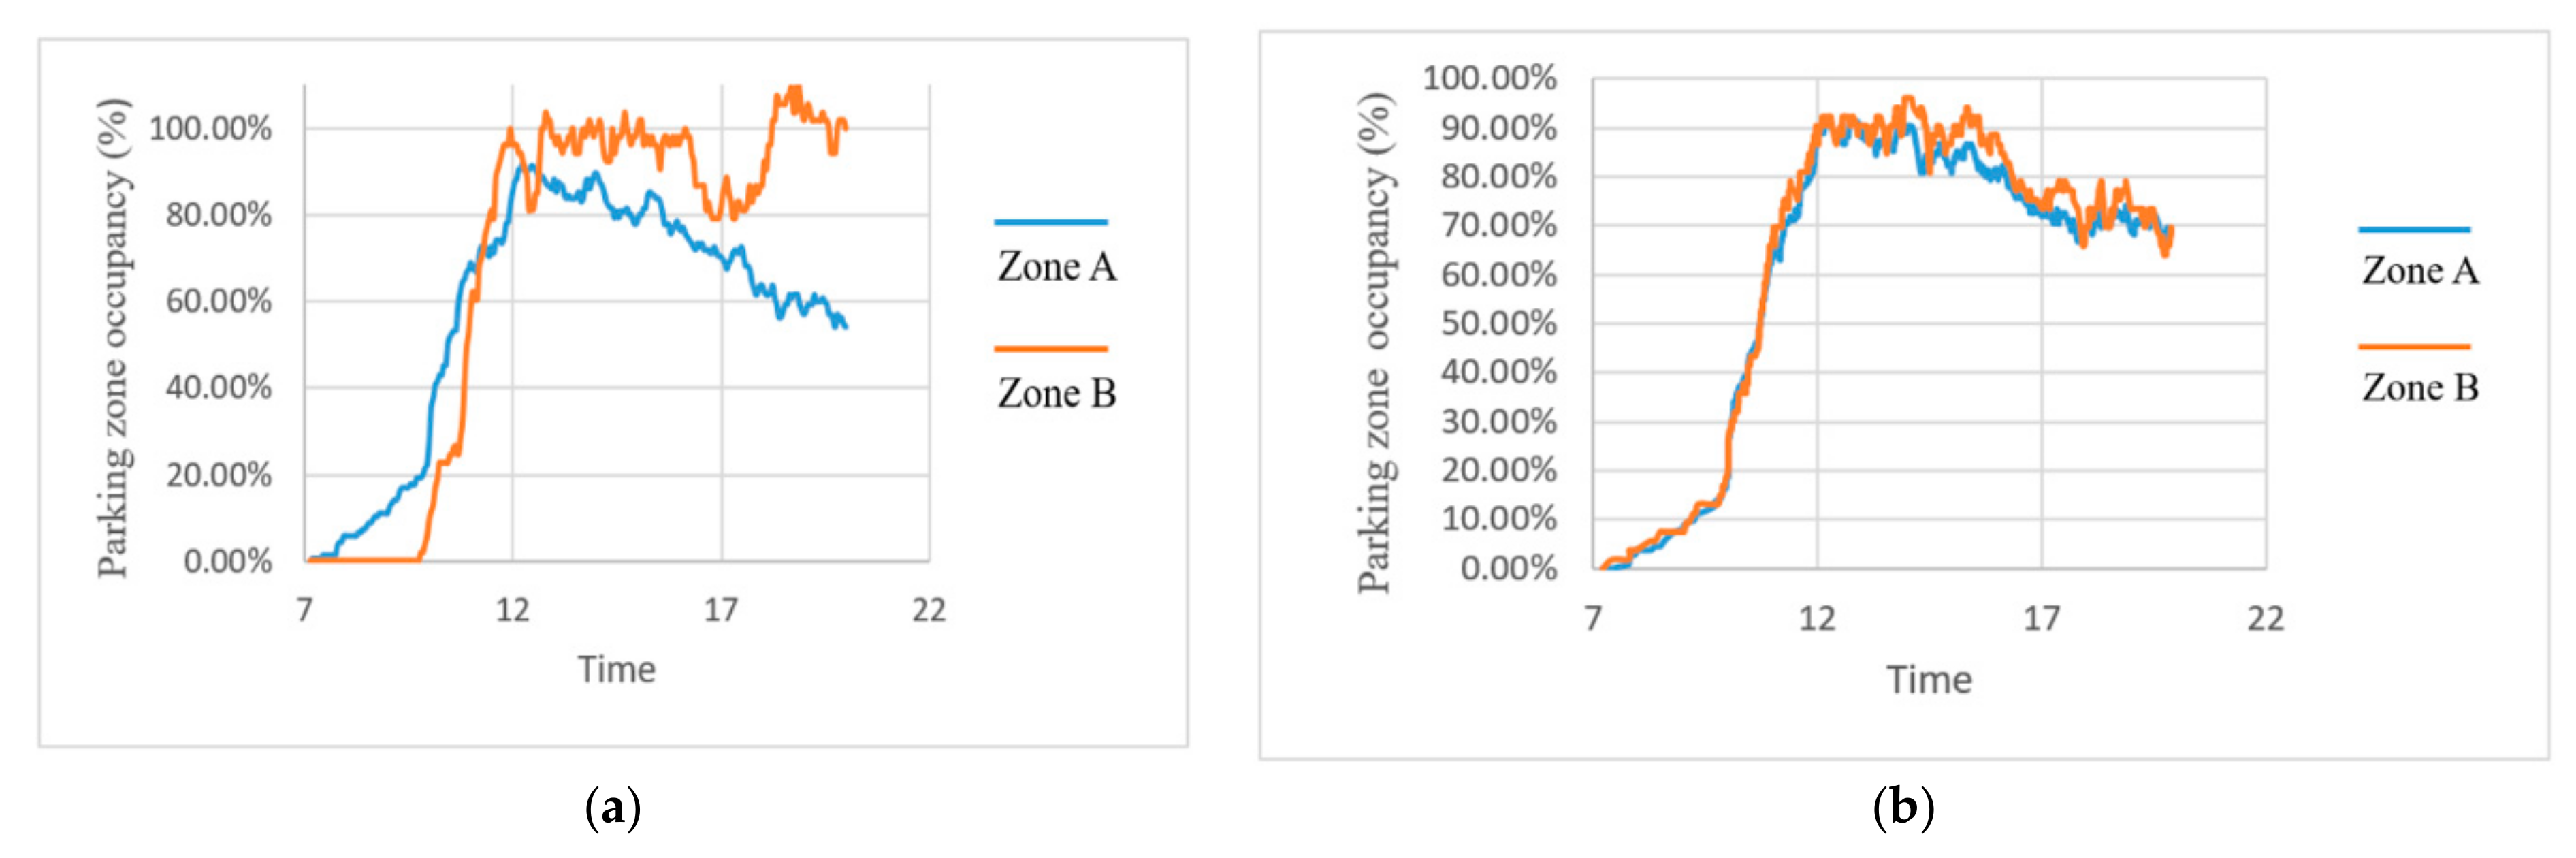
Parking spaces occupancy condition. Figure 2e shows the occupancy of parking spaces at some time during the survey period. From 10:00 to 10:45, the overall occupancy rate increased from 32% to 67%. The peak period is 12:15–13:45, and the occupancy rate is higher than 85%. The parking spaces in zone B have been occupied all the time, while parking spaces occupancy in zone A is scattered.
(5)
Analysis of drivers’ parking space choice preference. Based on the questionnaire data, the average scores of the three factors were calculated, and the results are: “the distance between parking space and entrance” = 3.65; “the distance between parking space and elevator” = 3.72; and “occupancy of parking spaces on both sides of parking space” = 3.55. Finally, the weights of the three factors are obtained by comparing the three average scores. The weights are: “the distance between parking space and entrance”: “the distance between parking space and elevator”: “occupancy of parking spaces on both sides of parking space” = 3.65/(3.65 + 3.72 + 3.55):3.72/(3.65 + 3.72 + 3.55):3.55/(3.65 + 3.72 + 3.55) = 0.334:0.341:0.325.
To sum up, it is found that there is a big difference in the utilization of parking spaces in zone A and zone B. This difference results in the wastage of some parking spaces in zone A. It results in the uneven distribution of passenger flow from elevators in different zones into corresponding upper shops, which is not conducive to the development of the complex’s overall profitability. In addition, the phenomenon also makes it hard for drivers to park quickly and reduces drivers’ degree of satisfaction. In order to solve the above problems, a model of the dynamic allocation of parking spaces was proposed with the double optimization objectives of balancing the parking occupancy in different parking zones and improving the drivers’ degree of parking satisfaction.

3. The Model of the Dynamic Allocation of Parking Spaces

The premise of constructing a model of the dynamic allocation of parking spaces was the need to analyze the service objects in the complex parking lot and their parking demands. Section 3.1 discusses the user equilibrium demand of drivers and the system equilibrium demand of complex management. On this basis, in order to respond to the above two types of demands, the model of the dynamic allocation of parking spaces is built. Section 3.2 gives the calculation methods of the users’ optimal parking spaces and systems’ optimal parking spaces, respectively. The two types of demands mentioned can be realized by allocating the system’s optimal parking space to the driver. In order to verify the effectiveness of the model, the simulation steps of the model are designed in Section 3.3, and the model is tested. Finally, Section 3.4 analyzes the output results of the model, and compares the parking spaces demand characteristic indexes of the two different parking zones before and after implementing the model, and further summarizes the effectiveness of the model.

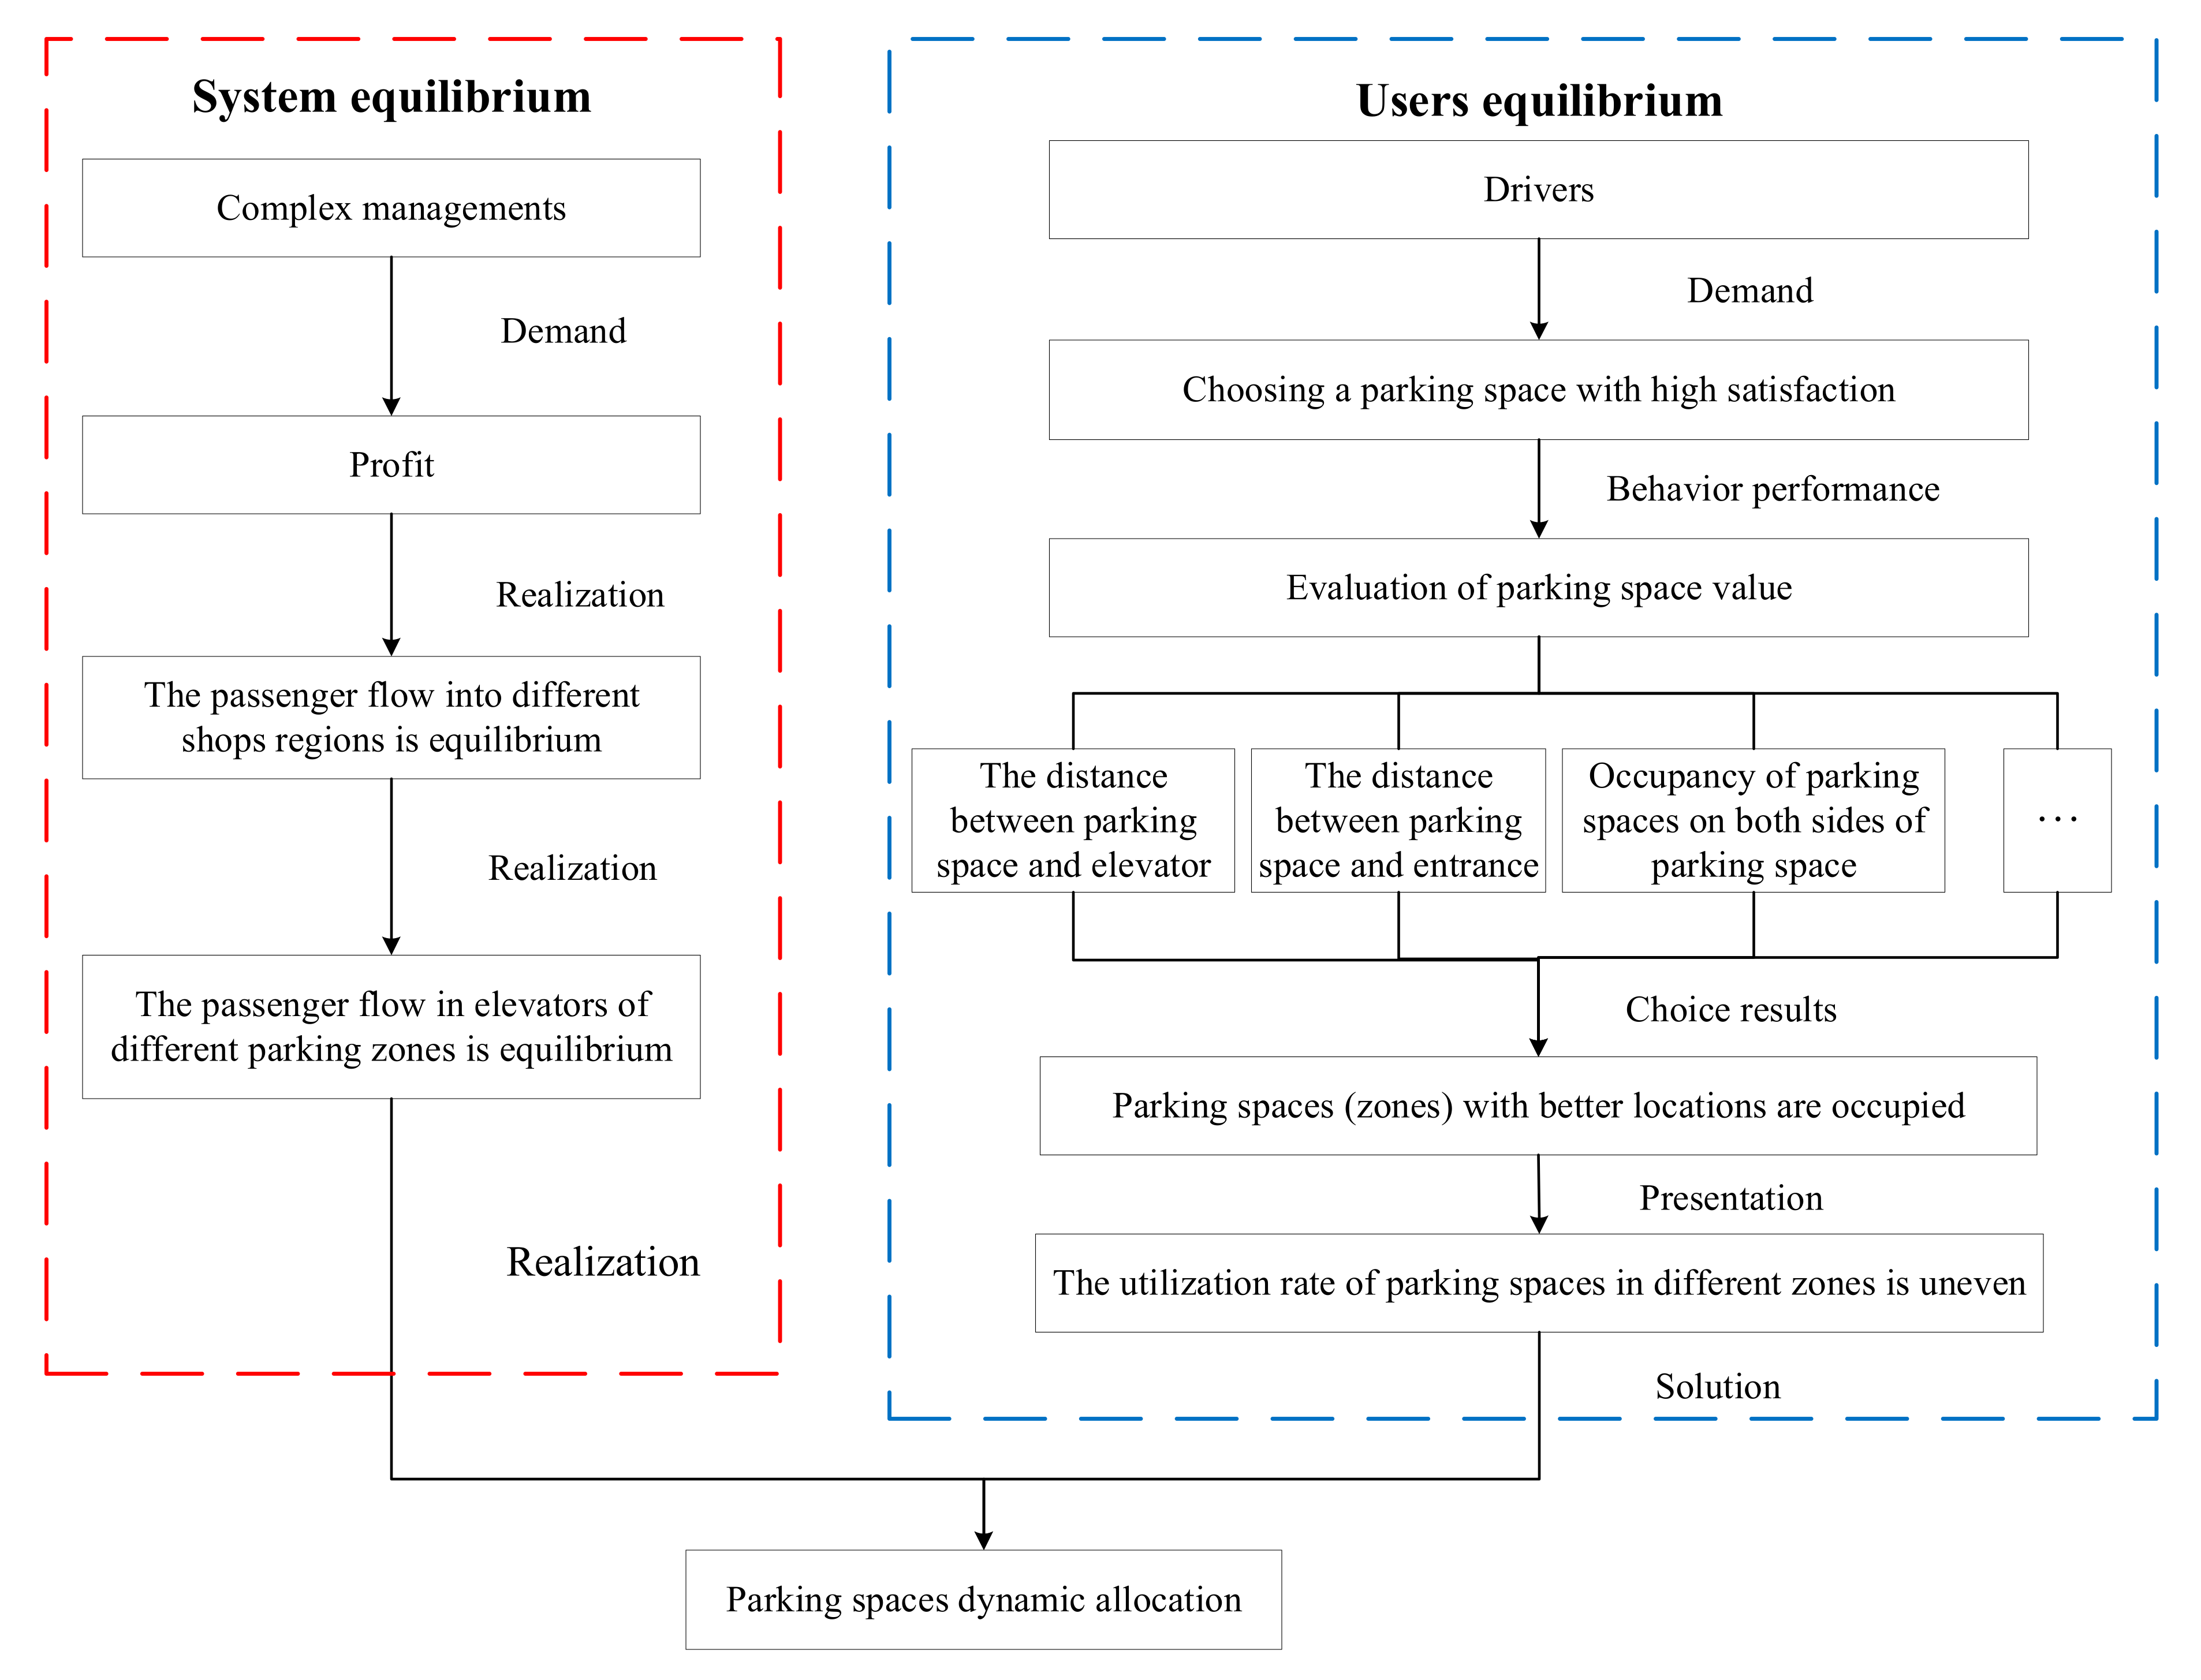
3.1. Idea of Model Construction

The model of the dynamic allocation of parking spaces needs to take into account the needs of system equilibrium and user equilibrium, as shown in Figure 3. Regarding the of system equilibrium, the complex management hopes that vehicles will park evenly in each parking zone of the parking lot, so that drivers can evenly reach every shop of the complex from the elevators in the different parking zones. If there are no vehicles or a small number of vehicles park in a certain zone, this is unfavorable for the shops above that parking zone. In the long run, it will affect the profits of the complex. In terms of user equilibrium, if the driver is rational and self-aware, they will evaluate the value of the parking spaces in the process of parking, and choose a parking space that meets their expectations. However, the parking spaces that meet drivers’ expectations may be concentrated in a few zones due to the layout of the parking lot and drivers’ driving flow lines. Then, the utilization of parking spaces in these zones will be much higher than those in other zones, which will result in unbalanced parking utilization in the different parking zones of the parking lot. Therefore, this paper comprehensively considers the demands of system equilibrium and user equilibrium, and designs a model of the dynamic allocation of parking spaces, which makes the utilization of the parking spaces in the different parking zones more balanced, and improves drivers’ degree of satisfaction.

3.2. User Optimal Parking Space and System Optimal Parking Space

The key point of the model is that the allocated parking spaces should not only meet the parking space choice preference of drivers, but also improve the utilization efficiency of the overall parking spaces in the parking lot. In this paper, the “user optimal parking space” was first calculated, and then the “system optimal parking space” was generated according to the occupancy conditions of parking spaces in different zones. Finally, the “system optimal parking space” was allocated to drivers to realize both the user equilibrium and system equilibrium.
(1)
User optimal parking space
First of all, the model calculates the parking space considered by drivers to have the highest value. This parking space is defined as the “user optimal parking space”, which reflects the parking space with the highest parking satisfaction degree. According to the literature review and questionnaire survey, this paper presents the value of parking spaces by integrating “the distance between parking space and elevator”, “the distance between parking spaces and entrance” and “occupancy of parking spaces on both sides of parking space”. Among them, the distance between the parking space, the entrance and the elevator can be calculated by the GIS model, and the value of “occupancy of parking spaces on both sides of parking space” can be determined by (Table 2).
Because the dimensions of the three indexes are not unified, it is necessary to standardize the three indexes:
The “occupancy of parking spaces on both sides of parking space” is an effective index, so Equation (1) is adopted for standardization.
r i j = r i j m i n i r i j m a x i r i j m i n i r i j
The “distance between parking space and entrance and elevator” are cost indexes, so Equation (2) is used for standardization.
r i j = m a x i r i j r i j m a x i r i j m i n i r i j
In Equations (1) and (2), r i j is the j index value of the ith parking space, m a x i r i j and m i n i r i j are the maximum value and minimum value of the j index.
After the above three indexes are calculated, respectively, the three indexes are added up according to Equation (3). R i in Equation (3) is the user optimal value of the parking space. The parking space with the highest value is the “user optimal parking space”.
R i = ω 1 r i 1 + ω 2 r i 2 + ω 3 r i 3
In Equation (3), ω 1 , ω 2 , ω 3 are the weights of “the distance between parking spaces and entrance”, “the distance between parking space and elevator” and “occupancy of parking spaces on both sides of parking space”. The weights were determined by questionnaire survey: ω 1 = 0.334, ω 2 = 0.341, ω 3 = 0.325. In the future, the parking app can allow drivers to score the three indexes, the weights of the three indexes can be adjusted, and the recommended parking space will meet driver’s parking preferences.
(2)
System optimal parking space
On the basis of “user optimal parking space”, the “system optimal parking space” is calculated by considering the parking occupancy rate of different zones, firstly, by calculating the zone parking occupancy index (the number of parking vehicles divided by the number of parking spaces) of each parking zone in the parking lot, and then, by calculating the “system optimal parking space” according to Equation (4). s i j in Equation (4) is the system optimal value of the parking space, p m is the parking occupancy index of the mth parking zone, a is the proportion parameter: if a = 0, the allocation result only considers the parking space choice preference of user, if a = 1, the allocation result only considers the parking occupancy index of parking zone. In the subsequent simulation process, we calculate that a = 0.4, according to Equation (4), 60% of the one-time parking space allocation result considers user optimal, 40% of the one-time parking space allocation result considers parking zone occupancy optimal. The value of a can be adjusted, the value size depends on the management’s decision about whether the parking space allocation result is more user optimal or whether the result is more occupancy optimal. The parking space with the highest s i j value is the “system optimal parking space”. Finally, the “system optimal parking space” is allocated to the driver to achieve user equilibrium and system equilibrium.
s i j = a × ( 1 p m ) + ( 1 a ) R i j

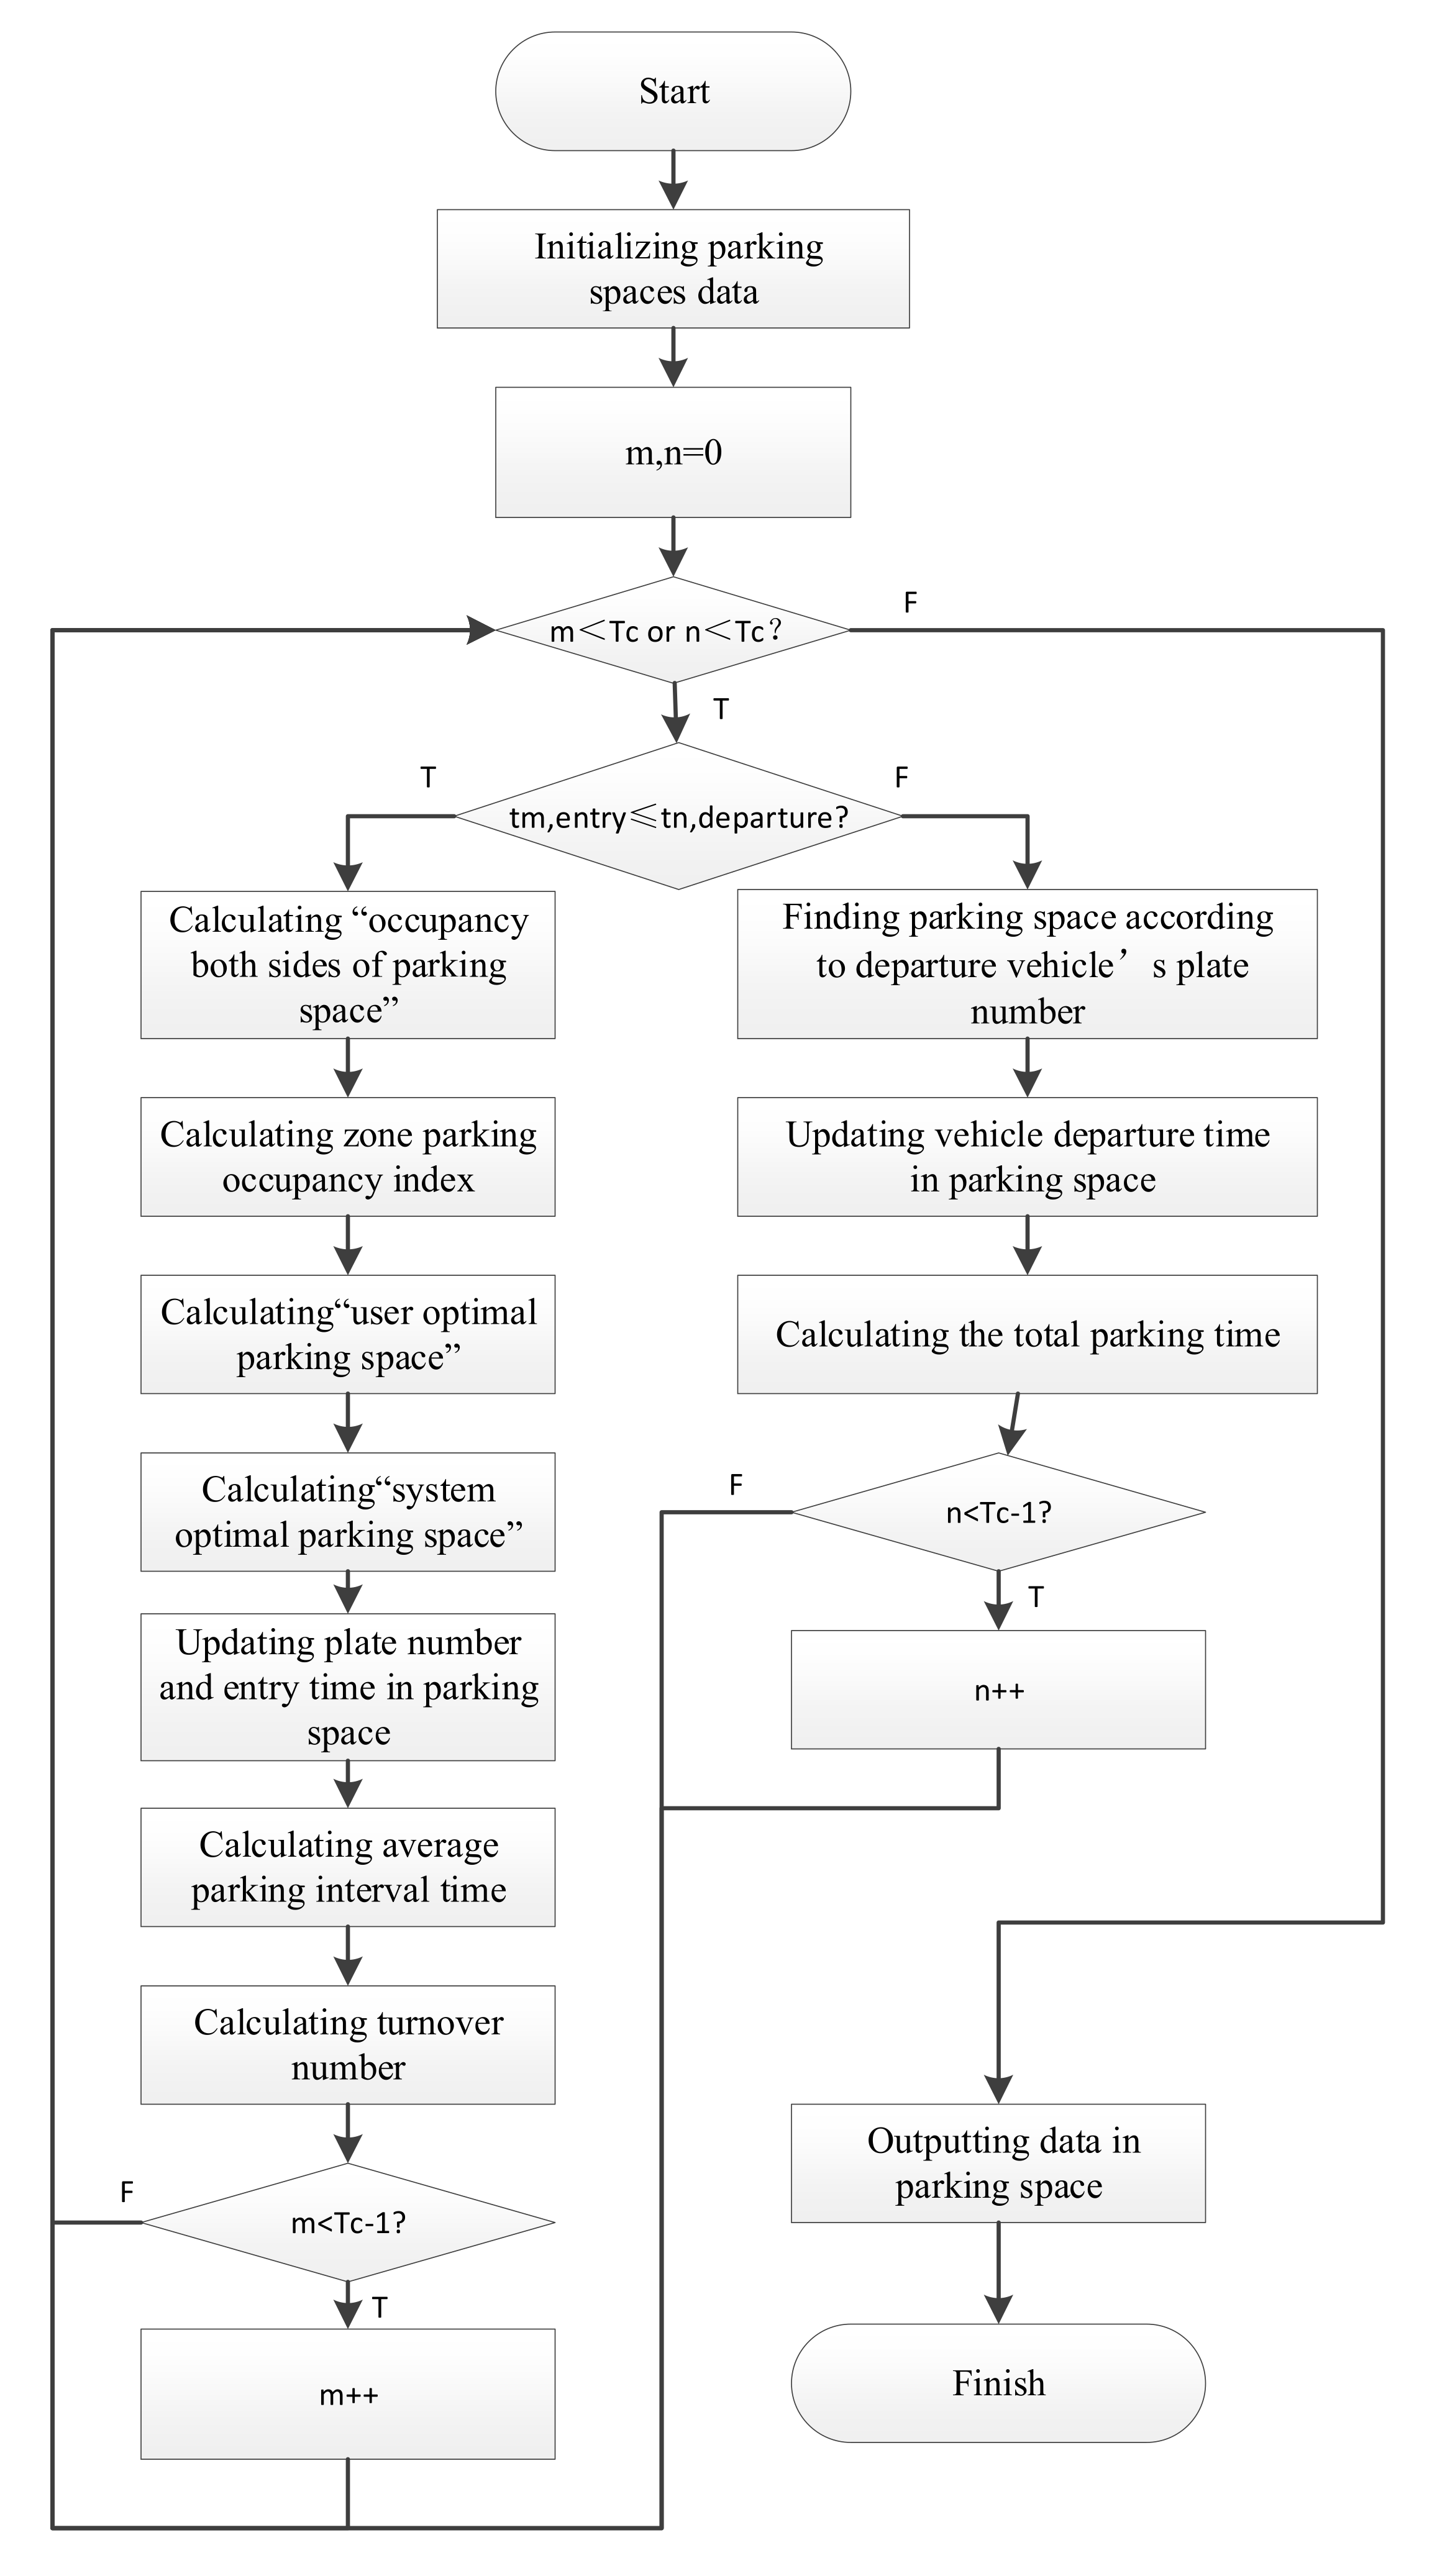
3.3. Simulation Process Design

In order to evaluate whether the model of the dynamic allocation of parking spaces can balance the utilization rate of parking spaces in different zones and improve drivers’ degree of satisfaction, it is necessary to analyze the changes in parking spaces utilization conditions in the different zones before and after implementing the dynamic allocation of parking spaces.
The data before from before the implementation of dynamic allocation adopts the parking lot data of Metro City on 27 March 2020. The vehicles’ entry and departure time data are real, and there is a total of 553 data records. Through modelling the dynamic allocation of parking spaces, the parking spaces were reallocated to these vehicles. Finally, the parking demand characteristic indexes of zone A and B were compared to evaluate the effect of the model of the dynamic allocation of parking spaces. The simulation of the model of the dynamic allocation of parking spaces is written in C++, and the flow chart is shown in Figure 4. The specific process is as follows:
1. Initializing parking spaces data
(1) Parking spaces status matrix
The structure of the parking spaces state matrix is: parking space number, left parking space number, right parking space number, zone to which the parking space belongs, distance between parking space, entrance and elevator.
① The purpose of recording the left and right parking spaces is to dynamically query the occupancy of the parking spaces and calculate the index “occupancy of parking spaces on both sides of parking space”.
② Belonging zone: “0” represents zone A and “1” represents zone B.
(2) Arrival and departure time schedules of parking spaces
There are 553 datapoints of vehicles’ arrival and departure, named TC. The entry time and departure time of the vehicles are divided into two tables and sorted in ascending order.
2. Defining the counter m, n = 0, and, respectively, recording the array number in the “entering” parking space table and the “leaving” parking space table.
3. As the status of the parking lot is affected by the entering vehicles and leaving vehicles, therefore, it is necessary to determine whether to deal with the entering vehicle or the leaving vehicle first.
Comparing the entry time t m , e n t r y of the mth entering vehicle and the departure time t n , d e p a r t u r e of the nth leaving vehicle, the vehicle with the earliest time is processed preferentially.
4. If t m , e n t r y t n , d e p a r t u r e , invoking the user-defined function ADDIN, allocating a parking space for the mth entering vehicle.
① Calculating the parking space spatial supply service level index of all parking spaces. The “occupancy of parking spaces on both sides of parking space” index is calculated according to Table 2. The “distance between parking spaces and entrance and elevator ” is in parking spaces status matrix. We then use Equation (3) to calculate “user optimal parking space”.
② Calculating the zone parking occupancy index of zone A and B.
③ According to Equation (4), calculating the “system optimal parking space”.
④ Finding the array number of “system optimal parking space”, updating the plate number and entry time in this array, which is equivalent to allocating the mth entry vehicle into the parking space.
⑤ Calculating the average parking interval time, which is used to evaluate the optimization effect. The parking interval time is the difference between the entry time of the newly allocated vehicle and the departure time of the front vehicle. The average parking interval time = the total parking interval time/interval times.
⑥ Calculating the turnover number, which is used to evaluate the optimization effect: turnover number + 1.
⑦ Entering the next entry vehicle: m++.
5. If t n , d e p a r t u r e < t m , e n t r y , the nth departure vehicle will be processed and the user-defined function ADDOUT will be invoked.
① Finding a parking space according to the nth vehicle’s plate number and updating the departure time in the parking space array.
② Calculating the total parking time, which is used to evaluate the optimization effect. The total parking time = the difference between the departure time and the entry time in the parking space array, and the average parking time = the total parking time/turnover number.
③ After calculation, the plate number stored in the parking space array is restored to the initial value, which is equivalent to eliminating the nth vehicle departure.
④ Enter the next vehicle departure: n++.
6. Cycling steps 3–5 until m and n are equal to TC. All entering and departing vehicles are handled.
7. Outputting the data (e.g., average interval time, turnover number, total parking time) recorded in the parking space array.

3.4. Results and Discussion

The model’s output results include the zone parking spaces occupancy table, the parking spaces allocation scheme table and the parking spaces demand characteristics indexes table. The change of parking zone occupancy rate in zones A and B before and after implementing the dynamic allocation of parking spaces is shown in Figure 5. It can be clearly seen that in the actual situation, the parking occupancy rate of zone B is high from noon, and only drops slightly after sunset. The occupancy rate of zone B is greater than 100% at some times, and the reason for this is that there are many popular parking spaces in zone B. For popular parking spaces, there exists the phenomenon that the front car leaves the parking space and the rear car immediately drives into the same parking space. The parking times of the front car and the rear car overlaps; at this time, two cars occupy the same parking space. Since the above phenomena often occurs in the popular parking spaces in zone B, the occupancy rate of zone B is greater than 100% at some times. After the implementation of the model of the dynamic allocation of parking spaces, the trend of variation in parking occupancy between the two zones is similar, and the occupancy rate of zone B is slightly higher than that of zone A.
Table 3 shows some parking spaces demand characteristics indexes in zone A and B before and after implementing the dynamic allocation of parking spaces. Figure 6 is the comparison schematic figure of parking space demand characteristic indexes before and after implementing the dynamic allocation of parking spaces.
The following can be seen from Table 3 and Figure 6:
(1)
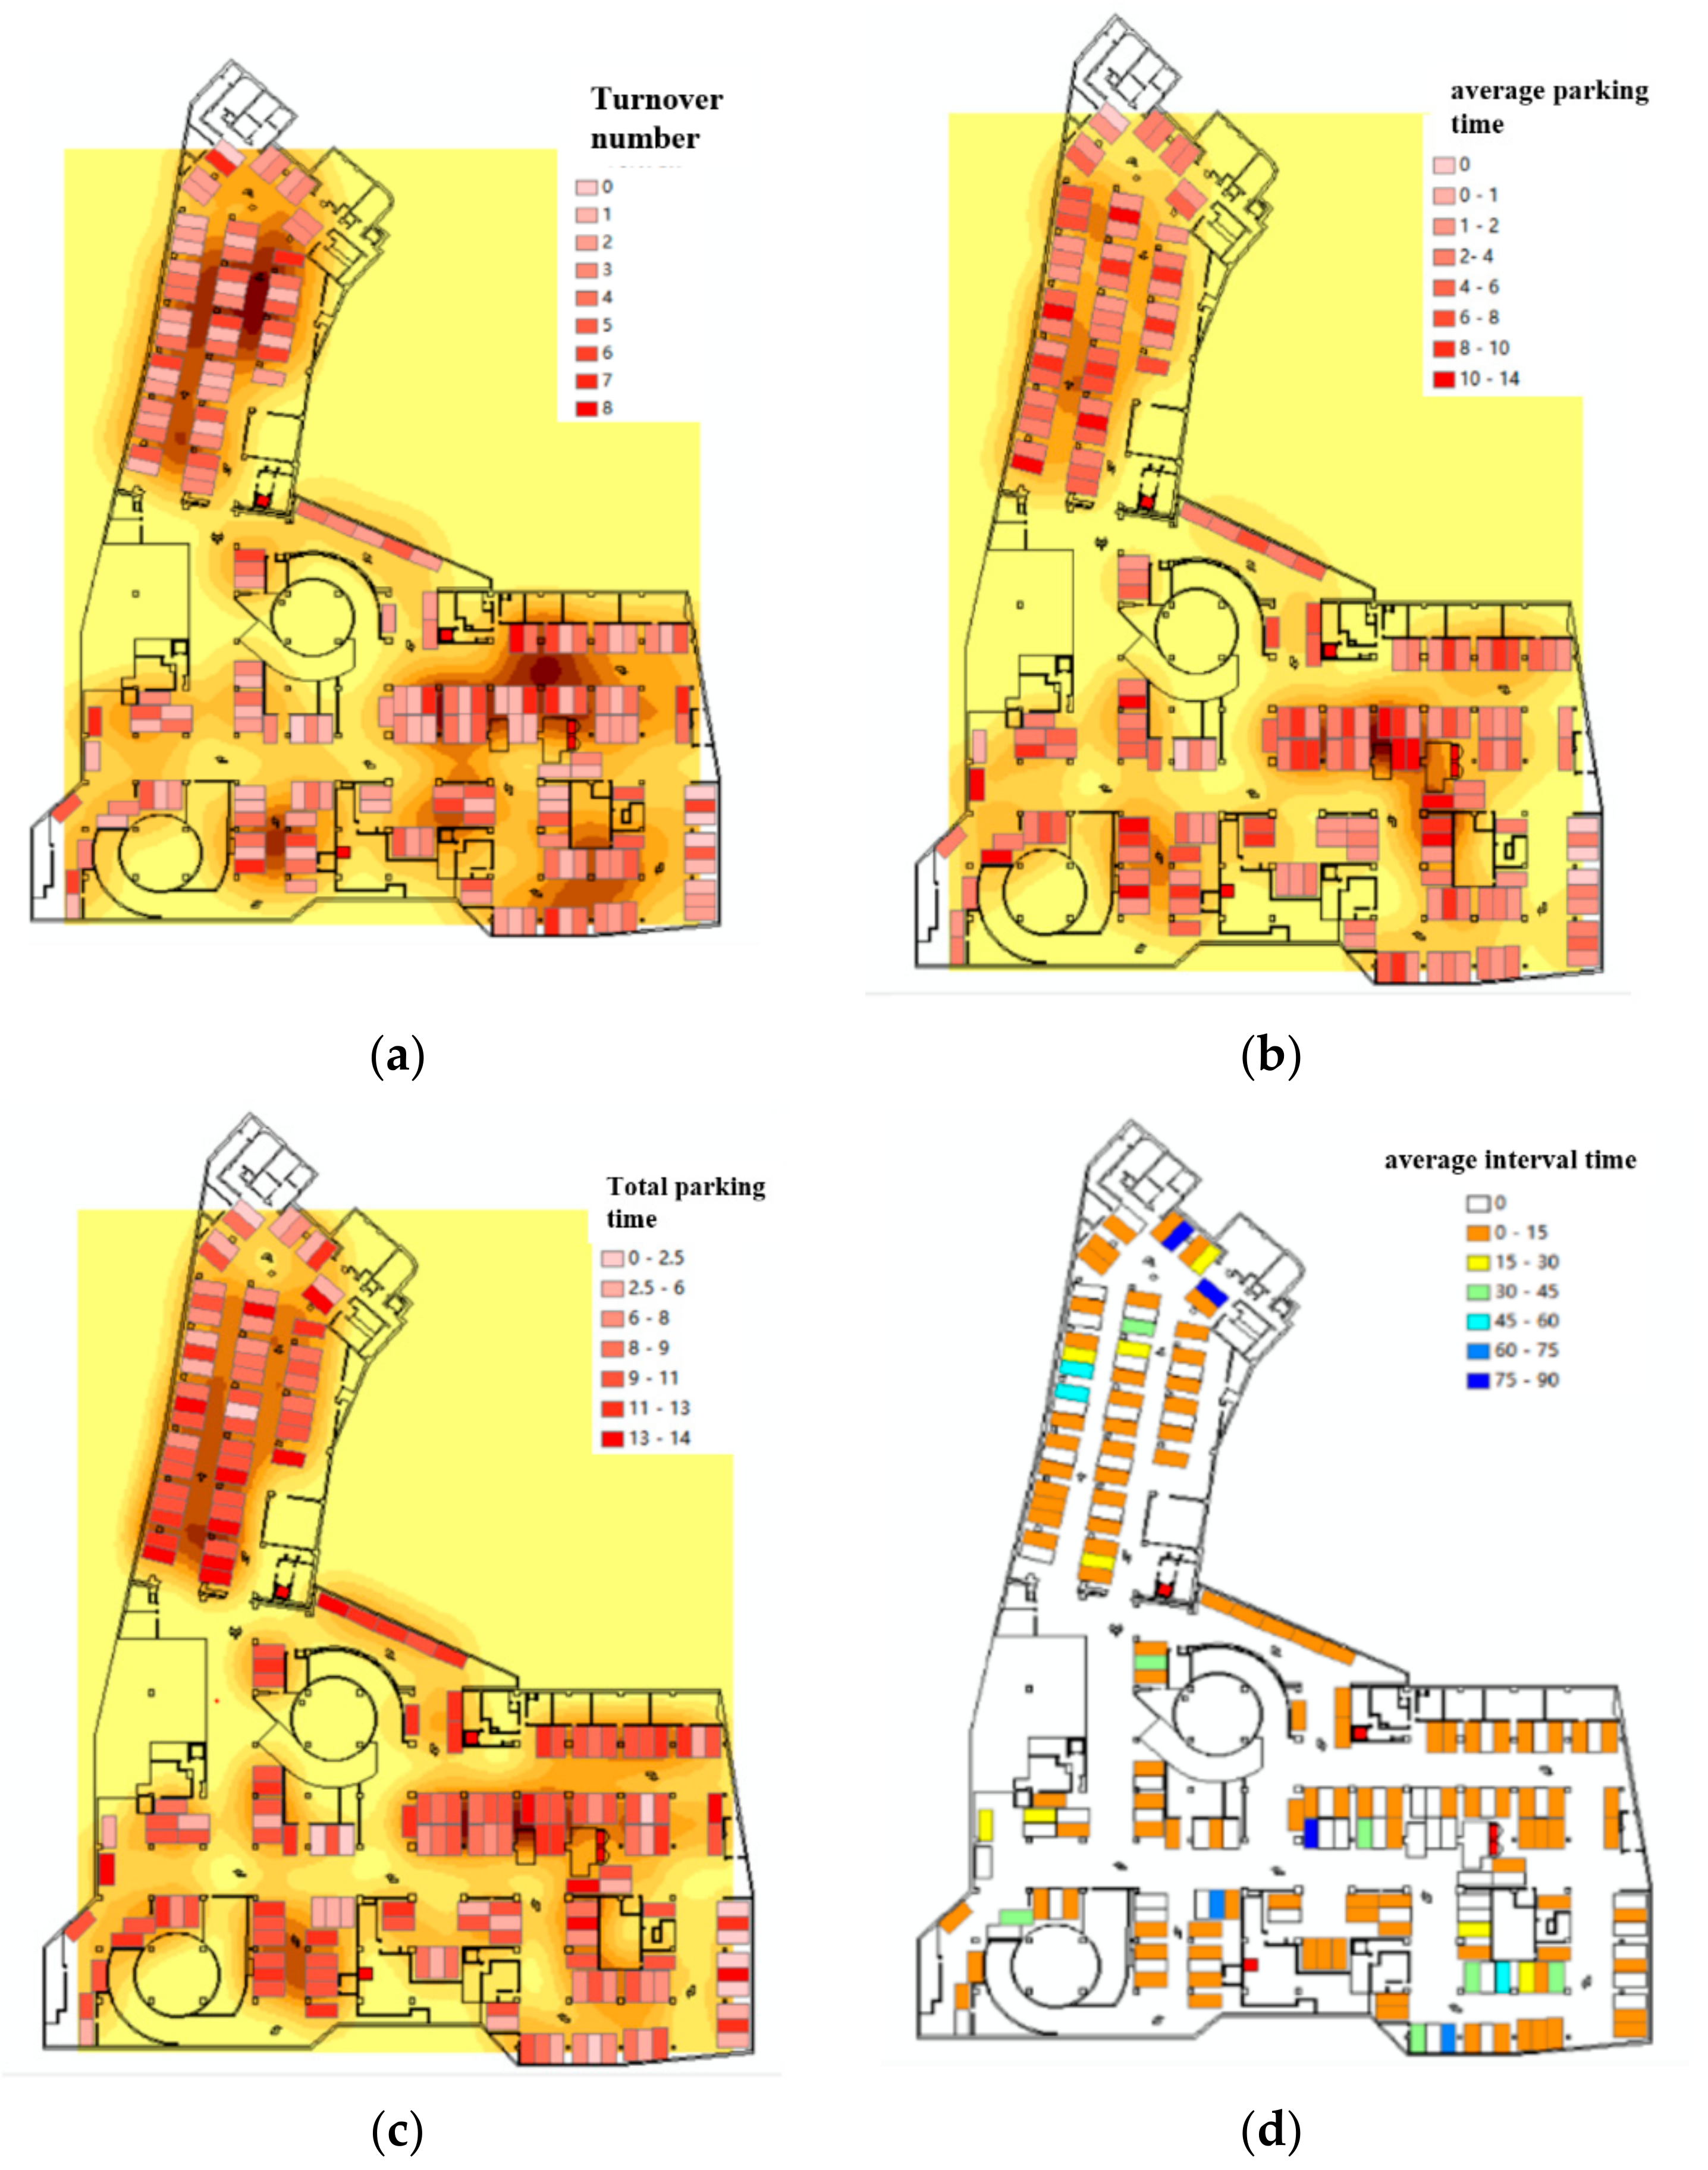
After dynamic allocation, the locations with the largest turnover and total parking time, which are zone B and the upper right corner of zone A, are consistent with the actual situation,. The average turnover number of parking spaces in zone B decreased from 4.50 times to 2.96 times, while the average turnover number of parking spaces in zone A increased from 2.26 times to 2.93 times. After the dynamic allocation of parking spaces, the difference between the turnover number of parking spaces in zone A and B decreased from 2.24 times to 0.03 times, the difference of total parking time between zone A and B decreased from 1.3 h to 0.6 h.
(2)
The average parking time distribution after dynamic allocation is quite different from the actual situation. In the actual situation, the average parking time in zone A is longer, while the average parking time of each part of the parking lot is more balanced after dynamic allocation. The average parking time of parking spaces in zone A decreased from 5.0 h to 4.3 h, while that in zone B increased from 2.8 h to 4.4 h. After the dynamic allocation of parking spaces, the difference in the average parking time between zones A and B decreased from 2.2 h to 0.1 h.
(3)
For the average interval time, in the actual situation, the short time intervals are concentrated in zone B, while fewer parking spaces in zone A have an average interval time that is less than 0.5 h. After the dynamic allocation of parking spaces, the average interval time of the parking spaces is small and evenly distributed.
To sum up, the model of the dynamic allocation of parking spaces proposed in this paper can balance the utilization of parking spaces in different zones of the complex parking lot, and make the passenger flow from elevators of different zones to upper level shops more uniform. The results can further support the operation and management of the complex. At the same time, the parking spaces allocation includes “user optimal parking space”, which also improves the degree of satisfaction of drivers.

4. Results

Aiming at the problem that there are significant differences in the utilization efficiency of parking spaces in different spatial locations of complex parking lots, this paper first constructed a parking spaces supply demand characteristics indexes system from the perspective of “parking space level”, and then analyzed the demand utilization characteristics of parking spaces in different spatial locations, to accurately grasp the existing parking spaces utilization problems. On this basis, a model of the dynamic allocation of parking spaces was constructed to balance the parking spaces occupancy rate in different zones of the parking lot and improve the drivers’ degree of satisfaction. The main conclusions are as follows:
(1)
A parking spaces supply demand characteristics indexes system was constructed. The parking space spatial supply service level indexes include the distance between parking space and pedestrian entrance and exit (elevator, stairs), the distance between parking space and vehicle entrance and exit, and occupancy of parking spaces on both sides of parking space. The parking space demand characteristics indexes include parking space occupancy condition, turnover number, total parking time, average parking time and parking interval time. Metro City complex was taken as an example. The parking space demand characteristics indexes were calculated and visualized. The utilization status of parking spaces in different spatial-temporal locations in the parking lot was analyzed. Based on the above analysis result, the parking problems were judged in detail.
(2)
In order to balance the occupancy rate of parking spaces in different parking zones and improve drivers’ satisfaction degree, a model of the dynamic allocation of parking spaces was constructed. Firstly, drivers’ parking space choice preference was considered, the “user optimal parking space” was calculated. On this basis, the “system optimal parking space” is calculated by considering the occupancy rate of parking spaces in different parking zones.
(3)
A model of the dynamic allocation of parking spaces was simulated. The results show that after the dynamic allocation of parking spaces, the difference between the turnover numbers of parking spaces in zones A and B decreased from 2.24 times to 0.03 times. The difference in the total parking time between zones A and B decreased from 1.3 h to 0.6 h. The average interval time of parking spaces is small and evenly distributed. This suggests the model of the dynamic allocation of parking spaces can effectively improve the overall utilization efficiency of parking spaces and increase drivers’ degree of satisfaction.
Besides, the number of zones have an influence on the results. In the future, we can explore the optimal parking spaces allocation and effect evaluation under different parking zone conditions.

Author Contributions

The authors confirm that their contributions to the paper were as follows: study conception and design: G.Y., J.C., K.L., C.Z.; data collection: K.L.; analysis and interpretation of results: G.Y., J.C., K.L., C.Z.; draft manuscript preparation: G.Y. All authors have read and agreed to the published version of the manuscript.

Funding

This research is supported by the National Natural Science Foundation of China (No. 71971059), the Key Project of Transportation Science and Technology Achievement and Transformation of Jiangsu Province (2019Z01) and the Fundamental Research Funds for the Central Universities (2242020R20026).

Institutional Review Board Statement

Not applicable.

Informed Consent Statement

Not applicable.

Conflicts of Interest

The authors declare no conflict of interest.

References

  1. Lou, J.; Xu, J.; Wang, K. Study on Construction Quality Control of Urban Complex Project Based on BIM. Procedia Eng. 2017, 174, 668–676. [Google Scholar] [CrossRef]
  2. Shanghai Business Development Research Center. Shanghai Urban Commercial Complex Development Report (2017–2018). Available online: http://www.ebrun.com/20181208/311193.shtml (accessed on 6 June 2021).
  3. Jin, J.; Xu, L. Parking Behavior, Eiciency and Architectural Design for Underground Garage Case study of Two Garages. Archit. J. 2013, 8, 83–87. [Google Scholar]
  4. Tanaka, S.; Ohno, S.; Nakamura, F. Analysis on drivers’ parking lot choice behaviors in expressway rest area. Transp. Res. Procedia 2017, 25, 1342–1351. [Google Scholar] [CrossRef]
  5. Qi, T. The Research and Application of Spatiotemporal Model of the Urban Public Parking Management. Ph.D. Thesis, Zhejiang University, Hangzhou, China, 2012. [Google Scholar]
  6. Akhavan-Tabatabaei, R.; Bolívar, M.A.; Hincapie, J.A.; Medaglia, A.L. On the optimal parking lot subscription policy problem: A hybrid simulation-optimization approach. Ann. Oper. Res. 2014, 222, 29–44. [Google Scholar] [CrossRef]
  7. Vo, T.T.A.; Peter, V.D.W.; Wets, G. Micro-simulation of Car Drivers’ Movements at Parking Lots. Procedia Eng. 2016, 142, 100–107. [Google Scholar] [CrossRef] [Green Version]
  8. Ji, Y.; Wang, W.; Deng, W. Micro-level parking behaviors within parking facilities and optimal parking space choice model. J. Southeast Univ. 2009, 39, 399–403. [Google Scholar]
  9. Chen, M.; Hu, C.; Chang, T. The research on optimal parking space choice model in parking lots. In Proceedings of the International Conference on Computer Research and Development, Shanghai, China, 11–13 March 2011; pp. 93–97. [Google Scholar]
  10. Ye, X.; Yang, C.; Wang, T.; Yan, X.; Li, S.; Chen, J. Research on parking app choice behavior based on MNL. Travel Behav. Soc. 2021, 25, 174–182. [Google Scholar] [CrossRef]
  11. Wang, Q. Research on dynamic parking space allocation model in closed parking lot. Appl. Mech. Mater. 2015, 734, 435–439. [Google Scholar] [CrossRef]
  12. Wu, M.; Jiang, H.; Tan, C.A. Automated parking space allocation during transition with both human-operated and autonomous vehicles. Appl. Sci. 2021, 11, 855. [Google Scholar] [CrossRef]
  13. Guan, H.; Liu, L. A parking behavior model in metropolis’ downtown-a case study on Xidan area of Beijing. China Civ. Eng. J. 2003, 36, 46–51. [Google Scholar]
  14. Akatsu, N.; Shimizu, M.; Yonekura, T. A Study of the Simulation Technology Application to a Parking Lot Layout Design. In Proceedings of the International Conference on Network-Based Information Systems, Salerno, Italy, 10–12 September 2014; pp. 584–589. [Google Scholar]
  15. Rodriguez, S.; Giese, A.; Amato, N.M. Improving aggregate behavior in parking lots with appropriate local maneuvers. In Proceedings of the IEEE/RSJ International Conference on Intelligent Robots & Systems, Tokyo, Japan, 3–7 November 2013; pp. 3843–3850. [Google Scholar]
  16. Adewumi, A.O.; Joel, L.O.; Sawyerr, B.A. Campus parking space allocation distribution using pattern search and particle swarm pattern search algorithms. In Proceedings of the International Symposium on Soft Computing & Intelligent Systems, Kitakyushu, Japan, 3–6 December 2014; pp. 196–203. [Google Scholar]
  17. Wang, P.; Guan, H.; Liu, P.; Zhao, P.F.; Han, Y.; Yue, H. Mechanisms of Allocation/Pricing/Revenue Distribution for Shared Parking Lots. China J. Highw. Transp. 2020, 33, 158–180. [Google Scholar]
  18. Lin, F.; Chen, H. Improving utilization and customer satisfaction of parking space with M2M communications. In Proceedings of the 2015 IEEE 2nd World Forum on Internet of Things, Milan, Italy, 14–16 December 2016; pp. 465–470. [Google Scholar]
  19. Kirschner, F.; Lanzendorf, M. Support for innovative on-street parking policies: Empirical evidence from an urban neighborhood. J. Transp. Geogr. 2020, 85, 102726. [Google Scholar] [CrossRef]
  20. Wang, P.; Guan, H.; Liu, P. Modeling and solving the optimal allocation-pricing of public parking resources problem in urban-scale network. Transp. Res. Part B Methodol. 2019, 137, 74–98. [Google Scholar] [CrossRef]
  21. Zhang, C.; Chen, J.; Li, Z.; Gao, L. Market Segmentation Analysis of Commuter Parking Relative to Shared Private Residential Parking Spots. Transp. Res. Rec. 2018, 2672, 942–952. [Google Scholar] [CrossRef]
  22. Zhang, S. Allocation and Pricing for Underground Parking Lot of Office Buidling in CBD. Master’s Thesis, Tsinghua University, Beijing, China, 2015. [Google Scholar]
  23. Ma, S.; Fang, W.; Jiang, H.; Han, M.; Li, C. Parking space recognition method based on parking space feature construction in the scene of autonomous valet parking. Appl. Sci. 2021, 11, 2759. [Google Scholar] [CrossRef]
  24. Ogás, M.G.D.; Fabregat, R.; Aciar, S. Survey of smart parking systems. Appl. Sci. 2020, 10, 3872. [Google Scholar] [CrossRef]
  25. Barriga, J.J.; Sulca, J.; León, J.L.; Ulloa, A.; Portero, D.; Andrade, R.; Yoo, S.G. Smart parking: A literature review from the technological perspective. Appl. Sci. 2019, 9, 4569. [Google Scholar] [CrossRef] [Green Version]
  26. Shelby, B.; Vaske, J.J.; Heberlein, T.A. Comparative analysis of crowding in multiple locations: Results from fifteen years of research. Leis. Sci. 1989, 11, 269–291. [Google Scholar] [CrossRef]
Figure 1. Parking lot GIS model.
Applsci 11 08680 g001
Figure 2. (a) Parking space turnover number; (b) Parking space average parking time; (c) Parking space total parking time; (d) The parking interval times are less than 0.5 h of every parking space; (e) Parking spaces occupancy condition at some time.
Applsci 11 08680 g002aApplsci 11 08680 g002b
Figure 3. System equilibrium and user equilibrium.
Applsci 11 08680 g003
Figure 4. Parking spaces dynamic allocation simulation flow chart.
Applsci 11 08680 g004
Figure 5. (a) Parking zone occupancy rate in zone A and B in actual situation; (b) Parking zone occupancy rate in zone A and B after implementing dynamic allocation.
Applsci 11 08680 g005
Figure 6. (a) Parking space turnover number after implementing dynamic allocation; (b) Parking space average parking time after implementing dynamic allocation; (c) Parking space total parking time after implementing dynamic allocation; (d) Parking space average interval time after implementing dynamic allocation.
Applsci 11 08680 g006
Table 1. The parking spaces supply–demand characteristics indexes system based on “parking space level”.
Index ClassificationSpecific IndexIndex Definition
Parking spaces spatial supply service level indexThe distance between parking space and pedestrian entrance and exit (elevator, stairs)Drivers search pedestrian entrances and exits are not always along the road grid, but often pass through parking spaces, hence the distance between parking space and pedestrian entrance and exit is a straight-line distance. For two points   A   X 1 , Y 1 ,   B   X 2 , Y 2 , the straight-line distance between A and B is: X 1 X 2 2 + Y 1 Y 2 2
The distance between parking space and vehicle entrance and exitDrivers search vehicle entrance and exit are always along the road grid, so the distance between parking space and vehicle entrance and exit is grid distance. For two points A   X 1 , Y 1 , B   X 2 , Y 2 , the grid distance between A and B is X 1 X 2 + Y 1 Y 2
Occupancy of parking spaces on both sides of parking space Applsci 11 08680 i001
Parking spaces demand characteristic indexParking space occupancy conditionAt a certain time, the parking space occupancy condition is divided into occupied and unoccupied
Parking space turnover numberOn a survey day, the total number of vehicles in a parking space during the period from opening to closing of the parking lot
Parking space total parking timeThe sum of the parking time of vehicles parked in a parking space
Parking space average parking timeTotal parking time divided by turnover number
Parking interval timeThe difference between the arrival time of the rear vehicle and the departure time of the front vehicle
Table 2. Scoring table of “occupancy of parking spaces on both sides of parking space”.
Location of Parking SpaceThe Plate Number on One Side Is aThe Plate Number on Other Side Is bValue
Separate parking spacea= −1b = −18
The parking space is on the sideplatenum [a] == “”b = −17
The parking space is on the sideplatenum [a] == “plate number”b = −15
The parking space is in the middleplatenum [a] == “”platenum [b] == “”8
The parking space is in the middleplatenum [a] == “”platenum [b] == “plate number”4
The parking space is in the middleplatenum [a] == “plate number”platenum [b] == “plate number”2
Note: “−1”means there is no parking space on the side.
Table 3. Parking spaces demand characteristics indexes in zones A and B before and after implementing the dynamic allocation of parking spaces.
Parking Spaces Demand Characteristics IndexesZone AZone BThe Difference between Zone A and B
Parking space turnover number in actual situation (times)2.264.502.24
Parking space turnover number after dynamic allocation (times)2.932.960.03
Parking space average parking time in actual situation (hours)5.02.82.2
Parking space average parking time after dynamic allocation (hours)4.34.40.1
Parking space total parking time in actual situation (hours)8.49.71.3
Parking space total parking time after dynamic allocation (hours)8.79.30.6
Publisher’s Note: MDPI stays neutral with regard to jurisdictional claims in published maps and institutional affiliations.

