
Application of Integrated Geophysical Methods for Site Suitability of Research Infrastructures (RIs) in China

 ,
,
Abstract
:1. Introduction
2. RIs Requirements and Approaches
3. Geological Conditions
4. Methods
4.1. Geophysical Surveys
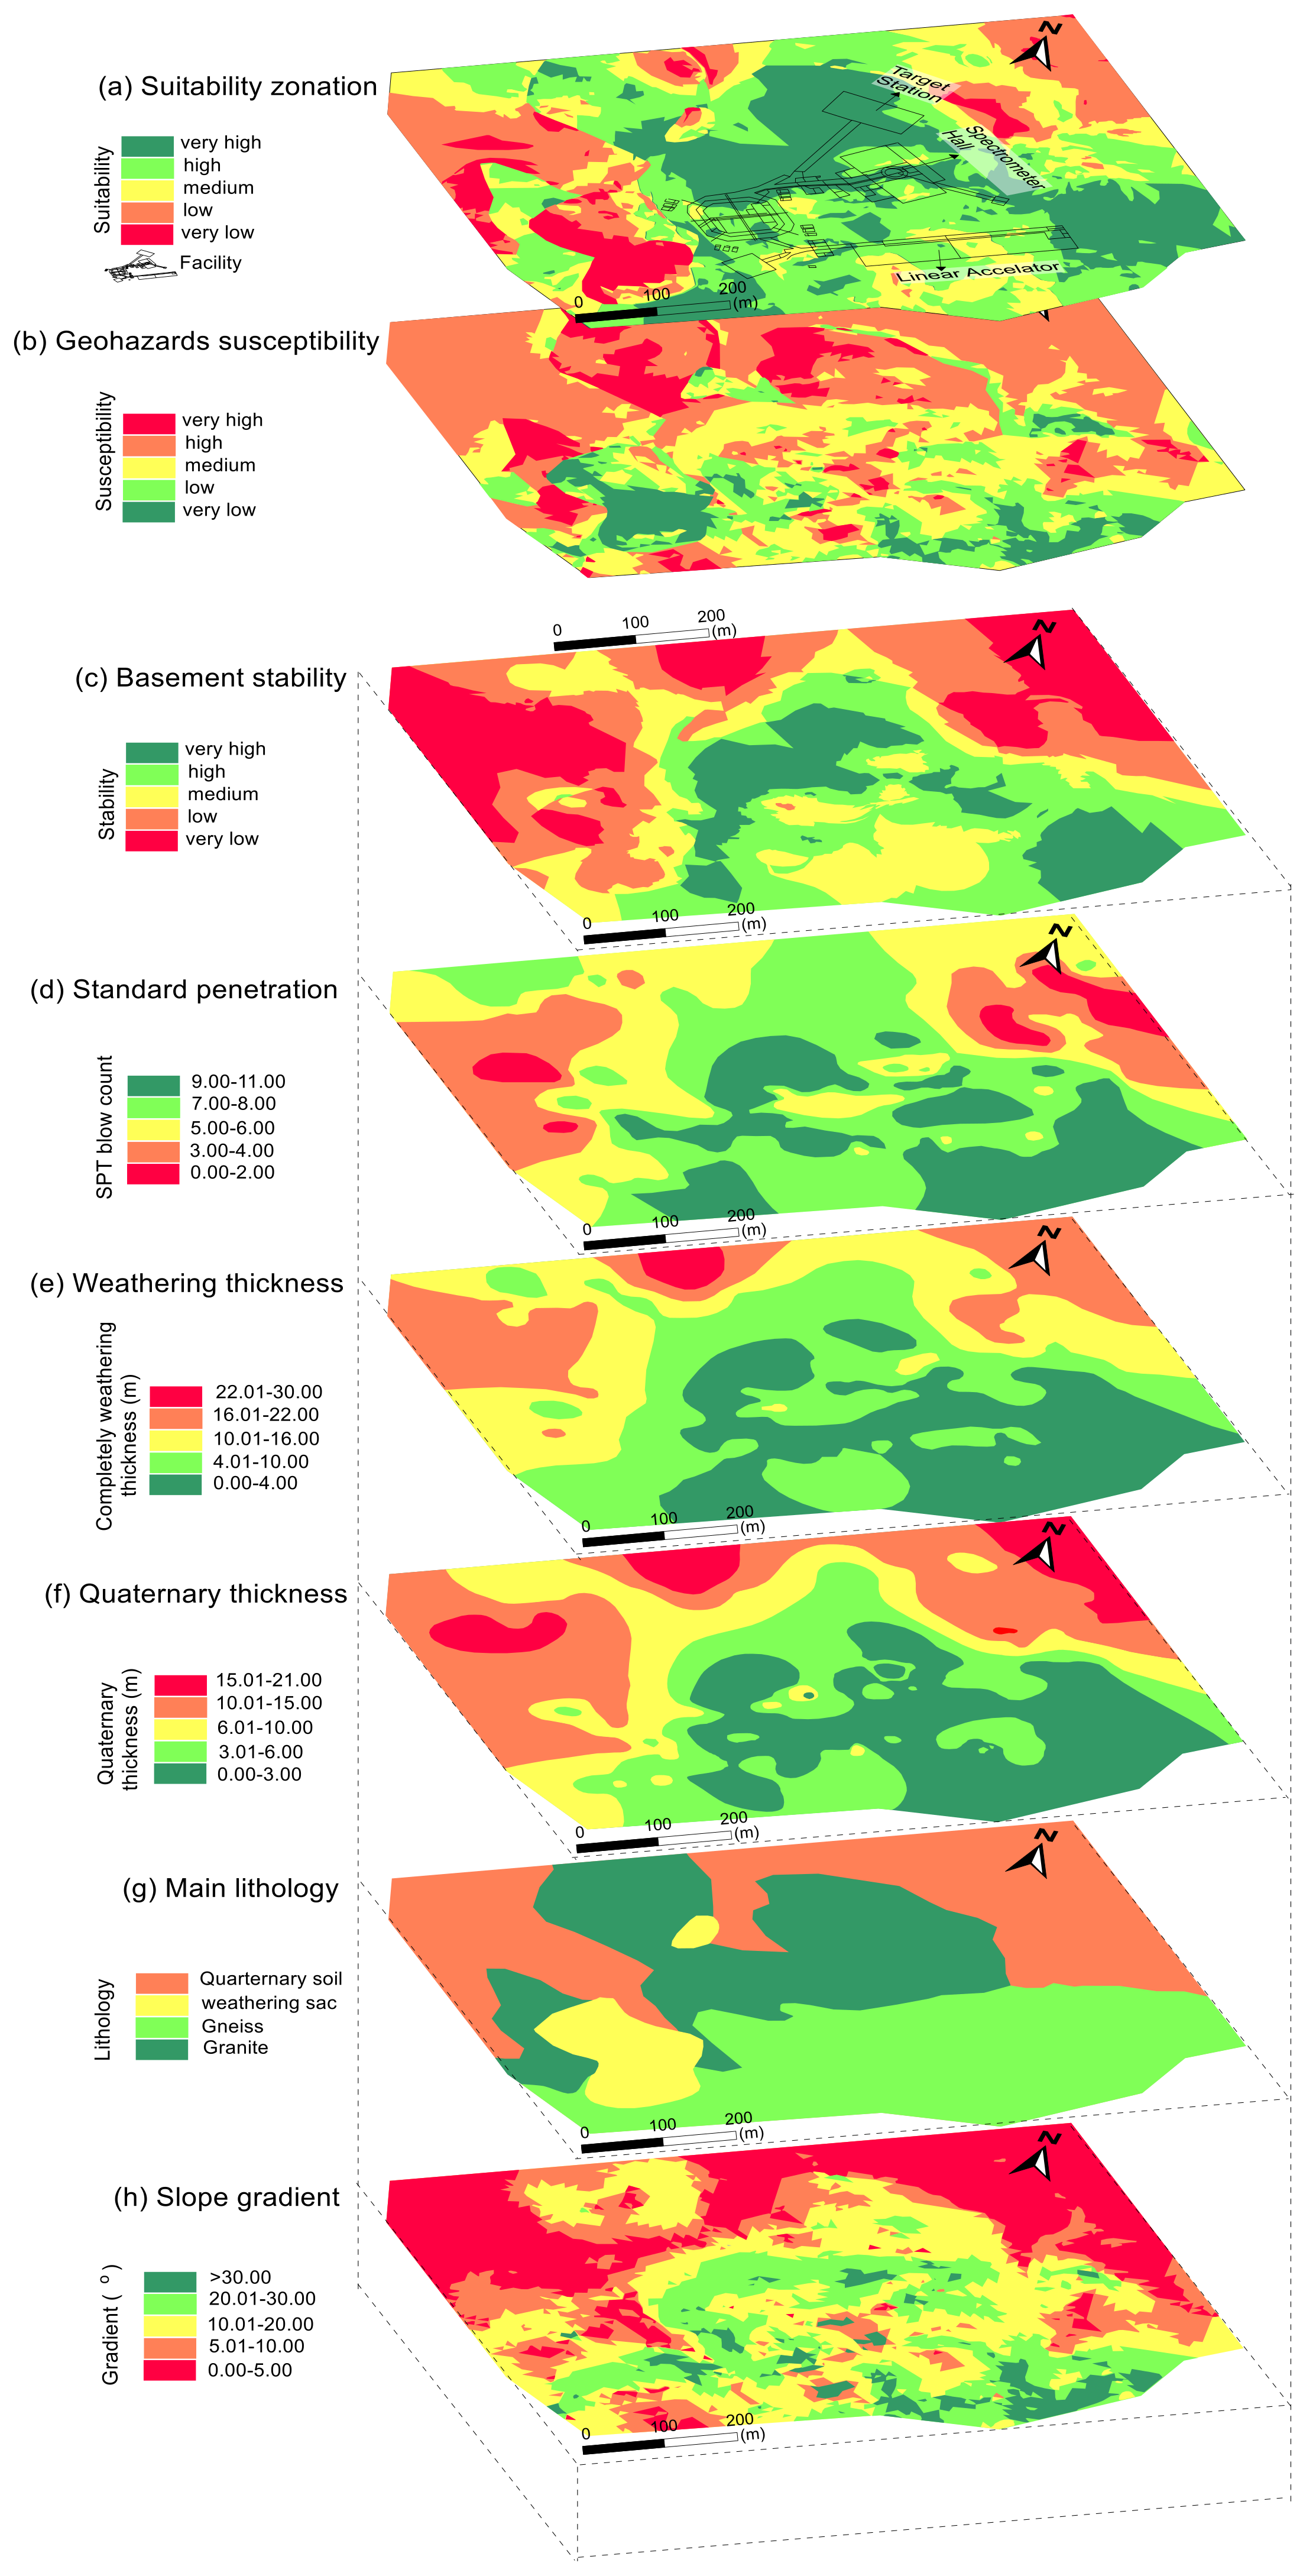
4.2. Site Suitability Evaluation Based on Multi-Factors
5. Results and Discussion
5.1. DBNL Site
5.2. CSNS Site
6. Conclusions
Author Contributions
Funding
Institutional Review Board Statement
Informed Consent Statement
Data Availability Statement
Acknowledgments
Conflicts of Interest
References
- Thacker, S.; Adshead, D.; Fay, M.; Hallegatte, S.; Harvey, M.; Meller, H.; O’Regan, N.; Rozenberg, J.; Watkins, G.; Hall, J.W. Infrastructure for sustainable development. Nat. Sustain. 2019, 2, 324–331. [Google Scholar] [CrossRef]
- Horvat, M. The New Framework for EU Research and Innovation. Science 2011, 334, 1214295. [Google Scholar] [CrossRef] [PubMed] [Green Version]
- Guoxing, C.; Jiao, Z.; Mengyun, Q.; Wenping, G. Three-dimensional site characterization with borehole data–A case study of Suzhou area. Eng. Geol. 2018, 234, 65–82. [Google Scholar]
- Bukovská, Z.; Soejono, I.; Vondrovic, L.; Vavro, M.; Souček, K.; Buriánek, D.; Dobeš, P.; Švagera, O.; Waclawik, P.; Řihošek, J.; et al. Characterization and 3D visualization of underground research facility fordeep geological repository experiments: A case study of underground research facility Bukov, Czech Republic. Eng. Geol. 2019, 259, 105–186. [Google Scholar] [CrossRef]
- Pero, H. Research infrastructures of pan-European interest: The EU and global issues. Nucl. Instrum. Methods Phys. Res. A Accel. Spectrometers Detect. Assoc. Equip. 2011, 626–627, S69–S71. [Google Scholar] [CrossRef]
- Florio, M.; Sirtori, E. Social benefits and costs of large scale research infrastructures. Technol. Forecast. Soc. Chang. 2016, 112, 65–78. [Google Scholar] [CrossRef]
- Qiao, L.; Mu, R.; Chen, K. Scientific effects of large research infrastructures in China. Technol. Forecast. Soc. Chang. 2016, 112, 102–112. [Google Scholar] [CrossRef]
- Lesko, K.T. The Deep Underground Science and Engineering Laboratory at Homestake. AIP Conf. Proc. 2009, 1182, 230. [Google Scholar] [CrossRef]
- Feng, X.T.; Wu, S.Y.; Li, S.J.; Qiu, S.L.; Xiao, Y.X.; Feng, G.L.; Shen, M.B.; Zeng, X.H. Comprehensive field monitoring of deep tunnels at Jinping underground laboratory (CJPL–II) in China. Chin. J. Rock Mech. Eng. 2016, 35, 649–657, (In Chinese with English Abstract). [Google Scholar]
- Li, K.; Shang, Y.J.; He, W.T.; Lin, D.M.; Hasan, M.; Wang, K.Y. An engineering site suitability index (ESSI) for the evaluation of geological situations based on a multi-factor interaction matrix. Bull. Eng. Geol. Environ. 2017, 18, 1–9. [Google Scholar] [CrossRef]
- Major Scientific and Technological Infrastructure of Chinese Academy of Sciences (MSTI), 2009, Suppl. 4: The Development of Large Scientific Devices in the World [EB/OL]. Available online: http://www.lssf.cas.cn/zlyj/zlyjk/200912/t20091220_2711889,html (accessed on 20 December 2009).
- Juang, C.H.; Carranza-Torres, C.; Crosta, G.; Dong, J.J.; Gokceoglu, C.; Jibson, R.W.; Shakoor, A.; Tang, H.; Asch, T.W.J.; Wasowski, J. Engineering geology—A fifty year perspective. Eng. Geol. 2016, 201, 67–70. [Google Scholar] [CrossRef]
- Krietsch, H.; Doetsch, J.; Dutler, N.; Jalali, M.; Gischig, V.; Loew, S.; Amann, F. Data Descriptor: Comprehensive geological dataset describing a crystalline rock mass for hydraulic stimulation experiments. Sci. Data 2018, 5, 180269. [Google Scholar] [CrossRef] [Green Version]
- Gu, B.H. Commentary on Typical Cases of Geotechnical Engineering; China Construction Industry Publishing House: Beijing, China, 2015. [Google Scholar]
- Zhang, C. The Beijing electron—positron collider and its second phase construction. Sci. Technol. Rev. 2004, 11, 23–27. [Google Scholar]
- Wang, Y.F.; Cao, J.; Chen, S.; Yuekun, H.; Meng, W. The 2013 annual report of physical analysis for Daya Bay Reactor Neutrino Experiment. Sci. Technol. Innov. Her. 2016, 24, 184. [Google Scholar]
- Shang, Y.J.; Jin, W.J.; Chen, Y.W.; Li, K. From the theory of rock mass structure controlling to site selection and evaluation practice for large scale scientific facilities. J. Eng. Geol. 2014, 22, 731–738. [Google Scholar]
- Shang, Y.J.; Jin, W.J.; Wang, K.Y.; Zhang, H.; Yang, P. Characteristics of rock depth and resistivity in the alluvial-pluvial fan of Chaobai River: A case study of Mangniu River block in Yanqi development zone. Sci. Technol. Eng. 2018, 18, 14–21. [Google Scholar]
- Hasan, M.; Shang, Y.; Jin, W. Delineation of weathered/fracture zones for aquifer potential using an integrated geophysical approach: A case study from South China. J. Appl. Geophys. 2018, 157, 47–60. [Google Scholar] [CrossRef]
- Song, J.B.; Liu, H.; Wang, W.J.; Xiang, X.O. The introduction and proceeding on sitting SKA and FAST radio telescope in Guizhou Province. Guizhou Sci. 2007, 25, 86–97. [Google Scholar]
- Marcelli, A. The large research infrastructures of the People’s Republic of China: An investment for science and technology. Phys. Status Solidi B 2014, 251, 1158–1168. [Google Scholar] [CrossRef]
- The State Council of China (SCC), Medium and Long Term Planning for Major National Science and Technology Infrastructure Construction (2012—2030). Available online: https://baike.sogou.com/v85308089,htm (accessed on 23 February 2013).
- National Development and Reform Commission of China (NDRC), National XIII Five-Year Plan for Major Scientific and Technological Infrastructure Construction. 3 February 2017 Economic Reference. Available online: http://finance.sina.com.cn/roll/2017-02-03/doc-ifyaexzn8737139,shtml (accessed on 3 February 2017).
- Wu, S. How science saved China. Nature 2019, 574, 25–28. [Google Scholar] [CrossRef]
- Stewart, S. Exploring the continental shelf for low geological risk nuclear waste repository sites using petroleum industry databases: A UK case study. Eng. Geol. 2002, 67, 139–168. [Google Scholar] [CrossRef]
- Chang, K.T.; Merghadi, A.; Yunus, A.P.; Pham, B.T.; Dou, J. Evaluating scale effects of topographic variables in landslide susceptibility models using GIS based machine learning techniques. Sci. Rep. 2019, 9, 12296. [Google Scholar] [CrossRef] [Green Version]
- Gao, L.; Ma, C.M.; Wang, Q.X.; Zhou, A. Sustainable use zoning of land resources considering ecological and geological problems in Pearl River Delta Economic Zone, China. Sci. Rep. 2019, 9, 16052. [Google Scholar] [CrossRef] [PubMed] [Green Version]
- Bialowons, W.; Osborne, J.A.; Shirkov, G. Siting Study for European International Linear Collider (ILC) Sites; ILC-HiGrade-Report-2010-004-1; ILC-Europe: Eindhoven, The Netherlands, 31 March 2010. [Google Scholar]
- Institute of Geology and Geophysics, Chinese Academy of Sciences (IGGCAS). Engineering Geological Investigation Report of Daya Bay Neutrino Experimental Tunnel (Feasibility Study Phase & Preliminary Design Phase). It Includes 7 Special Reports. (1) Summary Report of Site Mapping Engineering Technology; (2) Engineering Geological Mapping Report; (3) Geophysical Exploration Report; (4) Engineering Drilling Report; (5) In Situ Stress Test Report; (6) Ultrasonic Imaging Test Report; (7) Laboratory Test Report; Institute of Geology and Geophysics, Chinese Academy of Sciences (IGGCAS): Beijing, China, 2006. [Google Scholar]
- Institute of Geology and Geophysics, Chinese Academy of Sciences (IGGCAS). General Report on Engineering Geological Investigation of Dongguan Dalang Site of China Spallation Neutron Source (Feasibility Study Phase). It Includes 2 Special Reports. (1) Engineering Geological Mapping Report; (2) Geophysical Exploration Report; Institute of Geology and Geophysics, Chinese Academy of Sciences (IGGCAS): Beijing, China, 2007. [Google Scholar]
- Lin, D.M. Study on Rock Mass Structure and Geophysics Features for Granite in Shallow-Take CSNS for Example. Ph.D. Thesis, Institute of Geology and Geophysics, Chinese Academy of Sciences, Beijing, China, 2012. [Google Scholar]
- Azaiez, H.; Gabtni, H.; Bédir, M. Joint Gravity and Seismic Reflection Methods to Characterize the Deep Aquifers in Arid Ain El Beidha Plain (Central Tunisia, North Africa). Water 2021, 13, 1310. [Google Scholar] [CrossRef]
- Sun, S.; Yin, C.; Gao, X. 3D Gravity Inversion on Unstructured Grids. Appl. Sci. 2021, 11, 722. [Google Scholar] [CrossRef]
- Institute of Geology and Geophysics, Chinese Academy of Sciences (IGGCAS). Engineering Geological Investigation Report of Beijing Advanced Light Source (Feasibility Study Phase); Institute of Geology and Geophysics, Chinese Academy of Sciences (IGGCAS): Beijing, China, 2011. [Google Scholar]
- Institute of Geology and Geophysics, Chinese Academy of Sciences (IGGCAS). Engineering Geological Investigation Report of LHAASO (Feasibility Study Phase); Institute of Geology and Geophysics, Chinese Academy of Sciences (IGGCAS): Beijing, China, 2013. [Google Scholar]
- Institute of Geology and Geophysics, Chinese Academy of Sciences (IGGCAS). Geophysical Exploration Report of LHAASO; Institute of Geology and Geophysics, Chinese Academy of Sciences (IGGCAS): Beijing, China, 2013. [Google Scholar]
- Institute of Geology and Geophysics, Chinese Academy of Sciences (IGGCAS). Engineering Geology and Geophysical Exploration Report on the Daocheng Site of LHAASO (Feasibility Study Phase); Institute of Geology and Geophysics, Chinese Academy of Sciences (IGGCAS): Beijing, China, 2014. [Google Scholar]
- Institute of Geology and Geophysics, Chinese Academy of Sciences (IGGCAS). General Report of Engineering Geological Investigation at HUIZHOU for ADS and HIAF (Feasibility Study Phase). It Includes 2 Special Reports. (1) Geological Survey Report; (2) Geophysical Exploration Report; Institute of Geology and Geophysics, Chinese Academy of Sciences (IGGCAS): Beijing, China, 2015. [Google Scholar]
- Huang, Q.Y. Base zero subsidence control technology in multi boundary geological conditions. Guangdong Archit. Civ. Eng. 2014, 8, 37–40. [Google Scholar]
- Chen, Y. China Spallation Neutron Source (CSNS). Bul. Chin. Acade. Sci. 2011, 26, 725–728. [Google Scholar]
- Sun, L.; Liao, X.; Pan, Z. Analysis of campus planning and architectural design of national scientific device: A case study of China Spallation Neutron Source. New Archit. 2015, 3, 68–71. [Google Scholar]
- Xu, J.; Wang, J. Assessment of rock mass quality based on rock quality designation and rock block index—Taking the Borehole BS01 in Beishan HLW disposal repository as example. Uranium Geol. 2006, 22, 295–299. [Google Scholar]
- Hoek, E.; Marinos, P.G. Predicting tunnel squeezing problems in weak heterogeneous rock masses. Tunn. Tunn. Int. 2000, 132, 45–51. [Google Scholar]
- Mira Geoscience Ltd. GOCAD Mining Suite 3D Geological Modeling Software; Nancy University: Lorraine, France, 1999. [Google Scholar]
- Therrien, R.; McLaren, R.G.; Sudicky, E.A.; Panday, S.M. HydroGeoSphere–A Three Dimensional Numerical Model Describing Fully-Integrated Subsurface and Surface Flow and Solute Transport; Universite Laval and University of Waterloo: Waterloo, ON, Canada, 2007; p. 379. [Google Scholar]
- Song, D.G.; Hu, X.W. The application of GOCAD technology in urban environmental geology evaluation. J. Geol. Hazards Environ. Preserv. 2009, 20, 55–59. [Google Scholar]
- Yang, P. Study on Site Selection and Control for Large Research Infrastructure Under Complicated Geological Conditions: A Case Study of CIADS and HIAF. Ph.D. Thesis, Institute of Geology and Geophysics, Chinese Academy of Sciences, Beijing, China, 2018. [Google Scholar]
- Li, K. Site Suitability Assessment on Large Research Infrastructures and Its Application. Ph.D. Thesis, Institute of Geology and Geophysics, Chinese Academy of Sciences, Beijing, China, 2014. [Google Scholar]
- Shang, Y.J.; Shi, Y.Y.; Lin, D.; Wu, F.B.; Zhang, W. Analysis on relationship between buried depth and variation of in-situ stress in granitic rocks. Rock Soil Mech. 2011, 32, 1430–1436. [Google Scholar]
- Wu, L.; Liu, Y.; Zhang, J. GIS-Principle, Approaches and Application; Science Press: Beijing, China, 2004. [Google Scholar]
- ESRI. ESRI data and maps for ArcGIS; Environmental Systems Research Institute: Redlands, CA, USA, 2021. [Google Scholar]
- Shang, Y.J.; Wei, S.Y.; Jin, W.J.; Lin, D.; Yang, P. Discovery and explanation of muddy girdle under sharp turn of one ridge: A case study at the CSNS site of Guangdong Province. J. Eng. Geol. 2018, 26, 561–571. [Google Scholar] [CrossRef]


| No | Name | Geological Characteristics | Location | Site Selection Periods | Investigation Result | Evaluation Result | Construction Period and Operation Result | Ref. |
|---|---|---|---|---|---|---|---|---|
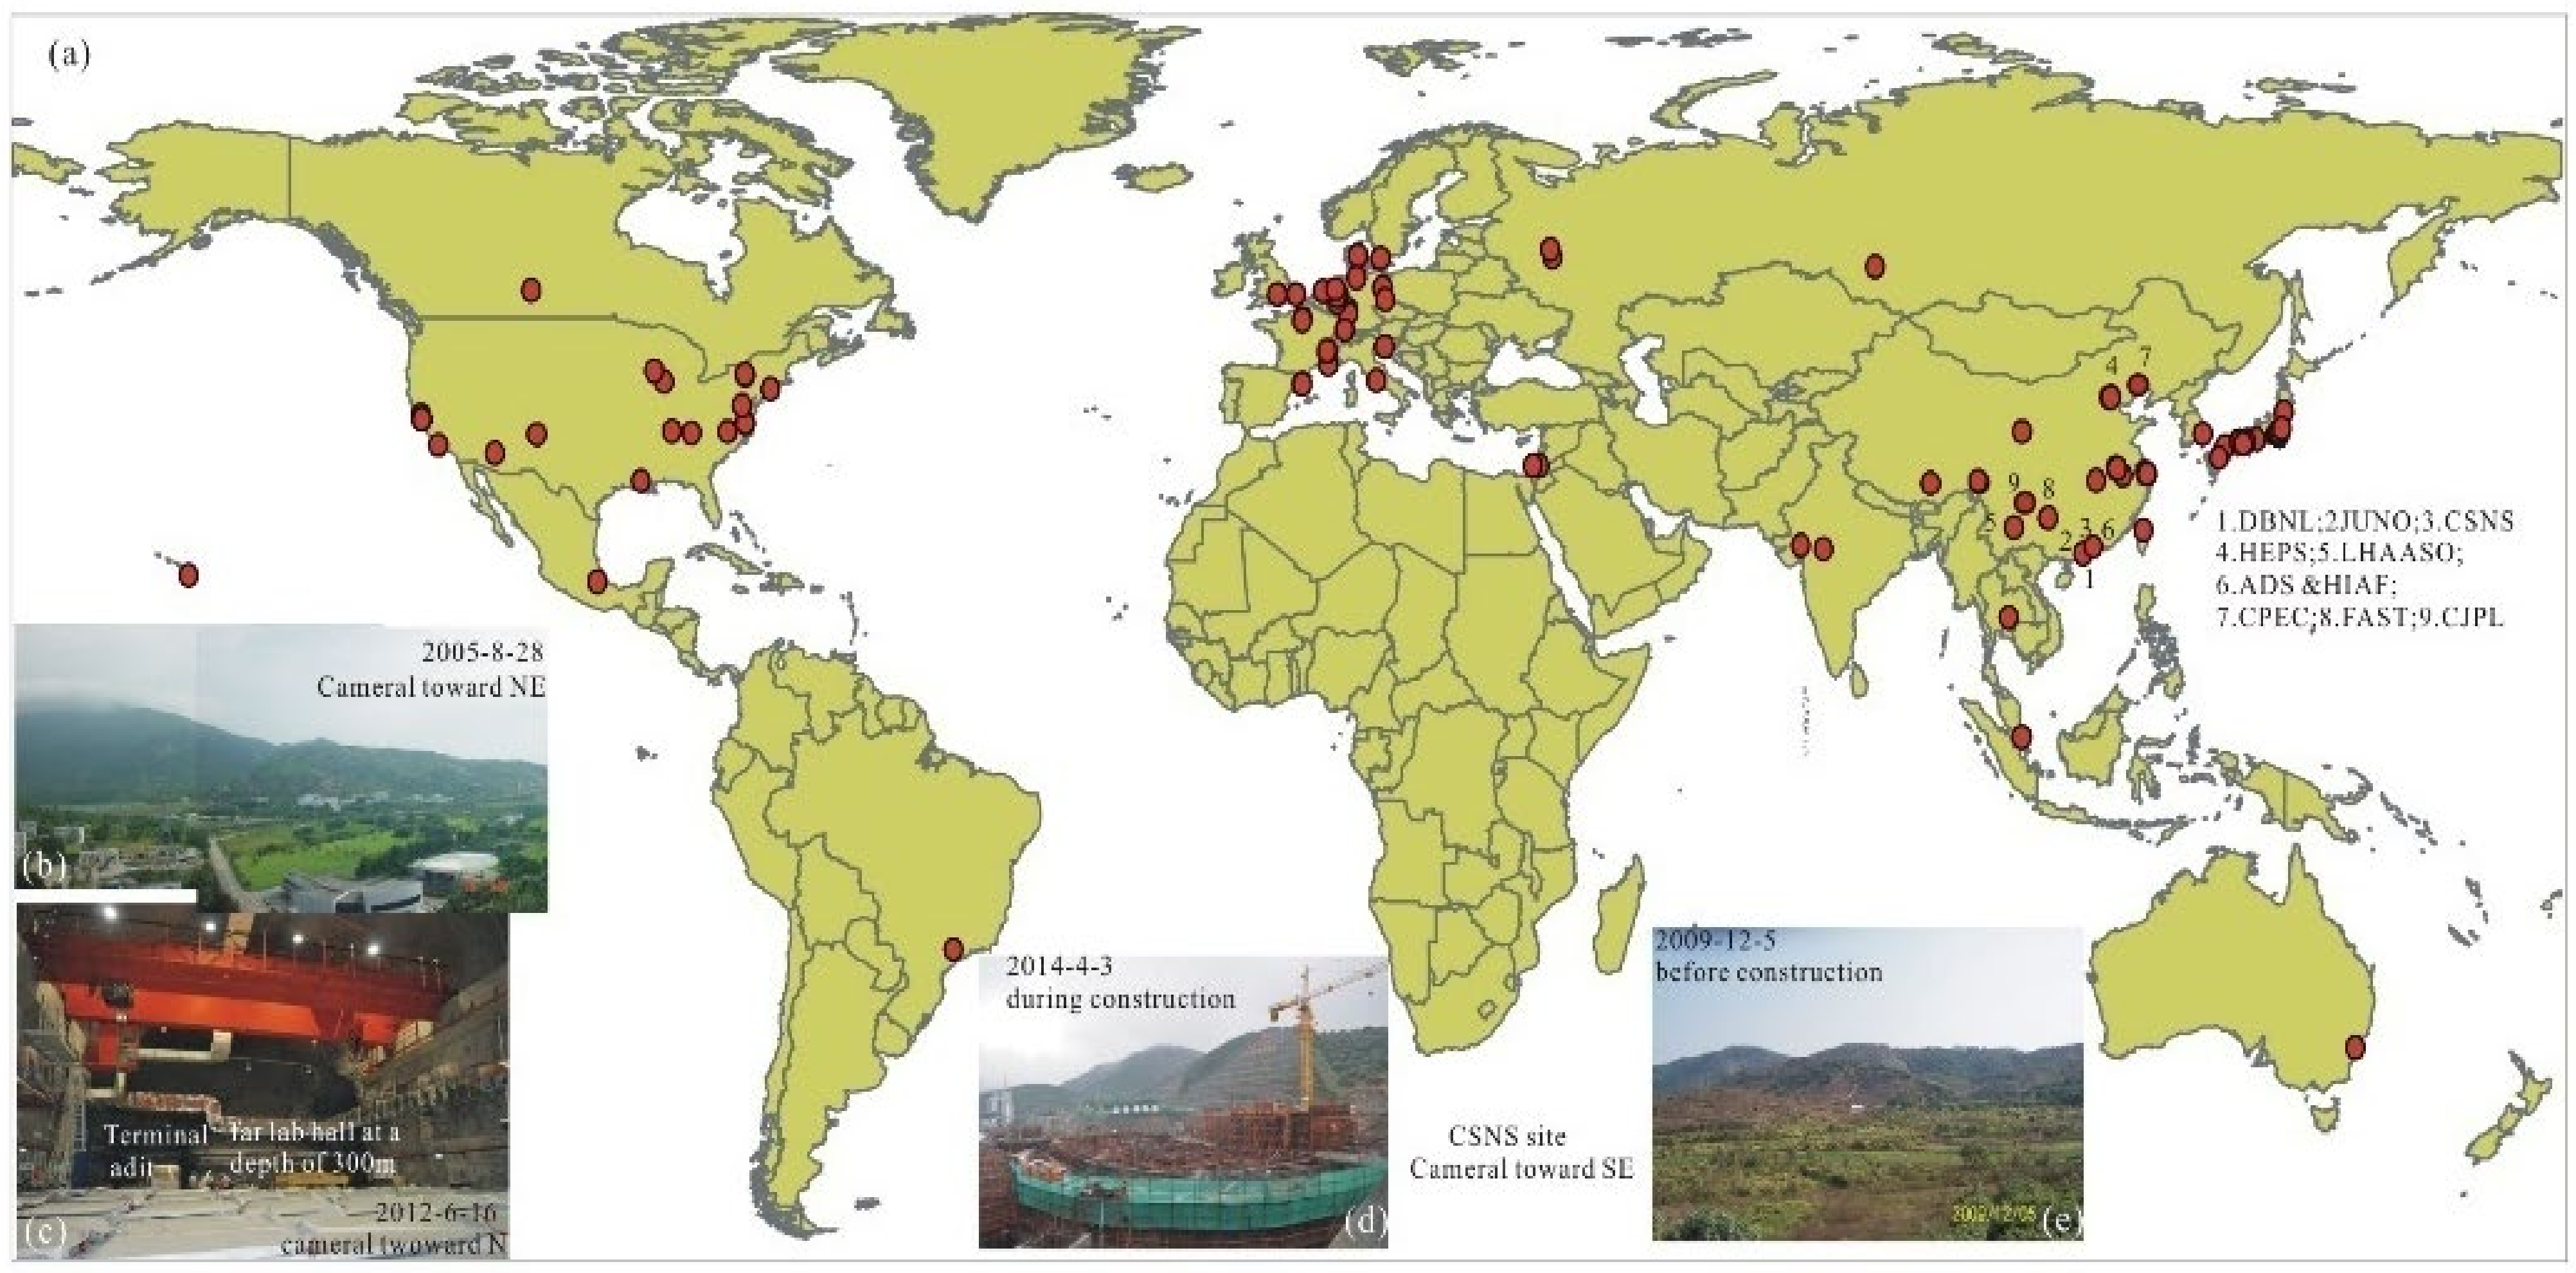
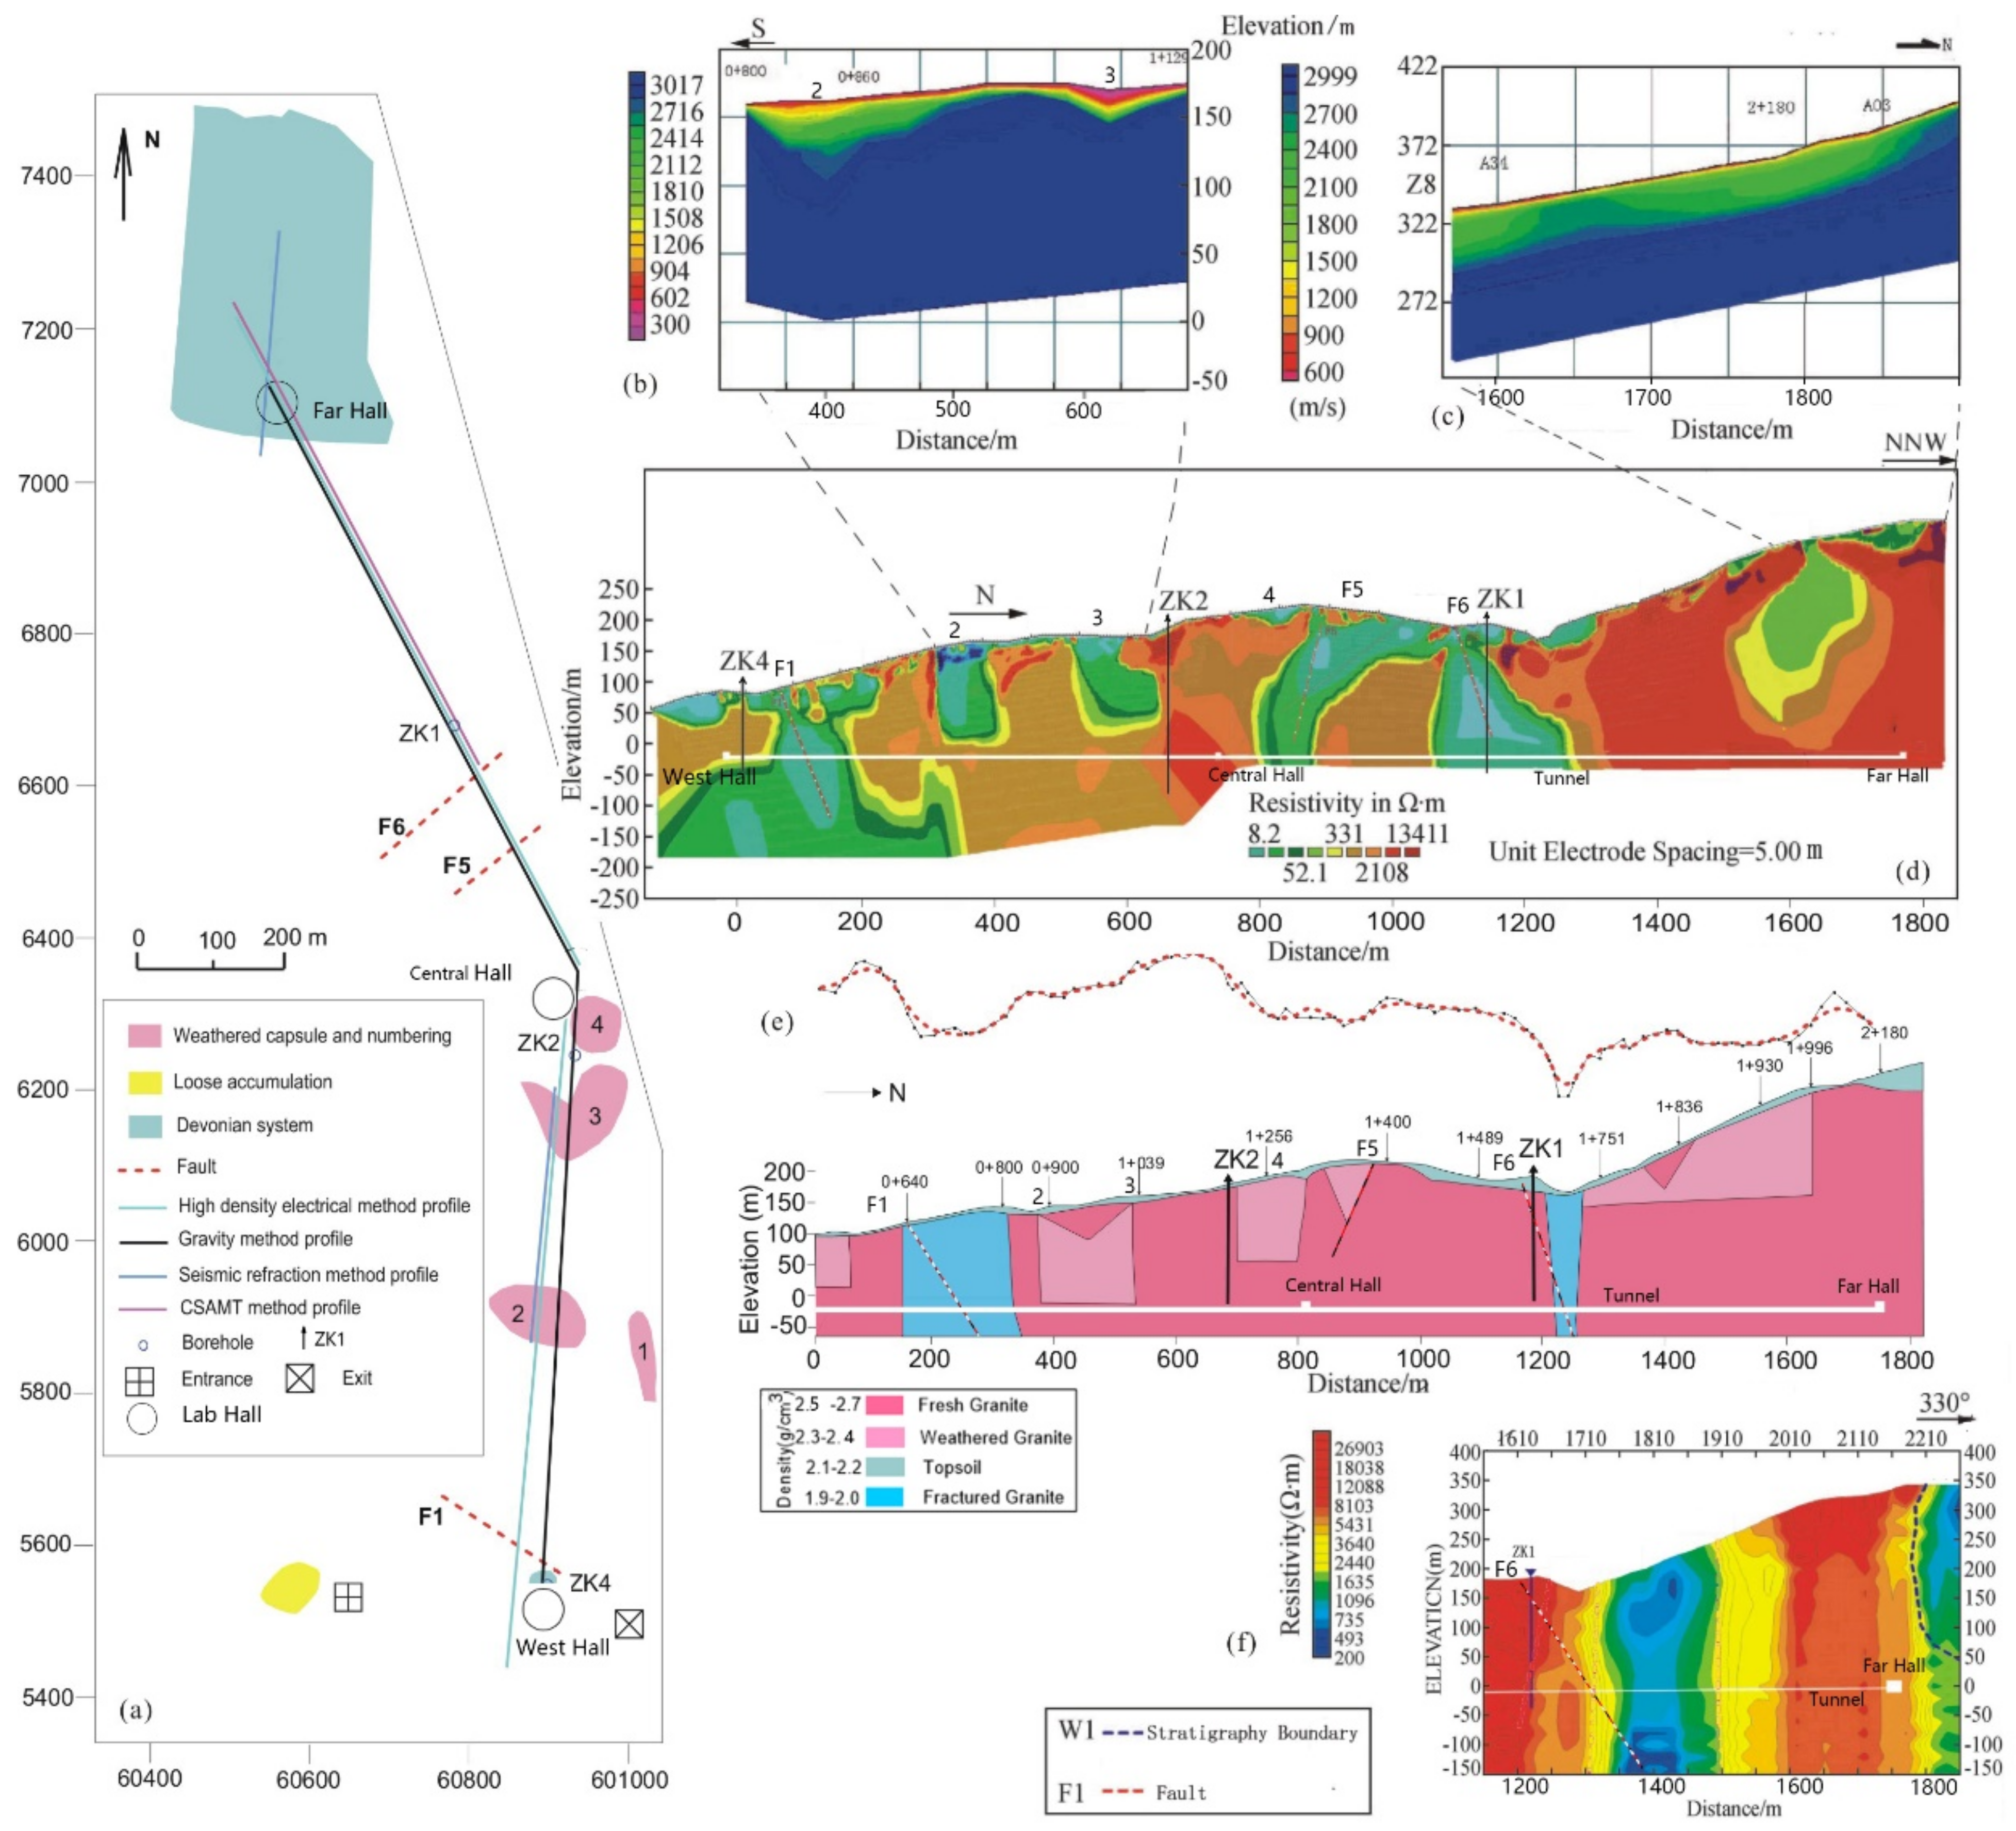
| 1 | Daya Bay Neutrino Laboratory (DBNL) | Granite tunnel and hall | Daya Bay, Shenzhen | 2005–2006 | South limb of Paiyashan syncline, granite contact with Devonian sandstones. Four weathering troughs, 3 faults | Site suitability | 2007–2011, 2013; innovative scientific outcomes | [16] |
| 2 | Jiangmen Underground Neutrino Observatory (JUNO) | Sandstone inclined shaft, granite shaft, and hall | Kaiping, Jiangmen | 2011–2013 | Granite contact with sandstone having complex fold | Site suitability | 2014–2020, under construction | [17] et al. |
| 3 | China Spallation Neutron Source (CSNS) | Buried tunnel and basement in compound gneiss and granite | Dalang, Dong’guan | 2006–2009 | Weathering profile with 50 m thickness troughs, and 4 faults | Site suitability | 2010–2016, in operation | [10,17] |
| 4 | High Energy Photon Source Test Facility (HEPS) | Buried tunnel and basement in sandy gravel layer | Huairou, Beijing | 2011–2017 | 300m sandy gravels over granite and fractured pyroclastic rocks in west of Gaoliying active fault | Site foundation (medium complex) | Abandoned due to granite margin, afterward, a site was selected 5 km north ward with larger area of granite in 2018, currently under construction | [17,18] |
| 5-1 | High Altitude Cosmic Ray Observatory (LHAASO) | Mudstone, limestone basement, and slope | Zhongdian, Yun’nan | 2013 | Over 118 sinkholes, 12 water-accumulating depressions, landslides and sand slopes, 4 uphill routes | unsuitable | Abandoned due to karst development | [18] |
| 5-2 | High Altitude Cosmic Ray Observatory (LHAASO) | Granite basement and slope | Daocheng, Sichuan | 2013–2014 | Glacier remnants of plateau ice cap, riverside beach | Medium suitable | 2016, currently under construction | [17] |
| 6-1 | High-Intensity Accelerator Facility (HIAF) and Accelerator Driven System (ADS) | Sandstone basement and slope | Dongsheng, Inner Mongolia | 2012 | Strong permeability of rock mass, storage of surface flood | unsuitable | To consider other places, including Shandong, Jiangsu, and Guangdong | [17] |
| 6-2 | High-Intensity Accelerator Facility (HIAF) and Accelerator Driven System (ADS) | Dacite, Pyroclastic rocks basement, and slope | Huizhou, Guangdong | 2014 | Strong permeability of rock mass and 40m weathering profile | Medium suitable | Under construction | [19] |
| 7 | Circular Electron-Positron Collider (CPEC) | Granite tunnel | Zhangjiakou, Chengde, qinghuangdao, Guangdong | 2013–present | Soft Foundation, Uneven Settlement and Moving Head Treatment | Funing granite in Qinhuangdao, Huizhou granite | Site selection | [17] |
| 8 | Five-hundred meters Aperture Spherical Telescope (FAST) | Limestone basement | Pingtang, Guizhou | 2006–2007 | Karst depression with a diameter of 500 m | Basement stability and runoff discharge | 2008–2013, in operation | [20] |
| 9 | Jinping underground laboratory(CJPL) | Marble tunnel | Jinping, Sichuan | 2008 | High geostress and rock burst | 2400 m deep incomplete marble | 2009–2010, in operation | [9] |
| Phase | Name | Evaluation | Objectives | Main Problems |
|---|---|---|---|---|
| 1 | Site selection | Suitability | Geological model | Discontinuity |
| 2 | Plan and design | Feasibility | Parameters | Discrete layers |
| 3 | Construction | Disturbance | Materials | Unfavorable geological body |
| 4 | Operation | Reliability | Rebalance | Complex site evolution |
| Lab Hall | Bottom/Surface Elevation (m) | Buried Thickness (m) | Point Distance-DaYa/Left Central Point (m) | Line Distance-LingAo/Left Central Point (m) | Drilling Depth (m) |
|---|---|---|---|---|---|
| West | −23.00/88 | 121 | 361.071/E41 | — | ZK4 133 |
| Central | −20.57/198 | 218 | 1155.604 | 871.340 | ZK2 210.6 |
| East | −19.17/98 | 117 | — | 445.35/W52 | ZK3 130.3 |
| Far | −17.87/347 | 364 | 1985.697 | 1598.572 | ZK1 213.1 |
Publisher’s Note: MDPI stays neutral with regard to jurisdictional claims in published maps and institutional affiliations. |
© 2021 by the authors. Licensee MDPI, Basel, Switzerland. This article is an open access article distributed under the terms and conditions of the Creative Commons Attribution (CC BY) license (https://creativecommons.org/licenses/by/4.0/).
Share and Cite
Shang, Y.-J.; Yang, C.-G.; Jin, W.-J.; Chen, Y.-W.; Hasan, M.; Wang, Y.; Li, K.; Lin, D.-M.; Zhou, M. Application of Integrated Geophysical Methods for Site Suitability of Research Infrastructures (RIs) in China. Appl. Sci. 2021, 11, 8666. https://doi.org/10.3390/app11188666
Shang Y-J, Yang C-G, Jin W-J, Chen Y-W, Hasan M, Wang Y, Li K, Lin D-M, Zhou M. Application of Integrated Geophysical Methods for Site Suitability of Research Infrastructures (RIs) in China. Applied Sciences. 2021; 11(18):8666. https://doi.org/10.3390/app11188666
Chicago/Turabian StyleShang, Yan-Jun, Chang-Gen Yang, Wei-Jun Jin, Yan-Wei Chen, Muhammad Hasan, Yue Wang, Kun Li, Da-Ming Lin, and Min Zhou. 2021. "Application of Integrated Geophysical Methods for Site Suitability of Research Infrastructures (RIs) in China" Applied Sciences 11, no. 18: 8666. https://doi.org/10.3390/app11188666
APA StyleShang, Y.-J., Yang, C.-G., Jin, W.-J., Chen, Y.-W., Hasan, M., Wang, Y., Li, K., Lin, D.-M., & Zhou, M. (2021). Application of Integrated Geophysical Methods for Site Suitability of Research Infrastructures (RIs) in China. Applied Sciences, 11(18), 8666. https://doi.org/10.3390/app11188666