
An Investigation of Work-Based Education and Training Needs for Effective BIM Adoption and Implementation: An Organisational Upskilling Model


Abstract
:1. Introduction
2. Literature Review
2.1. Hypotheses Derivation from Exploratory Studies
2.2. Hypotheses Derivation from Existing Frameworks
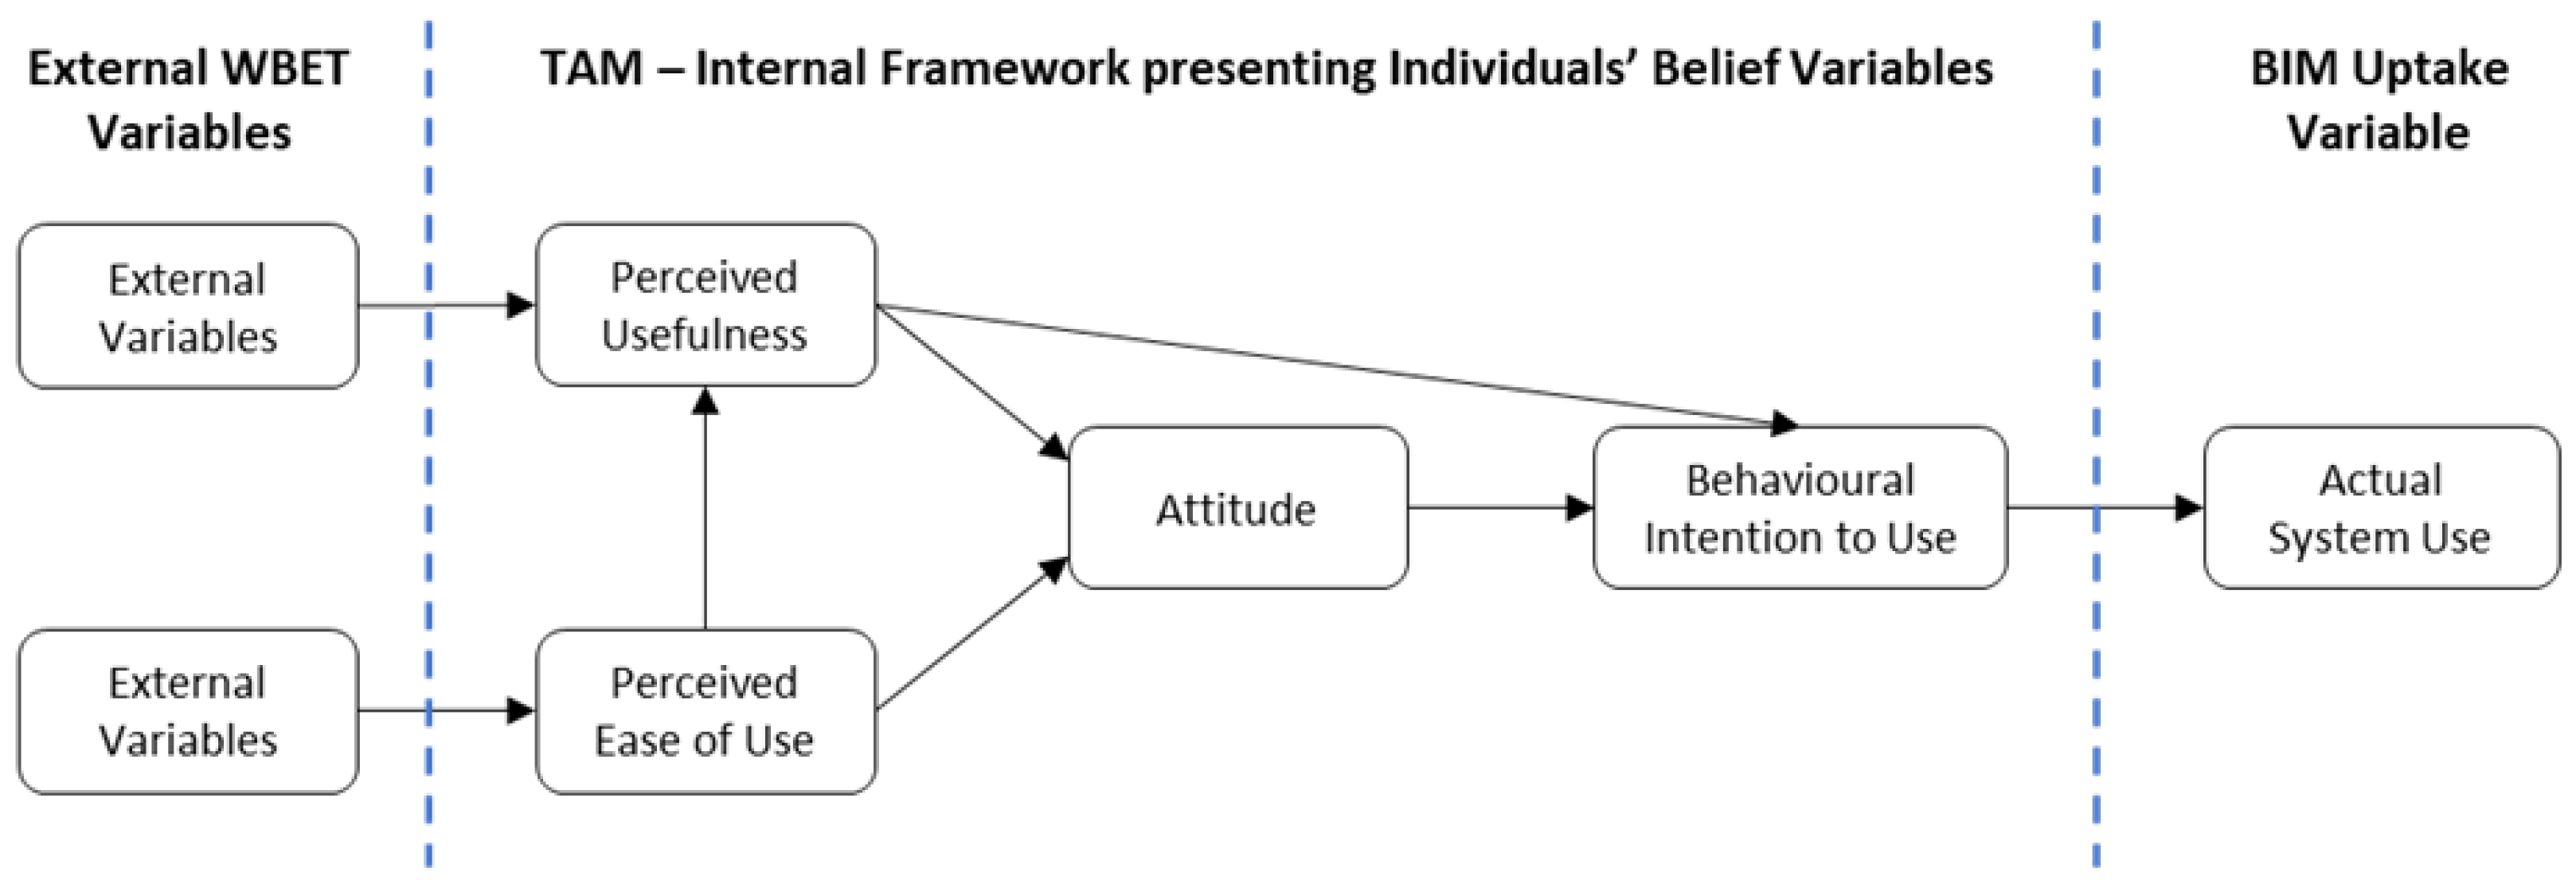
2.3. Hypothesis Derivation from Theoretical Models
3. Proposed OUM Model and Research Methodology
3.1. Approach
3.2. Variables and Hypotheses
3.3. Questionnaire and Survey Design
3.4. Sampling and Measurement
4. Data Analysis and Findings
4.1. Convergent Validity
4.1.1. Outer Loadings
4.1.2. Composite Reliability and Average Variance Extracted
4.2. Discriminant Validity
Cross Loading and Fornell-Larker Criterion
4.3. Hypotheses Testing Measurements
4.3.1. Significance Measurement
4.3.2. Coefficient of Determination and Predictive Relevance
4.4. Hypotheses Testing Measurements
5. Discussion
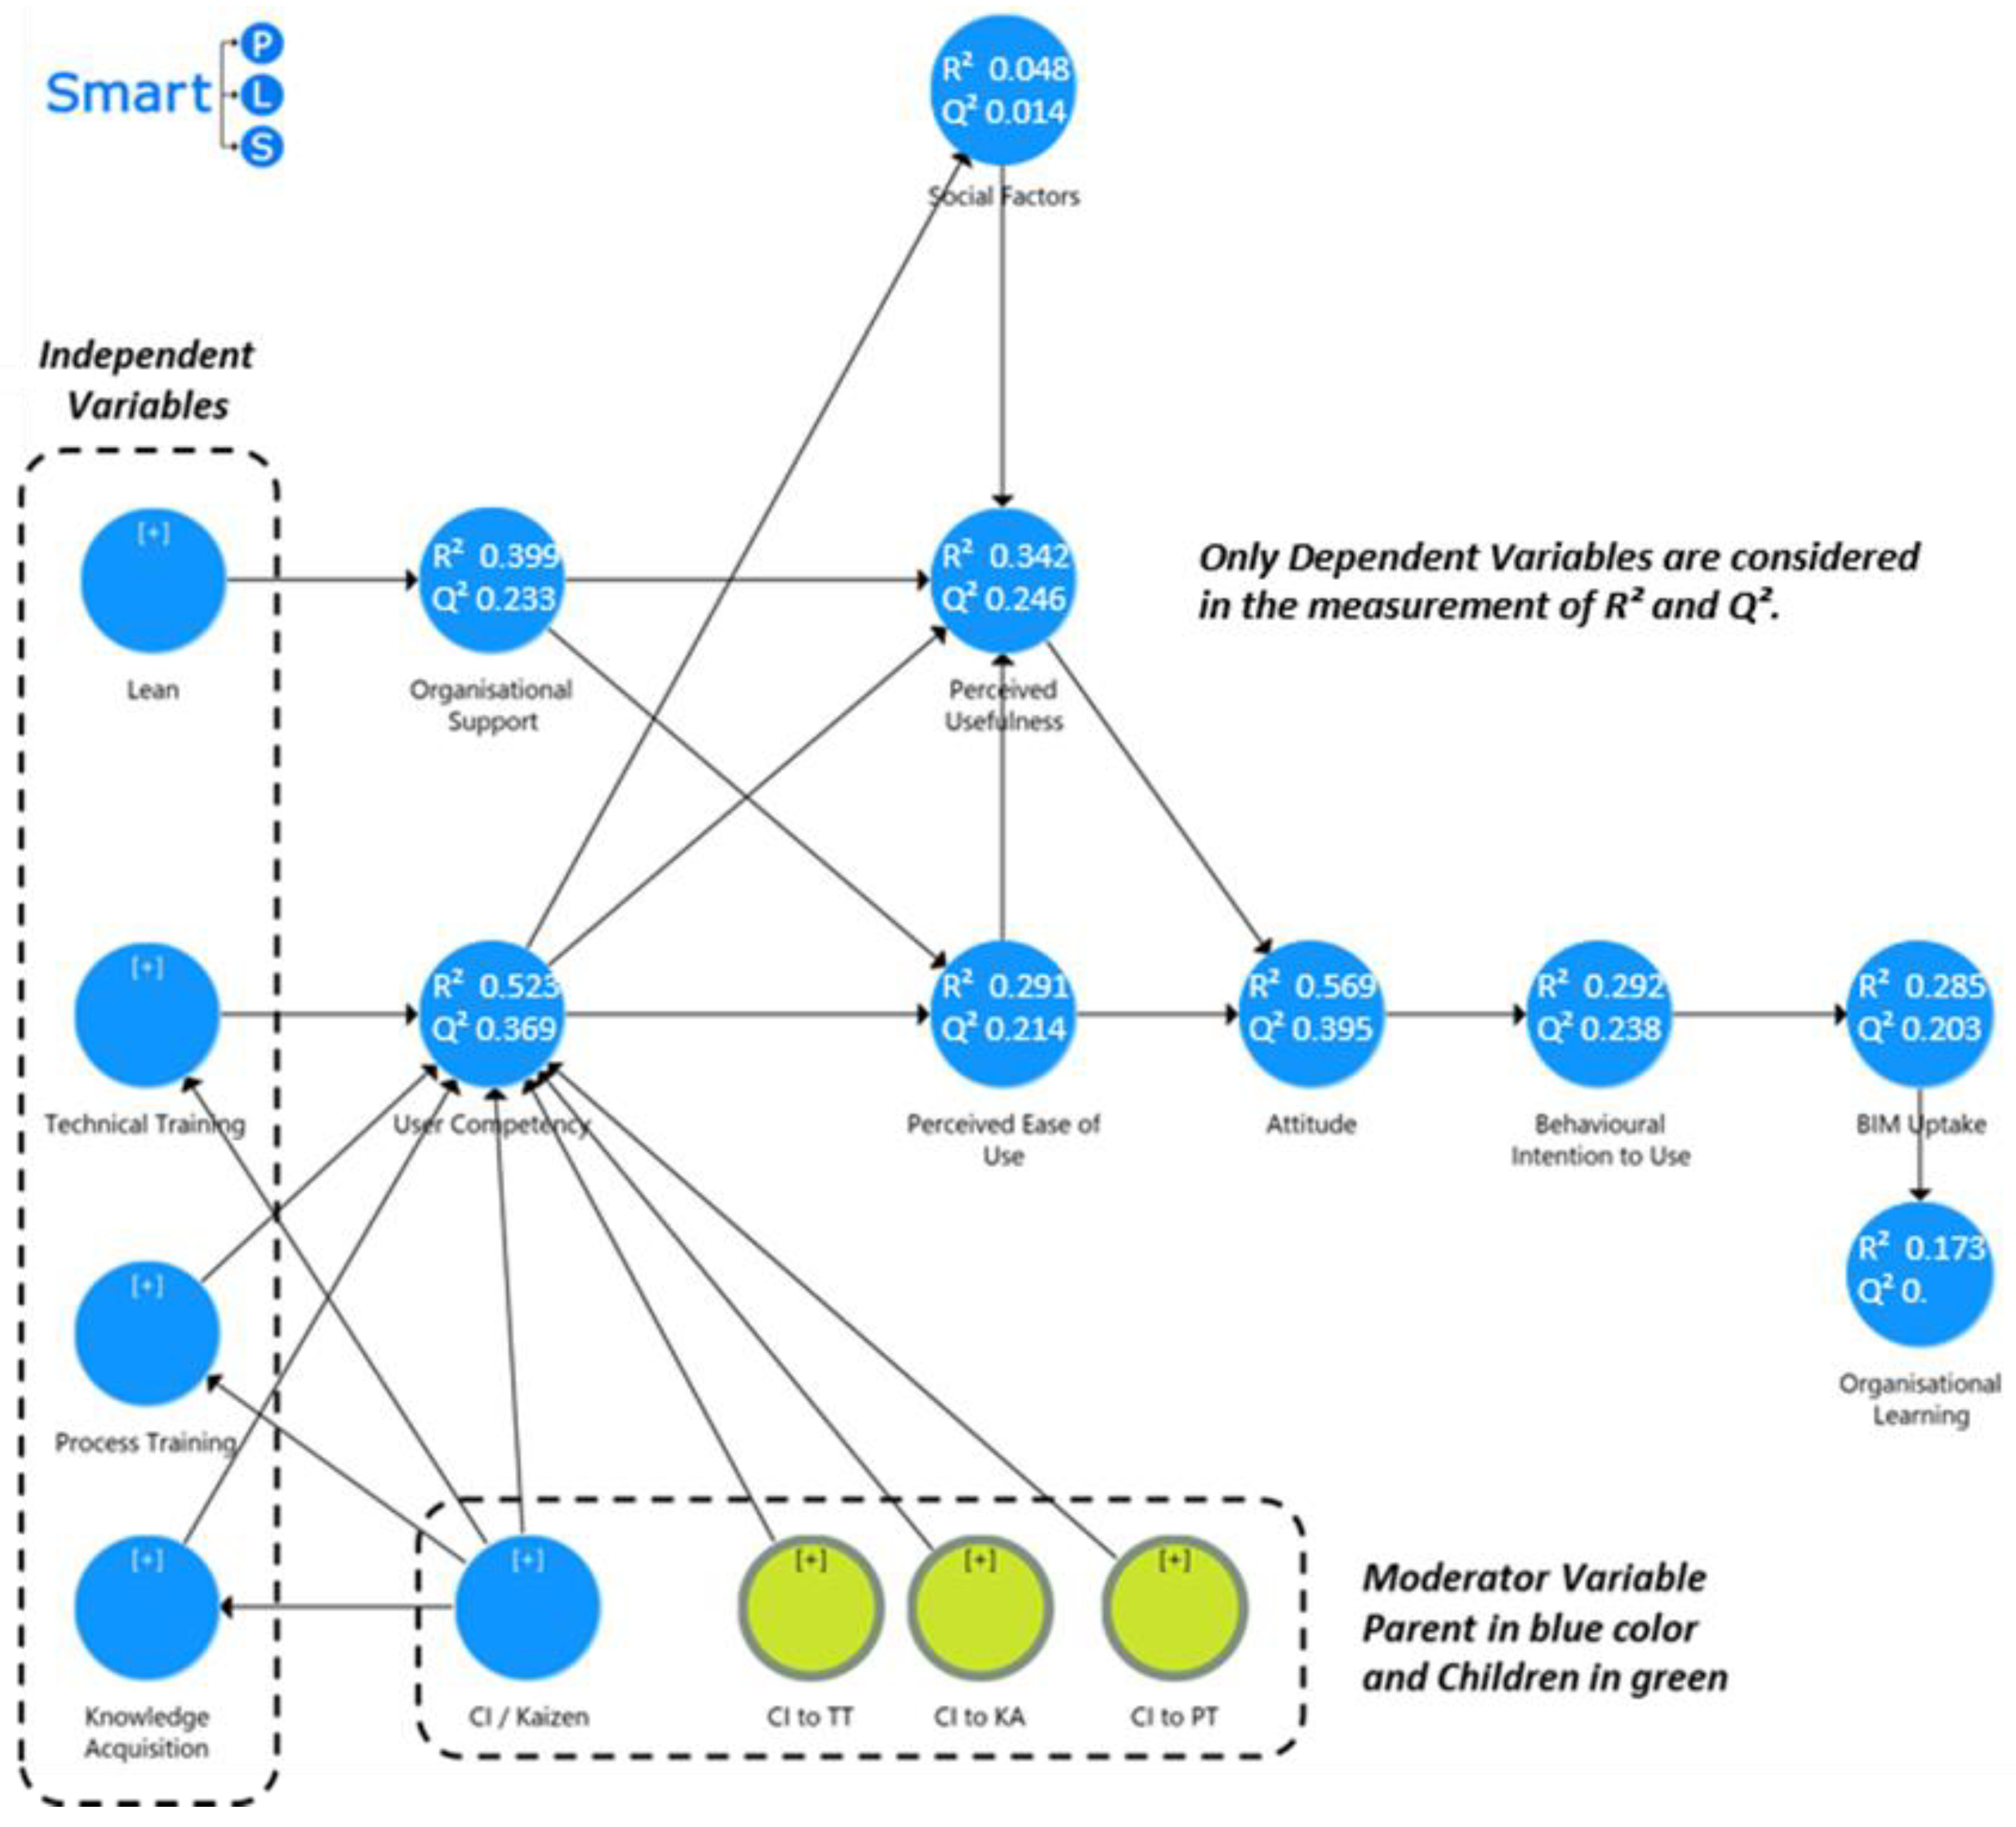
- “Hypothesis 1 (H1). User Competency is significant to Behavioural Intention to Use” was accepted. This hypothesis was instigated by the status quo of BIM adoption in the UK emphasising the shortage of competent users in the industry. Accordingly, an organisation with the intention to uptake BIM within a limited timeframe should consider building in-house user competency as a primary objective. Hence, the strong significance of ‘User Competency’, supported by the combined effects of the entire framework, explained around 30% of the variance and 24% of predictive relevance in the ‘Behavioural Intention to Use’ variable.
- “Hypothesis 2 (H2). Knowledge Acquisition is significant to Behavioural Intention to Use” was accepted. As with H1, this hypothesis was instigated by the status quo of BIM adoption in the UK and the need to leverage user competency by training and educating employees on workflow processes and the in-house resourcing of knowledge through the use of a dedicated, well publicised, private knowledge portal to ensure employees awareness. This point, in particular, was addressed in questionnaire statement “KA4—My organisation enables quick access to the relevant knowledge and training material”, which received a mean average of 3.151 or 69%. Thus, 31% of survey participants were unaware that the sponsoring organisation had an elaborated BIM knowledge portal to support and assist their day-to-day WBET and practice needs. Accordingly, it may be speculated that the ‘Knowledge Acquisition’ variable could have a double star significance rating on behavioural intention should the knowledge portal be better publicised internally.
- “Hypothesis 3 (H3). Organisational Support is significant to Perceived Ease of Use” was accepted. Following the calls of Ozorhon & Karahan [14] and Ghaffarianhoseini et al. [11] for organisational awareness to be added to the benefits of BIM, this variable was introduced to assess the degree to which employees believe that their organisation’s support can lead to reduced effort in BIM learning and implementation. Accordingly, OUM explained 40% of variance and 23% of predictive relevancy in the ‘Organisational Support’ variable. Therefore, the combination of variables oprationalising OUM may be highly accurate in reflecting the in-house culture’s perception of their leadership, thus providing senior management with vital decision-making support services.
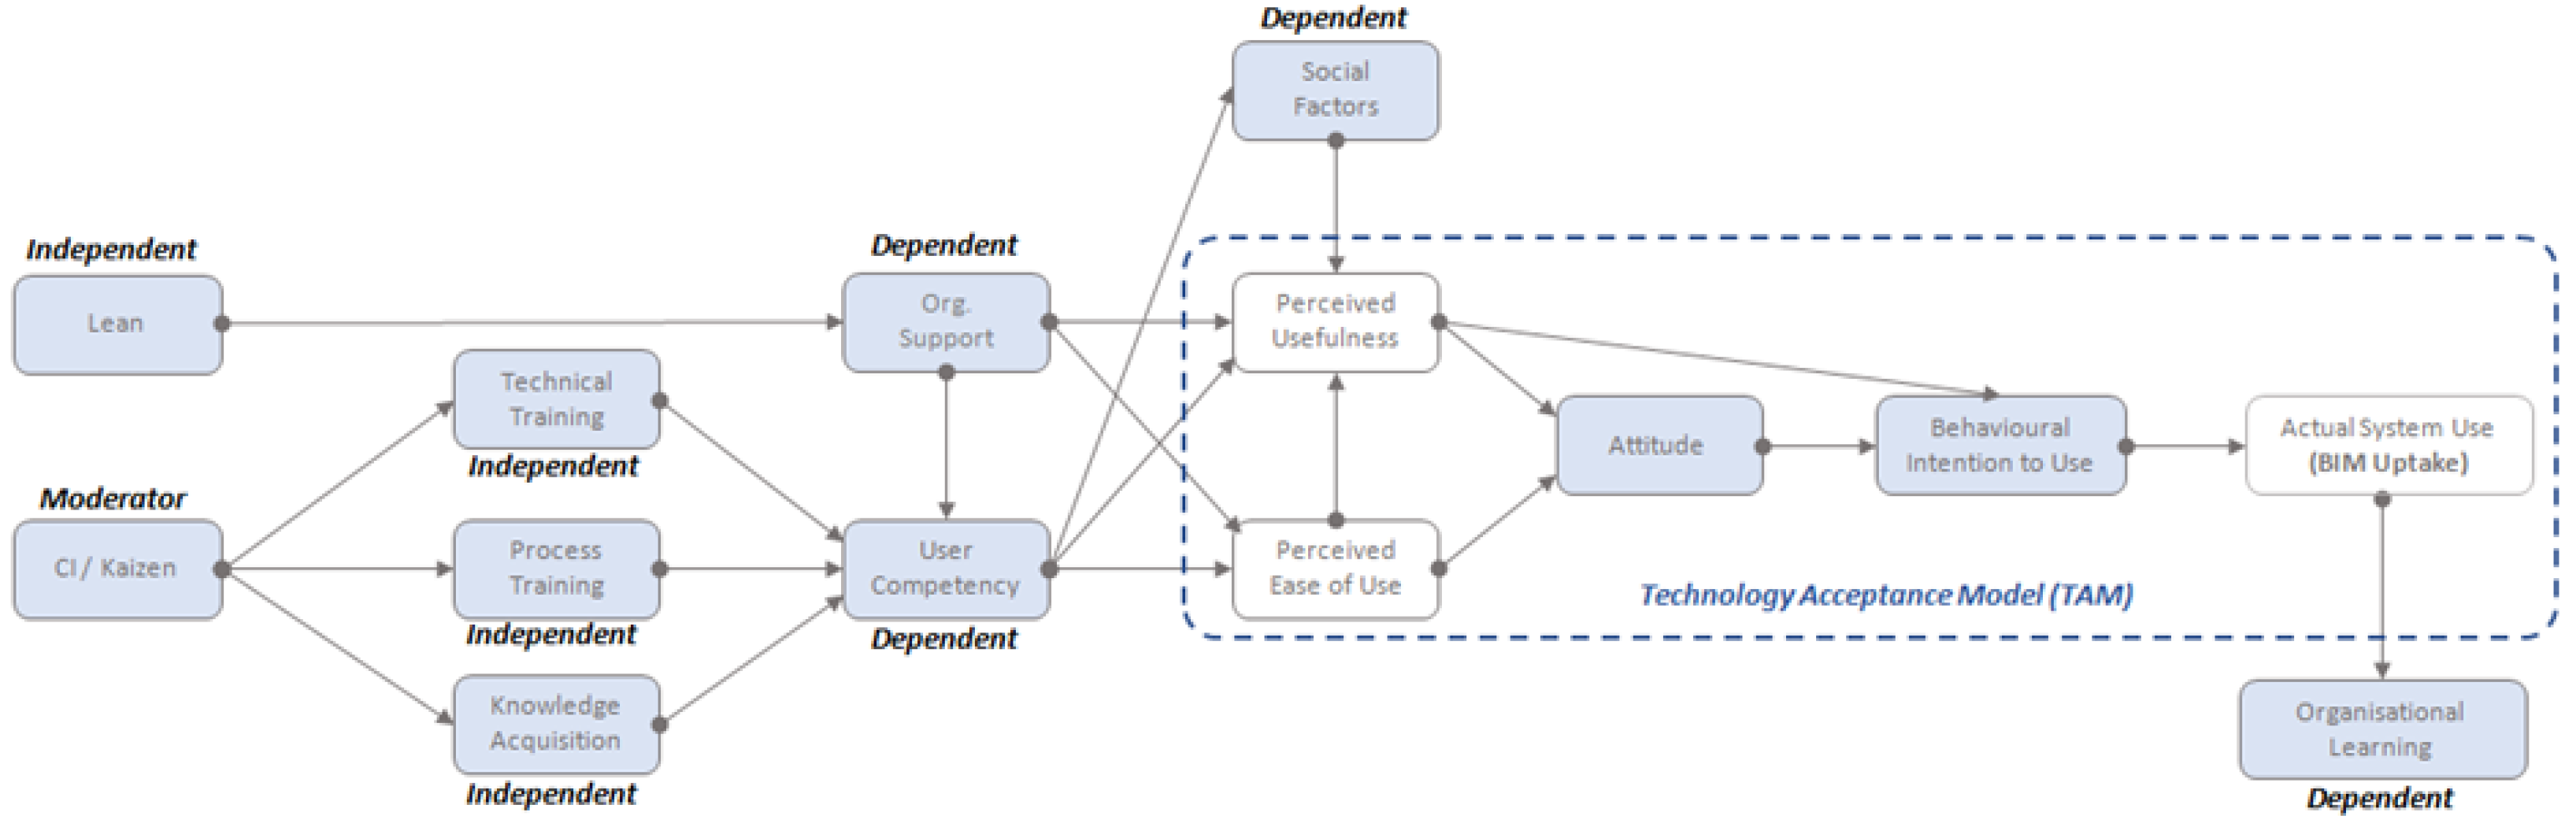
- “Hypothesis 4 (H4). Technical Training is significant to Perceived Ease of Use” and “Hypothesis 5 (H5). Process Training is significant to Perceived Ease of Use” were both rejected. When considering OUM in Figure 2, this result may be attributed to the indirect effect on Perceived Ease of Use, which is a successor to the User Competency variable. Since, OUM explained 52% of variance and 37% of predictive relevancy in the ‘User Competency’ variable, the sponsoring organisation should focus not only on training, but also on building learning capacity and knowledge capability amongst employees, which is considered a challenge to both business and economic growth [55].
- “Hypothesis 6 (H6). Technical Training is significant to ‘User Competency” was accepted. Whereas, “Hypothesis 7 (H7). Process Training is significant to User Competency” was rejected. These results are aimed at the sponsoring organisation so that the training budget is focused on providing technology training to employees. Meanwhile, the research revealed that the culture of the sponsoring organisation conveys relative confidence in their organisational BIM processes, standards and workflows.
- “Hypothesis 8 (H8). User Competency is significant to Perceived Ease of Use” and “Hypothesis 9 (H9). User Competency is significant to Perceived Usefulness” were accepted. These hypotheses were instigated by Venkatesh et al. [30] who argued that organisational facilitating conditions become insignificant when effort expectancy is leveraged. Accordingly, with reference to Table 6, it is clear that the significance of H8 and H8 is greater than H3, which verifies that organisational support may be substantially relaxed when competency is leveraged.
- “Hypothesis 10 (H10). Lean is significant to Perceived Ease of Use” was accepted. This variable was instigated by Antwi-Afari et al. [16] who recommended the need for Lean to enhance knowledge acquisition. Accordingly, it was added to OUM as an influencer of ‘Organisational Support’ in order to assess participants’ perceptions of anticipated methods of effective BIM implementation. As such, Lean explains the variance in ‘Perceived Ease of Use’ by 30% and its predictive power by 20%. Thus, depending on the reflections of the in-house culture, a decision to take up Lean would be wise by the sponsoring organisation or any other organisation adopting the OUM.
- “Hypothesis 11 (H11). CI/Kaizen in Process Training is significant to User Competency”, “Hypothesis 12 (H12). CI/Kaizen in Technical Training is significant to User Competency” and “Hypothesis 13 (H13). CI/Kizen in Knowledge Acquisition is significant to User Competency” were all rejected. CI/Kaizen was introduced as a moderator variable to ‘Technical Training’, ‘Process Training’, and ‘Knowledge Acquisition’ following the implicit recommendations of Alreshidi et al. [10] to three different Kaizen tools. However, the insignificance of these moderator variables may indicate a lack of clarity over the importance of CI/Kizen to the sponsoring organisation. Although ‘Process Training’ was found to have no significance over ‘User Competency’ with t = 0.588 and p = 0.557, once ‘CI/Kaizen’ was introduced as a moderator, it leveraged the p-value by 46%. Moreover, although insignificant at p = 0.11, the importance of process training was either underestimated by survey participants or the participants were well aware of their project delivery workflows to the point that additional training in processes is negligible. This is a clear example of how a rejected hypothesis may provide in-depth knowledge of a current in-house status.
- “Hypothesis 14 (H14). Knowledge Acquisition is significant to Organisational Learning” was accepted and verified that learning organisations use knowledge to continually catalyse the competency of their in-house cultures in order to grow and succeed, which signifies that ‘Organisational Learning’ is a pillar for WBET.
- “Hypothesis 15 (H15). CI/Kaizen in Knowledge Acquisition is significant to Perceived Usefulness” was rejected. This hypothesis was based on the PDCA-like research approach to knowledge management by Wu, et al. [28,29]. However, as is the case in hypotheses H11, H12, and H13, Kaizen has had no impact except on process training. Furthermore, this variable may require further research that specifically dissects the Kaizen tools with further multiple relations to enable a better understanding of its significance.
- “Hypothesis 16 (H16). Knowledge Acquisition is significant to Attitude” and “Hypothesis 17 (H17). Technical Training is significant to Attitude” were both accepted. In reference to Table 6, OUM revealed that ‘Technical Training’ was significant to ‘Attitude’ (with t = 1.992 * and p = 0.046), which is considered the strongest determinant in explaining 57% of variance and 40% of predictive relevancy. Since the inclusion of the ‘Attitude’ variable was arguable in the literature review, especially by Howard et al. [23] in terms of resistance to change, the predictive relevancy results lead this research project to be a major identifier of attitude in any organisation adopting OUM. In the case of the sponsoring organisation, the result may be interpreted in the sense that there is no resistance to change since the drivers of ’Attitude’ were clearly identified by OUM. These include ‘Technology Training’ and two more significant variables, namely ‘Knowledge Acquisition’ to Attitude with t = 2.848 ** and p = 0.004, and ‘User Competency’ with t = 5.297 ** and p = 0.
- “Hypothesis 18 (H18). Attitude is significant to Behavioural Intention to Use” was accepted. However, “Hypothesis 19 (H19). Attitude is significant to BIM Uptake” was rejected. The reason for this manifested in the definition of the ‘System Uptake’ variable of TAM, which Davis et al. [22] defined as the positive or negative acceptance of a specific technology based on the relationship of all TAM variables. Therefore, the definition implies analogy to the defined ‘Attitude’ variable, as a positive or negative feeling about an aspect or event. Therefore, it is almost impossible to relate the two attitudinal variables.
- “Hypothesis 20 (H20). The Social Factors variable is significant to Perceived Usefulness” was rejected. Based on Howard et al. [23], the introduction of social influence and its significant impact on ‘Behavioural Intention to Use’, this research realised that the best fit for the ‘Social Factors’ variable would be ‘Organisational Support’, as stated in the literature review. However, regardless of either view, the ‘Social Factors’ variable has no influence over any other variable in the study. Indeed, both the explained variance and predictive relevance for this variable are extremely weak requiring further investigation to clarify its relative impact in future studies.
- “Hypothesis 21 (H21). User Competency is significant to Social Factors” was accepted, and is perhaps one of a few explanatory variables to ‘Social Factors’, as argued in the literature review. Since ‘Social Factors’ is representative of in-house cultures [30], the hypothesis succeeded in signifying the relationship with less than 5% error variance. However, unless the ‘Social Factors’ variable is capable of signifying another relationship, such as behavioural intention, it is futile to make additional sense of its relationship to ‘User Competency’.
- “Hypothesis 22 (H22). User Competency is significant to BIM Uptake” was accepted. Indeed, t = 3.49 ** and p = 0 imply that the relationship is highly significant with 0% error variance, thus meaning that ‘User Competency’ is the most significant variable for ‘BIM Uptake’.
- “Hypothesis 23 (H23). CI/Kaizen is significant to User Competency” was accepted when ‘CI/Kaizen’ is treated as an independent variable rather than a moderator. Therefore, it may be assumed that, should the inhouse culture of the sponsoring organisation receive more in-depth and specific clarity in terms of CI/Kaizen in Technical and Process trainings, the results in H11 and H12 would be accepted. As noted in H9, this variable may require further research to better adjust its causality in the proposed framework.
- “Hypothesis 24 (H24). Lean is significant to BIM Uptake” and “Hypothesis 25 (H25). Lean is significant to Organisational Learning” were both rejected. This hypothesis was based on the recommendation of Sim et al. [44], that Lean leverages organisational learning to a point where employees require less training. However, as verified in H10, Lean is only significant to ‘Perceived Ease of Use’ in this study, which raises a question as to how Lean, Kaizen, and Organisational Learning are related.
6. Conclusions
Author Contributions
Funding
Institutional Review Board Statement
Informed Consent Statement
Data Availability Statement
Conflicts of Interest
References
- IGT [HM Government]. Low Carbon Construction Innovation and Growth Team Final Report; IGT [HM Government]: London, UK, 2010. Available online: http://www.carbonaction2050.com/sites/carbonaction2050.com/files/document-attachment/IGTLowCarbonConstruction.pdf (accessed on 15 June 2018).
- Cabinet Office. Government Construction Strategy; E. a. R. G. & BIS, C.S.U.: London, UK, 2011.
- NBS. 10th Annual BIM Report 2020; NBS Enterprises Ltd.: Newcastle Upon Tyne, UK, 2020.
- Construction Manager. Annual BIM Survey: Poor Digital Skills Hold Back Adoption; Charted Institute of Building (CIOB): Berkshire, UK, 2020. Available online: https://www.constructionmanagermagazine.com/annual-bim-survey-poor-digital-skills-hold-back-adoption/ (accessed on 1 June 2020).
- Liu, Y.; van Nederveen, S.; Hertogh, M. Understanding effects of BIM on collaborative design and construction: An empirical study in China. Int. J. Proj. Manag. 2017, 35, 686–698. [Google Scholar] [CrossRef]
- NBS. Annual BIM Report 2018; NBS Enterprises Ltd.: Newcastle Upon Tyne, UK, 2018.
- DBB. Digital Built Britain: Level 3 Building Information Modelling-Strategic Plan; HM Government: London, UK, 2015.
- National Infrastructure Commission. Data for the Public Good; National Infrastructure Commission: London, UK, 2017.
- Gokuc, Y.T.; Arditi, D. Adoption of BIM in architectural design firms. Arch. Sci. Rev. 2017, 60, 483–492. [Google Scholar] [CrossRef]
- Alreshidi, E.; Mourshed, M.; Rezgui, Y. Factors for effective BIM governance. J. Build. Eng. 2017, 10, 89–101. [Google Scholar] [CrossRef] [Green Version]
- Ghaffarianhoseini, A.; Tookey, J.; Ghaffarianhoseini, A.; Naismith, N.; Azhar, S.; Efimova, O.; Raahemifar, K. Building Information Modelling (BIM) uptake: Clear benefits, understanding its implementation, risks and challenges. Renew. Sustain. Energy Rev. 2017, 75, 1046–1053. [Google Scholar] [CrossRef]
- Kassem, M.; Succar, B. Macro BIM adoption: Comparative market analysis. Autom. Constr. 2017, 81, 286–299. [Google Scholar] [CrossRef]
- Liao, L.; Teo, E.A.L. Organizational Change Perspective on People Management in BIM Implementation in Building Projects. J. Manag. Eng. 2018, 34, 04018008. [Google Scholar] [CrossRef]
- Ozorhon, B.; Karahan, U. Critical Success Factors of Building Information Modeling Implementation. J. Manag. Eng. 2017, 33, 04016054. [Google Scholar] [CrossRef]
- Santos, R.; Costa, A.A.; Grilo, A. Bibliometric analysis and review of Building Information Modelling literature published between 2005 and 2015. Autom. Constr. 2017, 80, 118–136. [Google Scholar] [CrossRef]
- Antwi-Afari, M.; Li, H.; Parn, E.; Edwards, D. Critical success factors for implementing building information modelling (BIM): A longitudinal review. Autom. Constr. 2018, 91, 100–110. [Google Scholar] [CrossRef]
- Yin, Q. Application of Case Teaching Method in BIM Learning. Int. J. New Dev. Educ. 2021, 3. [Google Scholar] [CrossRef]
- Sacks, R.; Pikas, E. Building Information Modeling Education for Construction Engineering and Management. I: Industry Requirements, State of the Art, and Gap Analysis. J. Constr. Eng. Manag. 2013, 139, 04013016. [Google Scholar] [CrossRef] [Green Version]
- Smith, P. BIM Implementation–Global Strategies. Procedia Eng. 2014, 85, 482–492. [Google Scholar] [CrossRef] [Green Version]
- Uhm, M.; Lee, G.; Jeon, B. An analysis of BIM jobs and competencies based on the use of terms in the industry. Autom. Constr. 2017, 81, 67–98. [Google Scholar] [CrossRef]
- Wang, G.; Song, J. The relation of perceived benefits and organizational supports to user satisfaction with building information model (BIM). Comput. Hum. Behav. 2017, 68, 493–500. [Google Scholar] [CrossRef]
- Davis, F.D.; Bagozzi, R.P.; Warshaw, P.R. User Acceptance of Computer Technology: A Comparison of Two Theoretical Models. Manag. Sci. 1989, 35, 982–1003. [Google Scholar] [CrossRef] [Green Version]
- Howard, R.; Restrepo, L.; Chang, C.-Y. Addressing individual perceptions: An application of the unified theory of acceptance and use of technology to building information modelling. Int. J. Proj. Manag. 2016, 35, 107–120. [Google Scholar] [CrossRef]
- Hair, J.F., Jr.; Sarstedt, M.; Hopkins, L.; Kuppelwieser, V.G. Partial least squares structural equation modeling (PLS-SEM): An emerging tool in business research. Eur. Bus. Rev. 2014. [Google Scholar] [CrossRef]
- Li, X.; Wu, W.; Shen, Q.; Wang, X.; Teng, Y. Mapping the knowledge domains of Building Information Modeling (BIM): A bibliometric approach. Autom. Constr. 2017, 84, 195–206. [Google Scholar] [CrossRef]
- NBS. National BIM Report 2019: The Definitive Industry Update; NBS Enterprises Ltd.: Newcastle Upon Tyne, UK, 2019.
- Succar, B.; Sher, W.; Williams, A. An integrated approach to BIM competency assessment, acquisition and application. Autom. Constr. 2013, 35, 174–189. [Google Scholar] [CrossRef]
- Wu, W.; Mayo, G.; McCuen, T.L.; Issa, R.R.A.; Smith, D.K. Building Information Modeling Body of Knowledge. I: Background, Framework, and Initial Development. J. Constr. Eng. Manag. 2018, 144, 04018065. [Google Scholar] [CrossRef]
- Wu, W.; Mayo, G.; McCuen, T.L.; Issa, R.R.A.; Smith, D.K. Building Information Modeling Body of Knowledge. II: Consensus Building and Use Cases. J. Constr. Eng. Manag. 2018, 144, 04018066. [Google Scholar] [CrossRef]
- Venkatesh, V.; Morris, M.G.; Davis, G.B.; Davis, F.D. User Acceptance of Information Technology: Toward a Unified View. MIS Q. 2003, 27, 425–478. [Google Scholar] [CrossRef] [Green Version]
- Thompson, R.L.; Higgins, C.A.; Howell, J.M. Personal Computing: Toward a Conceptual Model of Utilization. MIS Q. 1991, 15, 125. [Google Scholar] [CrossRef]
- Jin, R.; Hancock, C.; Tang, L.; Chen, C.; Wanatowski, D.; Yang, L. Empirical Study of BIM Implementation–Based Perceptions among Chinese Practitioners. J. Manag. Eng. 2017, 33, 04017025. [Google Scholar] [CrossRef] [Green Version]
- Nielsen, K.; Randall, R.; Christensen, K.B. Do Different Training Conditions Facilitate Team Implementation? A Quasi-Experimental Mixed Methods Study. J. Mix. Methods Res. 2016, 11, 223–247. [Google Scholar] [CrossRef] [Green Version]
- Stabile, C. Clarifying the Differences between Training, Development, and Enrichment: The Role of Institutional Belief Constructs in Creating the Purpose of Faculty Learning Initiatives. New Dir. Teach. Learn. 2013, 2013, 71–84. [Google Scholar] [CrossRef]
- Liker, J.K. The Toyota Way: 14 Management Principles (First); McGrawhill: New York, NY, USA, 2004. [Google Scholar]
- Schwarz, U.V.T.; Nielsen, K.M.; Stenfors-Hayes, T.; Hasson, H. Using kaizen to improve employee well-being: Results from two organizational intervention studies. Hum. Relat. 2016, 70, 966–993. [Google Scholar] [CrossRef] [PubMed] [Green Version]
- Álvarez-García, J.; Durán-Sánchez, A.; Río-Rama, M.D.L.C.D. Systematic bibliometric analysis on Kaizen in scientific journals. TQM J. 2018, 30, 356–370. [Google Scholar] [CrossRef]
- Compeau, D.R.; Higgins, C.A. Application of Social Cognitive Theory to Training for Computer Skills. Inf. Syst. Res. 1995, 6, 118–143. [Google Scholar] [CrossRef]
- Law, K.M.Y.; Chuah, K.B. PAL Driven Organizational Learning: Theory and Practices a Light on Learning Journey of Organizations; Springer International Publishing: Cham, Switzerland; New York, NY, USA, 2015. [Google Scholar] [CrossRef]
- Marsick, V.J.; Watkins, K.E. Demonstrating the Value of an Organization’s Learning Culture: The Dimensions of the Learning Organization Questionnaire. Adv. Dev. Hum. Resour. 2003, 5, 132–151. [Google Scholar] [CrossRef]
- Rother, M. Toyota Kata, 5th ed.; McGrawhill Education: Chennai, India, 2017. [Google Scholar]
- ENR. Engineering News-Record. 2018. Available online: https://www.enr.com/ (accessed on 17 August 2018).
- AlManei, M.; Salonitis, K.; Xu, Y. Lean Implementation Frameworks: The Challenges for SMEs. Procedia CIRP 2017, 63, 750–755. [Google Scholar] [CrossRef]
- Sim, K.L.; Curatola, A.P.; Banerjee, A. Lean Production Systems and Worker Satisfaction: A Field Study. Adv. Bus. Res. 2015, 6, 79–100. Available online: http://journals.sfu.ca/abr (accessed on 1 April 2018).
- Yin, R.K. Qualitative Research from Start to Finish; The Guilford Press: New York, NY, USA, 2011. [Google Scholar]
- Greenfield, T. Research Methods for Post Graduates, 2nd ed.; Arnold: New York, NY, USA, 2002. [Google Scholar]
- Hair JF, J.; Hult GT, M.; Ringle, C.M.; Sarstedt, M. A Primer on Partial Least Squares Structural Equation Modeling (PLS-SEM), 2nd ed.; SAGE Publications, Inc.: Los Angeles, CA, USA, 2017. [Google Scholar]
- Bhattacherjee, A. Social Science Research: Principles, Methods, and Practices, 2nd ed.; University of South Florida: Tampa, FL, USA, 2012; Available online: http://scholarcommons.usf.edu/oa_textbookshttp://scholarcommons.usf.edu/oa_textbooks/3 (accessed on 15 June 2018).
- Kwong, K.; Wong, K. Partial Least Squares Structural Equation Modeling (PLS-SEM) Techniques Using SmartPLS. Mark. Bull. 2013, 24, 1–32. [Google Scholar]
- Monecke, A.; Leisch, F. semPLS: Structural Equation Modeling Using Partial Least Squares. J. Stat. Softw. 2012, 48, 1–32. [Google Scholar] [CrossRef] [Green Version]
- Sarstedt, M.; Ringle, C.M.; Smith, D.; Reams, R.; Hair, J.F. Partial least squares structural equation modeling (PLS-SEM): A useful tool for family business researchers. J. Fam. Bus. Strat. 2014, 5, 105–115. [Google Scholar] [CrossRef]
- Holt, G.D. Asking questions, analysing answers: Relative importance revisited. Constr. Innov. 2014, 14, 2–16. [Google Scholar] [CrossRef]
- Kline, R.B. Principles and Practice of Structural Equation Modeling; The Guilford Press: New York, NY, USA, 2011. [Google Scholar]
- SmartPLS. Available online: https://www.smartpls.com/ (accessed on 1 April 2018).
- Abbasnejad, B.; Nepal, M.; Ahankoob, A.; Nasirian, A.; Drogemuller, R. Building Information Modelling (BIM) adoption and implementation enablers in AEC firms: A systematic literature review. Arch. Eng. Des. Manag. 2020, 1–23. [Google Scholar] [CrossRef]


| Experience | Grade | Title | Count | Totals |
|---|---|---|---|---|
| Junior 0 to 7 years | A | Apprentice | 2 | 40 |
| B | Graduate | 17 | ||
| C | Professional (non-chartered) | 11 | ||
| D | Professional (chartered) | 10 | ||
| Senior Over 7 years | E | Professional (chartered-senior) | 15 | 33 |
| F | Associate | 12 | ||
| G | Director | 3 | ||
| H | Director (senior) | 3 | ||
| Total no. of participants | 73 | |||
| Indicators | Questionnaire Statements | (λ ≥ 0.7) |
|---|---|---|
| AT1 | BIM implementation makes my work more interesting. | 0.898 |
| AT2 | BIM is better than CAD. | 0.889 |
| AT3 | Adopting BIM is a wise decision. | 0.826 |
| BI1 | I intend to be BIM-enabled in the next 6 months. | 0.948 |
| BI2 | I predict that I will be implementing BIM in the next 6 months. | 0.958 |
| BI3 | I plan to use Adopt BIM in the next 6 months. | 0.96 |
| BU1 | I am very pleased that my organisation has adopted BIM. | 0.896 |
| BU2 | I am very satisfied that my organisation has adopted BIM. | 0.892 |
| BU3 | I am delighted that my organisation has adopted BIM. | 0.851 |
| CI1 | If I am guided on methods to continuously improve, my effectiveness will be increased. | 0.947 |
| CI2 | If I am guided on methods to continuously improve, I will save time on daily tasks. | 0.942 |
| CI3 | If I am guided on methods to continuously improve, I will increase the quality of output of my job. | 0.943 |
| KA1 | If I was educated and trained in PAS1192 series, CIC and BSI standards, it would be easy for me to adopt BIM. | 0.804 |
| KA2 | If I was educated and trained in BIM Project Delivery Processes, it would be easy for me to adopt BIM. | 0.874 |
| KA3 | Given the resources, opportunities and knowledge it takes to utilise BIM, it would be easy for me to adopt BIM. | 0.857 |
| KA4 | My organisation enables quick access to the relevant knowledge and training material. | 0.612 |
| LN1 | My organisation is working hard to eliminate lead time (delay) by making project deliveries more efficient through BIM. | 0.673 |
| LN2 | My organisation is working hard to meet and exceed quality expectations. | 0.803 |
| LN3 | My organisation is working hard to provide a healthy working environment. | 0.743 |
| LN4 | My organisation is striving to become a Learning Organisation. | 0.856 |
| LN5 | My organisation has a clear vision which I am aware of. | 0.781 |
| LN6 | My organisation maintains a collaborative culture. | 0.761 |
| OL1 | In my organization, people openly discuss mistakes in order to learn from them. | 0.804 |
| OL2 | In my organization, people help each other learn. | 0.83 |
| OL3 | In my organization, people view problems in their work as an opportunity to learn. | 0.864 |
| OL4 | In my organization, people are encouraged to give open and honest feedback to enable process improvement. | 0.927 |
| OS1 | My organisation understands the benefits of BIM. | 0.712 |
| OS2 | My Organisation has sufficient technical capabilities for adopting BIM. | 0.776 |
| OS3 | My organisation provides proper education and training for BIM adoption and implementation. | 0.812 |
| OS4 | My organisation provides proper guidance for project delivery using BIM. | 0.878 |
| OS5 | My organisation provides specialised training to suit my job role and responsibility. | 0.784 |
| OS6 | My organisation utilizes a specific person, group or external consultants to support BIM difficulties. | 0.64 |
| PE1 | I found it easy to get BIM software to do what I want it to do. | 0.898 |
| PE2 | In general, BIM software is easy to use. | 0.898 |
| PE3 | In general, I found BIM software to be flexible to interact with. | 0.909 |
| PT1 | If I was given BIM project delivery guidance and training, I will be more skilful. | 0.89 |
| PT2 | If I was given BIM project delivery guidance and training, I would find BIM easy to implement. | 0.831 |
| PT3 | If I was given BIM project delivery guidance and training, further BIM-related learning becomes easier for me. | 0.896 |
| PU1 | Using BIM software and guidelines in my job will increase my productivity. | 0.947 |
| PU2 | Using BIM software and guidelines in my job will improve my performance. | 0.894 |
| PU3 | Using BIM software and guidelines in my job will enhance my effectiveness. | 0.962 |
| PU4 | Using BIM software and guidelines in my job is more useful than using CAD. | 0.825 |
| SF1 | I prefer BIM because of the proportion of colleagues who use it. | 0.593 |
| SF2 | The senior management in this organisation is helpful when implementing BIM. | 0.744 |
| SF3 | My Line Manager advocates BIM implementation. | 0.647 |
| SF4 | In general, the organisation has Adopted BIM. | 0.67 |
| TT1 | If I was given technical training, it would be easy for me to become skilful using BIM software. | 0.928 |
| TT2 | If I was given technical training, I would find BIM software easy to use. | 0.865 |
| TT3 | If I was given technical training, further learning becomes easier for me. | 0.874 |
| UC1 | I could complete a job or task using BIM software with minimal support from others. | 0.892 |
| UC2 | I could complete a job or task using BIM software if I could call someone for instant help if I got stuck. | 0.868 |
| UC3 | My perception of BIM for project delivery is clear and understandable. | 0.616 |
| Variables | Code | ρc ≥ 0.6 | Σλ2 > 0.5 |
|---|---|---|---|
| Attitude | AT | 0.904 | 0.76 |
| BIM Uptake | BU | 0.911 | 0.774 |
| Behavioural Intention to Use | BI | 0.969 | 0.913 |
| CI/Kaizen | CI | 0.961 | 0.891 |
| Knowledge Acquisition | KA | 0.902 | 0.754 |
| Lean | LN | 0.901 | 0.647 |
| Organisational Learning | OL | 0.917 | 0.735 |
| Organisational Support | OS | 0.901 | 0.646 |
| Perceived Ease of Use | PE | 0.929 | 0.813 |
| Perceived Usefulness | PU | 0.95 | 0.826 |
| Process Training | PT | 0.906 | 0.762 |
| Social Factors | SF | 0.794 | 0.562 |
| Technical Training | TT | 0.919 | 0.791 |
| User Competency | UC | 0.904 | 0.825 |
| Variables | Indicators | AT | BI | BU | CI | KA | LN | OL | OS | PE | PT | PU | SF | TT | UC |
|---|---|---|---|---|---|---|---|---|---|---|---|---|---|---|---|
| Attitude | AT1 | 0.898 | 0.525 | 0.483 | 0.19 | 0.324 | 0.126 | 0.004 | 0.171 | 0.42 | 0.315 | 0.718 | 0.219 | 0.369 | 0.495 |
| AT2 | 0.889 | 0.472 | 0.379 | 0.093 | 0.259 | −0.017 | −0.103 | −0.027 | 0.254 | 0.33 | 0.691 | 0.119 | 0.314 | 0.402 | |
| AT3 | 0.826 | 0.407 | 0.496 | 0.194 | 0.275 | 0.08 | −0.015 | 0.089 | 0.155 | 0.405 | 0.551 | 0.261 | 0.467 | 0.387 | |
| Behavioural Intention to Use | BI1 | 0.554 | 0.948 | 0.375 | 0.273 | 0.351 | 0.151 | 0.146 | 0.158 | 0.384 | 0.455 | 0.526 | 0.194 | 0.51 | 0.59 |
| BI2 | 0.461 | 0.958 | 0.33 | 0.235 | 0.398 | 0.143 | 0.105 | 0.197 | 0.317 | 0.453 | 0.471 | 0.198 | 0.499 | 0.588 | |
| BI3 | 0.525 | 0.96 | 0.396 | 0.247 | 0.292 | 0.128 | 0.149 | 0.084 | 0.213 | 0.445 | 0.483 | 0.157 | 0.532 | 0.515 | |
| BIM Uptake | BU1 | 0.583 | 0.311 | 0.896 | 0.512 | 0.324 | 0.44 | 0.296 | 0.453 | 0.167 | 0.282 | 0.518 | 0.486 | 0.379 | 0.385 |
| BU2 | 0.363 | 0.434 | 0.892 | 0.531 | 0.275 | 0.547 | 0.491 | 0.556 | 0.244 | 0.35 | 0.415 | 0.531 | 0.504 | 0.335 | |
| BU3 | 0.419 | 0.26 | 0.851 | 0.431 | 0.181 | 0.316 | 0.3 | 0.269 | 0.042 | 0.306 | 0.398 | 0.306 | 0.316 | 0.125 | |
| CI/Kaizen | CI1 | 0.187 | 0.231 | 0.56 | 0.947 | 0.4 | 0.504 | 0.338 | 0.334 | 0.11 | 0.461 | 0.408 | 0.186 | 0.487 | 0.354 |
| CI2 | 0.152 | 0.22 | 0.517 | 0.942 | 0.355 | 0.442 | 0.351 | 0.318 | 0.171 | 0.447 | 0.398 | 0.249 | 0.497 | 0.348 | |
| CI3 | 0.176 | 0.292 | 0.514 | 0.943 | 0.433 | 0.519 | 0.362 | 0.388 | 0.177 | 0.495 | 0.344 | 0.211 | 0.542 | 0.421 | |
| Knowledge Acquisition | KA1 | 0.236 | 0.212 | 0.237 | 0.359 | 0.847 | 0.331 | 0.224 | 0.296 | 0.267 | 0.461 | 0.308 | 0.193 | 0.468 | 0.428 |
| KA2 | 0.313 | 0.296 | 0.298 | 0.404 | 0.905 | 0.249 | 0.255 | 0.345 | 0.264 | 0.504 | 0.4 | 0.207 | 0.422 | 0.513 | |
| KA3 | 0.302 | 0.412 | 0.246 | 0.335 | 0.852 | 0.221 | 0.139 | 0.235 | 0.311 | 0.531 | 0.434 | 0.223 | 0.452 | 0.603 | |
| Lean | LN2 | 0.159 | 0.214 | 0.463 | 0.346 | 0.178 | 0.796 | 0.611 | 0.541 | 0.11 | 0.126 | 0.083 | 0.541 | 0.232 | 0.221 |
| LN3 | −0.033 | 0.04 | 0.327 | 0.401 | 0.21 | 0.741 | 0.526 | 0.449 | 0.065 | 0.223 | −0.091 | 0.356 | 0.331 | 0.129 | |
| LN4 | 0.026 | 0.098 | 0.371 | 0.522 | 0.31 | 0.874 | 0.482 | 0.6 | 0.25 | 0.16 | 0.127 | 0.598 | 0.269 | 0.181 | |
| LN5 | 0.079 | 0.092 | 0.5 | 0.476 | 0.225 | 0.82 | 0.491 | 0.506 | 0.227 | 0.146 | 0.175 | 0.378 | 0.221 | 0.1 | |
| LN6 | 0.056 | 0.145 | 0.347 | 0.315 | 0.296 | 0.784 | 0.51 | 0.413 | 0.291 | 0.108 | 0.137 | 0.378 | 0.187 | 0.141 | |
| Organisational Learning | OL1 | −0.034 | 0.112 | 0.289 | 0.311 | 0.155 | 0.418 | 0.804 | 0.297 | −0.084 | 0.202 | 0.027 | 0.286 | 0.307 | 0.072 |
| OL2 | 0.001 | 0.116 | 0.29 | 0.303 | 0.263 | 0.613 | 0.83 | 0.416 | 0.014 | 0.058 | 0.026 | 0.377 | 0.23 | 0.169 | |
| OL3 | −0.164 | 0.033 | 0.288 | 0.206 | 0.075 | 0.464 | 0.864 | 0.485 | −0.1 | 0.08 | −0.119 | 0.353 | 0.226 | −0.002 | |
| OL4 | 0.014 | 0.184 | 0.488 | 0.408 | 0.271 | 0.676 | 0.927 | 0.502 | 0.068 | 0.301 | 0.065 | 0.429 | 0.412 | 0.153 | |
| Organisational Support | OS1 | 0.092 | 0.118 | 0.55 | 0.473 | 0.309 | 0.507 | 0.396 | 0.717 | 0.166 | 0.204 | 0.113 | 0.436 | 0.272 | 0.25 |
| OS2 | −0.046 | 0.045 | 0.275 | 0.192 | 0.233 | 0.504 | 0.418 | 0.767 | 0.281 | 0.029 | 0.006 | 0.438 | 0.174 | 0.213 | |
| OS3 | 0.055 | 0.111 | 0.334 | 0.221 | 0.246 | 0.44 | 0.338 | 0.837 | 0.355 | 0.074 | 0.083 | 0.48 | 0.137 | 0.244 | |
| OS4 | 0.075 | 0.137 | 0.399 | 0.3 | 0.327 | 0.55 | 0.41 | 0.893 | 0.412 | 0.252 | 0.15 | 0.529 | 0.312 | 0.322 | |
| OS5 | 0.178 | 0.181 | 0.442 | 0.311 | 0.231 | 0.532 | 0.457 | 0.793 | 0.391 | 0.178 | 0.147 | 0.506 | 0.27 | 0.274 | |
| Perceived Ease of Use | PE1 | 0.314 | 0.279 | 0.161 | 0.178 | 0.317 | 0.185 | −0.067 | 0.33 | 0.897 | 0.189 | 0.4 | 0.304 | 0.341 | 0.475 |
| PE2 | 0.236 | 0.294 | 0.175 | 0.084 | 0.258 | 0.264 | 0.015 | 0.459 | 0.899 | 0.196 | 0.263 | 0.329 | 0.239 | 0.424 | |
| PE3 | 0.327 | 0.29 | 0.151 | 0.171 | 0.299 | 0.19 | 0.02 | 0.323 | 0.908 | 0.19 | 0.432 | 0.26 | 0.201 | 0.361 | |
| Process Training | PT1 | 0.397 | 0.439 | 0.352 | 0.512 | 0.413 | 0.175 | 0.217 | 0.077 | 0.124 | 0.888 | 0.522 | 0.128 | 0.7 | 0.492 |
| PT2 | 0.277 | 0.404 | 0.25 | 0.317 | 0.647 | 0.153 | 0.125 | 0.311 | 0.296 | 0.832 | 0.39 | 0.198 | 0.597 | 0.529 | |
| PT3 | 0.36 | 0.39 | 0.321 | 0.458 | 0.465 | 0.165 | 0.199 | 0.122 | 0.146 | 0.897 | 0.452 | 0.139 | 0.728 | 0.385 | |
| Perceived Usefulness | PU1 | 0.685 | 0.472 | 0.464 | 0.438 | 0.437 | 0.129 | 0 | 0.133 | 0.41 | 0.489 | 0.947 | 0.248 | 0.533 | 0.513 |
| PU2 | 0.565 | 0.406 | 0.464 | 0.407 | 0.323 | 0.157 | 0.081 | 0.125 | 0.419 | 0.514 | 0.894 | 0.248 | 0.573 | 0.375 | |
| PU3 | 0.695 | 0.488 | 0.504 | 0.398 | 0.432 | 0.123 | 0.012 | 0.132 | 0.379 | 0.502 | 0.962 | 0.268 | 0.56 | 0.515 | |
| PU4 | 0.773 | 0.503 | 0.408 | 0.232 | 0.405 | 0.004 | −0.042 | 0.077 | 0.282 | 0.408 | 0.825 | 0.105 | 0.383 | 0.463 | |
| Social Factors | SF2 | 0.096 | 0.072 | 0.434 | 0.304 | 0.174 | 0.582 | 0.313 | 0.636 | 0.331 | 0.124 | 0.173 | 0.769 | 0.095 | 0.165 |
| SF3 | 0.269 | 0.23 | 0.281 | 0.017 | 0.179 | 0.19 | 0.269 | 0.206 | 0.199 | 0.181 | 0.239 | 0.761 | 0.274 | 0.178 | |
| SF4 | 0.099 | 0.086 | 0.519 | 0.272 | 0.199 | 0.68 | 0.454 | 0.649 | 0.216 | 0.047 | 0.066 | 0.719 | 0.211 | 0.139 | |
| Technical Training | TT1 | 0.442 | 0.456 | 0.381 | 0.472 | 0.479 | 0.289 | 0.324 | 0.3 | 0.348 | 0.642 | 0.562 | 0.267 | 0.927 | 0.619 |
| TT2 | 0.325 | 0.439 | 0.375 | 0.364 | 0.366 | 0.164 | 0.288 | 0.276 | 0.261 | 0.687 | 0.365 | 0.219 | 0.864 | 0.441 | |
| TT3 | 0.381 | 0.535 | 0.465 | 0.577 | 0.504 | 0.343 | 0.34 | 0.214 | 0.169 | 0.741 | 0.538 | 0.209 | 0.876 | 0.524 | |
| UserCompetency | UC1 | 0.506 | 0.562 | 0.172 | 0.243 | 0.48 | 0.05 | −0.041 | 0.183 | 0.495 | 0.474 | 0.487 | 0.169 | 0.483 | 0.905 |
| UC2 | 0.395 | 0.511 | 0.425 | 0.477 | 0.607 | 0.299 | 0.258 | 0.408 | 0.355 | 0.505 | 0.456 | 0.227 | 0.608 | 0.912 |
| Variables | Indicators | AT | BU | BI | CI | KA | LN | OL | OS | PE | PU | PT | SF | TT | UC |
|---|---|---|---|---|---|---|---|---|---|---|---|---|---|---|---|
| Attitude | AT | 0.872 | |||||||||||||
| BIM Uptake | BU | 0.519 | 0.880 | ||||||||||||
| Behavioural Intention to Use | BI | 0.54 | 0.386 | 0.956 | |||||||||||
| CI/Kaizen | CI | 0.182 | 0.562 | 0.264 | 0.944 | ||||||||||
| Knowledge Acquisition | KA | 0.33 | 0.301 | 0.361 | 0.421 | 0.868 | |||||||||
| Lean | LN | 0.074 | 0.502 | 0.147 | 0.519 | 0.303 | 0.804 | ||||||||
| Organisational Learning | OL | -0.043 | 0.416 | 0.141 | 0.372 | 0.234 | 0.649 | 0.857 | |||||||
| Organisational Support | OS | 0.092 | 0.495 | 0.151 | 0.369 | 0.335 | 0.632 | 0.504 | 0.804 | ||||||
| Perceived Ease of Use | PE | 0.326 | 0.18 | 0.319 | 0.162 | 0.325 | 0.234 | -0.013 | 0.408 | 0.902 | |||||
| Perceived Usefulness | PU | 0.754 | 0.507 | 0.518 | 0.404 | 0.444 | 0.111 | 0.011 | 0.128 | 0.408 | 0.909 | ||||
| Process Training | PT | 0.398 | 0.355 | 0.472 | 0.497 | 0.577 | 0.189 | 0.209 | 0.189 | 0.212 | 0.525 | 0.873 | |||
| Social Factors | SF | 0.228 | 0.511 | 0.191 | 0.227 | 0.24 | 0.572 | 0.428 | 0.598 | 0.33 | 0.238 | 0.176 | 0.750 | ||
| Technical Training | TT | 0.436 | 0.46 | 0.539 | 0.54 | 0.514 | 0.308 | 0.359 | 0.294 | 0.291 | 0.561 | 0.774 | 0.262 | 0.889 | |
| User Competency | UC | 0.494 | 0.331 | 0.59 | 0.398 | 0.599 | 0.195 | 0.123 | 0.328 | 0.467 | 0.519 | 0.539 | 0.219 | 0.602 | 0.908 |
| ID | Hypotheses | t-Values | p-Values | Results | |
|---|---|---|---|---|---|
| H1 | User Competency -> Behavioural Intention to Use | 3.393 | ** | 0.001 | Accepted |
| H2 | Knowledge Acquisition -> Behavioural Intention to Use | 2.318 | * | 0.021 | Accepted |
| H3 | Organisational Support -> Perceived Ease of Use | 2.14 | * | 0.032 | Accepted |
| H4 | Technical Training -> Perceived Ease of Use | 1.648 | 0.099 | Rejected | |
| H5 | Process Training -> Perceived Ease of Use | 0.531 | 0.596 | Rejected | |
| H6 | Technical Training -> User Competency | 2.34 | * | 0.019 | Accepted |
| H7 | Process Training -> User Competency | 0.588 | 0.557 | Rejected | |
| H8 | User Competency -> Perceived Ease of Use | 2.715 | ** | 0.007 | Accepted |
| H9 | User Competency -> Perceived Usefulness | 6.038 | ** | 0 | Accepted |
| H10 | Lean -> Perceived Ease of Use | 2.136 | * | 0.033 | Accepted |
| H11 | CI/Kaizen in Process Training -> User Competency | 1.597 | 0.11 | Rejected | |
| H12 | CI/Kaizen in Technical Training -> User Competency | 1.779 | 0.075 | Rejected | |
| H13 | CI/Kaizen in Knowledge Acquisition -> User Competency | 1.1 | 0.271 | Rejected | |
| H14 | Knowledge Acquisition ->Organisational Support | 1.992 | * | 0.046 | Accepted |
| H15 | CI/Kaizen to Knowledge Acquisition -> Perceived Usefulness | 1.08 | 0.28 | Rejected | |
| H16 | Knowledge Acquisition -> Attitude | 2.848 | ** | 0.004 | Accepted |
| H17 | Technical Training -> Attitude | 1.992 | ** | 0.046 | Accepted |
| H18 | Attitude -> Behavioural Intention to Use | 6.059 | ** | 0 | Accepted |
| H19 | Attitude -> BIM Uptake | 1.268 | 0.205 | Rejected | |
| H20 | Social Factors -> Perceived Usefulness | 1.442 | 0.149 | Rejected | |
| H21 | User Competency -> Social Factors | 1.954 | * | 0.049 | Accepted |
| H22 | User Competency -> BIM Uptake | 3.49 | ** | 0 | Accepted |
| H23 | CI/Kaizen -> User Competency | 2.996 | ** | 0.003 | Accepted |
| H24 | Lean -> BIM Uptake | 0.965 | 0.335 | Rejected | |
| H25 | Lean -> Organisational Learning | 0.897 | 0.37 | Rejected |
Publisher’s Note: MDPI stays neutral with regard to jurisdictional claims in published maps and institutional affiliations. |
© 2021 by the authors. Licensee MDPI, Basel, Switzerland. This article is an open access article distributed under the terms and conditions of the Creative Commons Attribution (CC BY) license (https://creativecommons.org/licenses/by/4.0/).
Share and Cite
Semaan, J.; Underwood, J.; Hyde, J. An Investigation of Work-Based Education and Training Needs for Effective BIM Adoption and Implementation: An Organisational Upskilling Model. Appl. Sci. 2021, 11, 8646. https://doi.org/10.3390/app11188646
Semaan J, Underwood J, Hyde J. An Investigation of Work-Based Education and Training Needs for Effective BIM Adoption and Implementation: An Organisational Upskilling Model. Applied Sciences. 2021; 11(18):8646. https://doi.org/10.3390/app11188646
Chicago/Turabian StyleSemaan, Jalal, Jason Underwood, and Jason Hyde. 2021. "An Investigation of Work-Based Education and Training Needs for Effective BIM Adoption and Implementation: An Organisational Upskilling Model" Applied Sciences 11, no. 18: 8646. https://doi.org/10.3390/app11188646
APA StyleSemaan, J., Underwood, J., & Hyde, J. (2021). An Investigation of Work-Based Education and Training Needs for Effective BIM Adoption and Implementation: An Organisational Upskilling Model. Applied Sciences, 11(18), 8646. https://doi.org/10.3390/app11188646