Article

Long Term Household Electricity Demand Forecasting Based on RNN-GBRT Model and a Novel Energy Theft Detection Method

by
Santanu Kumar Dash
1,
Michele Roccotelli
2,*,
Rasmi Ranjan Khansama
3,
Maria Pia Fanti
2 and
Agostino Marcello Mangini
2
1
TIFAC-CORE, Vellore Institute of Technology (VIT), Vellore 632014, India
2
Department of Electrical and Information Engineering, Politecnico di Bari, 70126 Bari, Italy
3
Department of Computer Science, C. V. Raman Global University, Bhubaneswar 752054, India
*
Author to whom correspondence should be addressed.
Appl. Sci. 2021, 11(18), 8612; https://doi.org/10.3390/app11188612
Submission received: 30 June 2021 / Revised: 11 September 2021 / Accepted: 13 September 2021 / Published: 16 September 2021
(This article belongs to the Special Issue Advances on Smart Cities and Smart Buildings)

Abstract

:
The long-term electricity demand forecast of the consumer utilization is essential for the energy provider to analyze the future demand and for the accurate management of demand response. Forecasting the consumer electricity demand with efficient and accurate strategies will help the energy provider to optimally plan generation points, such as solar and wind, and produce energy accordingly to reduce the rate of depletion. Various demand forecasting models have been developed and implemented in the literature. However, an efficient and accurate forecasting model is required to study the daily consumption of the consumers from their historical data and forecast the necessary energy demand from the consumer’s side. The proposed recurrent neural network gradient boosting regression tree (RNN-GBRT) forecasting technique allows one to reduce the demand for electricity by studying the daily usage pattern of consumers, which would significantly help to cope with the accurate evaluation. The efficiency of the proposed forecasting model is compared with various conventional models. In addition, by the utilization of power consumption data, power theft detection in the distribution line is monitored to avoid financial losses by the utility provider. This paper also deals with the consumer’s energy analysis, useful in tracking the data consistency to detect any kind of abnormal and sudden change in the meter reading, thereby distinguishing the tampering of meters and power theft. Indeed, power theft is an important issue to be addressed particularly in developing and economically lagging countries, such as India. The results obtained by the proposed methodology have been analyzed and discussed to validate their efficacy.

1. Introduction

With the current increase in global warming, the focus of energy dependency has moved towards renewable energy sources (RESs), which seemingly have zero emission of greenhouse gases. As the percentage of carbon footprint rises with the use of traditional sources of energy, such as coal, the utilization of solar or hydro energy helps in reducing carbon footprints, providing a green energy alternative [1,2]. In order to ensure a pollution free ecosystem, we must move towards the utilization of RESs. Hence, a proper investment in RESs is essential [1,2,3].
RESs are integrated to the existing grid infrastructure to satisfy the energy demand of consumers, reducing the need for power from the main grid [1]. At the same time, storage devices are essential to optimize the use of renewable energy by storing energy when available and supplying it to consumers according to their requirement. Hence, for an optimal use of the energy from RESs, it is important to predict the energy demand of customers based on historical measurements. However, the evaluation of energy demand from the consumer load side cannot be efficiently performed through any of the present energy meter reading techniques in India [4,5]. Many researchers have focused on various power measuring devices [6,7,8]. These literature studies point out that the dynamic consumer electricity requirement has become a challenge for the power grid and sudden inflation in power demand and future energy requirement by the various categories of load cannot be efficiently predicted.
To overcome this limitation, many forecasting techniques to be applied by using smart metering and control systems are proposed [9,10]. In this context, efficient strategies to address the current challenges should aim at analyzing the consumer’s energy requirements in the past, forecasting the demand and finally generating and producing the energy [9,10,11]. Demand forecasting using time series can be useful for informing the control unit regarding the energy over time to be produced in the future [12,13,14]. This can significantly help to cope with the problem of managing the generation from different sources, such as RESs, produce and distribute power more efficiently according to demand, and lessen the fee of depletion.
In addition, to improve energy distribution efficiency and reduce financial losses, power theft detection has become necessary to reduce energy loss at the consumer as well as generation point. Due to the intensity of economic and financial losses it provides, power theft is a punishable offence across the globe [14,15,16]. Indeed, power theft has enhanced the financial losses of both the supply units and the consumers in many countries. As an example, the Indian government is losing its financial integrity and is continuously working on this issue to produce the required devices and systems for proper grid operation and distribution. Nevertheless, the Indian government has, as of yet, failed to eliminate the power theft practice. Hence, to curb such illegal practices, a proper theft tracking scheme is necessary [17,18]. Although many electricity meter schemes are introduced by researchers in the literature, an efficient solution for detecting the illegal power theft is desired. The work [19] deals with the internal power larceny issues by constantly tracking the data consistency to detect any kind of abnormal and sudden change in the meter reading. The societal impact of the work lies in the fact that the utilities can distinguish the source of theft and the real consumers. Ultimately, the Indian government can limit energy losses by curbing the illegal practices of power felonies, which would favor the financial and economic stability of the country [20,21].
In this context, the contribution of the paper is twofold. The first contribution is analyzing and forecasting the energy demand of the domestic household. The daily consumption of a household is predicted using and comparing various forecasting models and the energy demand for the next few days over a specific period of time is determined. The proposed RNN-GBRT hybrid model shows more accurate forecasting performance than other models. Thereby, creating awareness among the consumers and the utilities with regard to their energy usage is the major focus. The second contribution is towards identifying the power theft by constantly tracking the data consistency to detect any kind of abnormal and sudden change in the energy meter reading.
The rest of the paper is organized as follows. Section 2 presents the literature survey, wherein various papers are analyzed with respect to the proposed research work. Additionally, some of the limitations of the papers are highlighted. Section 3 presents the algorithms for demand forecasting and power theft detection, while their implementation is described in Section 4, which presents various simulation results and demonstrates the superiority of the proposed prediction model and the efficacy of the power theft strategy. Finally, Section 5 concludes the work and highlights the future scope.

2. Related Works

The issues related to variation in load demand at the consumer end have raised serious concerns for the grid utility provider. Therefore, analyzing the future energy requirement of the domestic end-user is essential both for short term and long term load demand management. Focusing on the raised problems, researchers have proposed different load demand forecasting models to resolve the issues related to dynamic consumer load demand. In this section, we have analyzed related works and their approaches for the load demand forecasting.
In this context, to analyze the consumer behavior and electricity consumption over time, ref. [10] proposes an innovative strategy based on cluster analysis with K-means algorithm. The authors have identified the time variable separated groups of individual electricity consumption patterns, which will help in predicting the consumer electricity requirements. Considering the climate change effect and utilization of clean energy resources for power generation, the long term load demand prediction and demand side management has been addressed in [11] for the Taiwan government. The photovoltaic energy generation prediction and its demand have been analyzed by the authors of [12] by the application of R programming to estimate its efficiency for a Photovoltaic (PV) based microgrid. For environmental and economic security, energy demand management and forecast are essential to satisfy the future energy grid needs [13]. Therefore, future energy demand prediction by the utilization of conventional and advanced intelligent methods has been discussed in [13,14] based on time series models and soft computing-based prediction models. In addition, energy demand prediction has also been studied for short term period applications. In particular, short term load forecasting is presented in [15,16] by studying residential behavior learning, explaining the decay of radial basis function (RBF) neural networks (DRNNs), and demonstrating that deep-learning forecasting framework-based models have higher efficiency than the traditional forecasting strategies. The utilization of a fuzzy logic regression method for short term load forecasting is presented in [17], using previous three-year data with high accuracy. For the intraday electricity demand prediction in highly developed countries from Europe has been discussed in [22]. This paper has focused on the shot term a day ahead prediction based on principal component analysis of the daily demand profiles. The short term load demand prediction by the application of deep learning network-based CNN and multi-layer bi-directional LSTM prediction method for a household has been analyzed in [23]. This methodology has shown its effectiveness in achieving the lowest value of root mean square error and mean square error for an individual household. The utilization of the LSTM Network based on artificial neural networks to predict the long term electricity demand in Poland is presented in [24]. This method focused on cost management and has been adopted for strategic plan development in electric power system of Poland. As the deep learning approach has become popular among researchers for developing energy demand forecasting models, in [25], deep learning approaches including deep neural networks and long short term memory have been considered. This work extensively verified the efficiency of deep neural network-based prediction methods under different consumer electricity patterns. Bio-inspired algorithmic models have also been adopted to develop efficient energy forecasting models. In this context, [26,27] have investigated the utilization of autoregressive neural network based on genetic algorithm and particle swarm optimization for development of energy prediction models. The adopted hybrid method shows its effectiveness in energy prediction compared with other bio inspired algorithms. Moreover, the Autoregressive integrated moving average (ARIMA) model is a popular methodology for load demand evaluation and forecasting [28], and hybrid ARIMA strategies have been studied and implemented to achieve higher efficiency in [28,29,30,31]. In particular, for a Brazilian northeast company [28], the energy demand based on natural gas has been studied and predicted by applying an ARIMA-ANN based hybrid methodology. Furthermore, for the prediction of a single day ahead energy price, ARIMA and Holt-Winters forecasting models have been implemented in [29], achieving results that overcome those of the traditional models. Authors in [30] have proposed adaptive online ensemble learning with a recurrent neural network (RNN)-ARIMA-based hybrid model to reach the target of load demand prediction. Similarly, an ARIMA-GBRT (gradient boosting regression tree)-based hybrid model has also been developed and implemented in [31] to simulate and forecast the electrical energy consumption of residential buildings. The GBRT technique is used in combination with ARIMA in the proposed model to improve the forecast performance with respect to existing prediction models. The comparison of forecasting models is performed based on standard performance indicators and demonstrates the superiority of the proposed ARIMA-GBRT model.
In addition, other contributions have proposed methods to identify the energy theft detection in power grids. In this context, the authors in [32,33] have studied the load profile of various customers to expose the degree of nontechnical losses. The study on load profile and load demand provided satisfactory data to analyze the possibilities of energy theft at the distribution point. In [33,34], a solution to the fraud activity by implementing the technique of decision tree is discussed. The authors of [35] used a time series neural network to identify the source of power tampering activity. Moreover, a machine learning algorithm allows the comparison of various local households to determine the number of honest customers and the rate of illegal consumers. In [36], the authors applied various classification models on regular energy expenditure data and encoded data. A comparison of accuracies of the adopted models is also presented. In addition, contributions [37,38,39,40,41] have studied how the power theft phenomenon affects the consumers as well as the power grid.
The analysis of the related literature reveals that there is the lack of a unique methodology to predict energy consumption, especially for detecting illegal use of energy, and it does not emerge a suitable and effective strategy to be applied in this context. Therefore, the authors of this paper are motivated to analyze the performance of various demand forecasting techniques and propose an efficient method for energy demand prediction. In addition, in order to protect the domestic household from power theft, a unique methodology is adopted and analyzed.

3. Demand Forecasting Models and Power Theft Detection Strategy
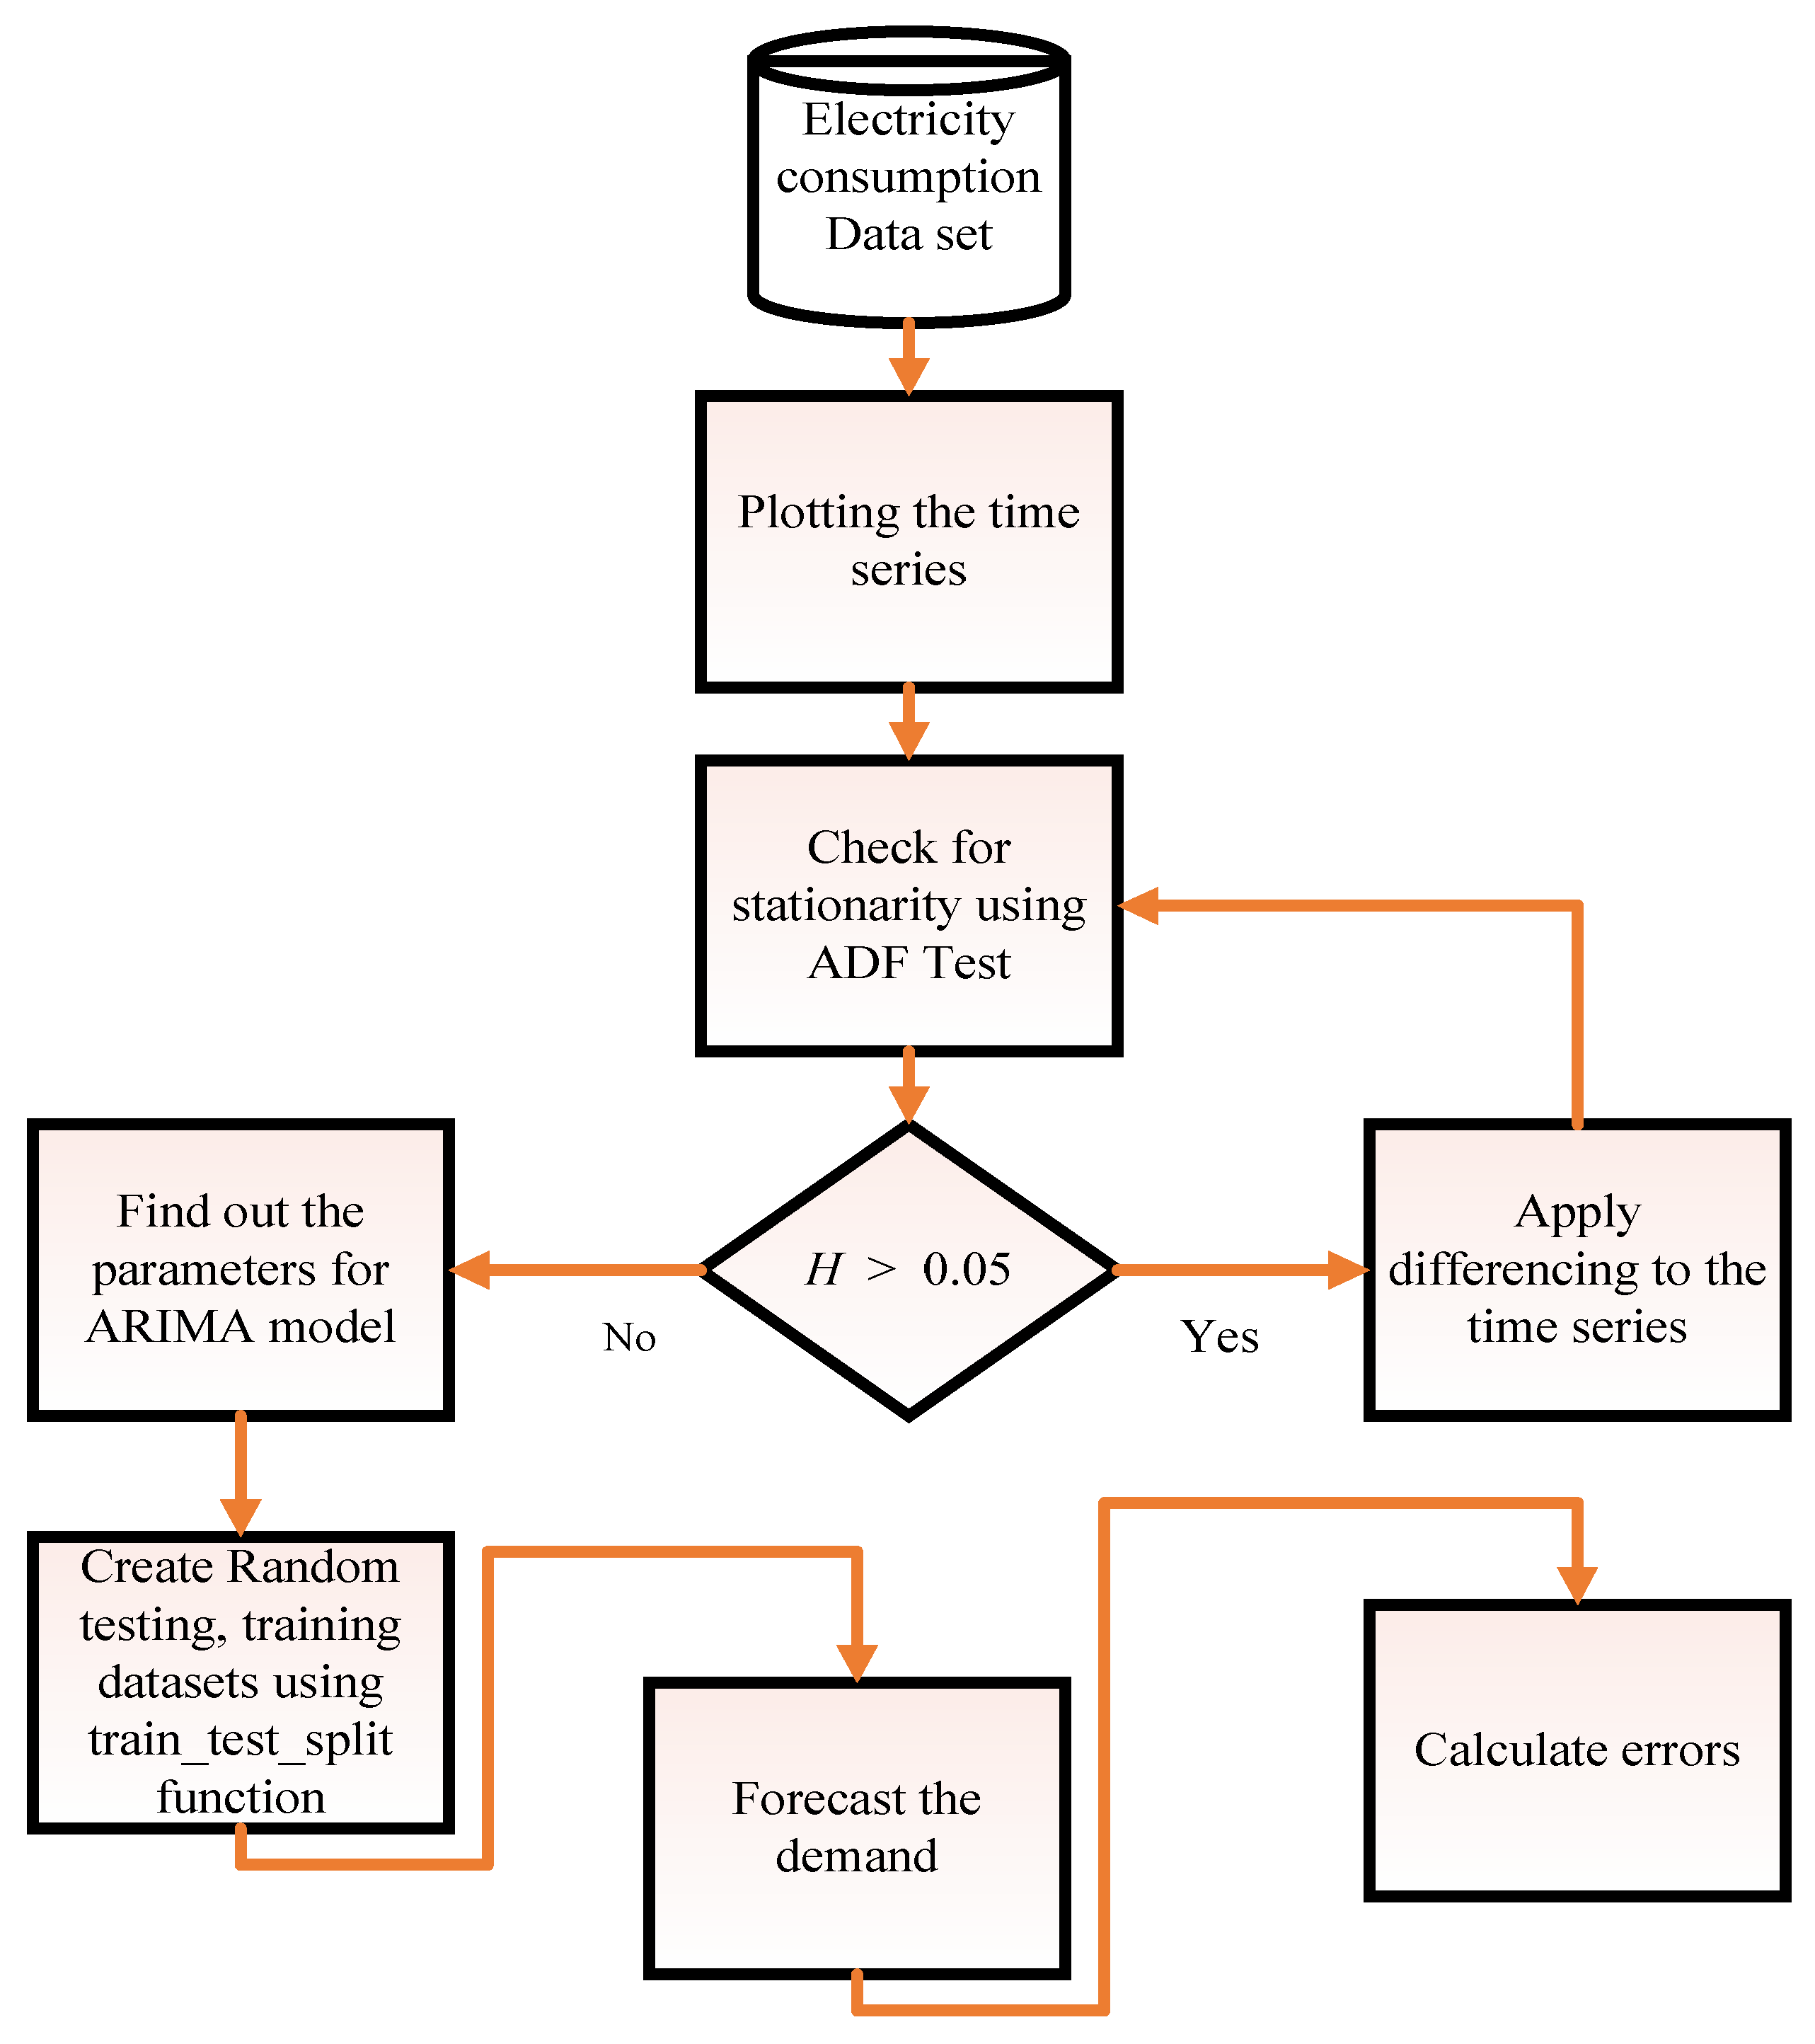
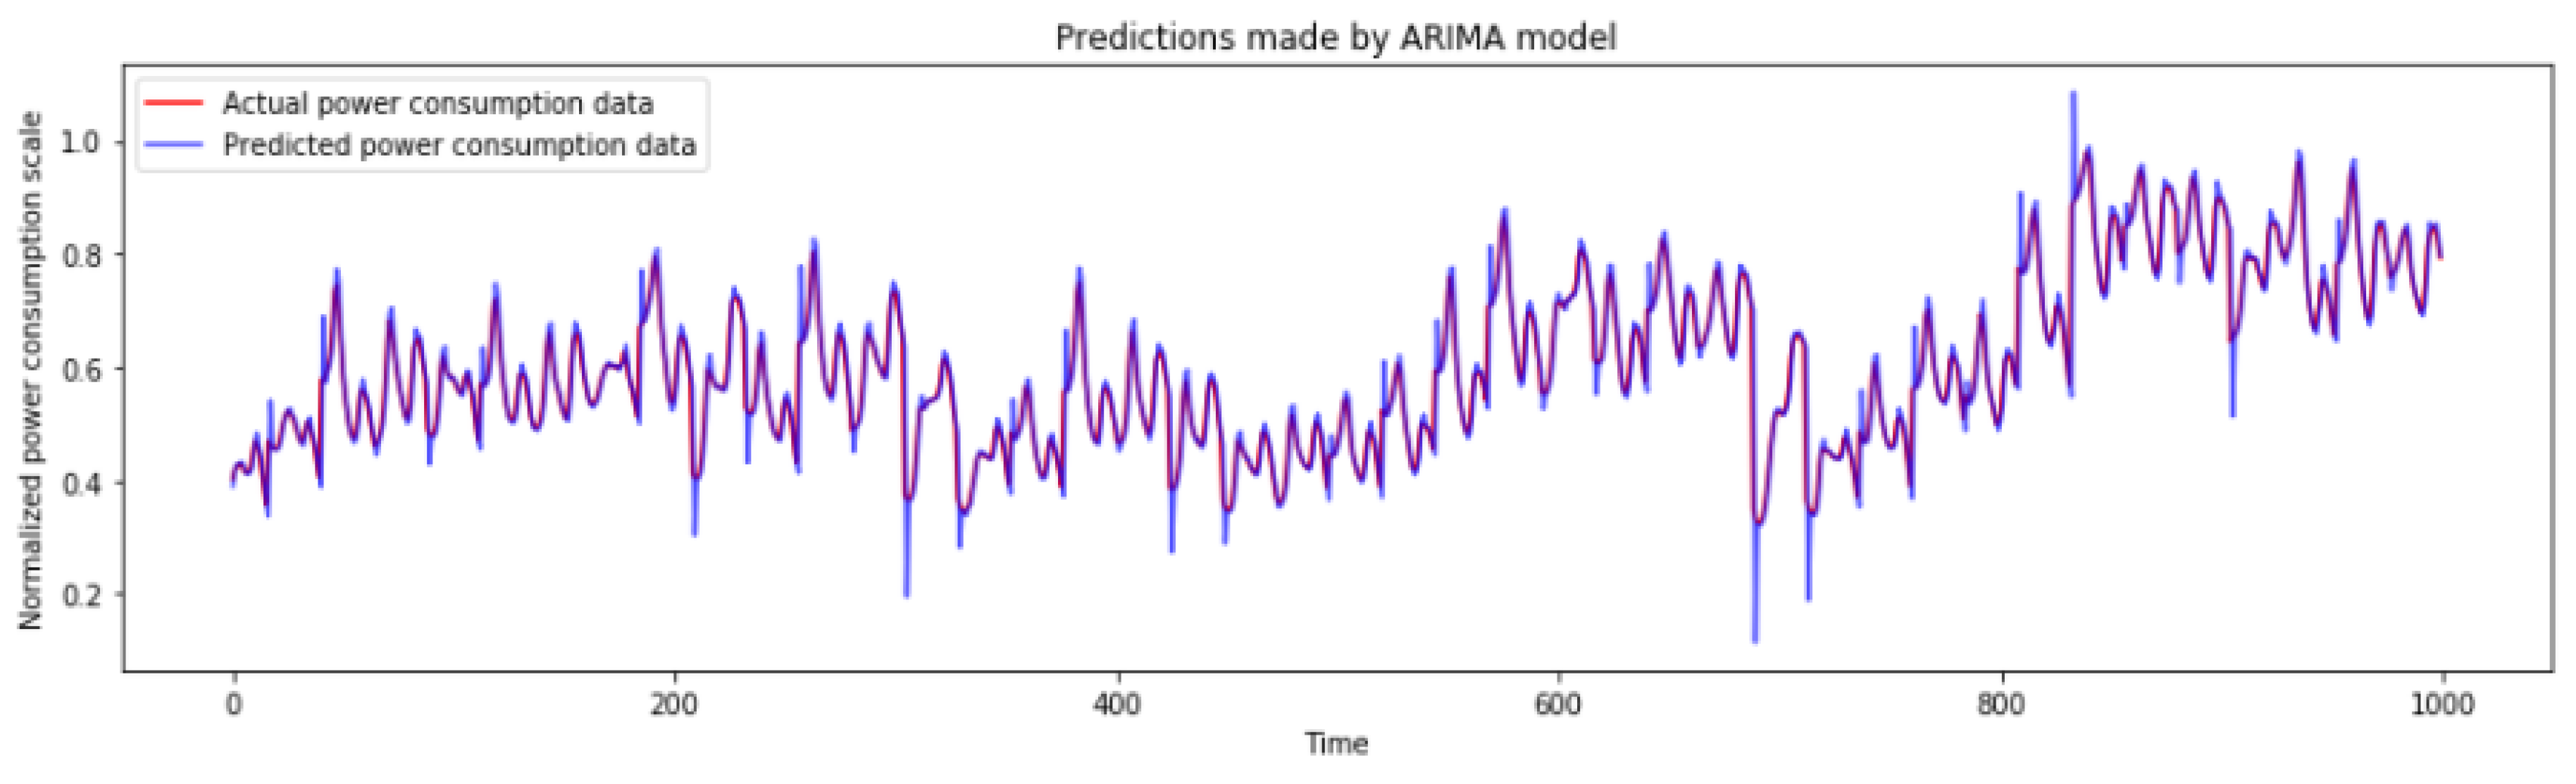
In this section, the proposed architecture for the energy demand forecasting and power theft detection is presented in Figure 1, highlighting the main components and functionalities. In particular, the conventional forecasting models for demand forecasting in domestic household are the focus of this section. Existing models, as well as the proposed hybrid RNN-GBRT forecasting strategy, are presented and analyzed. The considered dataset for models training and testing is taken from a household in Sceaux (Paris) and includes a total of 727 daily energy consumption values from 16 December 2008 to 20 December 2017. Moreover, a new strategy is presented to provide an effective solution to the power theft detection problem.

3.1. ARIMA Model

Autoregressive integrated moving average (ARIMA) is a time series model designed to predict future points of an event with regard to its historic time series data [27,28]. The ARIMA model is generally considered with stationary data, wherein an initial differencing is applied several times to nonstationary data to attain a stationary time series. The AR part of ARIMA specifies that the generation variable repeats with respect to its lag values. The MA part of ARIMA specifies that the generation variable repeats with respect to its prior forecast errors obtained continuously. The first part of ARIMA indicates that the data values are restored by the difference value between original value and previous value. The aim of each of these features of ARIMA is to make the model fit the data. The model being used for prediction is an ARIMA model given by ARIMA ( p , d , q ) s , where ‘p’ denotes the number of autoregressive terms, and ‘d’ represents number of seasonal differences required for stationarity. The ‘q’ is the number of lagged forecast errors in the prediction errors, and ‘s’ is the number of lagged forecast errors in the periods per season (generally 12 in the present case). The structure of ARIMA model is shown in Figure 2.
The mathematical representations of AR and MA models can be given as a pure Auto Regressive (AR) model, where Z t is only dependent on its own lag. In an AR model, Z t is a function of the ‘lag components of Z t ’. Hence, the mathematical representation of AR model becomes:
Z t = α + β 1 Z t 1 + β 2 Z t 2 + β n Z t n t + + ϕ 1 t 1 + ϕ 2 t 2 + + ϕ n t n
The architecture of an ARIMA model works on the basis of a time series analysis. Time series analysis (TSA) is a method to determine the futuristic trend of an event with a view of its past trend. The technique is based on the assumption that the future trend will hold similar to the historical trend. TSA focuses on two aspects, which are the identification of the nature of event (with respect to the series of observations) and the forecasting thereof.
Electricity demand forecasting by the utilization of ARIMA model consists of the following steps:
Step 1:
Collection of dataset: Forecasting is always triggered by a set of values.
Step 2:
Observation of series: The obtained series of data are plotted, and the pattern of series is observed. The underlying characteristics, such as trend, seasonality, and noise, are identified. Various break points and elevated points of the series are also observed. This is a crucial part of TSA, wherein the data, with respect to its time series, is thoroughly analyzed; various statistical components of the series are discovered.
Step 3:
Stationarity: When the statistical properties of a series, such as mean, variance, autocorrelation, etc., are constant over time, then such a time series is stationary. The augmented Dickey–Fuller (ADF) test is the test for stationarity, where the time series must have a ‘H’ parameter less than 0.05 to be stationary [28].
Step 4:
Extraction of the optimal model parameters: This can be done by identifying the Autocorrelation function (ACF) and partial autocorrelation function (PACF) plots. The autocorrelation function is the plot of autocorrelation of a time series by lag; partial autocorrelation is the relationship among the prior time observations of time series. In this step, all the parameters are checked, and the most appropriate models are selected.
Step 5:
Fitting Model: Optimal model parameters are followed by the ARIMA model, which is fit to learn the series pattern. ARIMA(7,1,6) is the prediction model.
Step 6:
Prediction: After fitting the model, the event is predicted. In the present research paper, the predicted test data is obtained and compared with the original dataset.
Step 7:
Determination of accuracy: Finally, the various erroneous parameters are considered to determine the efficiency of the model. Various error parameters are tabulated in the results section. Generally, a time series data ( S m ) is a combination of seasonality ( L m ) , trend ( T m ) , and noise ( N m ) components, which can be determined as S m = L m + T m + N m , known as an additive model. This additive model does not show good performance for the household electricity consumption data prediction due to its dependence on seasonality.
Therefore, a multiplicative model, given as S m = L m × T m × N m , is preferable. The multiplicative model can be transformed into an additive model with the introduction of logarithms, given as:
log S m = L m + log T m + log N m

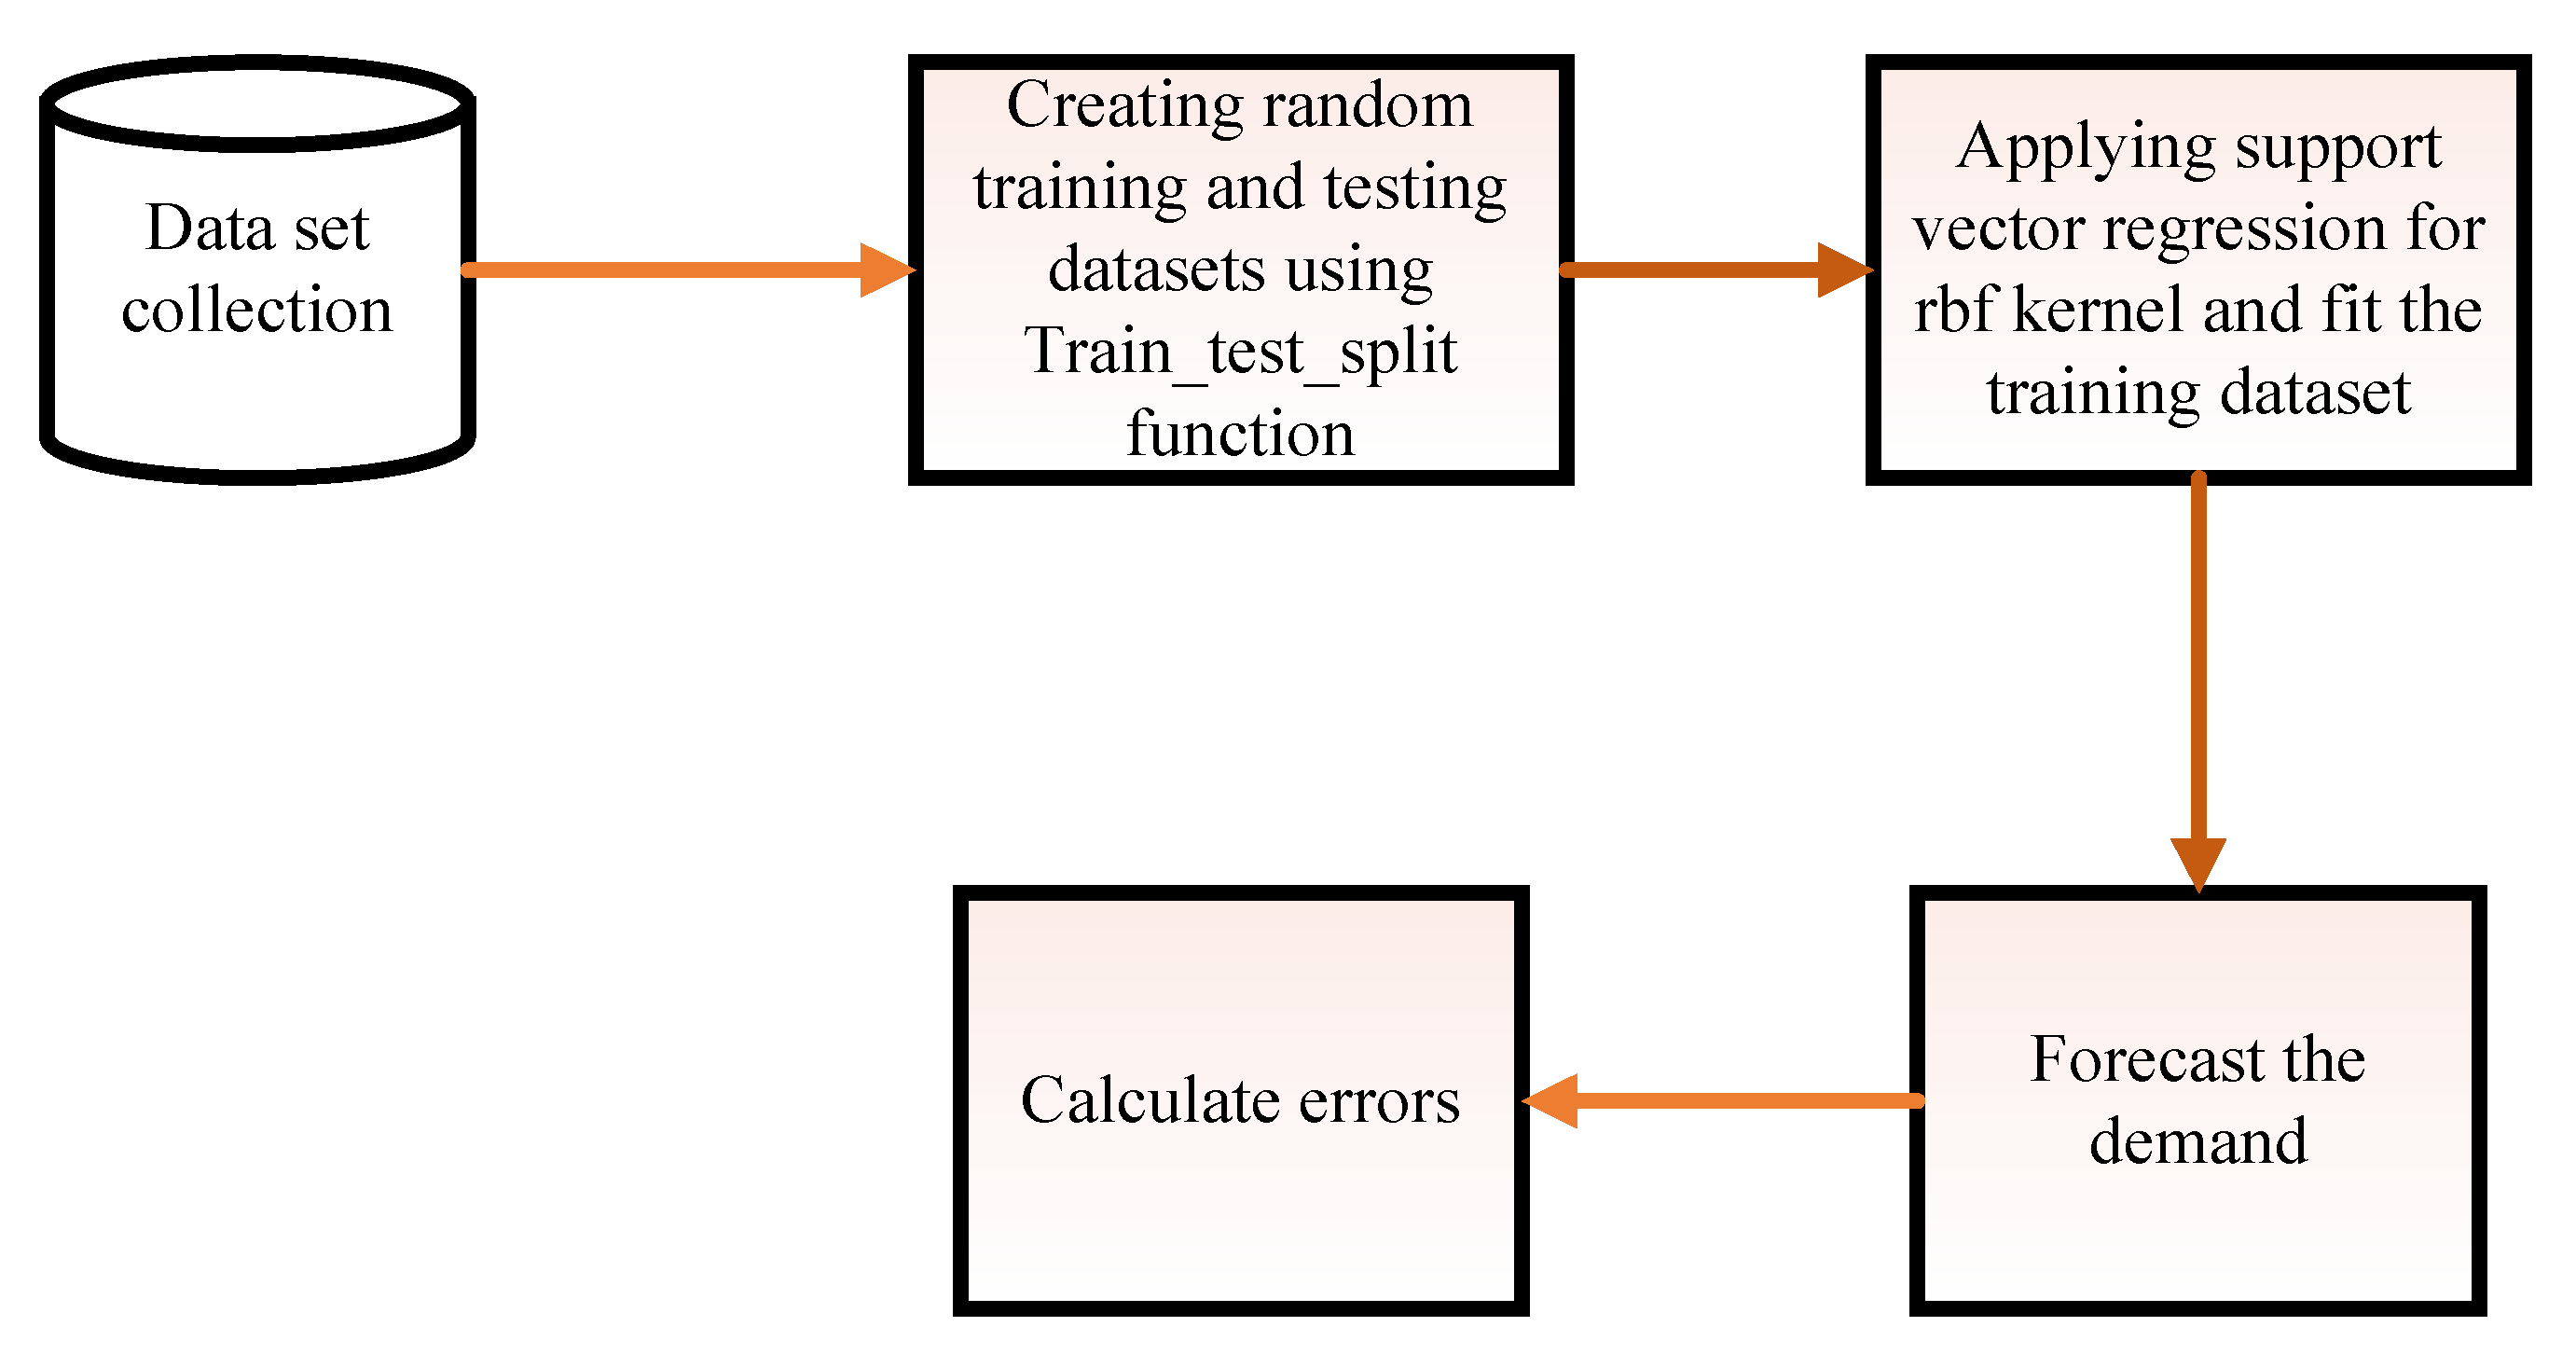
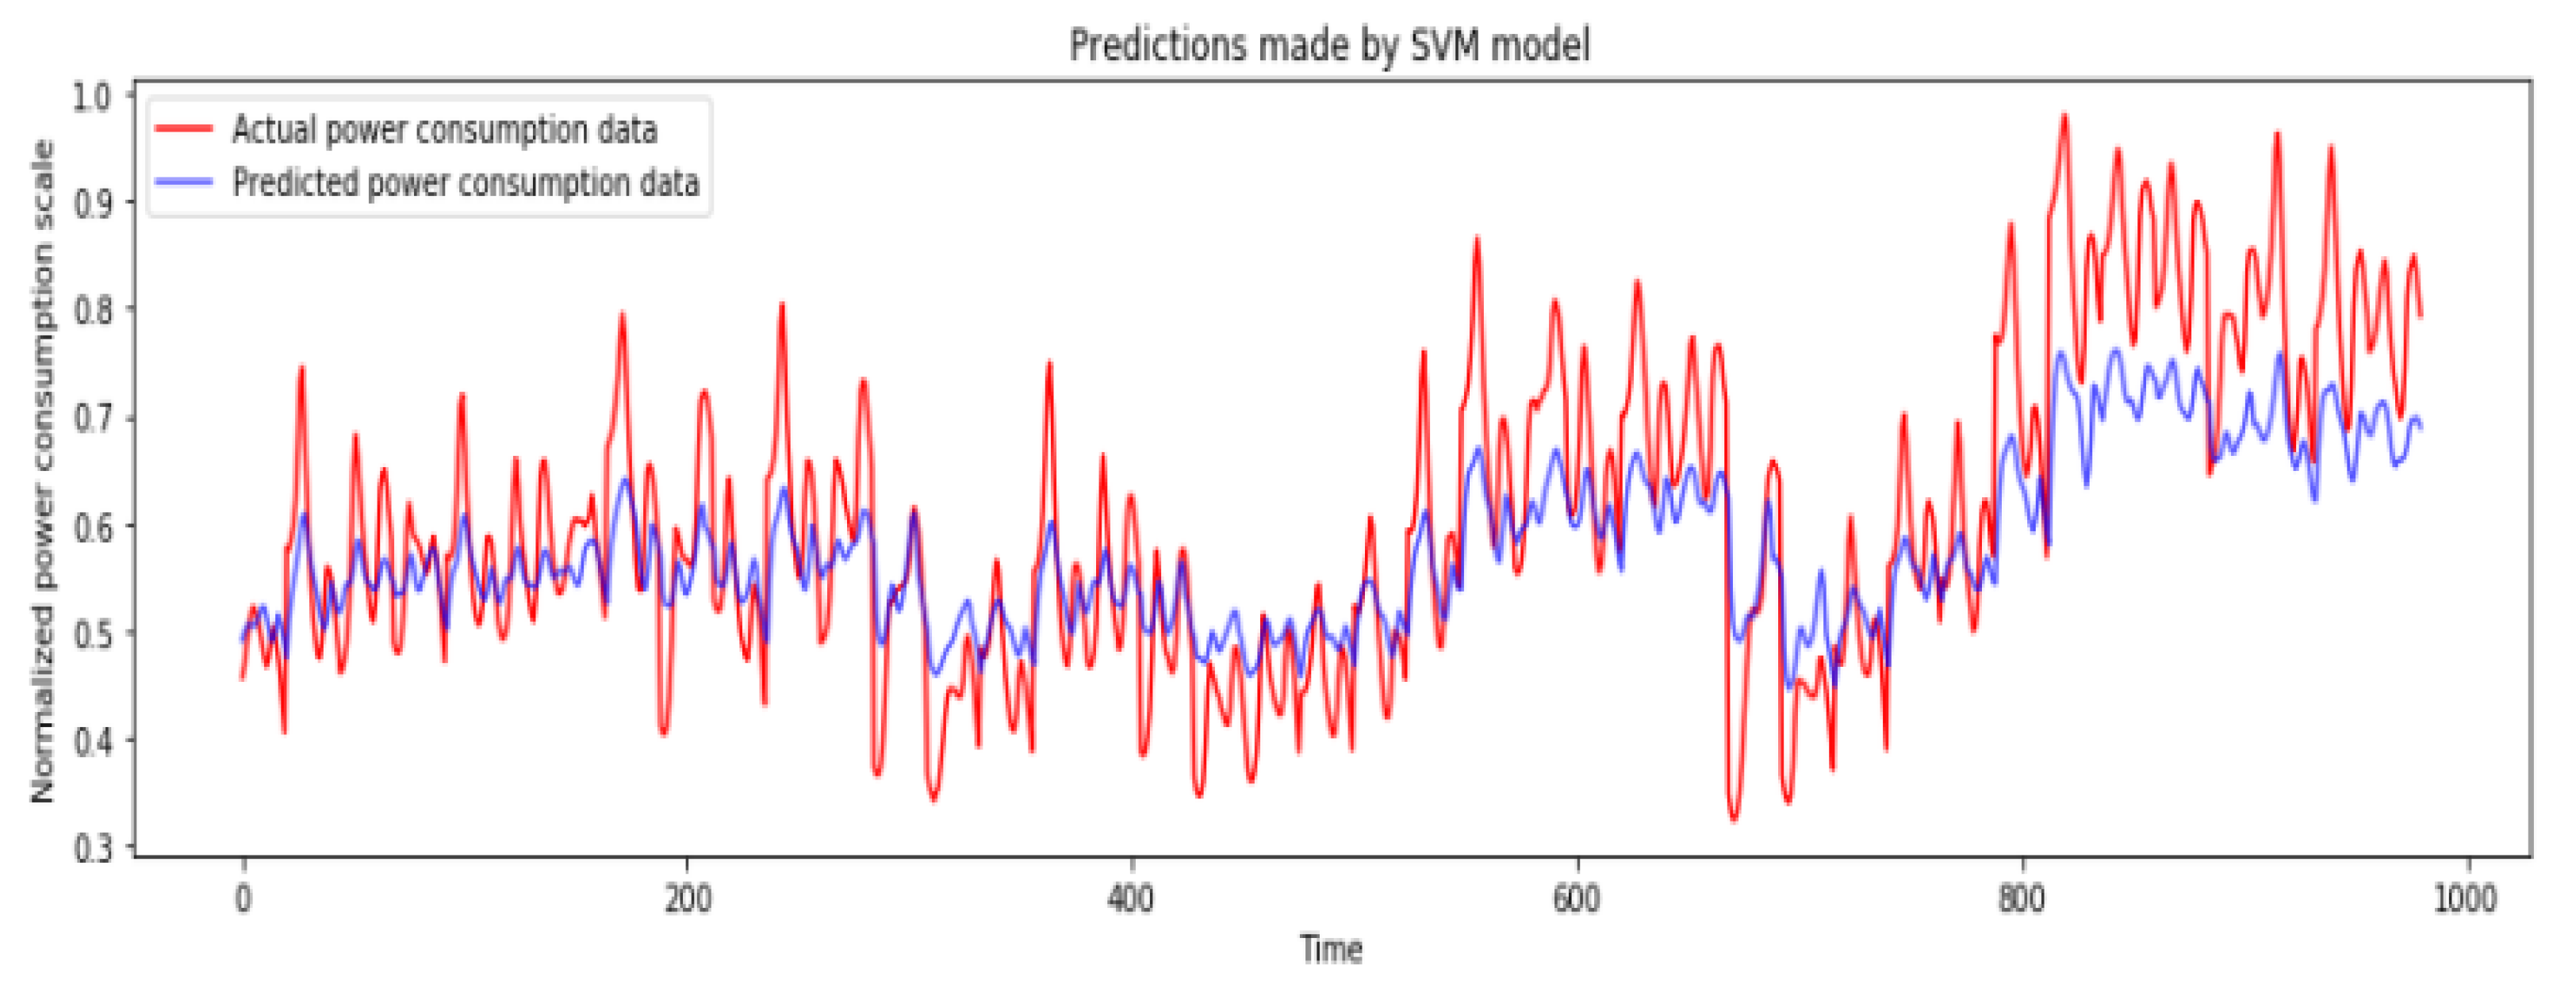
3.2. Support Vector Regression Forecasting Model

Support vector network is a branch of machine learning that analyzes data with respect to operational learning techniques. Support vector regression (SVR) uses the principles of support vector machine (SVM), except the fact that SVR adjusts the prediction function with the threshold error. SVR tries to minimize the generalization error so as to achieve generalized performance. On the contrary, most of the other regression techniques try to decrease the observed error between the forecasted value and the original value. SVR is the most common application of SVM. SVR can be applied for time series prediction, financial forecasting, estimation of challenging engineering tasks, etc. SVR is classified into linear, polynomial, and rbf kernel. Due to its high accuracy, the rbf kernel model is considered in this paper.
In this paper, ε-SVR was implemented, and the value of ε was set as 0.2. The regularization parameter ‘C’ and the gamma ‘γ’ were defined through grid search.
The train test split function was used, with random classification of 70% of data as train set and using the remaining 30% as test set. The train set was fitted using rbf kernel, and forecasting of the data was achieved. The forecasted data was compared with the test set to verify the result, and mean square error (MSE), mean absolute error (MAE), and root mean squared error (RMSE) [35,36] indices were calculated. The following steps were implemented for the SVR model forecasting, as also shown in Figure 3:
Step 1:
Create Testing and training datasets with the train_test_split function. Here, we divided it into 70% training dataset, 30% testing dataset.
Step 2:
Build the support vector regression model using SVR function for RBF kernel with appropriate parameters for the training dataset.
Step 3:
Forecast the consumption values for the testing dataset.
Step 4:
Plot the actual and forecasted values of the testing dataset.
Step 5:
Calculate MSE, MAE, and RMSE.

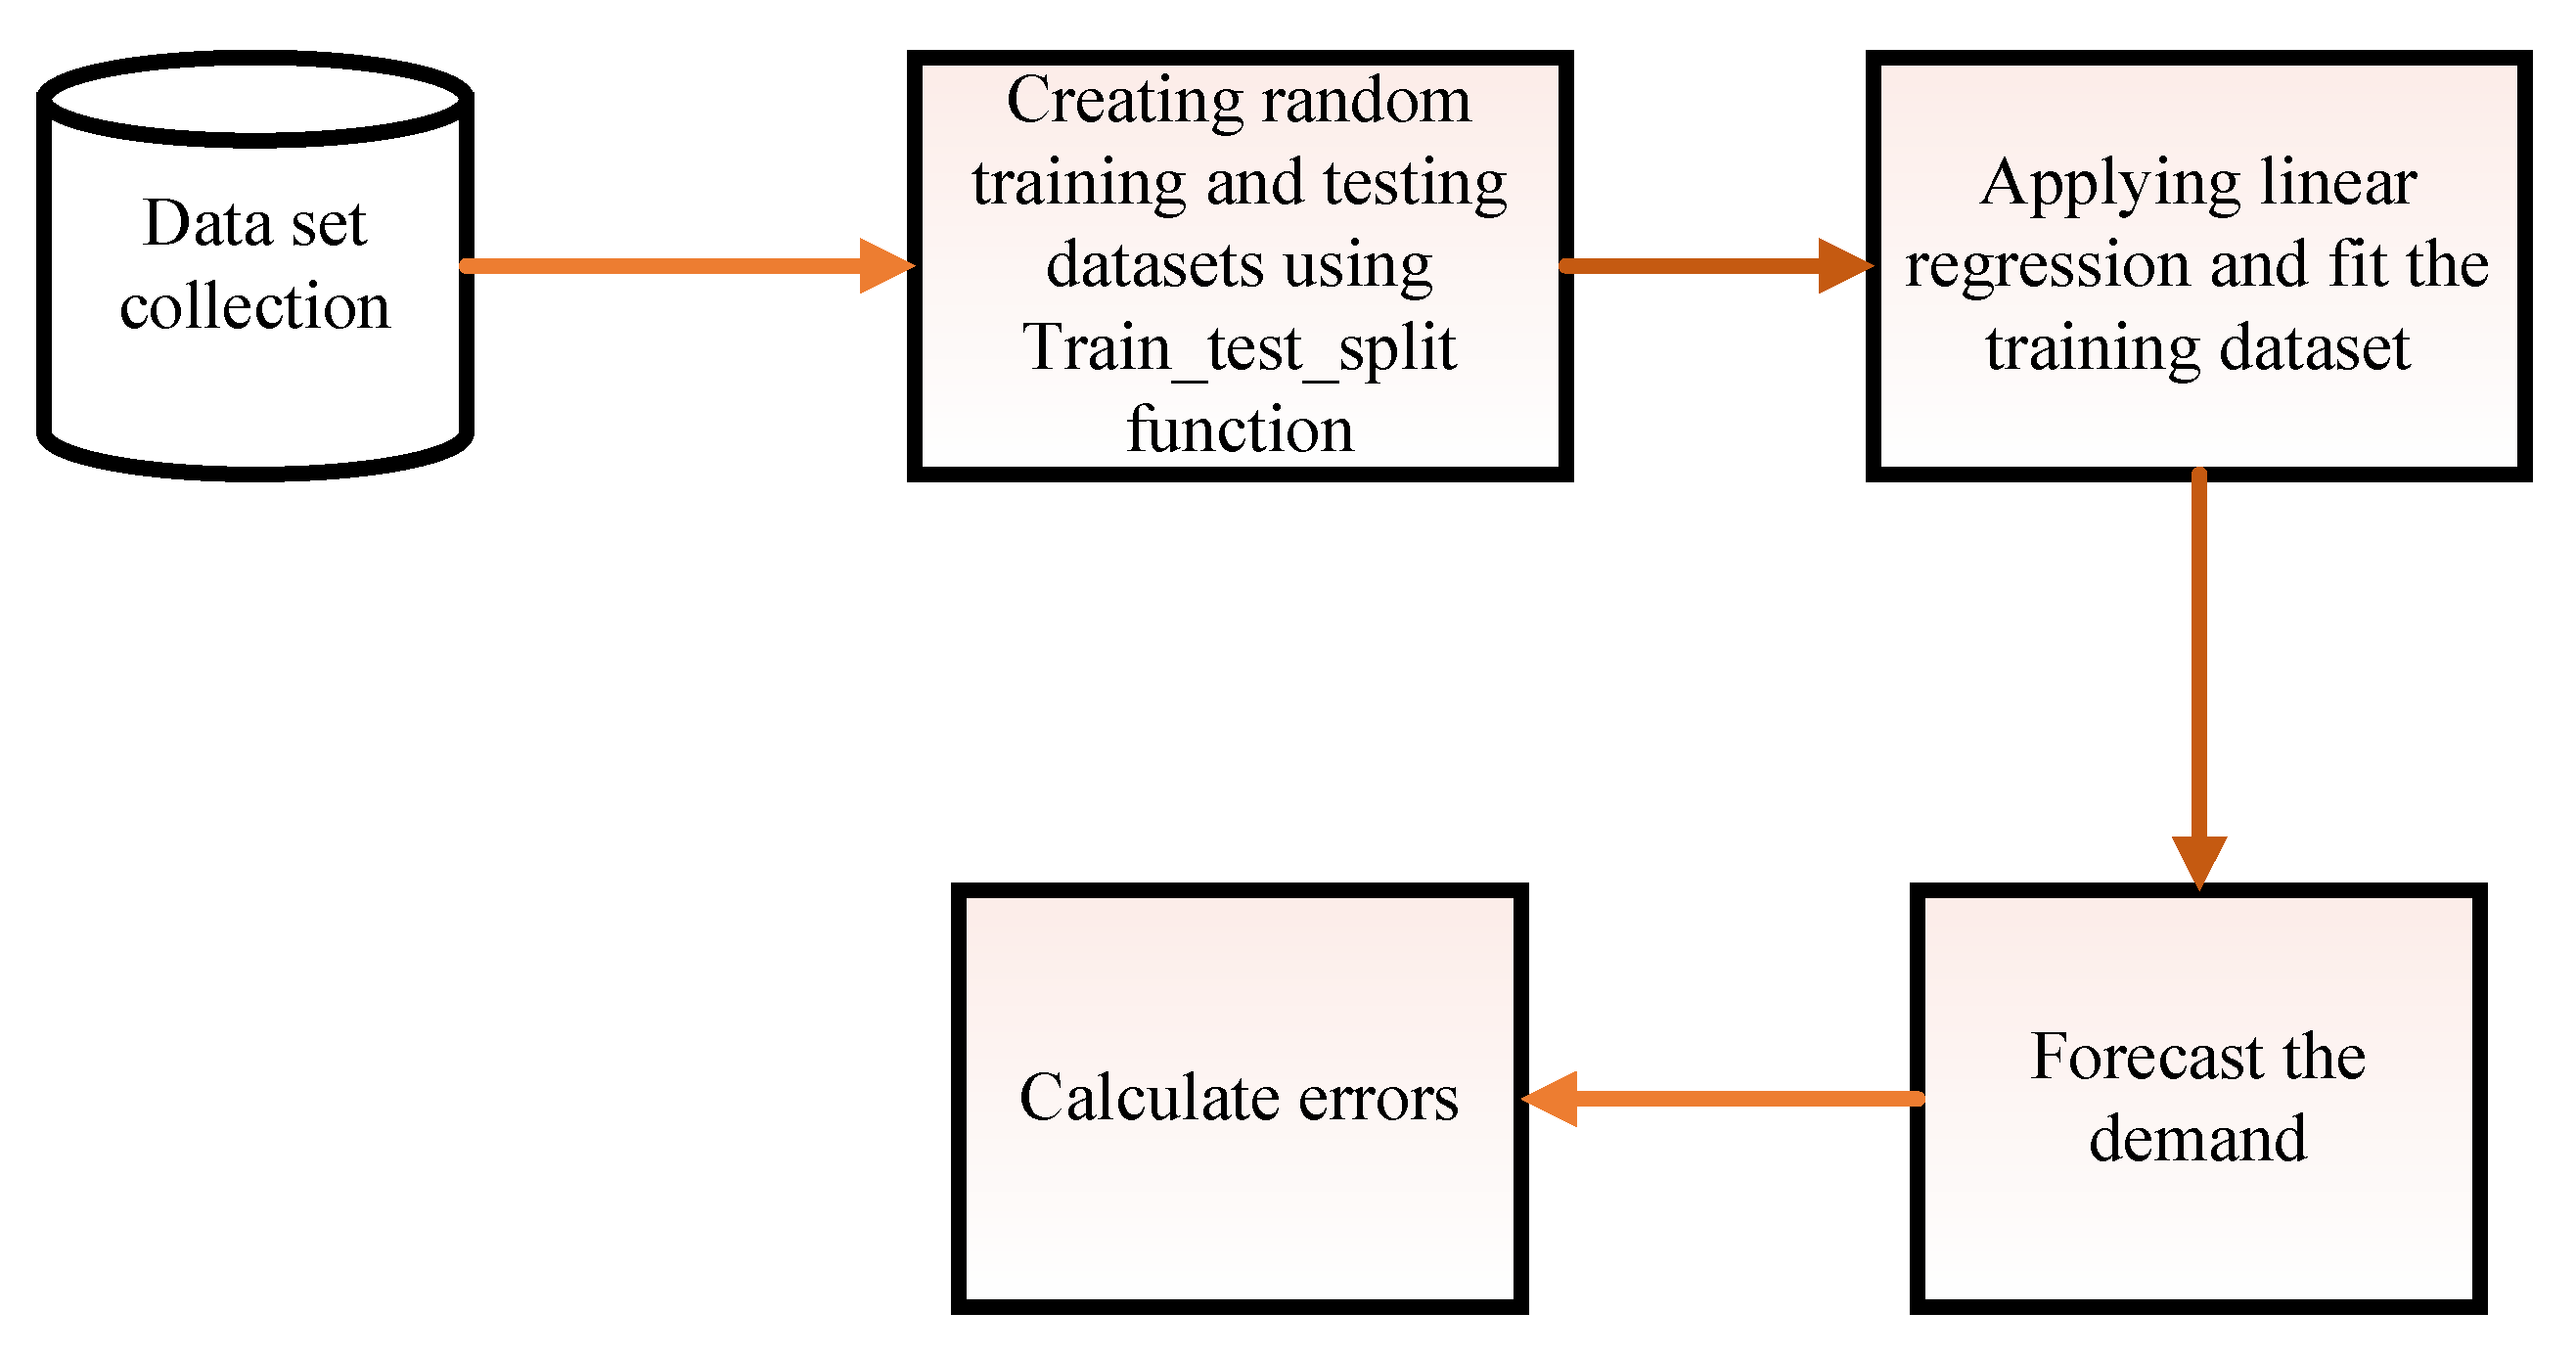
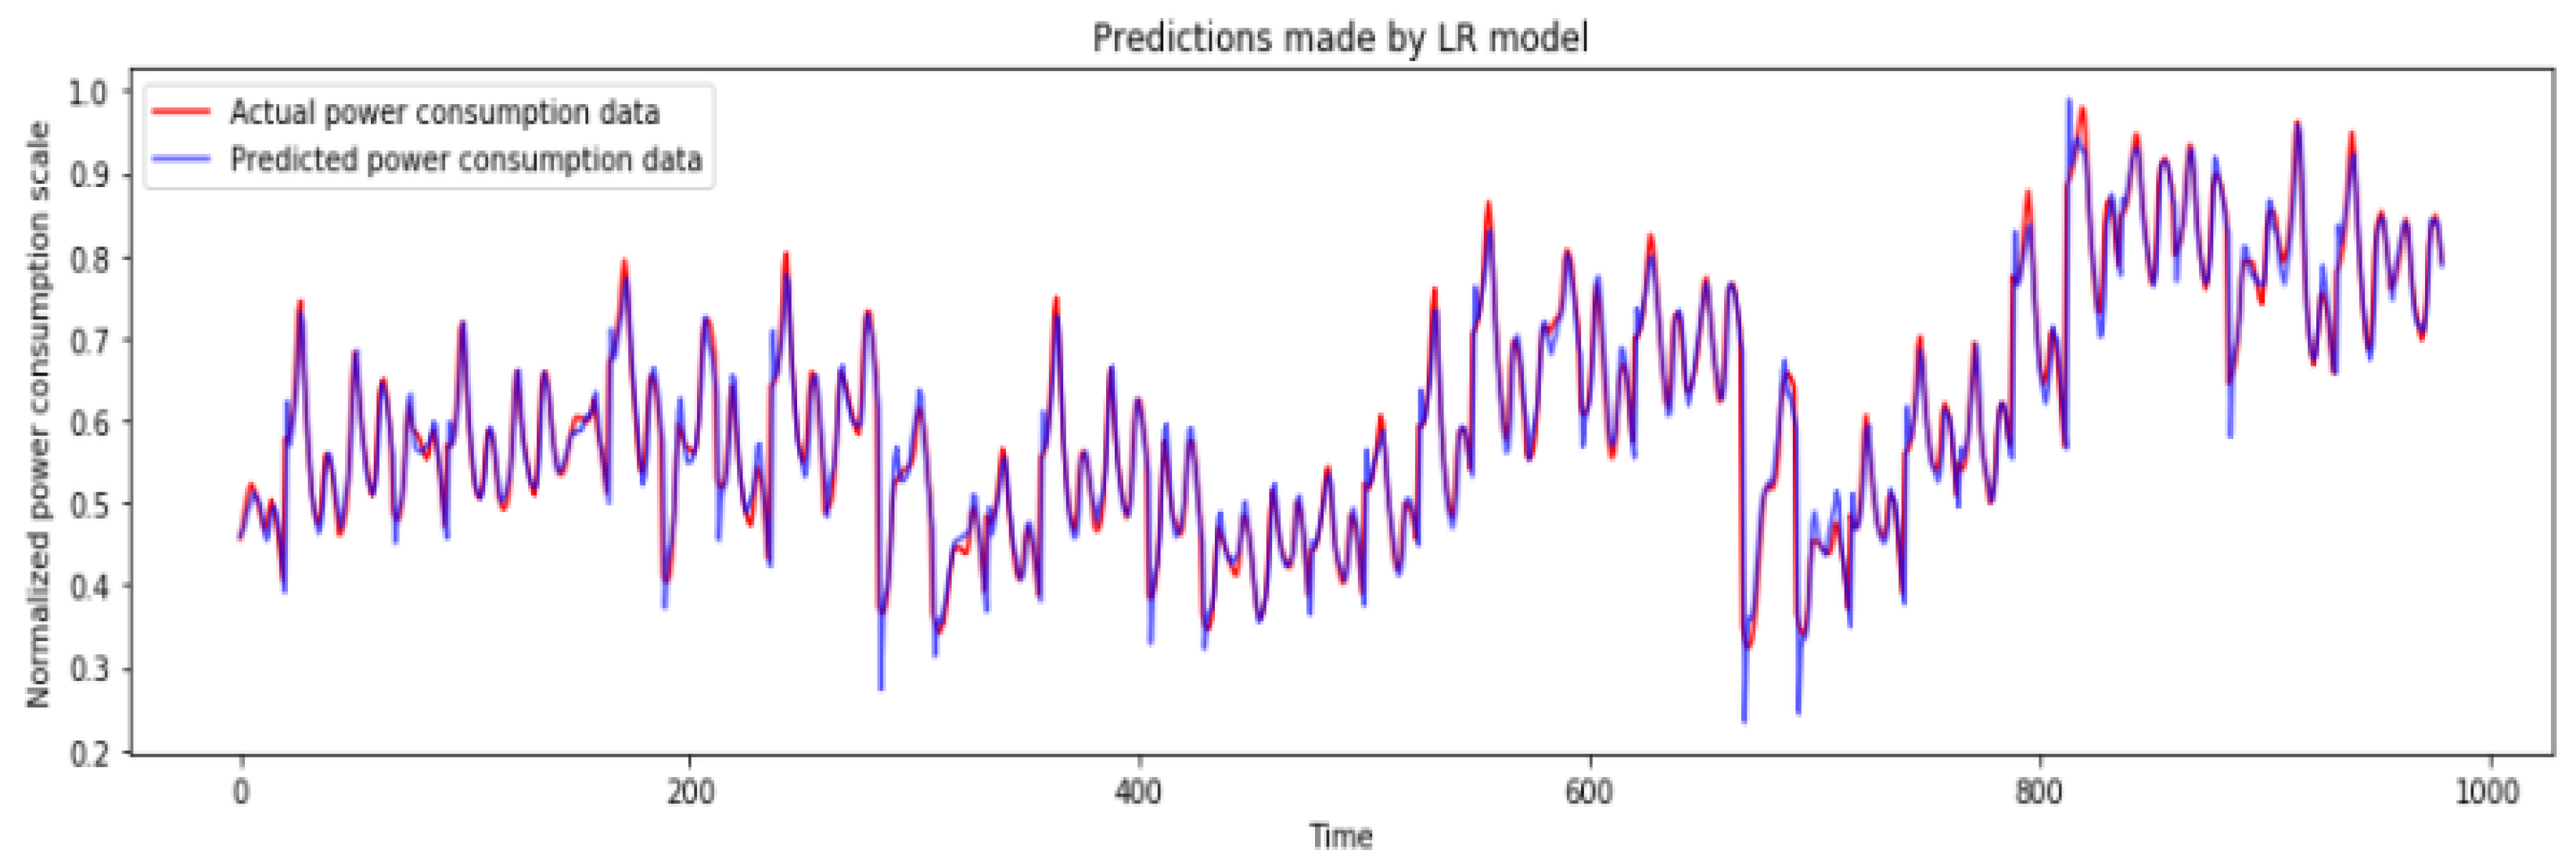
3.3. Linear Regression Forecasting Model

Linear regression is a concept derived from statistics. It is a linear technique for modelling the correlation between a dependent variable and one or more independent variables. If one independent variable is considered, then the process is a simple linear regression. On the contrary, if several independent variables are considered, then the process is a multiple linear regression. Unlike multivariate analysis, which entirely focuses on joint probability, linear regression focuses on conditional probability.
Linear regression is extensively used for the study of practical applications, since it is easy to fit the models that have linear dependence with its historic data. Hence, linear regression has greater significance in forecasting applications.
The simple linear regression model is typically formulated as y = a + bx; ‘y’ is the output, ‘x’ is the input, ‘b’ is the input coefficient, and ’a’ is a constant. In case of multiple inputs, such as x1, x2, x3, the model representation is y = a + b1x1 + b2x2 + b3x3.
Additionally, in this case, 70% of data are randomly considered as train data, and the remaining 30% are considered as test data, using the train_test_split function. Finally, the energy demand with respect to the test data is predicted and compared with the original data. To determine the accuracy of the model, MSE, MAE, and RMSE are calculated. The architecture of linear regression forecasting is presented in Figure 4. The model implementation is done according to the listed steps:
Step 1:
Create testing and training datasets with the train_test_split function. Here, we divided it into 70% training dataset, 30% testing dataset.
Step 2:
Build the linear regression model using a linear regression function with appropriate parameters for the training dataset.
Step 3:
Forecast the consumption values for the testing dataset.
Step 4:
Plot the actual and forecasted values of the testing dataset.
Step 5:
Calculate MSE, MAE, and RMSE.

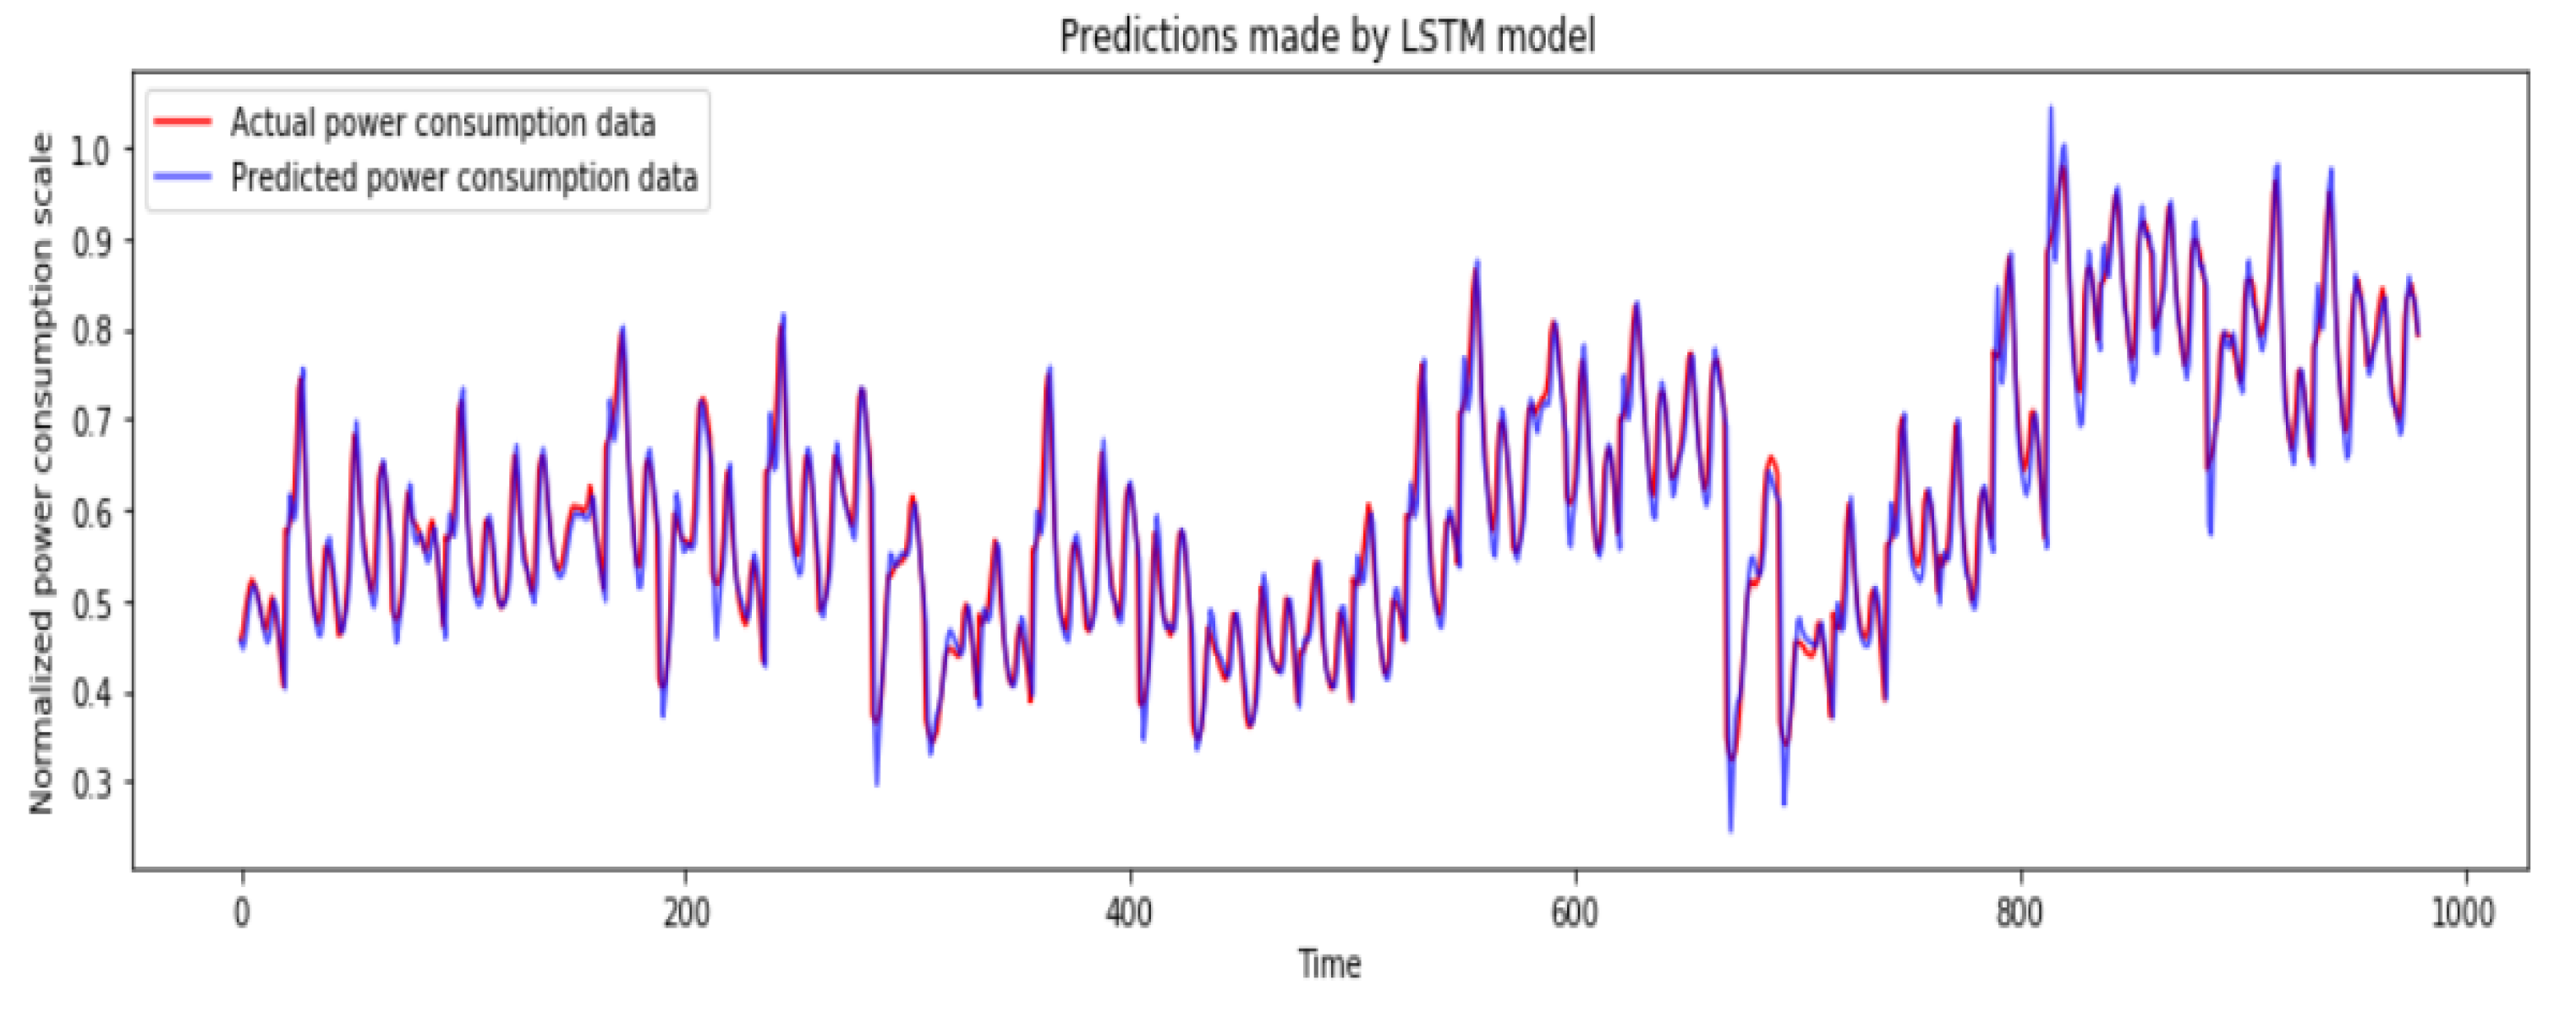
3.4. Long Short Term Memory Model

The LSTM is a sort of RNN that is capable of remembering information for a significantly long period of time. In contrast to basic neural networks, where each node is characterized by a single activation function, each node in LSTM is employed as a memory cell that may store other information. LSTMs, in particular, have their own cell state, an input gate, an output gate and a forget gate. The cell remembers values over arbitrary time intervals, and the three gates regulate the flow of information into and out of the cell. These characteristic allow LSTMs address the problem of disappearing gradients from prior time-steps [23,24,25]. In our application, there are three LSTM layers, each with 40 units, a tanh activation function, and a drop out value of 0.15. The input sequence length is defined as 20.
Step 1:
Create testing and training datasets with the train _test_split function. Here, we divided it into 70% training dataset, 30% testing dataset.
Step 2:
Build the linear regression model using long short term memory model with predefined parameters for the training dataset.
Step 3:
Forecast the consumption values for the testing dataset.
Step 4:
Plot the actual and forecasted values of the testing dataset.
Step 5:
Calculate MSE, MAE, and RMSE.

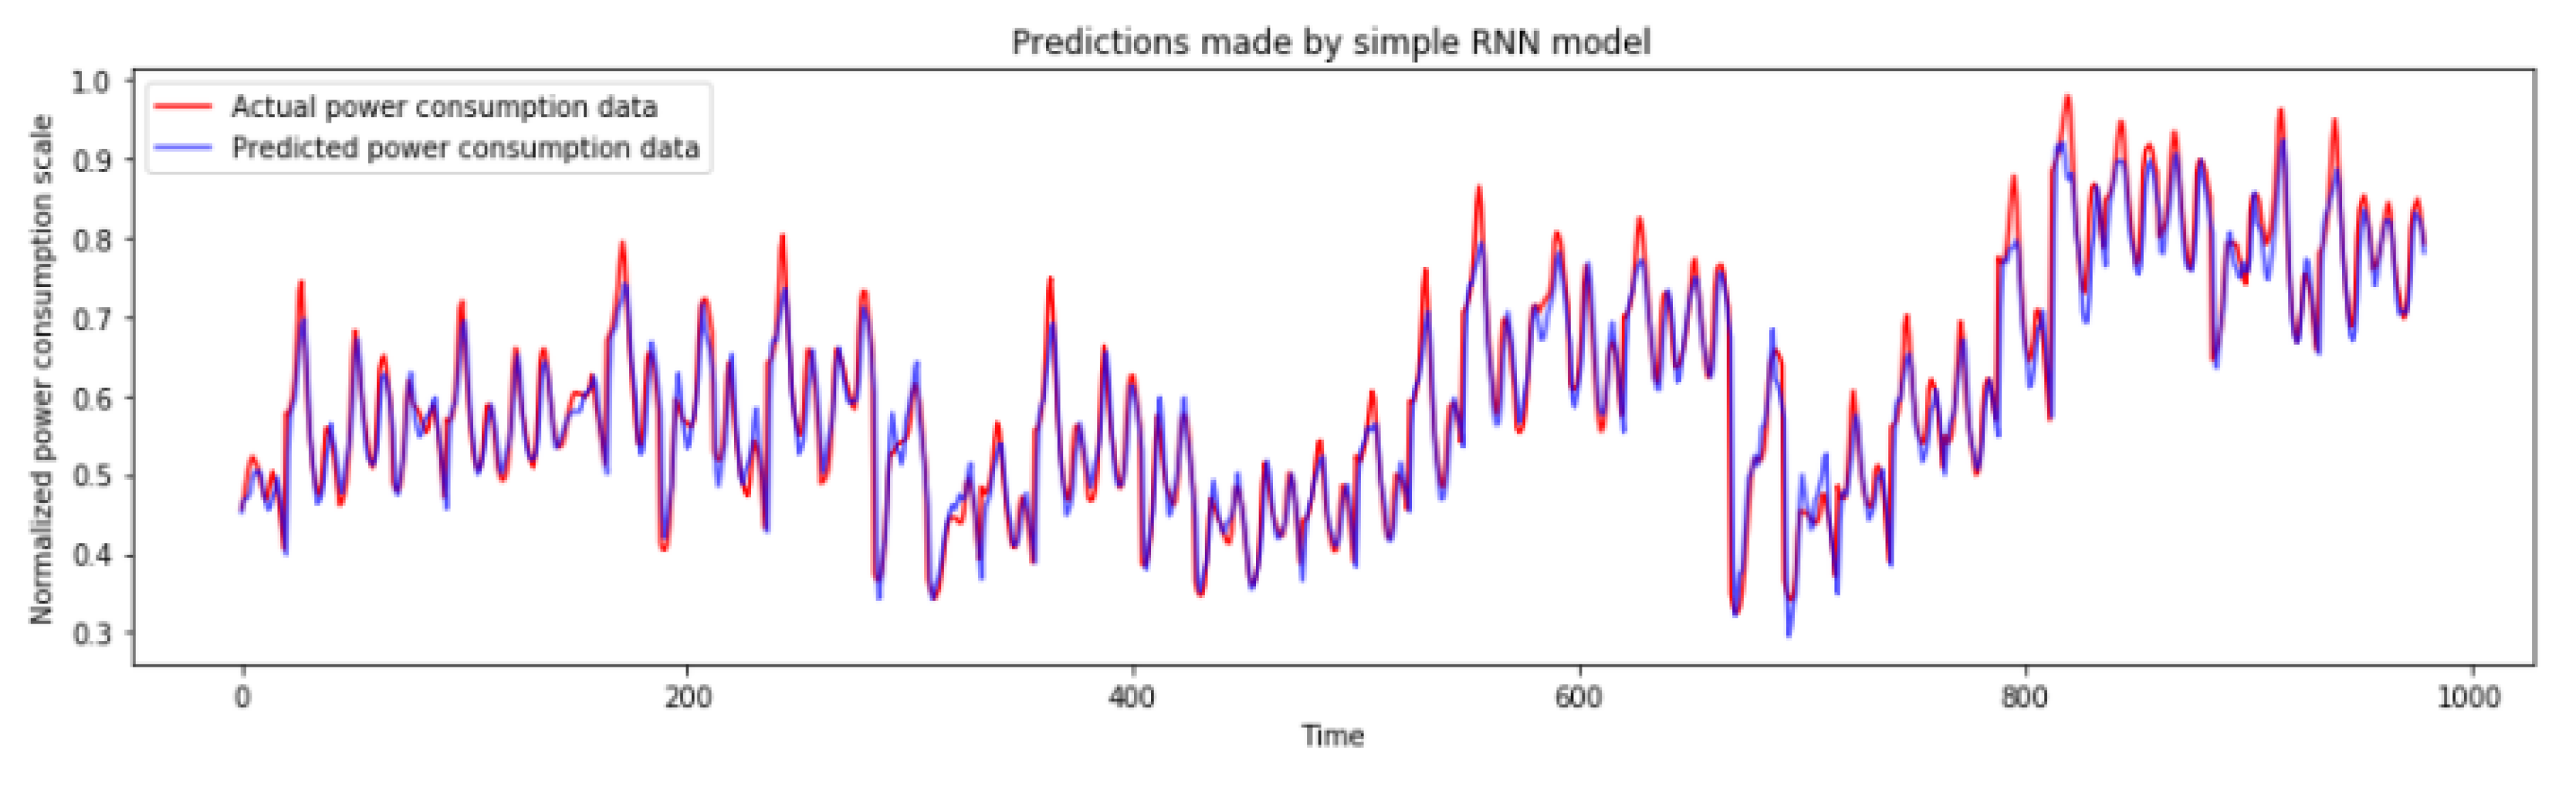
3.5. Recurrent Neural Networks Model

RNNs are networks that contain loops, which allow information to endure. They are utilized to model data that changes over time [30]. The data is fed into the network one by one, and the network’s nodes save their current state at one time step and utilize it to influence the following time step. RNNs exploit the temporal information in the input data, and for this reason, are more suited to manage time series data. The ability of a RNN stands in using recurrent connections between neurons and can generally be described by the following equation [31]:
x t = { 0 , if ( t = 0 ) ϕ ( x t 1 , a t ) , otherwise

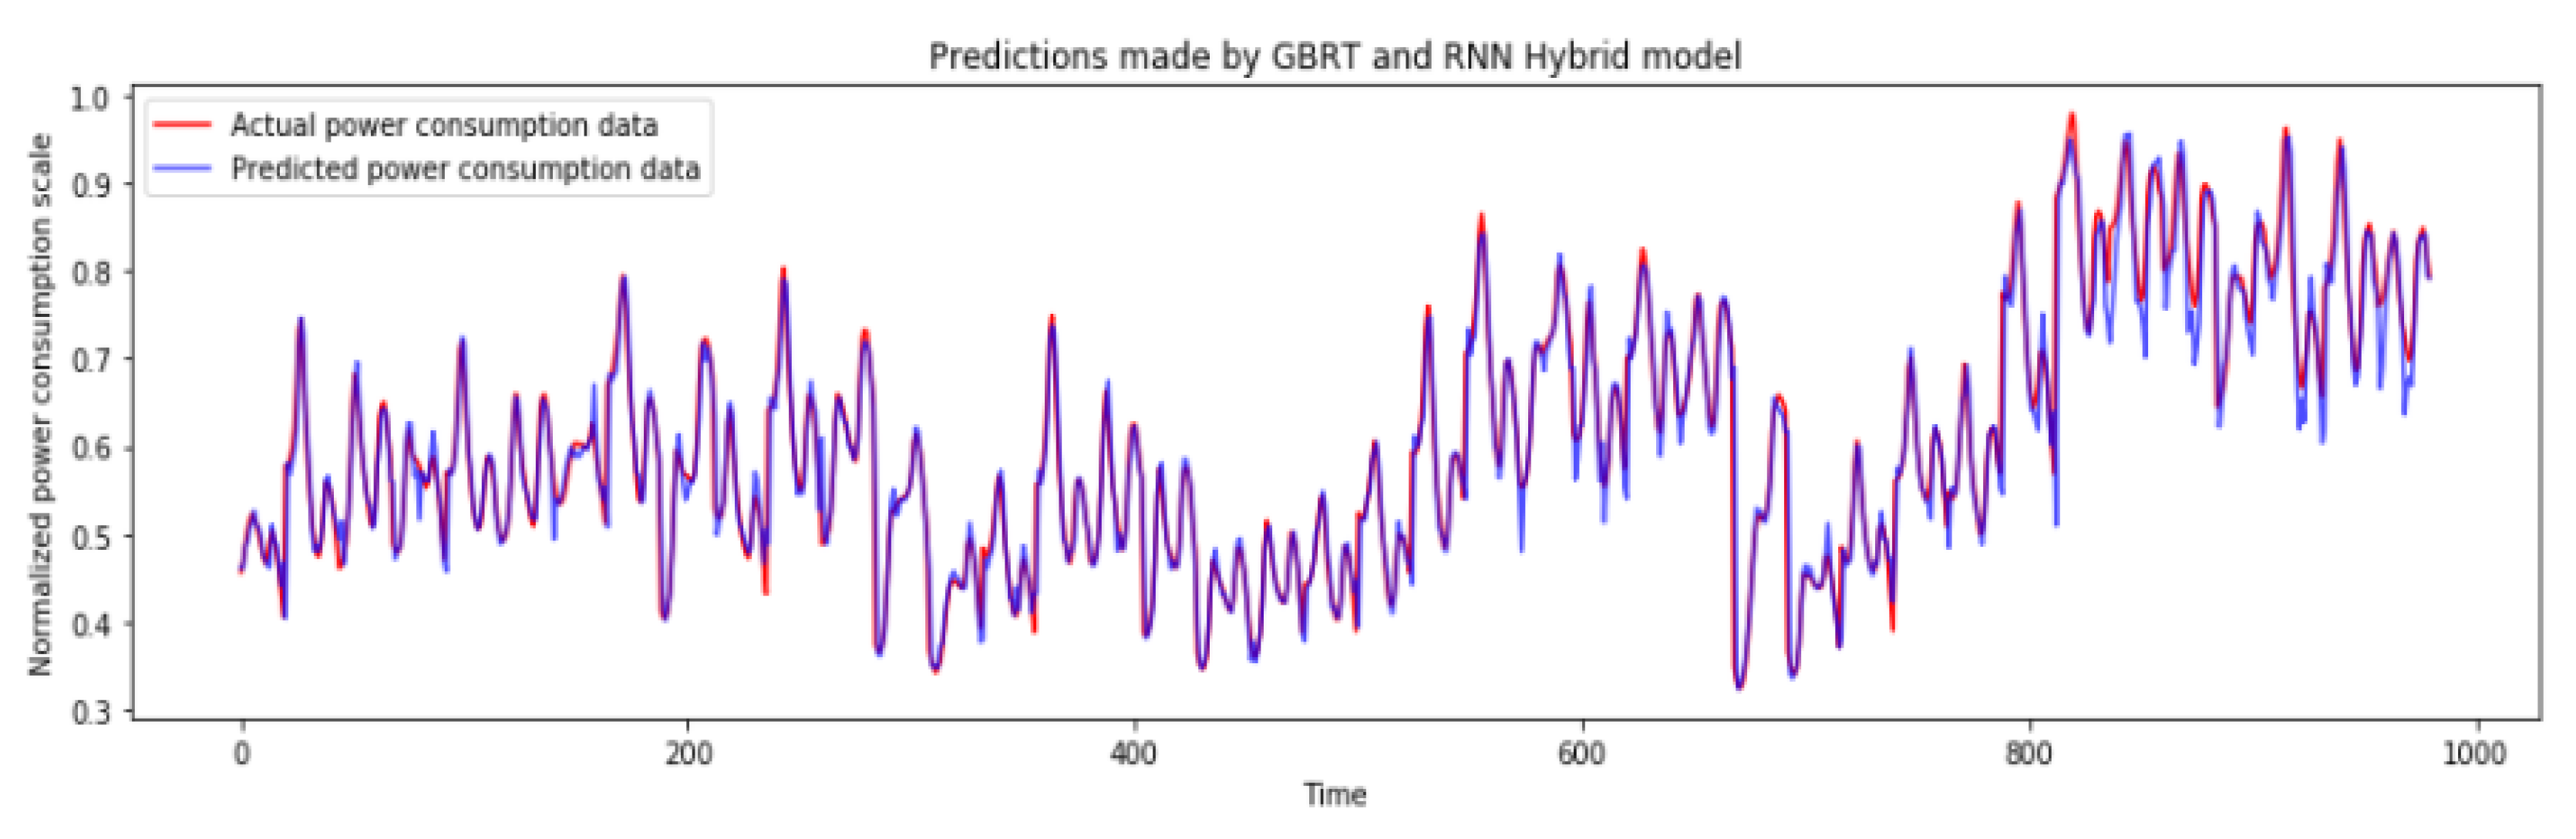
3.6. Proposed RNN-GBRT Hybrid Model

An RNN’s goal is to forecast the next step in a sequence of observations in relation to the previous phases in the series [31]. In order to predict future trends, RNN makes use of consecutive observations and learns from previous phases. Data must be remembered throughout the early phases while estimating the following moves. The hidden layers in RNN serve as internal storage for the information obtained during the previous phases of the sequential data processing.
The GBRT algorithm, which is a mix of the CART (classification and regression trees) and GB (gradient boosting) algorithms, is also considered [31]. It is noted that the CART outperforms most artificial intelligence models in terms of prediction, since it can simulate nonlinear interactions without having previous knowledge of the probability distribution of variables. Inspired by the contribution of [30,31] we propose the hybrid model RNN-GBRT in order to exploit the advantages of the two methods and obtain better forecasting performances. In GBRT, the current iteration’s model reduces the previous iteration’s residuals. At each iteration, it builds a new regression tree to reduce residuals with the gradient descent of the objective function. In the proposed hybrid model, RNN-GBRT, the generated series after RNN forms the training examples for GBRT. Generally, the performance of GBRT depends on learning rate and the total number of regression trees. In this paper, the value of the learning rate is set from 0.1 to 0.3, and the total number of regression trees is set from 20 to 150.

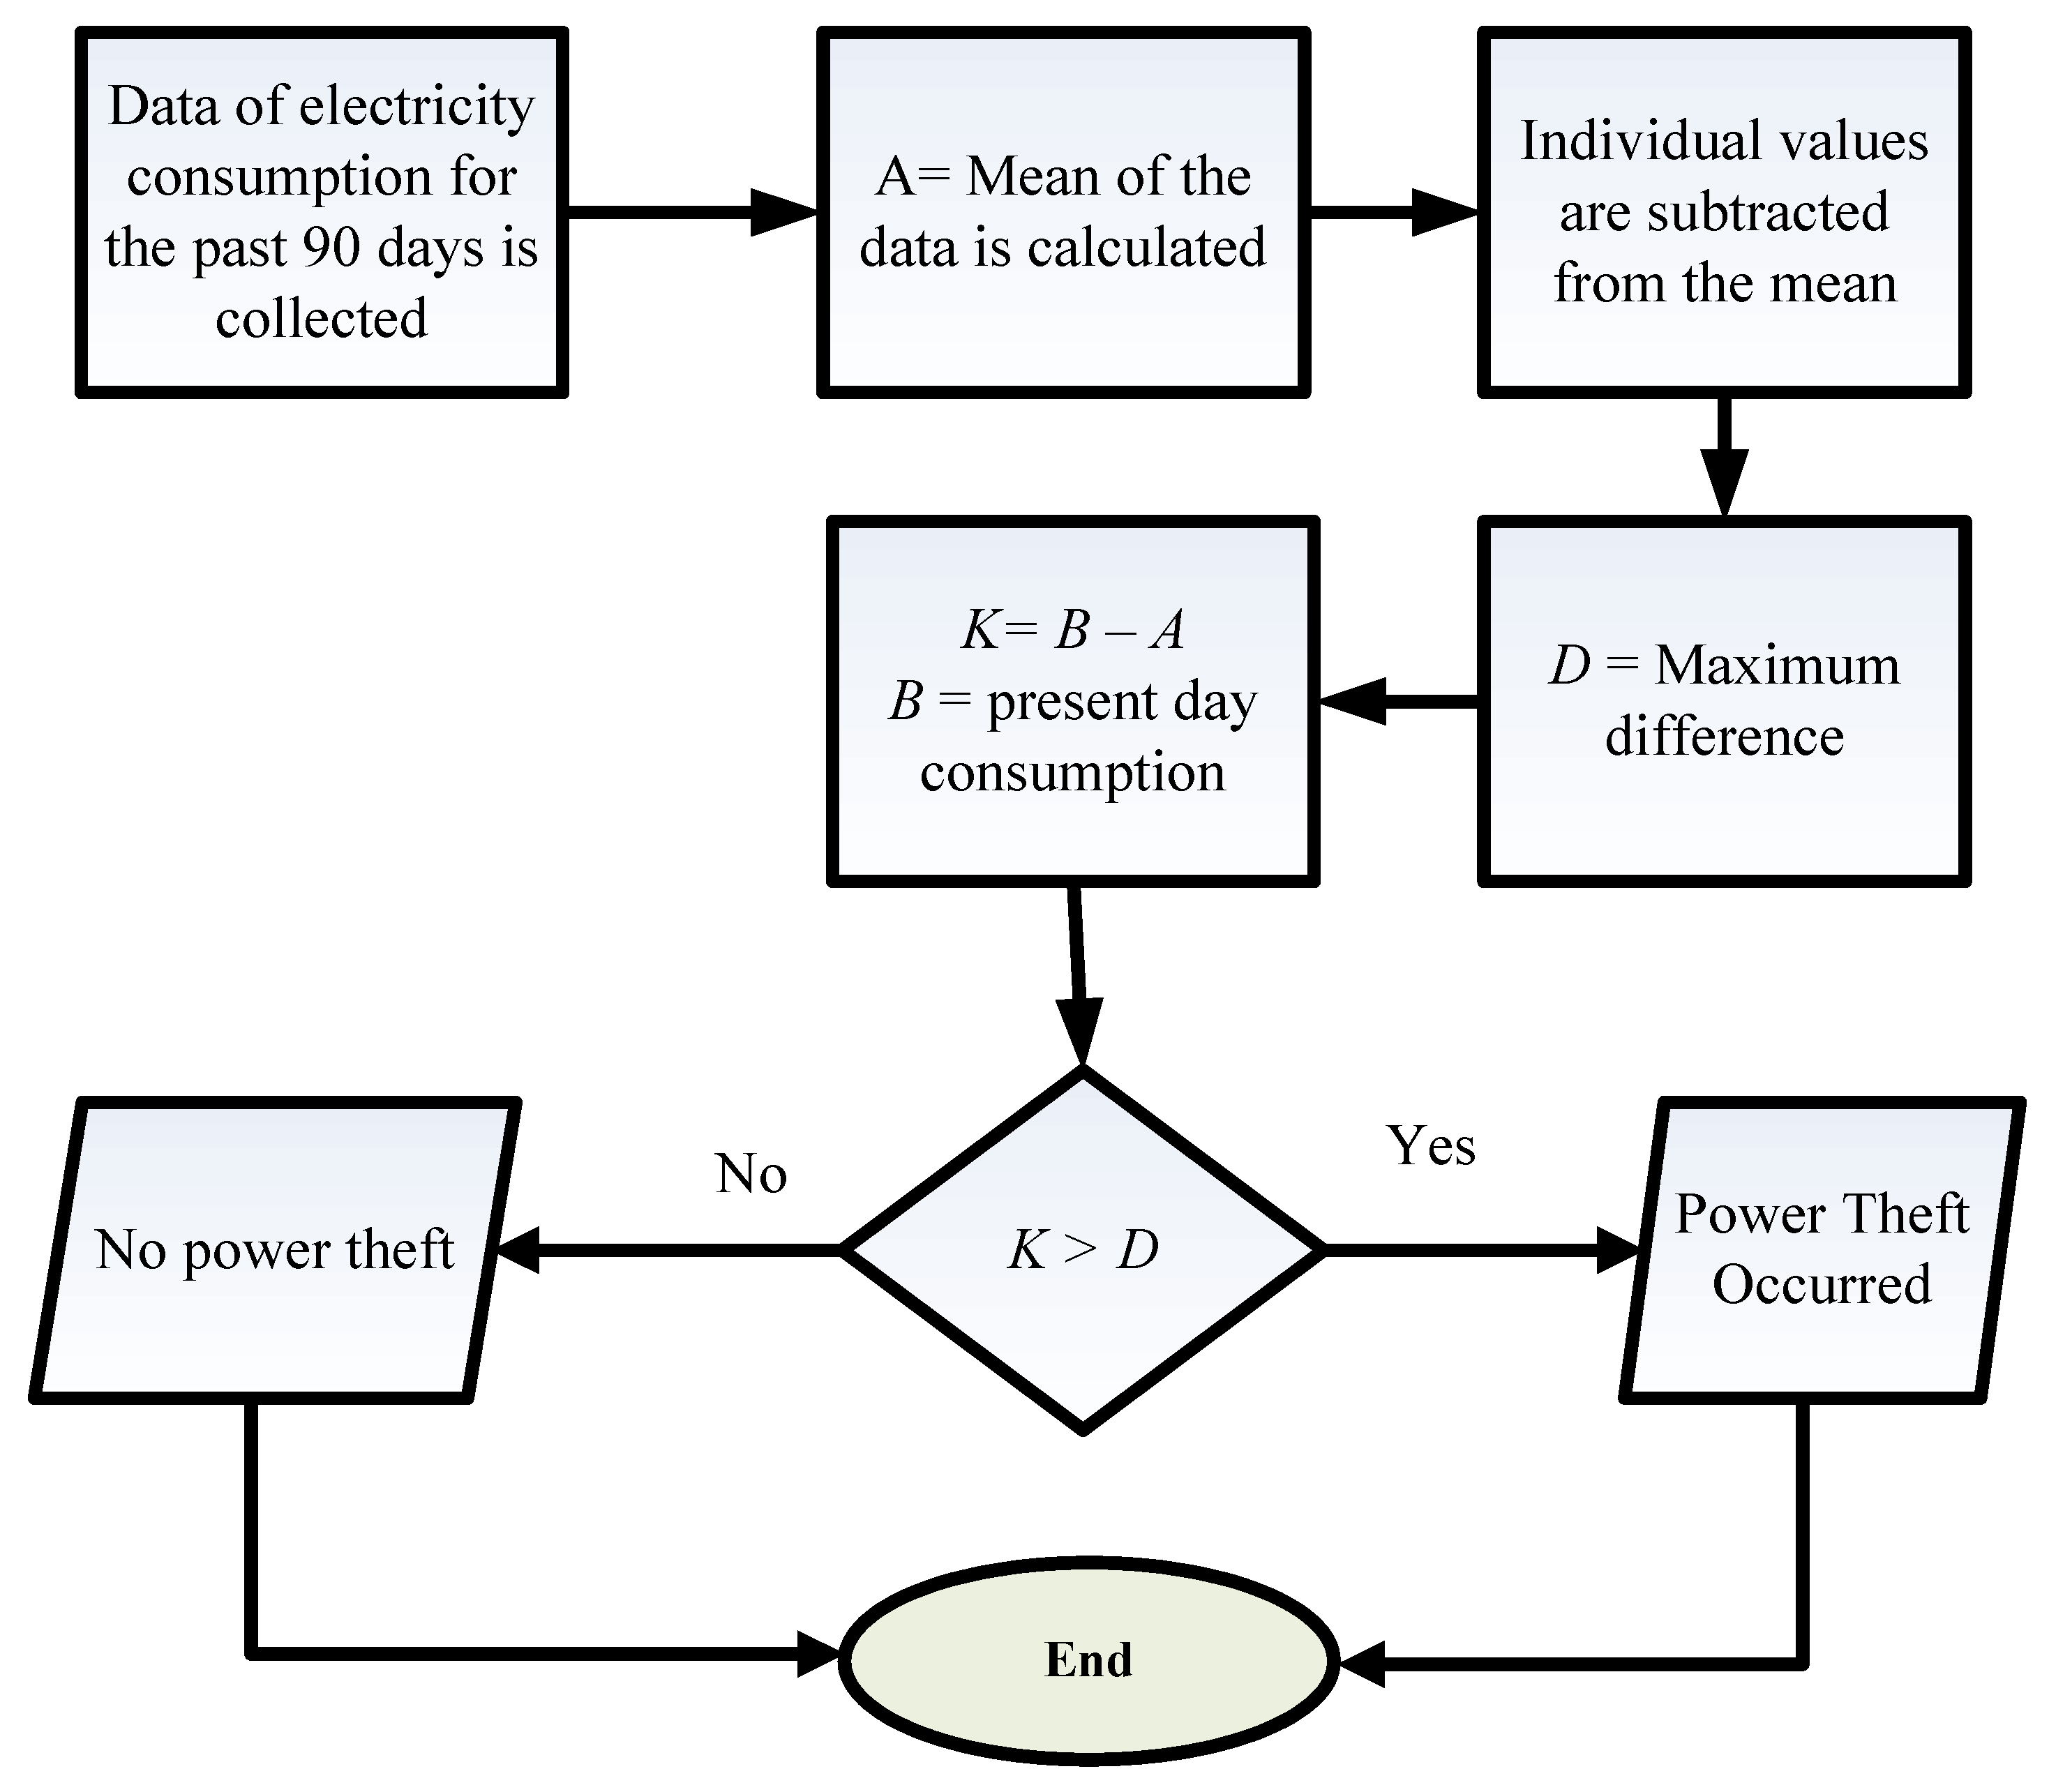
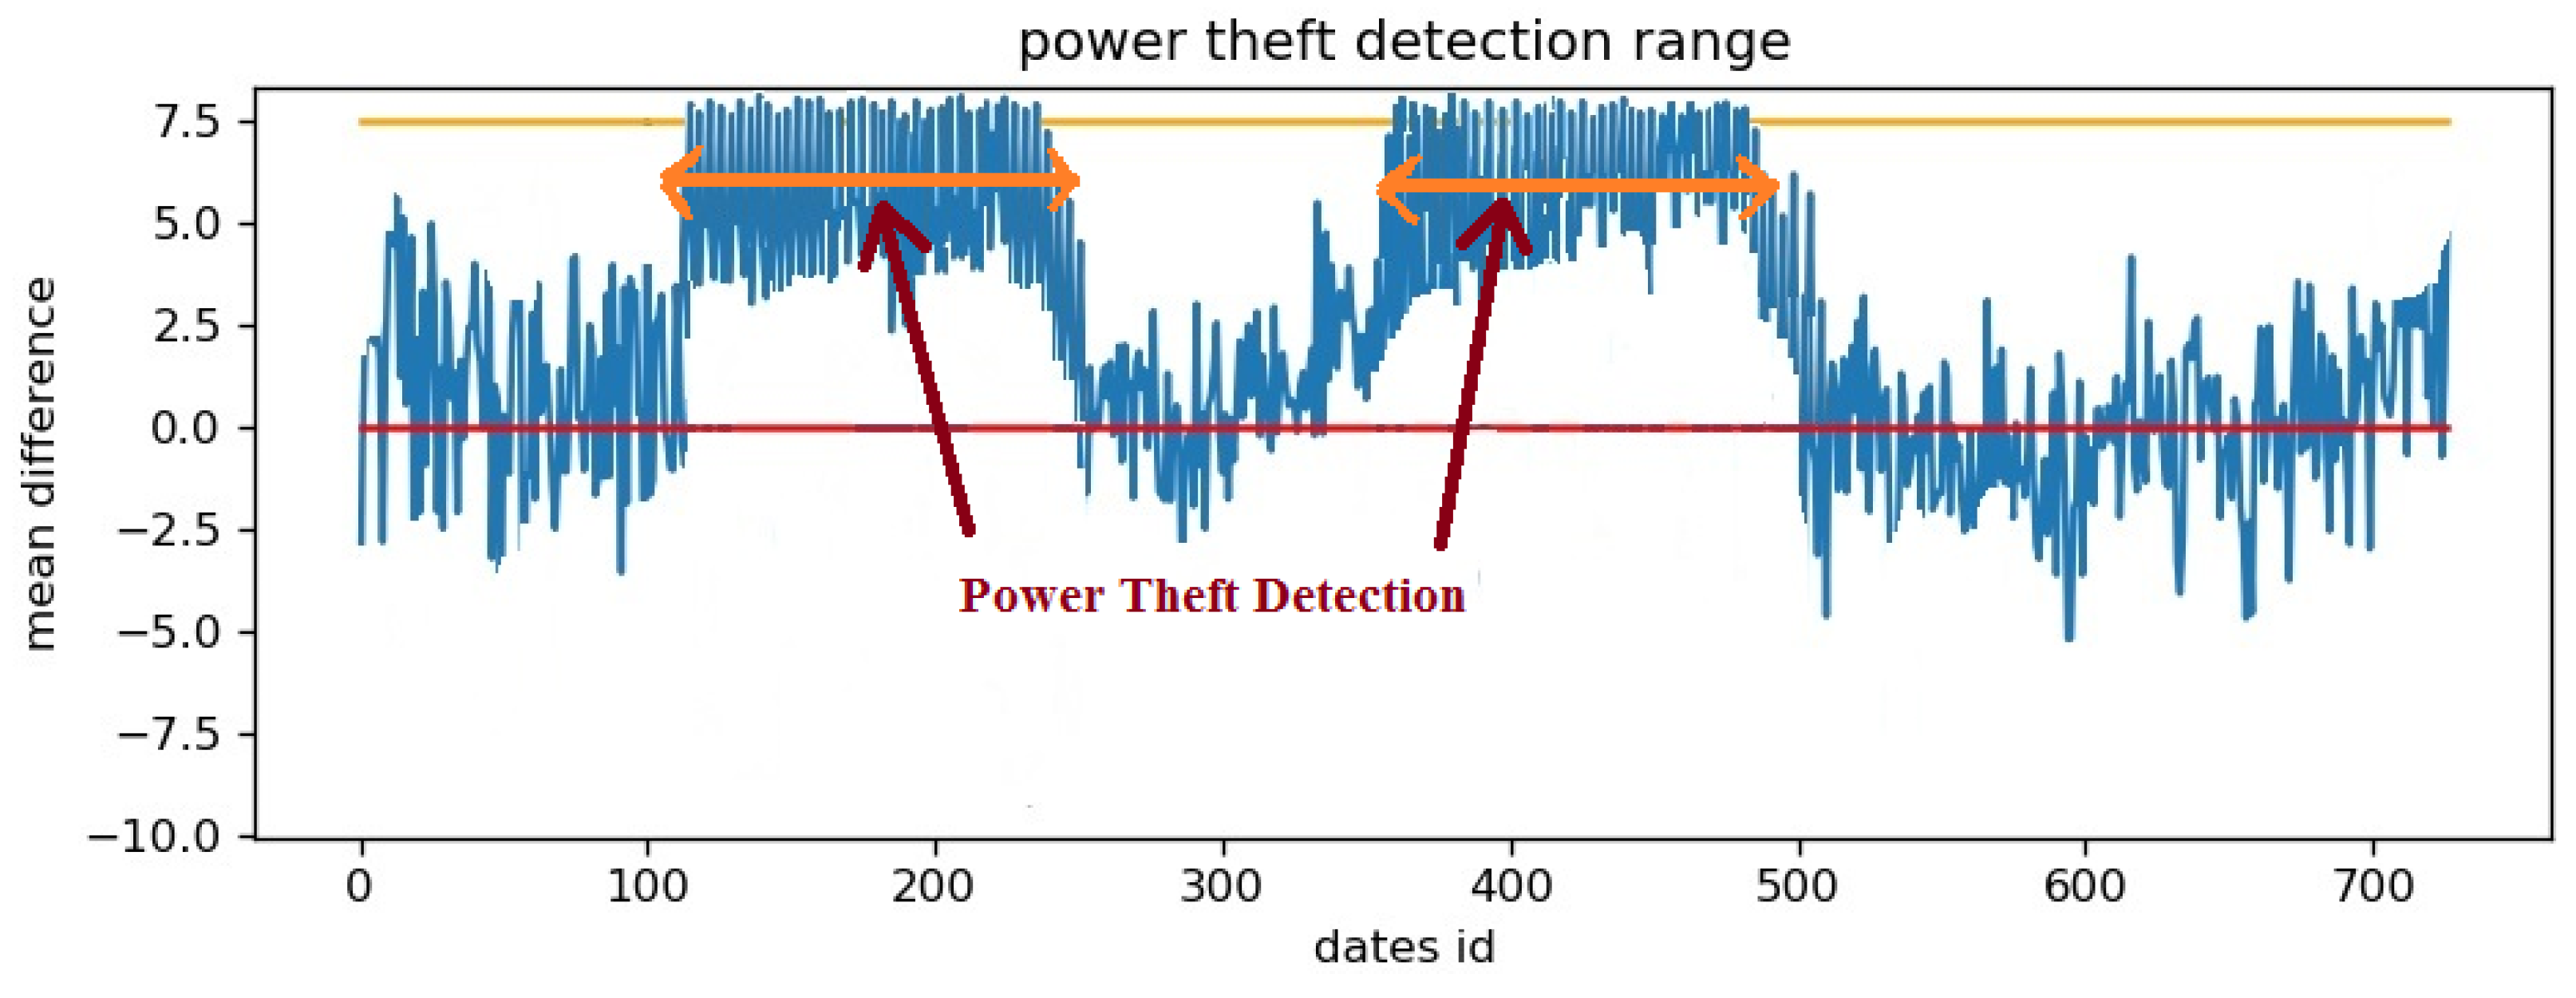
3.7. Power Theft Detection Algorithm

Energy is the fundamental resource to make possible every application in domestic, commercial, and industrial environments. The electric grid refers to the combination of transformers, transmission lines, substations, and other components that make energy delivery possible, from the source layout to the field of work in each sector. The complexity of energy generation and distribution systems leads to the necessity of managing and solving several possible issues and challenges. In this context, one of the most significant issues to be addressed is power theft. Particularly in India, power theft is a serious issue that the country has dealt with for many years. No effective solutions have yet been found. A recent survey by the Central Electricity Authority suggests that over 27 percent of the total produced energy from various sources is lost due to the illegal practice of power felony [36]. Consequently, this affects over 5 percent of the country’s GDP (gross domestic product). To address the issue, a new scheme is proposed in this paper for analyzing consumer energy and thereby detecting the source of theft, according to the procedure shown in Figure 5. To detect the source of power theft, the developed system is trained with recent data of energy consumption of the past 90 days from the available dataset. The system starts evaluating the mean of the collected data. The statistical mean of the given data is the sum of all the energy consumption values divided by its frequency, which is 90 in our case. The calculated mean ‘A’ is then stored in the memory manager of the proposed system. Afterwards, the system starts estimating the standard deviation of the data fed.
Standard deviation is defined as the individual differences of the data values with its mean. The purpose of standard deviation in our system is to define the degree of deviation between the adjacent data points. All the odd values of standard deviation are recorded. Among the recorded values of standard deviation, the values of maximum and minimum deviation are considered ‘d’ and ‘D’, respectively. Now, for testing the developed system, we consider the current day energy expenditure. In particular, the current energy expenditure ‘B’ is subtracted with the recorded mean value of the trained data ‘A’. The obtained value is denoted by ‘K’.
The final step of the theft detection scheme compares K and D values. If the K value is greater than the D value, then it can be concluded that power theft is occurring. The intensity of power theft can also be determined from the magnitude of calculated difference ‘D’.

4. Implementation of Energy Forecasting and Power Theft Detection Models

Let us recall that the available dataset from Sceaux, Paris (France), is randomly classified into train and test datasets. The train dataset consists of 70% of total data, and the test dataset consists of the remaining 30% of total 727 values. The daily energy consumption values were forecasted by fitting ARIMA parameters (7,1,6). The household energy demand forecasting results, obtained by applying the ARIMA, linear regression, SVR, LSTM, and RNN models, are, respectively, presented in Figure 6, Figure 7, Figure 8, Figure 9 and Figure 10.
For better prediction performances, the authors propose the hybrid RNN-GBRT model, as described in Section 3.6. From the simulation results, it is evident that the RNN-GBRT model shows better prediction performance than other conventional methods, as presented in Figure 11.

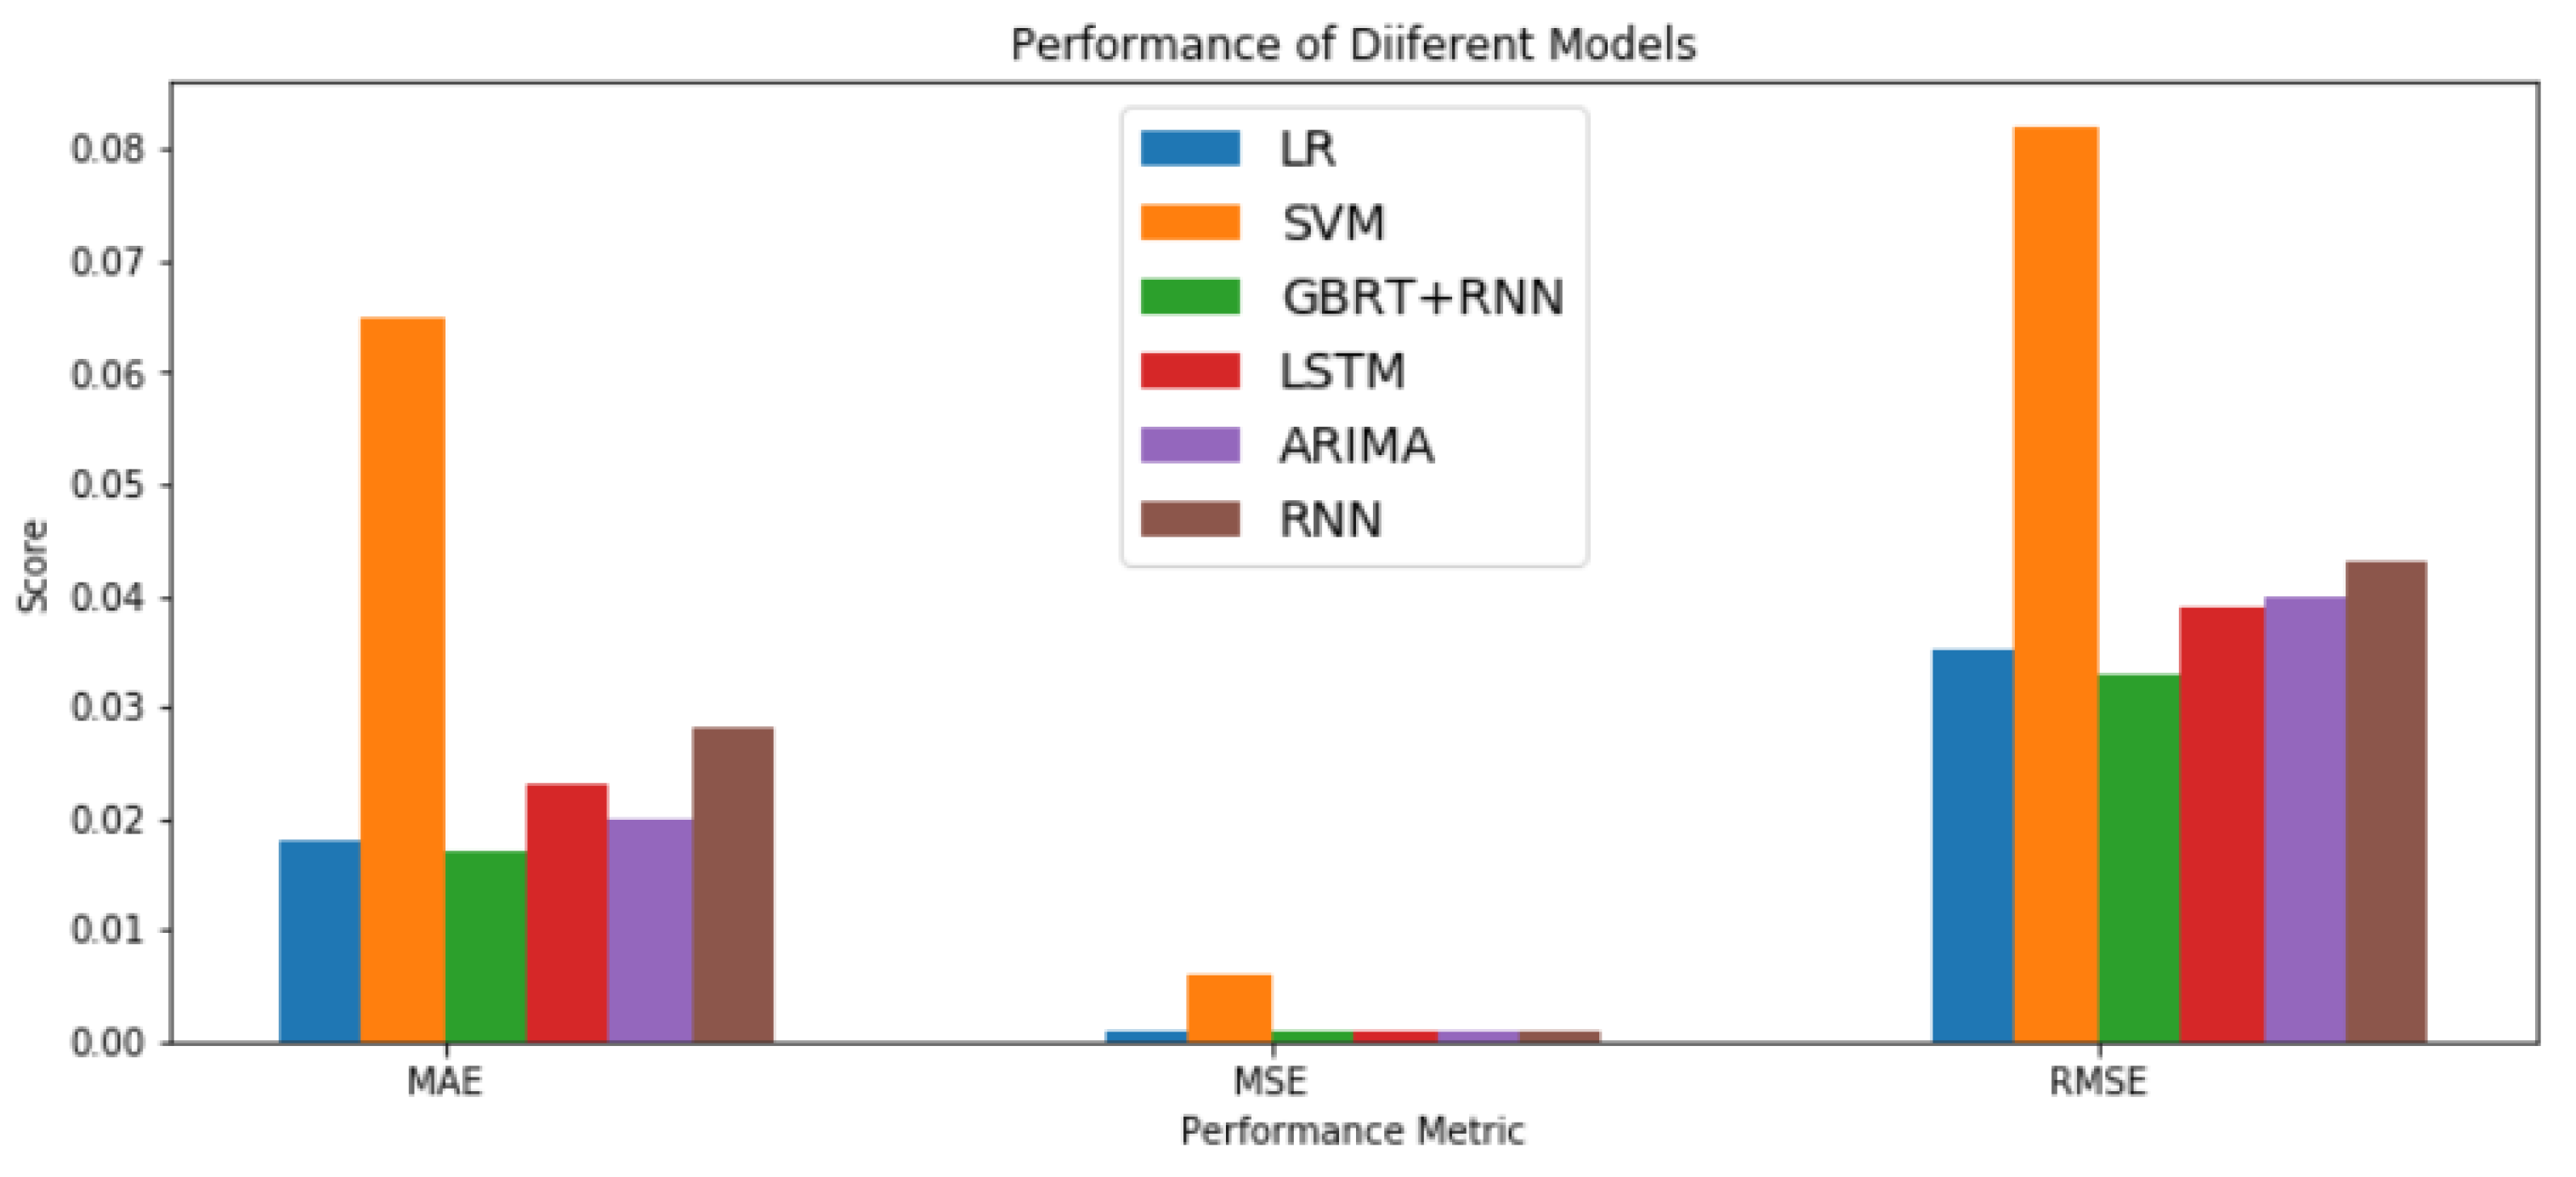
4.1. Comparative Analysis Based on Error Indices Calculations

In order to compare the prediction accuracy of the analyzed forecasting models, error indices can be used. With this aim, in this paper, three error indices are used to compare the efficiency of the analyzed prediction models. The first error index is the MSE [30], which is the mean squared difference between the estimated value and original value of the prediction technique. The second index is the MAE [31], which is the difference between the most similar observations of the model. Finally, the RMSE index [31] is calculated as the standard deviation of the residuals, representing the dispersion of residuals in the series. The comparison of the error values is presented in Figure 12. As is evident, the proposed RNN-GBRT performs better than other forecasting methods.

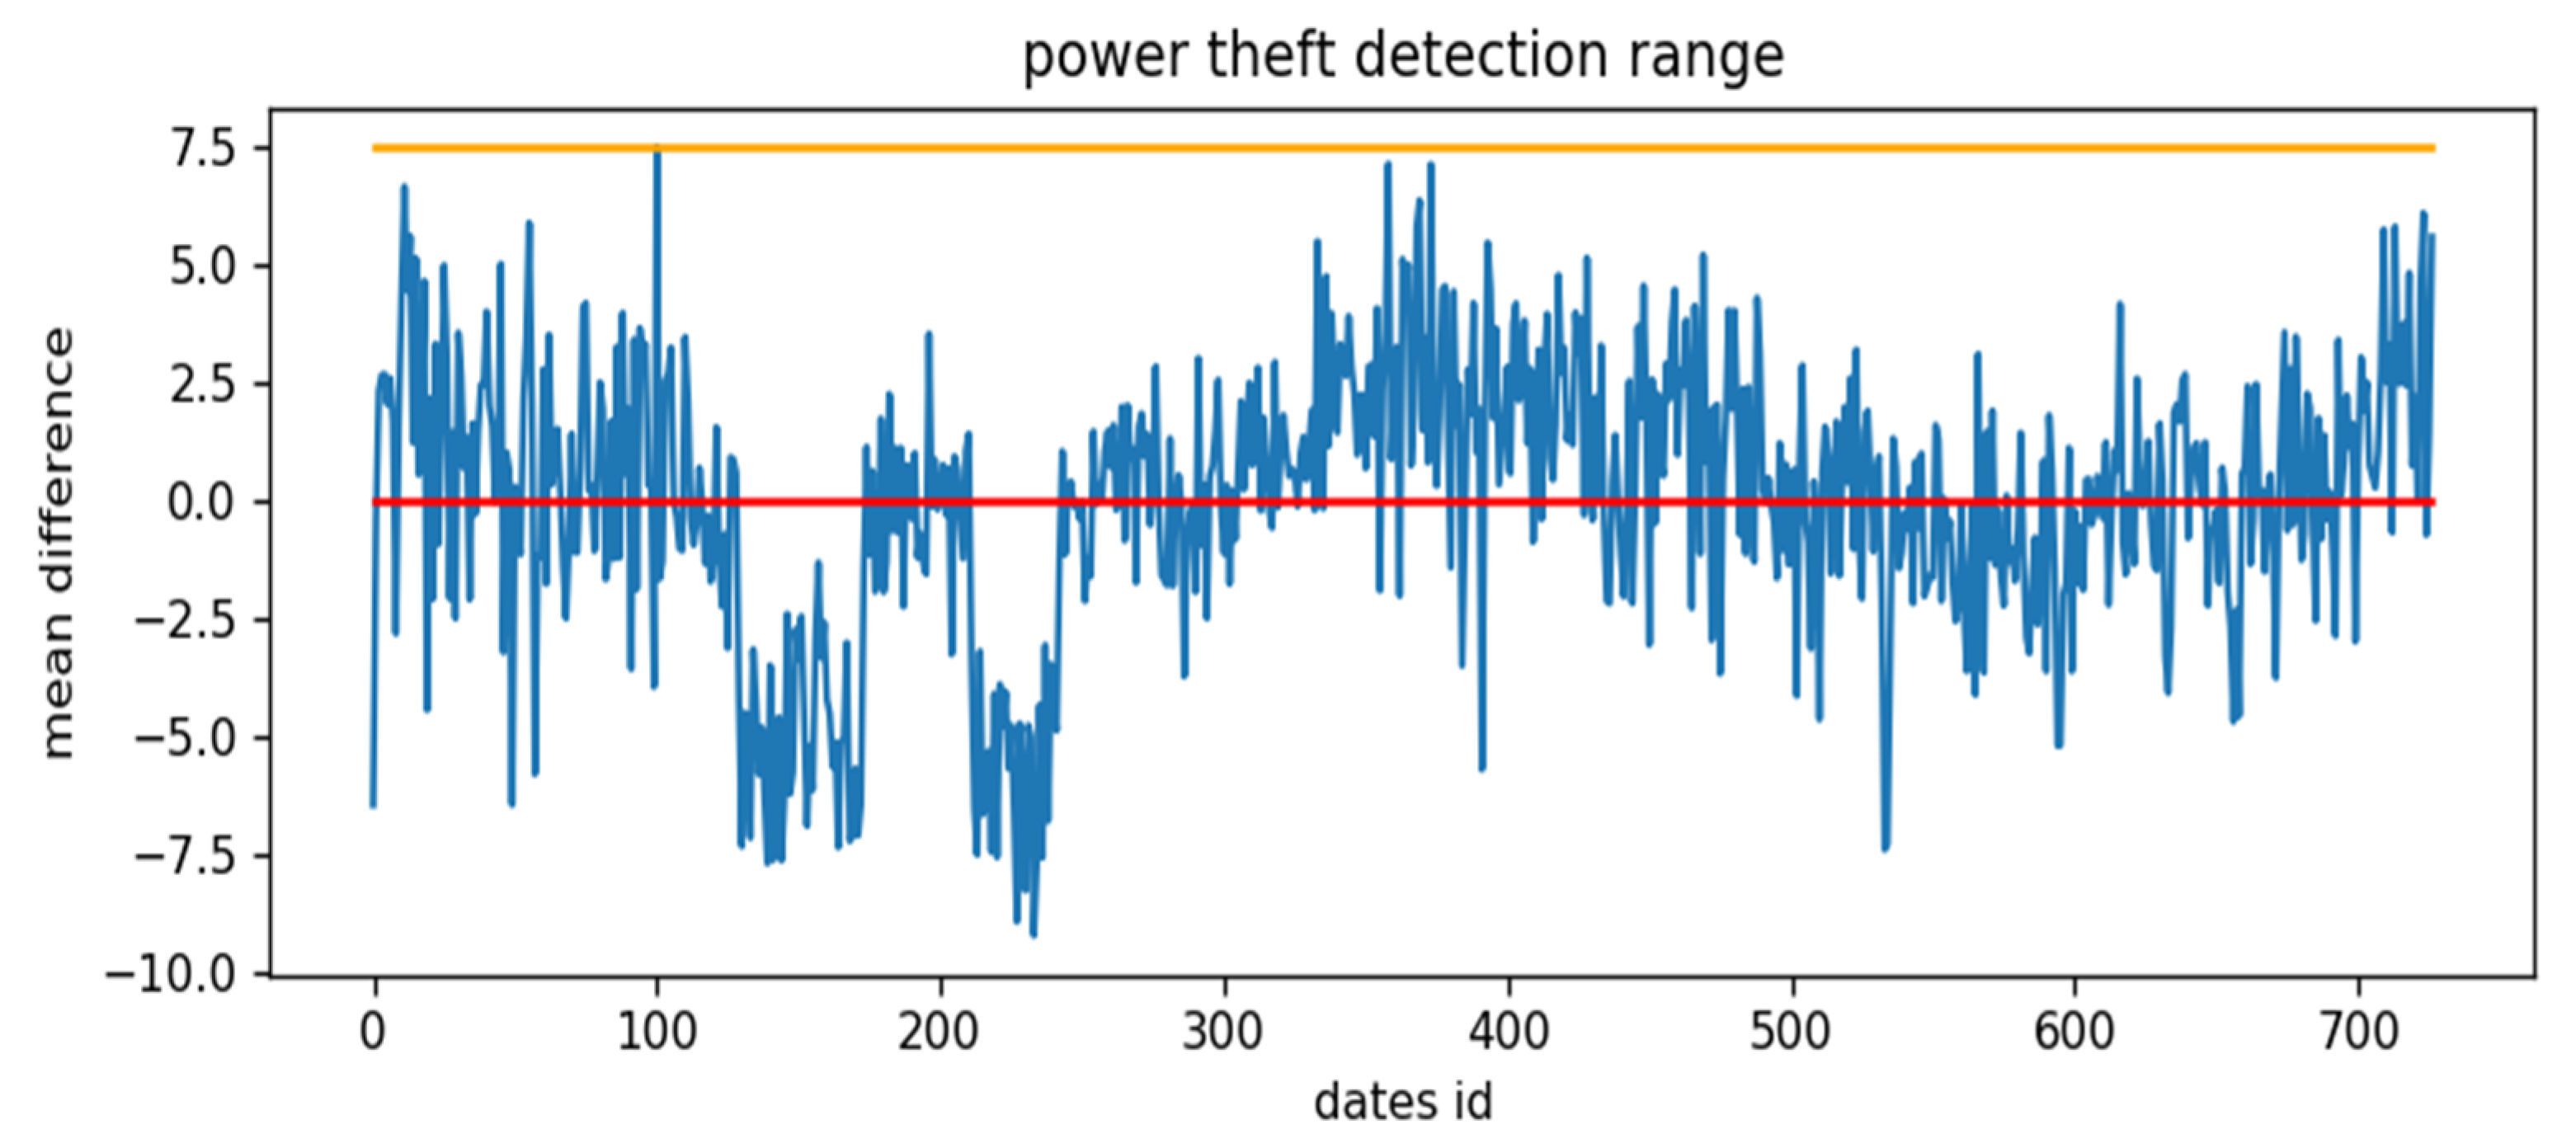
4.2. Power Theft Detection Results Analysis

The proposed scheme to detect the illegal practice of power theft is simulated in this section in order to show its effectiveness.
The range of theft detection is shown in Figure 13, where hourly data samples are evaluated, and no power theft occurs. The figure shows the threshold limit to detect power theft as 7.5 kW mean difference, as proposed in [34,35]. If the power consumption crosses the mentioned threshold, then users will receive a message regarding power theft that is occurring in their connection line. The utilization of a conventional distribution network and energy meters in the city of Vellore in India leads to the possibility of power theft events. Therefore, in order to provide the power theft case, the authors refer to a 727 day data set from Vellore city. In particular, Figure 14 shows the case of power theft detection where two power theft periods are highlighted.

5. Conclusions

The exhaustible and inexhaustible sources of energy influence the economic growth of a country. The energy demand is a determinant of various functions, such as individual income, market structure, economic structure, lifestyle of individuals, and population change. The world may experience numerous challenges if there is uncertainty in energy supply in the near and far future. To determine the economic stability of a country, sustainable management of energy is needed. Therefore, the prediction of energy demand is of utmost importance for the uniform allocation of available resources relating to industrial production, healthcare, agriculture, population, accessibility of water, education, and quality of life. By forecasting the demand, we can accommodate the power generated using the available storage facilities. Incorporating this feature in the power grid will help in maintaining a balance between all the power sources. Therefore, this paper has proposed the hybrid RNN-GBRT model for forecasting the load demand, validating its efficiency. In particular, the comparative analysis among all the considered forecasting models is presented based on three error indices to evaluate the performance of the proposed hybrid model for energy forecasting.
Another important issue addressed in this paper is the power theft that can affect the quality of the energy distribution service and cause economic losses. In most of the sectors of energy distribution, a medium to excessive rate of larceny and medium to low rate of detection exist despite numerous technologies. The intensity of theft differs among several parts of the country. However, the detection and punishment of illegal consumers are extremely challenging tasks. Tracing power theft at the root can prove invaluable to the government’s power sector. The proposed algorithm for individual household consumption tracking will be extremely helpful in notifying anomalies both to the user, who is paying the extra amount in his/her power bill, and to the government, which is losing power and money.
Future works will propose techniques to address the problem of forecasting the energy demand in a network of householders in a smart district context, managing different users and detecting possible power theft or grid malfunctioning within the district.

Author Contributions

Conceptualization, methodology, formal analysis, and writing—original draft preparation, S.K.D., R.R.K., M.R.; writing—review and editing, S.K.D. and M.R.; visualization, M.P.F.; supervision, M.R., M.P.F. and A.M.M. All authors have read and agreed to the published version of the manuscript.

Funding

This research received no external funding.

Institutional Review Board Statement

Not applicable.

Informed Consent Statement

Not applicable.

Data Availability Statement

Not applicable.

Conflicts of Interest

The authors declare no conflict of interest.

References

  1. Sadorsky, P. Renewable energy consumption and income in emerging economies. Energy Policy 2009, 37, 4021–4028. [Google Scholar] [CrossRef]
  2. Zou, C.; Zhao, Q.; Zhang, G.; Xiong, B. Energy revolution: From a fossil energy era to a new energy era. Nat. Gas Ind. B 2016, 3, 1–11. [Google Scholar] [CrossRef] [Green Version]
  3. Wen, Y. The Making of an Economic Superpower-Unlocking China’s Secret of Rapid Industrialization; World Scientific: Singapore, 2015; pp. 1–180. [Google Scholar]
  4. Ghosh, S.; Manna, D.; Chatterjee, A.; Chatterjee, D. Remote Appliance Load Monitoring and Identification in a Modern Residential System With Smart Meter Data. IEEE Sens. J. 2021, 21, 5082–5090. [Google Scholar] [CrossRef]
  5. Chakraborty, S.; Das, S. Application of Smart Meters in High Impedance Fault Detection on Distribution Systems. IEEE Trans. Smart Grid 2019, 10, 3465–3473. [Google Scholar] [CrossRef]
  6. Haben, S.; Singleton, C.; Grindrod, P. Analysis and clustering of residential customers’ energy behavioral demand using smart meter data. IEEE Trans. Smart Grid 2016, 7, 136–144. [Google Scholar] [CrossRef]
  7. Palensky, P.; Dietrich, D. Demand side management: Demand response, intelligent energy systems, and smart loads. IEEE Trans. Ind. Inform. 2011, 7, 381–388. [Google Scholar] [CrossRef] [Green Version]
  8. Tom, R.J.; Sankaranarayanan, S. IoT based SCADA Integrated with Fog for Power Distribution Automation. In Proceedings of the 12th Iberian Conference on Information Systems and Technologies, Lisbon, Portugal, 21–24 June 2017; pp. 1772–1775. [Google Scholar]
  9. Sankar, V.J.; Hareesh, V.; Nair, M.G. Integration of Demand Response with Prioritized Load Optimization for Multiple Homes. In Proceedings of the 2017 International Conference on Technological Advancements in Power and Energy (TAP Energy), Kollam, India, 21–23 December 2017; pp. 1–6. [Google Scholar]
  10. Cerquitelli, T.; Chicco, G.; Di Corso, E.; Ventura, F.; Montesano, G.; Del Pizzo, A.; González, A.M.; Sobrino, E.M. Discovering Electricity Consumption over Time for Residential Consumers through Cluster Analysis. In Proceedings of the International Conference on Development and Application Systems, Suceava, Romania, 24–26 May 2018; pp. 164–169. [Google Scholar]
  11. Wang, C.-K.; Lee, C.-M.; Hong, Y.-R.; Cheng, K. Assessment of Energy Transition Policy in Taiwan—A View of Sustainable Development Perspectives. Energies 2021, 14, 4402. [Google Scholar] [CrossRef]
  12. Vink, K.; Ankyu, E.; Kikuchi, Y. Long-Term Forecasting Potential of Photo-Voltaic Electricity Generation and Demand Using R. Appl. Sci. 2020, 10, 4462. [Google Scholar] [CrossRef]
  13. Suganthi, L.; Samuel, A.A. Energy models for demand forecasting—A review. Renew. Sustain. Energy Rev. 2012, 16, 1223–1240. [Google Scholar] [CrossRef]
  14. Singh, A.K.; Khatoon, S. An Overview of Electricity Demand Forecasting Techniques. In Proceedings of the 2012 Emerging Trends in Electrical, Instrumentation and Communication Engineering Conference, Uttar Pradesh, India, 6–7 April 2012. [Google Scholar]
  15. Cecati, C.; Kolbusz, J.; Różycki, P.; Siano, P.; Wilamowski, B.M. A novel rbf training algorithm for short-term electric load forecasting and comparative studies. IEEE Trans. Ind. Electron. 2015, 62, 6519–6529. [Google Scholar] [CrossRef]
  16. Kong, W.; Dong, Z.Y.; Hill, D.J.; Luo, F.; Xu, Y. Short-term residential load forecasting based on resident behaviour learning. IEEE Trans. Power Syst. 2018, 33, 1087–1088. [Google Scholar] [CrossRef]
  17. Song, K.B.; Baek, Y.S.; Hong, D.H.; Jang, G. Short-term load forecasting for the holidays using fuzzy linear regression method. IEEE Trans. Power Syst. 2005, 20, 96–101. [Google Scholar] [CrossRef]
  18. Ceperic, E.; Ceperic, V.; Baric, A. A Strategy for Short-Term Load Forecasting by Support Vector Regression Machines. IEEE Trans. Power Syst. 2013, 28, 4356–4364. [Google Scholar] [CrossRef]
  19. Amjady, N. Short-term hourly load forecasting using time-series modeling with peak load estimation capability. IEEE Trans. Power Syst. 2001, 16, 498–505. [Google Scholar] [CrossRef]
  20. Mohsenian-Rad, A.H.; Leon-Garcia, A. Optimal residential load control with price prediction in real-time electricity pricing environments. IEEE Trans. Smart Grid 2010, 1, 120–133. [Google Scholar] [CrossRef]
  21. Ugurlu, U.; Oksuz, I.; Tas, O. Electrical price forecasting using recurrent neural networks. Energy 2018, 11, 1255. [Google Scholar]
  22. Taylor, J.W.; McSharry, P.E. Short-term load forecasting methods: An evaluation based on European data. IEEE Trans. Power Syst. 2007, 22, 2213–2219. [Google Scholar] [CrossRef] [Green Version]
  23. Ullah, F.U.M.; Ullah, A.; Haq, I.U.; Rho, S.; Baik, S.W. Short-term prediction of residential power energy consumption via CNN and multi-layer bi-directional LSTM networks. IEEE Access 2020, 8, 123369–123380. [Google Scholar] [CrossRef]
  24. Manowska, A. Using the LSTM Network to Forecast the Demand for Electricity in Poland. Appl. Sci. 2020, 10, 8455. [Google Scholar] [CrossRef]
  25. Son, N.; Yang, S.; Na, J. Deep Neural Network and Long Short-Term Memory for Electric Power Load Forecasting. Appl. Sci. 2020, 10, 6489. [Google Scholar] [CrossRef]
  26. Le Cam, M.; Daoud, A.; Zmeureanu, R. Forecasting electric demand of supply fan using data mining techniques. Energy 2016, 101, 541–557. [Google Scholar] [CrossRef]
  27. Yu, S.-W.; Zhu, K.-J. A hybrid procedure for energy demand forecasting in China. Energy 2012, 37, 396–404. [Google Scholar] [CrossRef]
  28. Cardoso, C.A.V.; Cruz, G.L. Forecasting Natural Gas Consumption using ARIMA Models and Artificial Neural Networks. IEEE Lat. Am. Trans. 2016, 14, 2233–2238. [Google Scholar] [CrossRef]
  29. Bissing, D.; Klein, M.T.; Chinnathambi, R.A.; Selvaraj, D.F.; Ranganathan, P. A Hybrid Regression Model for Day-Ahead Energy Price Forecasting. IEEE Access 2019, 7, 36833–36842. [Google Scholar] [CrossRef]
  30. Jagait, R.K.; Fekri, M.N.; Grolinger, K.; Mir, S. Load Forecasting Under Concept Drift: Online Ensemble Learning With Recurrent Neural Network and ARIMA. IEEE Access 2021, 9, 98992–99008. [Google Scholar] [CrossRef]
  31. Nie, P.; Roccotelli, M.; Fanti, M.P.; Ming, Z.; Li, Z. Prediction of home energy consumption based on gradient boosting regression tree. Energy Rep. 2021, 7, 1246–1255. [Google Scholar] [CrossRef]
  32. Glauner, P.; Boechat, A.; Dolberg, L.; State, R.; Bettinger, F.; Rangoni, Y.; Duarte, D. Large-scale detection of non-technical losses in imbalanced data sets. Presented at the Innovative Smart Grid Technologies Conference (ISGT), 2016 IEEE Power & Energy Society, Minneapolis, MN, USA, 6–9 September 2016; pp. 1–5. [Google Scholar]
  33. Glauner, P.; Meira, J.A.; Valtchev, P.; State, R.; Bettinger, F. The Challenge of Non-Technical Loss Detection Using Artificial Intelligence: A Survey. Int. J. Comput. Intell. Syst. 2017, 10, 760–775. [Google Scholar] [CrossRef] [Green Version]
  34. Depuru, S.S.S.R.; Wang, L.; Devabhaktuni, V. Electricity theft: Overview, issues, prevention and a smart meter based approach to control theft. Energy Policy 2011, 39, 1007–1015. [Google Scholar] [CrossRef]
  35. Richardson, C.; Race, N.; Smith, P. A privacy preserving approach to energy theft detection in smart grids. In Proceedings of the 2016 IEEE International Smart Cities Conference, Trento, Italy, 12 September 2016. [Google Scholar]
  36. Salinas, S.A.; Li, P. Privacy-preserving energy theft detection in microgrids: A state estimation approach. IEEE Trans. Power Syst. 2016, 31, 883–894. [Google Scholar] [CrossRef]
  37. Luan, W.; Wang, G.; Yu, Y.; Lin, J.; Zhang, W.; Liu, Q. Energy theft detection via integrated distribution state estimation based on AMI and SCADA measurements. In Proceedings of the International Conference on Electric Utility Deregulation and Restructuring and Power Technologies, Changsha, China, 26–29 November 2015; pp. 751–756. [Google Scholar]
  38. Su, C.L.; Lee, W.H.; Wen, C.K. Electricity theft detection in low voltage networks with smart meters using state estimation. In Proceedings of the IEEE International Conference on Industrial Technology, Taipei, Taiwan, 14–17 March 2016; pp. 493–498. [Google Scholar]
  39. Huang, S.C.; Lo, Y.L.; Lu, C.N. Non-technical loss detection using state estimation and analysis of variance. IEEE Trans. Power Syst. 2013, 28, 2959–2966. [Google Scholar] [CrossRef]
  40. Maurya, A.; Akyurek, A.S.; Aksanli, B.; Rosing, T.S. Rosing, Time series clustering for data analysis in Smart Grid. In Proceedings of the 2016 IEEE International Conference on Smart Grid Communications, Sydney, Australia, 6–9 November 2016; pp. 606–611. [Google Scholar]
  41. Fanti, M.P.; Mangini, A.M.; Roccotelli, M.; Nolich, M.; Ukovich, W. Modeling Virtual Sensors for Electric Vehicles Charge Services. In Proceedings of the 2018 IEEE International Conference on Systems, Man, and Cybernetics (SMC), Miyazaki, Japan, 7–10 October 2018; pp. 3853–3858. [Google Scholar]
Figure 1. Architecture of the energy demand forecasting system.
Applsci 11 08612 g001
Figure 2. Architectural view of the ARIMA model.
Applsci 11 08612 g002
Figure 3. Architecture of support vector regression.
Applsci 11 08612 g003
Figure 4. Architecture of linear regression.
Applsci 11 08612 g004
Figure 5. Flowchart of power theft detection procedure.
Applsci 11 08612 g005
Figure 6. Forecast result of ARIMA model with respect to test dataset over time (day).
Applsci 11 08612 g006
Figure 7. Forecast result of linear regression with respect to test dataset over time (day).
Applsci 11 08612 g007
Figure 8. Forecast result of support vector model with respect to test dataset over time (day).
Applsci 11 08612 g008
Figure 9. Forecast result of LSTM model with respect to test dataset over time (day).
Applsci 11 08612 g009
Figure 10. Forecast result of simple-RNN with respect to test dataset over time (day).
Applsci 11 08612 g010
Figure 11. Forecast result of GBRT-RNN with respect to test dataset over time (day).
Applsci 11 08612 g011
Figure 12. Comparison of Errors for accuracy analysis.
Applsci 11 08612 g012
Figure 13. The optimal range of power theft (kW), no power theft detected.
Applsci 11 08612 g013
Figure 14. The case of power theft detection.
Applsci 11 08612 g014
Publisher’s Note: MDPI stays neutral with regard to jurisdictional claims in published maps and institutional affiliations.

