
Experimental Study on Simultaneous Desulfurization and Denitrification by DBD Combined with Wet Scrubbing


Abstract
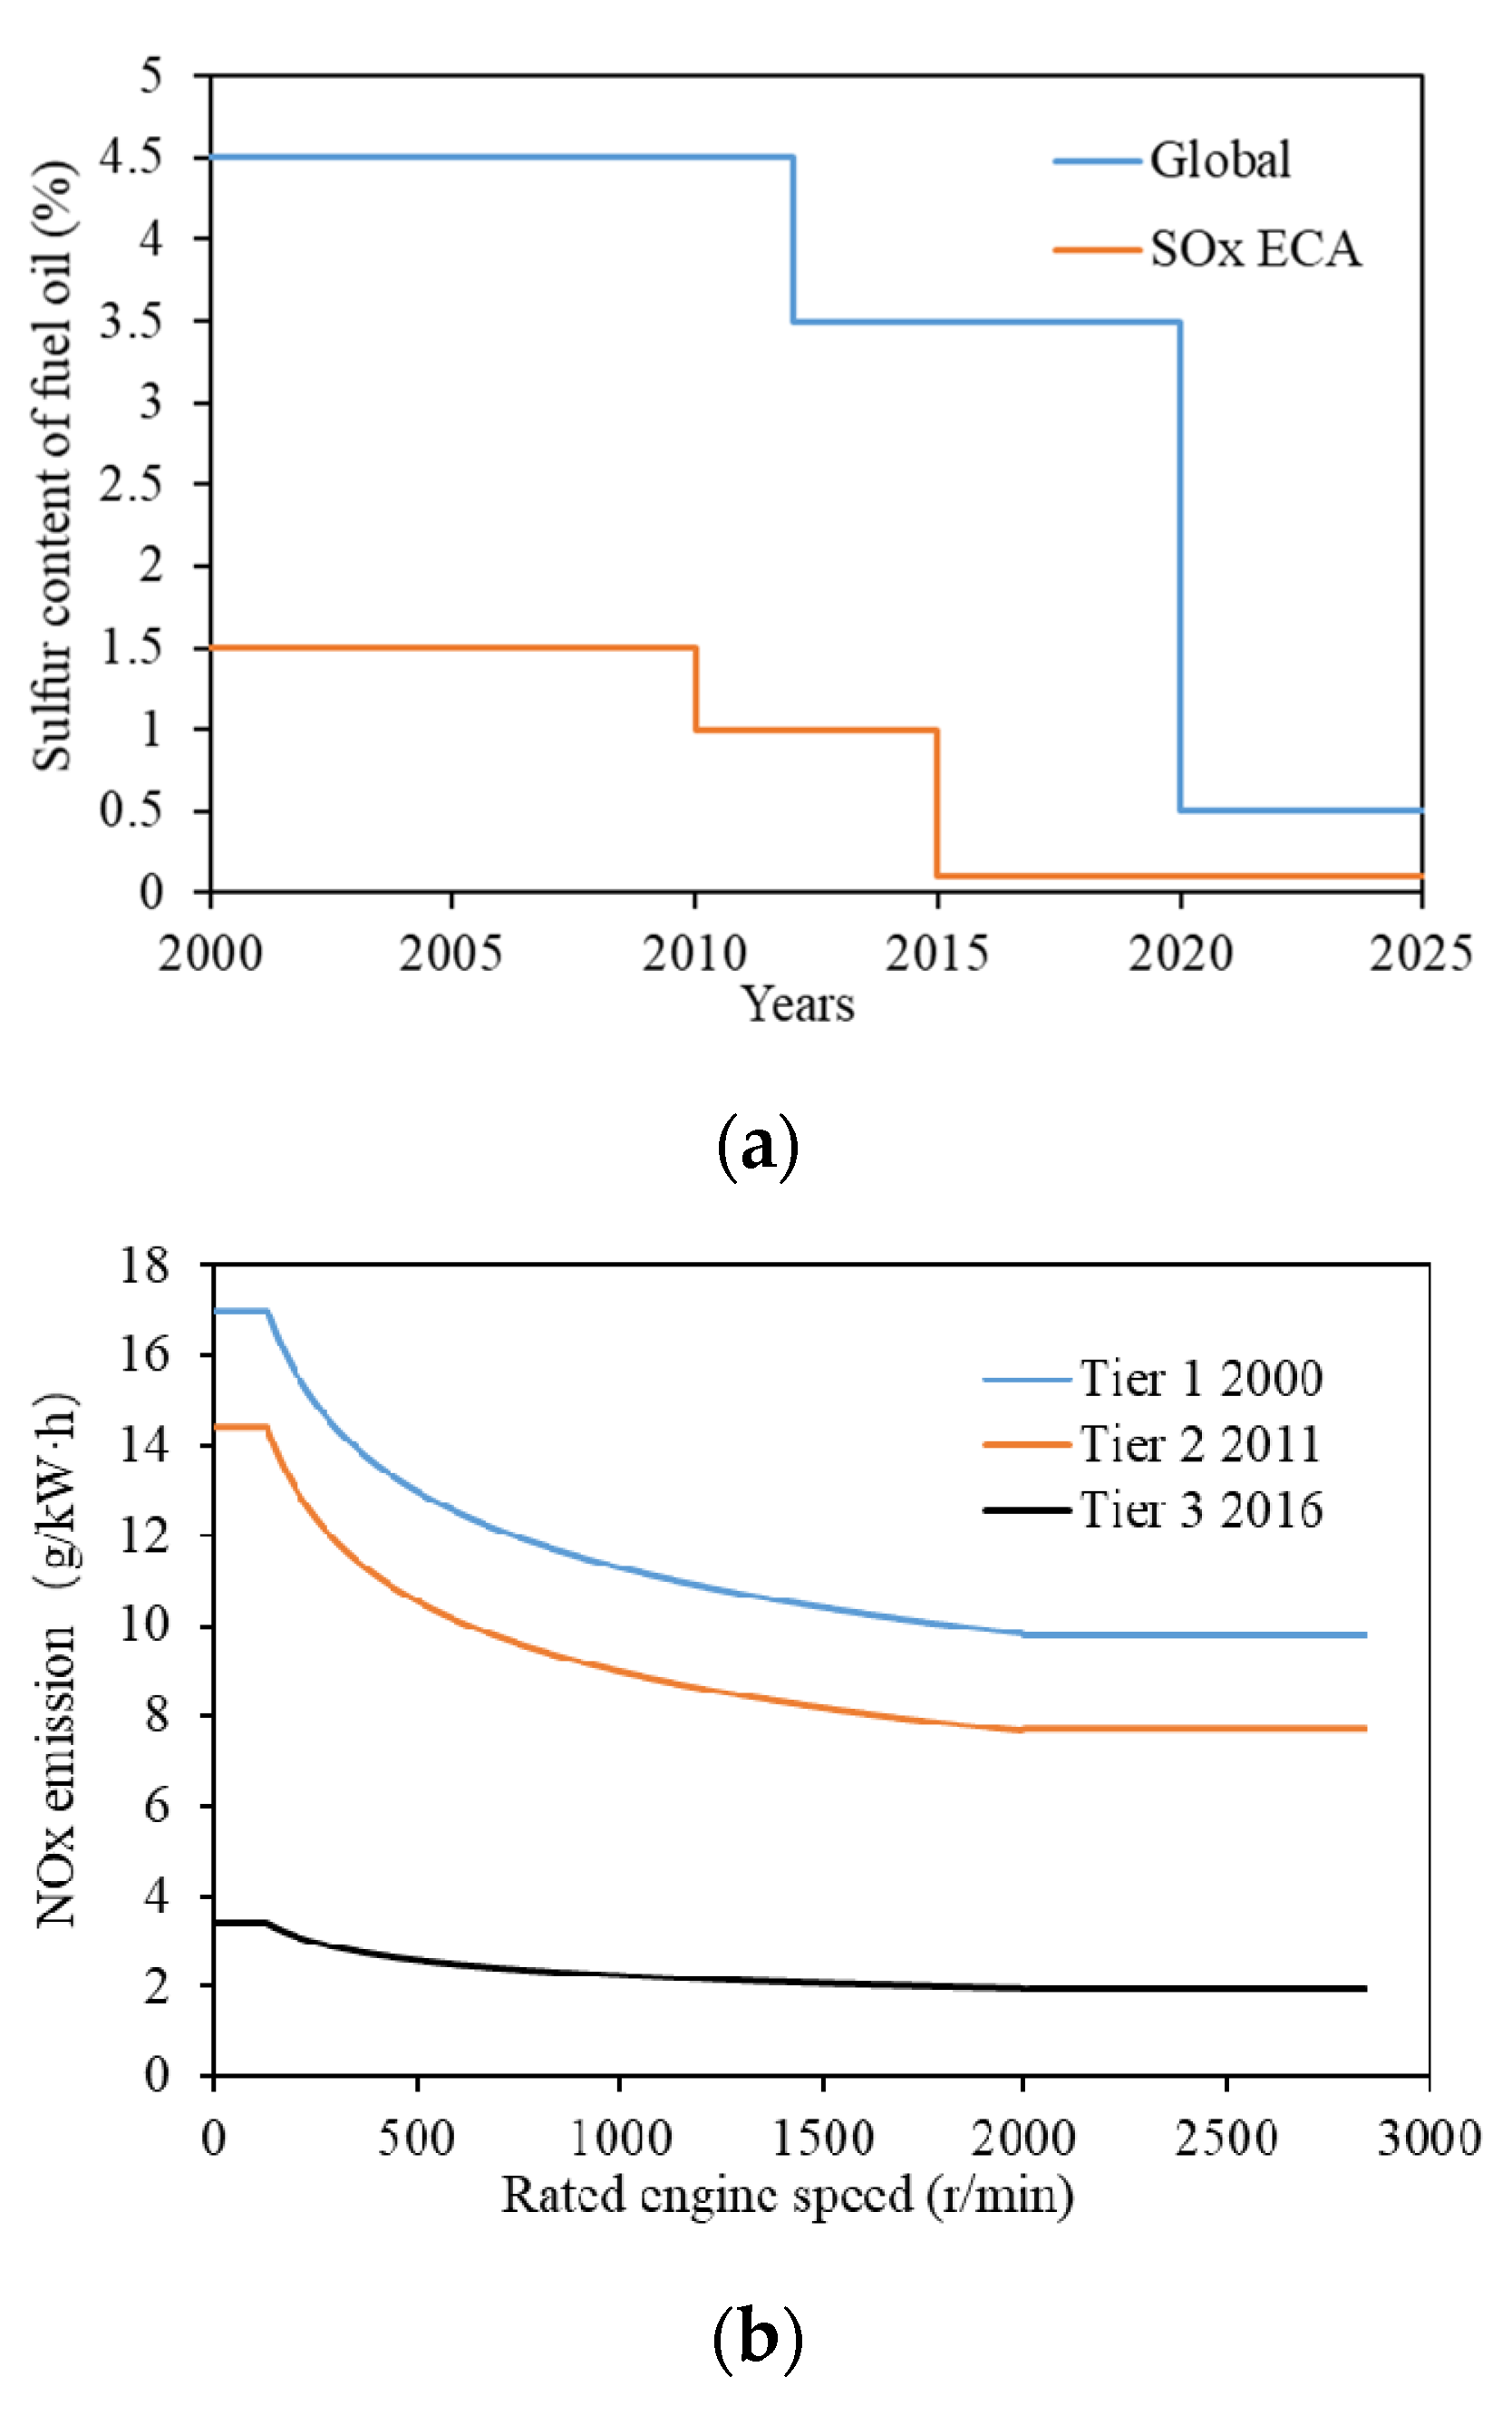
:1. Introduction
2. Experiment and Methods
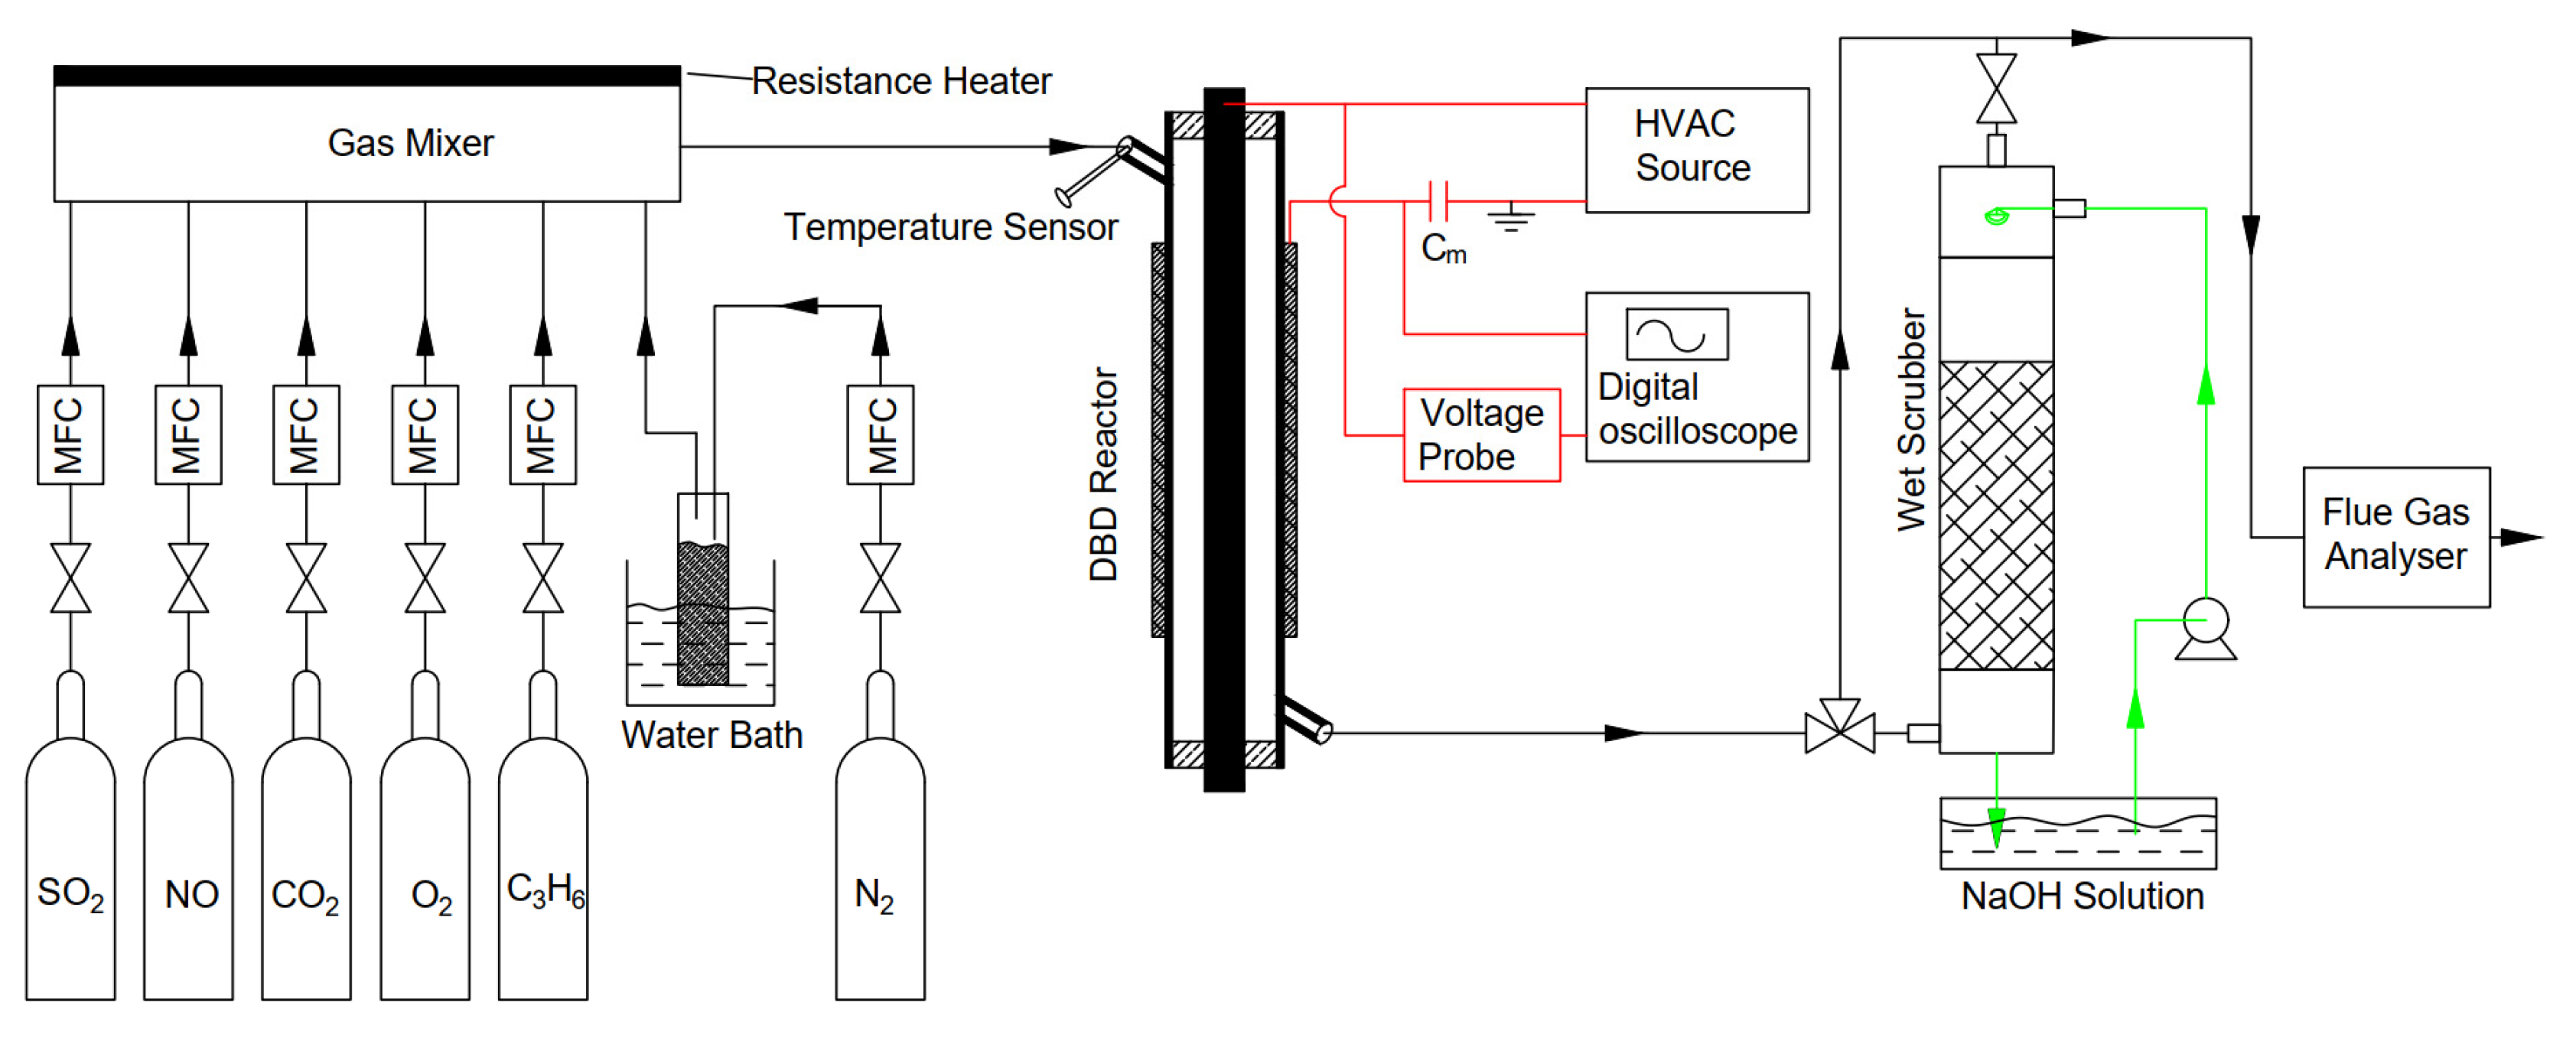
2.1. Experiment Setup
2.2. Data Processing
3. Results and Discussion
3.1. The Packing Types
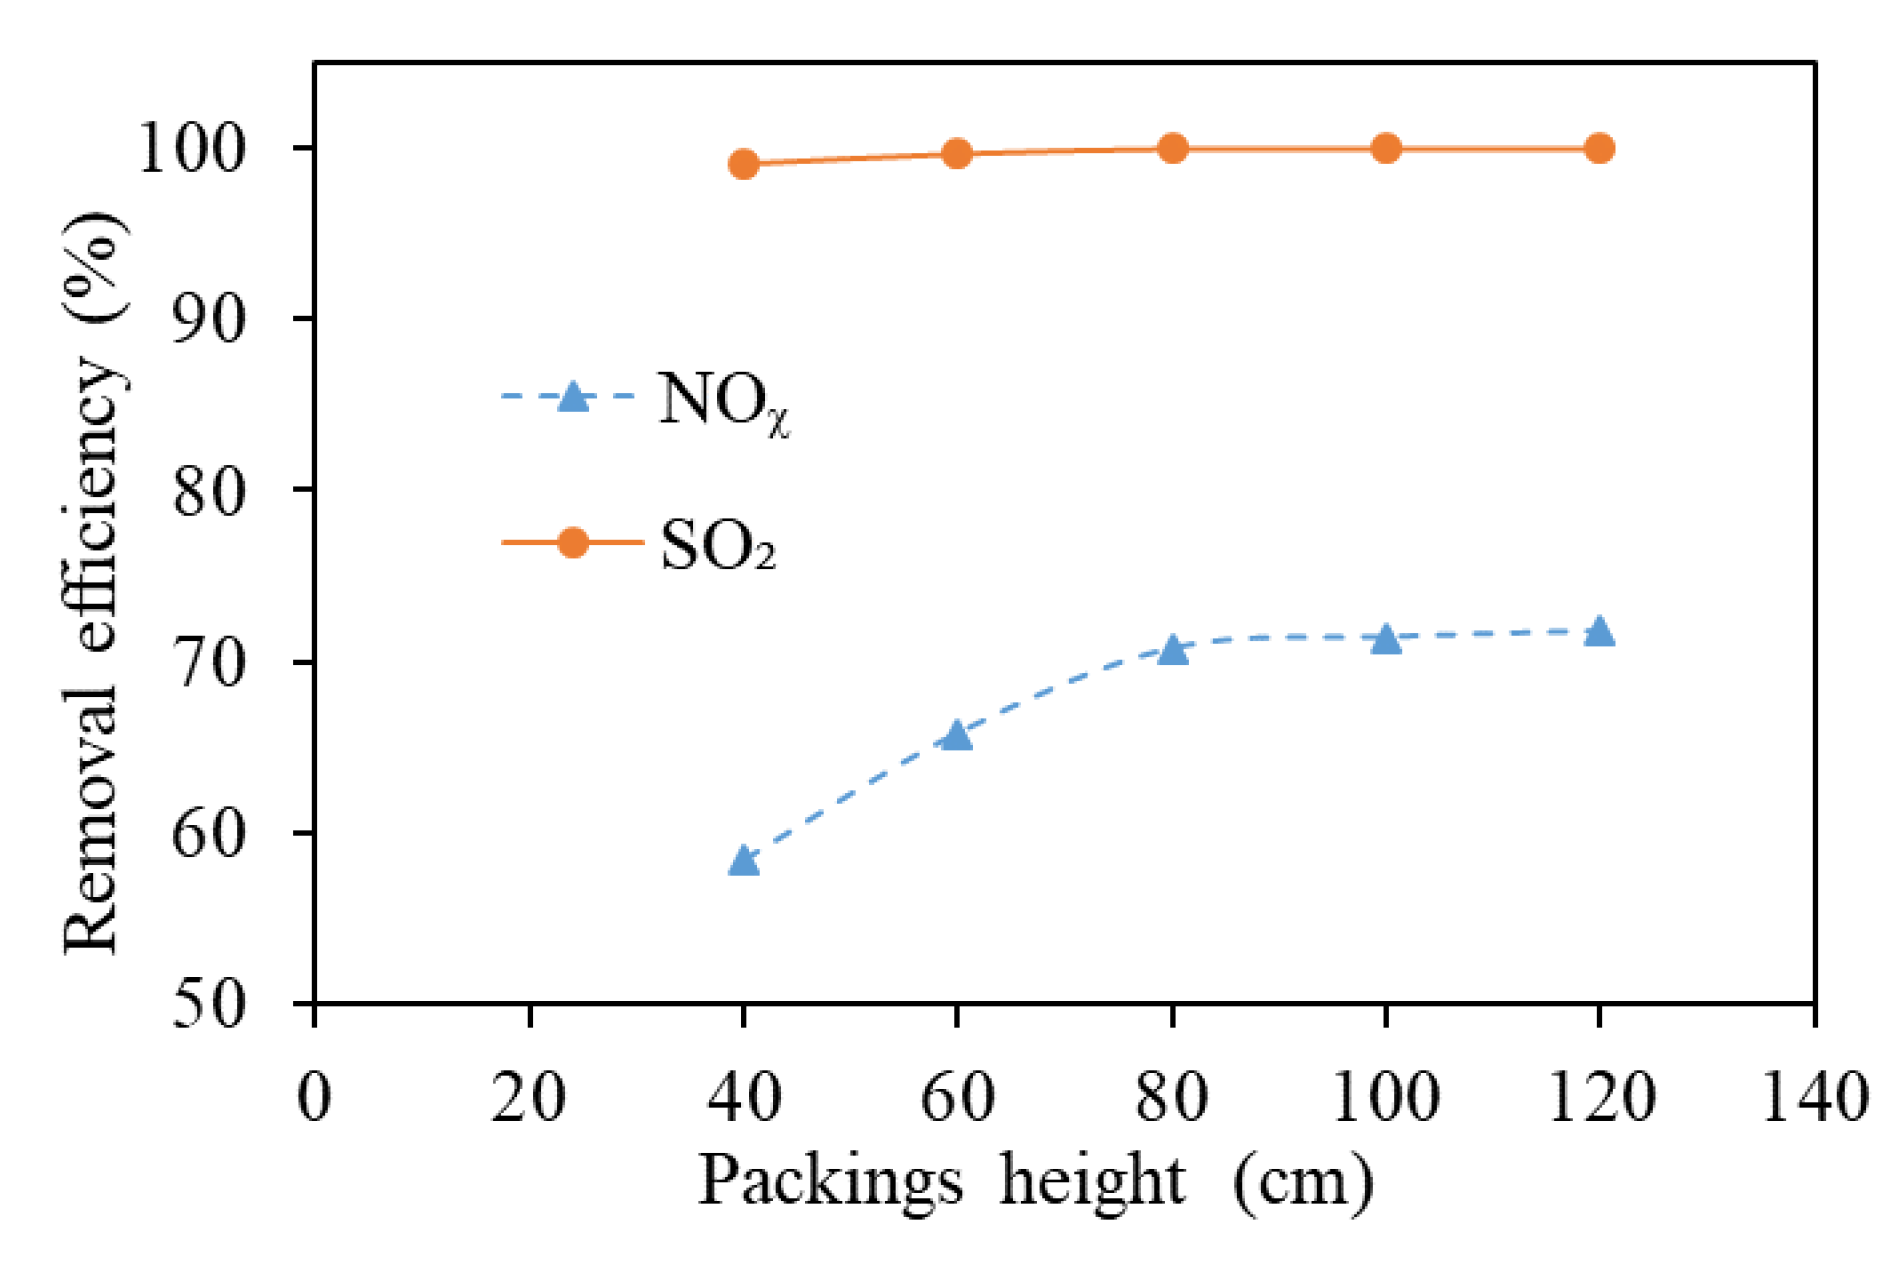
3.2. Packing Height
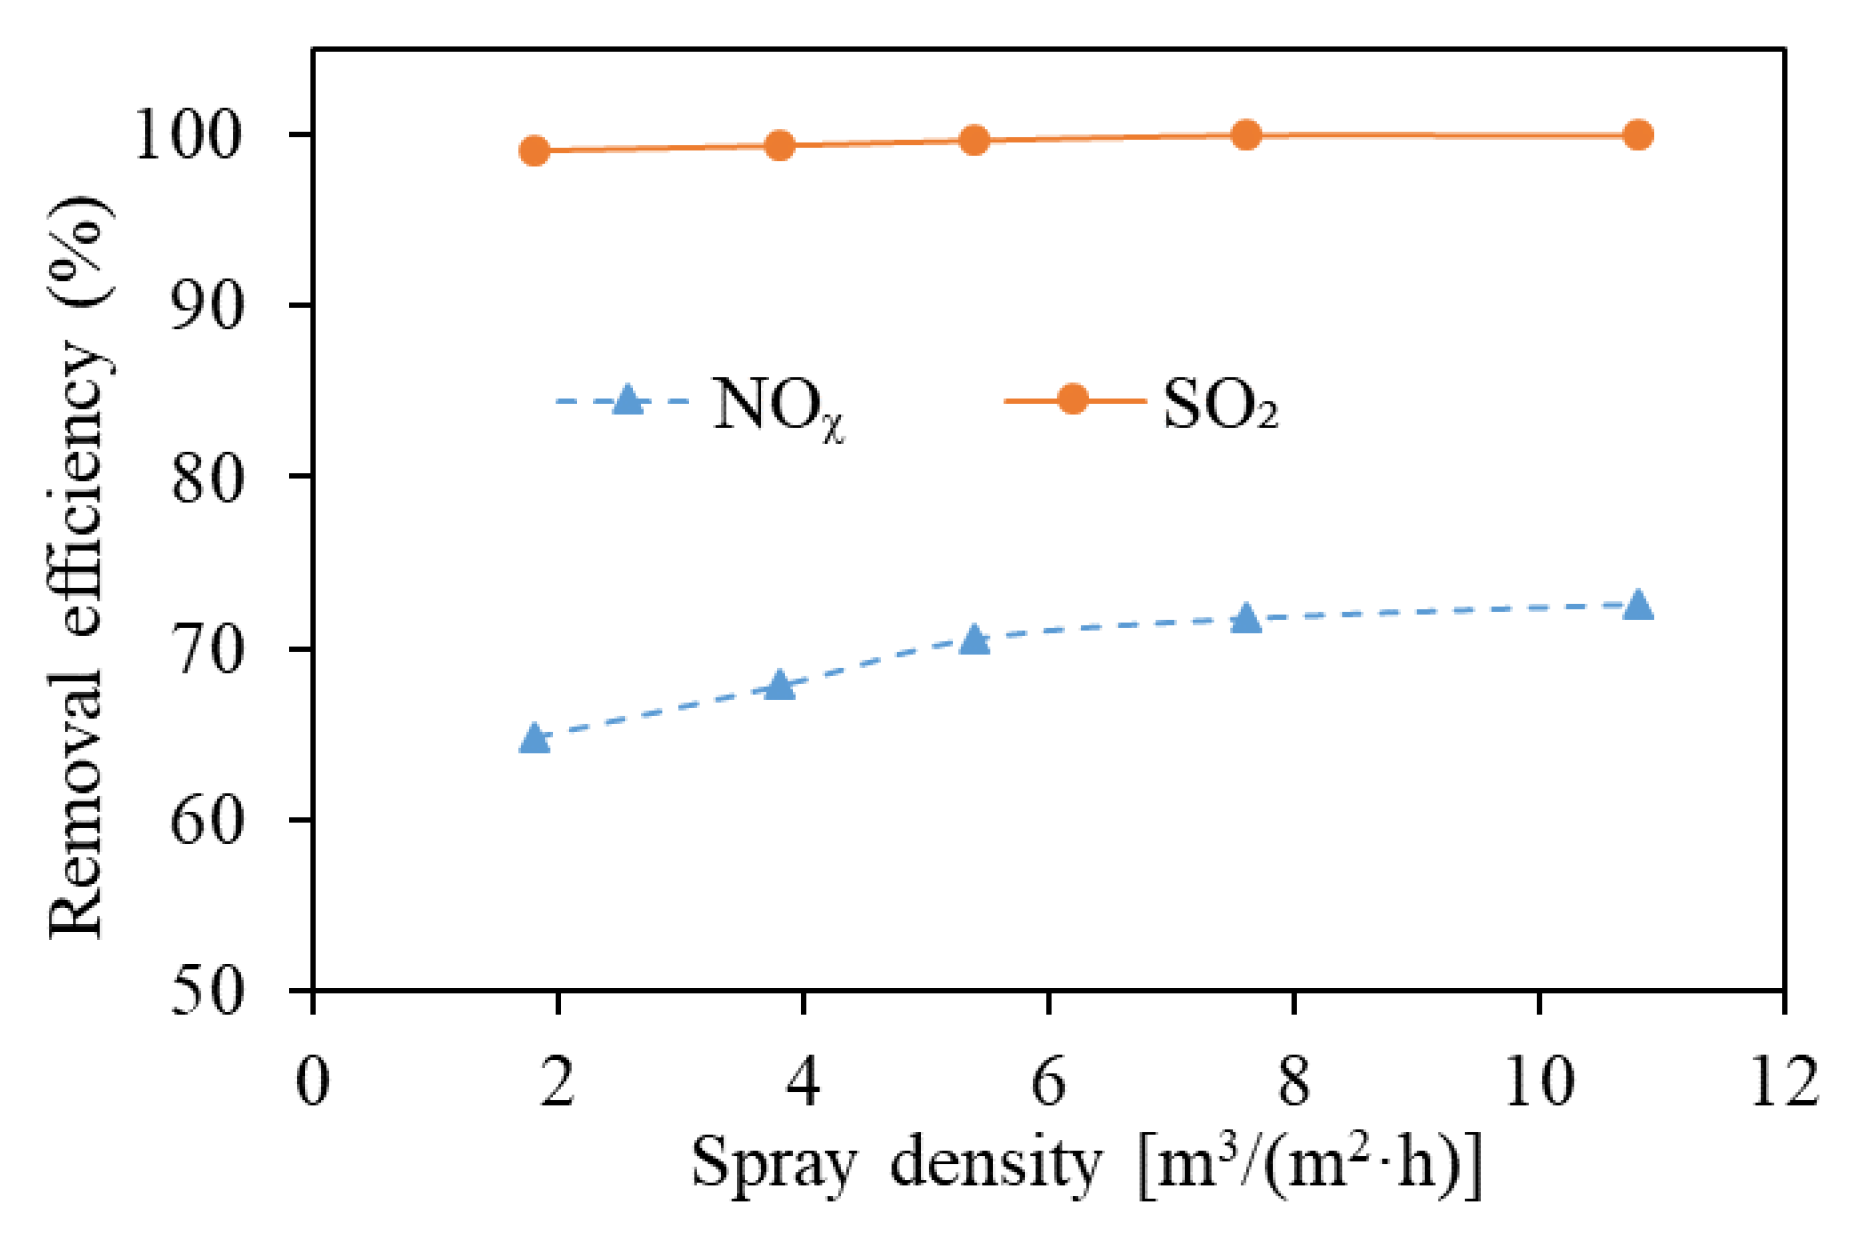
3.3. Spray Density
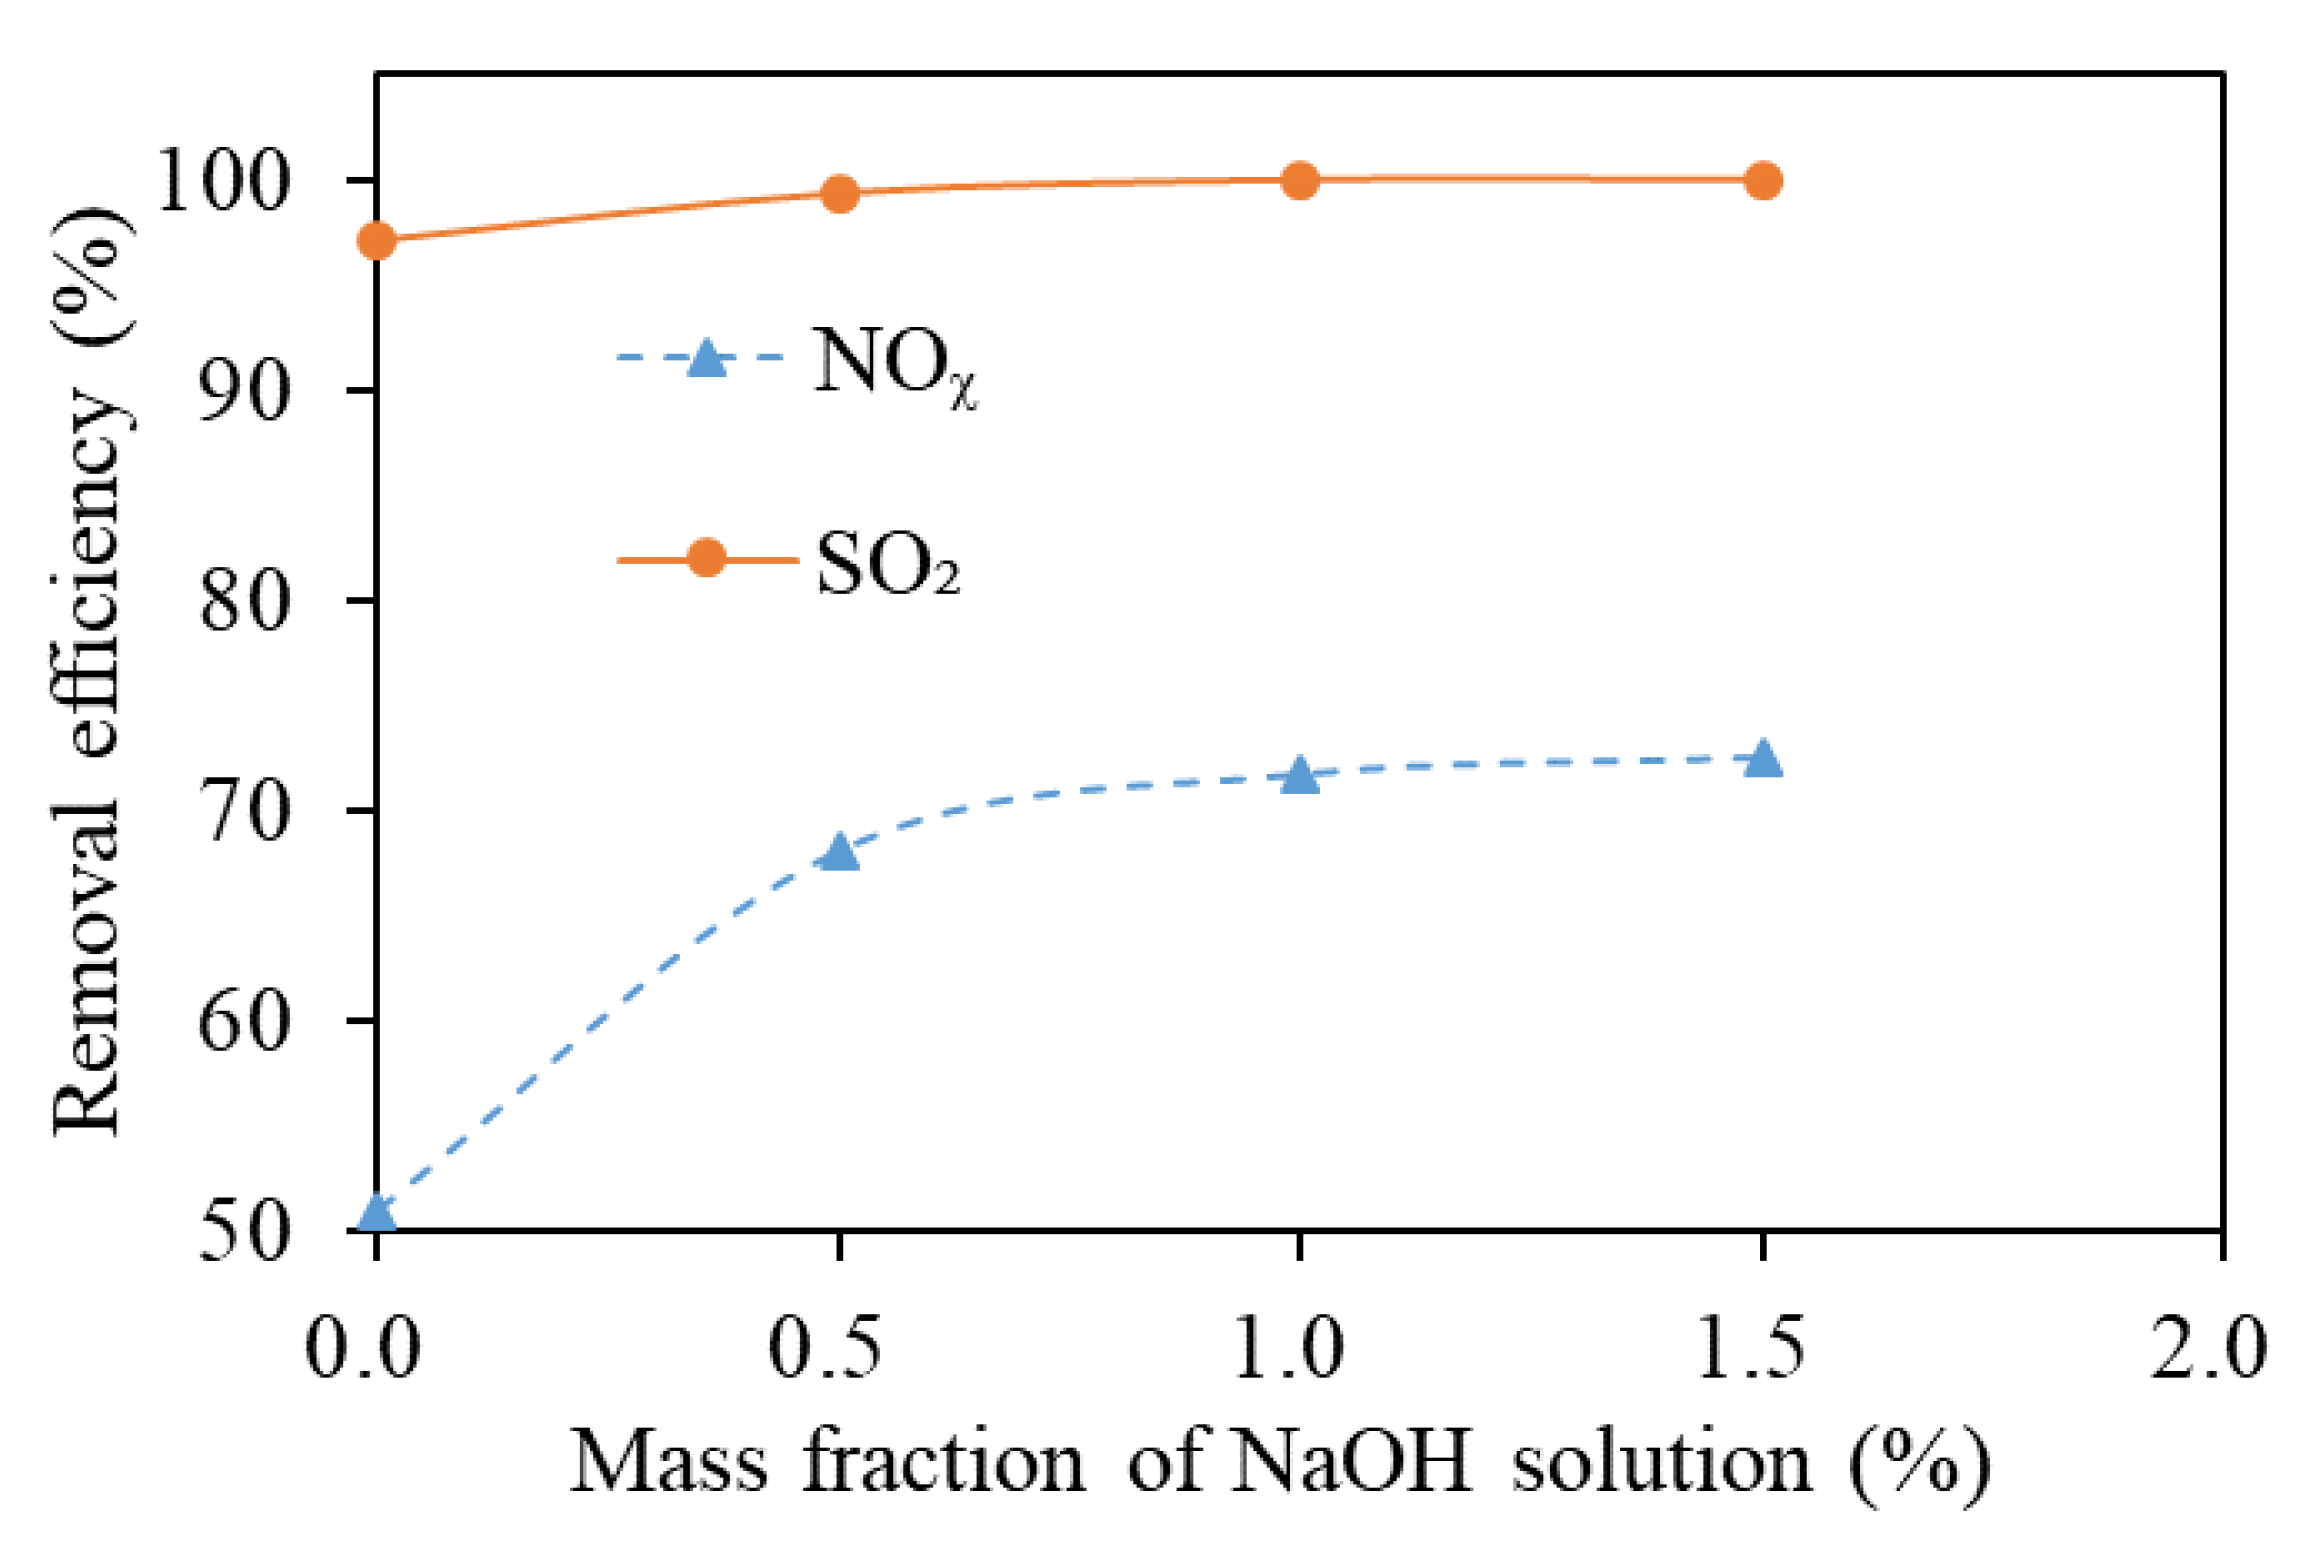
3.4. Mass Fraction of NaOH Solution
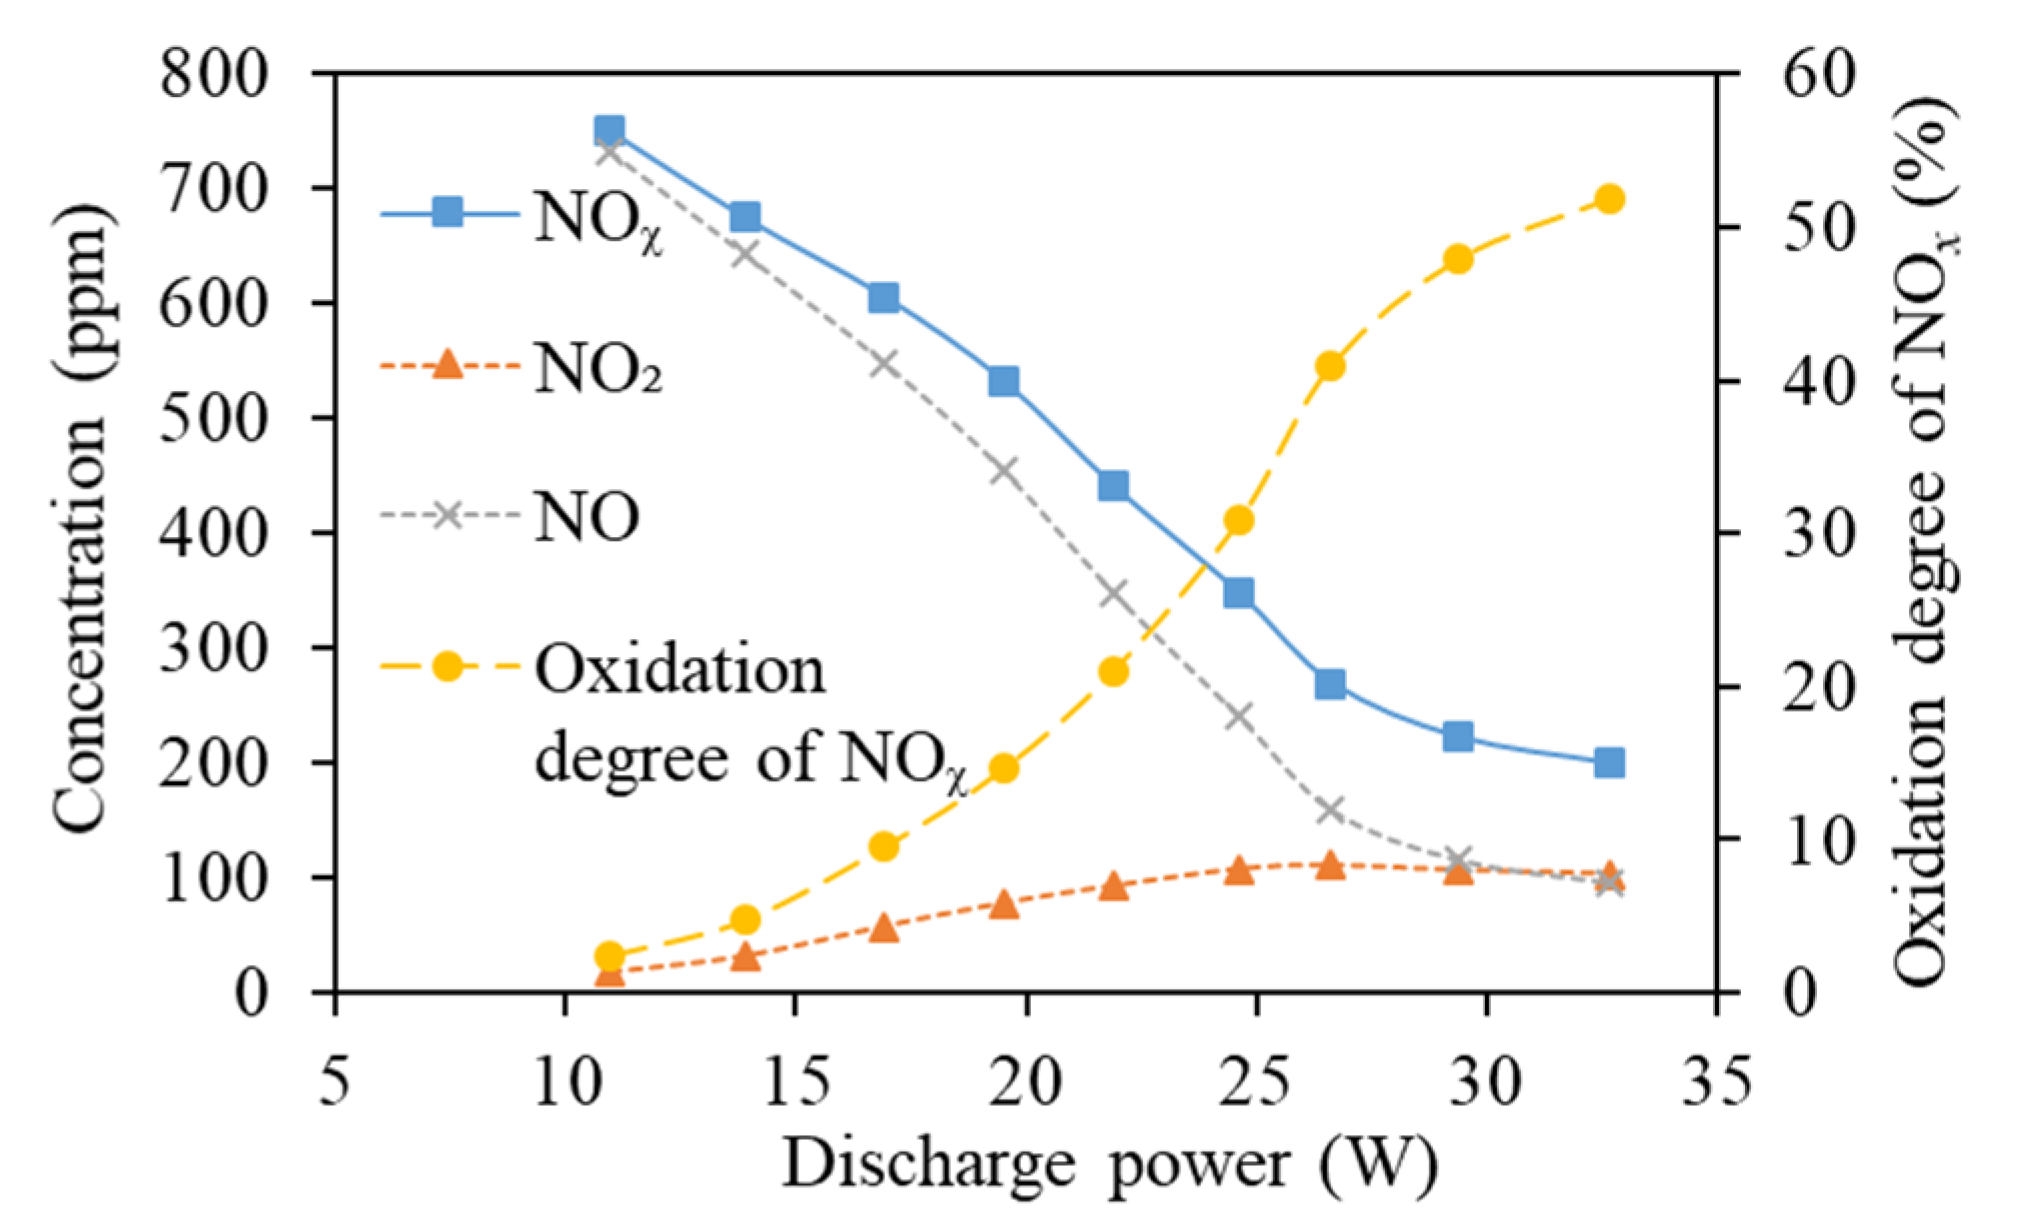
3.5. Discharge Power in the DBD Reactor
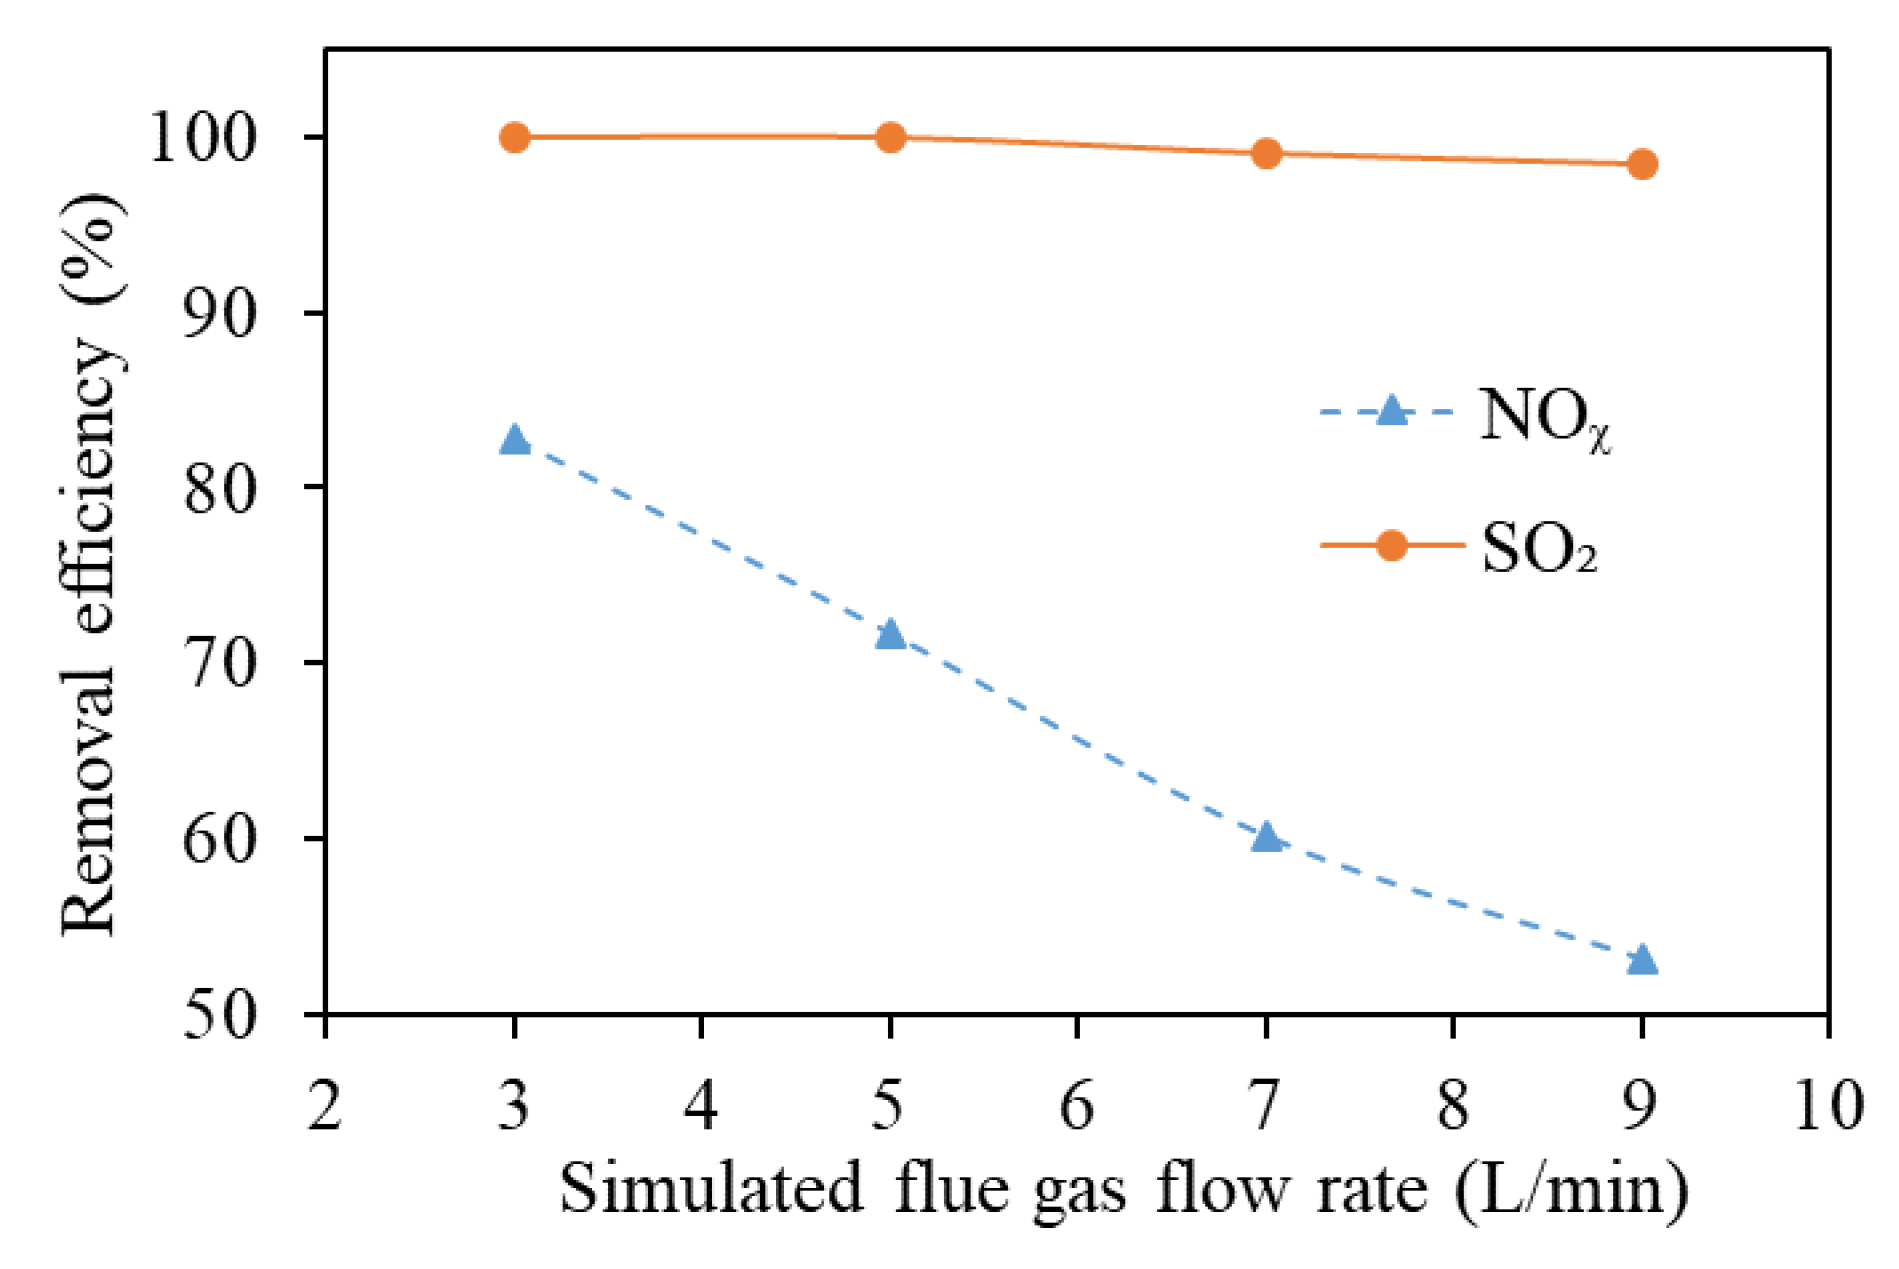
3.6. Simulated Flue Gas Flow Rate
- The increase in the flue gas flow reduces the gas–liquid mass transfer time of the flue gas in the scrubber, resulting in decreased mass transfer efficiency;
- The increase in the flue gas flow rate decreases the specific energy density (SED, the energy obtained by unit volume of flue gas), the NO oxidation efficiency in the DBD reactor is reduced, and finally the denitration efficiency is significantly reduced.
3.7. Weight Analysis of Influencing Factors
4. Conclusions
- Various factors have little impact on the desulfurization efficiency of the DBD combined wet scrubbing system, while high desulfurization efficiency is easy to achieve. The denitration efficiency is the key problem in this system;
- The influence weights of the DBD power, simulated flue gas flow rate, mass fraction of the NaOH solution, spray density, packing type, and packing height on denitration efficiency were 56.96%, 18.02%, 11.52%, 5.02%, 4.33%, and 4.16%, respectively.
Author Contributions
Funding
Institutional Review Board Statement
Informed Consent Statement
Data Availability Statement
Acknowledgments
Conflicts of Interest
References
- Cengiz, D.; Burak, Z. Environmental and economical assessment of alternative marine fuel. J. Clean Pron. 2016, 113, 438–449. [Google Scholar]
- Ledoux, F.; Roche, C.; Cazier, F.; Beaugard, C.; Courcot, D. Influence of ship emissions on NOx, SO2, O3 and PM concentrations in a North-Sea harbor in France. J. Environ. Sci. 2018, 71, 56–66. [Google Scholar] [CrossRef]
- EGCSA (The Exhaust Gas Cleaning System Association). A Practical Guide to Exhaust Gas Cleaning Systems for the Maritime Industry. 2012. Available online: http://www.egcsa.com/wp-content/uploads/EGCSA-Handbook-2012-A5-size-.pdf (accessed on 13 July 2021).
- Xin, Q.; Hua, Z.S.; Fu, Y.J.; Yang, Y.; Liu, S.J.; Song, H.; Yu, X.N.; Xiao, L.F.; Zheng, C.H.; Gao, X. Investigation on optimal active layer thickness and pore size in dual-layer NH3-SCR monolith for low SO2 oxidation by numerical simulation. Fuel 2020, 279, 118420. [Google Scholar] [CrossRef]
- Li, Y.; Xiong, J.; Lin, Y.; Guo, J.; Zhu, T. Distribution of SO2 oxidation products in the SCR of NO over a V2O5/TiO2 catalyst at different temperatures. Ind. Eng. Chem. Res. 2020, 59, 5177–5185. [Google Scholar] [CrossRef]
- EGCSA (The Exhaust Gas Cleaning System Association). 983 Vessels with Scrubbers or on Order. 2018. Available online: https://www.egcsa.com/wp-content/uploads/EGCSA-numbers-31-May-2018-7.pdf (accessed on 13 July 2021).
- Fang, P.; Chen, X.B.; Tang, Z.J.; Huang, J.H.; Zeng, W.H.; Wu, H.W.; Tang, Z.X.; Cen, C.P. Current research status on air pollutant emission characteristics and control technology of marine diesel engine. Chem. Ind. Eng. Pro. 2017, 36, 1067–1076. [Google Scholar]
- Fang, P.; Cen, C.; Tang, Z.; Zhong, P.; Chen, D.; Chen, Z. Simultaneous removal of SO2 and NOx by wet scrubbing using urea solution. Chem. Eng. J. 2011, 168, 52–59. [Google Scholar] [CrossRef]
- Bao, J.; Li, K.; Ning, P.; Wang, C.; Song, X.; Luo, Y.; Sun, X. Study on the role of copper converter slag in simultaneously removing SO2 and NOx using KMnO4/copper converter slag slurry. J. Environ. Sci. 2021, 108, 33–43. [Google Scholar] [CrossRef]
- DESHWAL, B.R.; LEE, H.K. Mass transfer in the absorption of SO2 and NOx using aqueous euchlorine scrubbing solution. J. Environ. Sci. 2009, 21, 155–161. [Google Scholar] [CrossRef]
- Yuri, Y.; Hashira, Y.; Daichi, T.; Daichi, T.; Tomoyuki, K.; Hidekatsu, F.; Masaaki, O. Simultaneous Removal of NOx and SOx from Flue Gas of a Glass Melting Furnace using a Combined Ozone Injection and Semi-dry Chemical Process. Ozone-Sci. Eng. 2015, 38, 211–218. [Google Scholar]
- Włodzimierz, K.; Adam, H.; Dariusz, Ł. Influence of Oxidizing Reactor on Flue Gas Denitrification by Ozonation and Possibility of by-Product Separation. Chem. Process Eng. 2017, 38, 177–191. [Google Scholar]
- Si, T.; Wang, C.; Yan, X.N.; Zhang, Y.; Rem, Y.J.; Hu, J.; Edward, J.A. Simultaneous removal of SO2 and NOx by a new combined spray-and-scattered-bubble technology based on preozonation: From lab scale to pilot scale. Appl. Energy 2019, 242, 1528–1538. [Google Scholar] [CrossRef]
- Zou, Y.; Wang, Y.; Liu, X.L.; Zhu, T.Y.; Tian, M.K.; Cai, M.Y. Simultaneous removal of NOx and SO2 using two-stage O3 oxidation combined with Ca(OH)2 absorption. Korean J. Chem. Eng. 2020, 37, 1907–1914. [Google Scholar] [CrossRef]
- Ding, J.; Zhong, Q.; Zhang, S.; Song, F.J.; Bu, Y.F. Simultaneous removal of NOx and SO2 from coal-fired flue gas by catalytic oxidation-removal process with H2O2. Chem. Eng. J. 2014, 243, 176–182. [Google Scholar] [CrossRef]
- Cui, R.; Ma, S.; Yang, B.; Li, S.; Pei, T.; Li, J.; Wang, J.; Sun, S.; Mi, C. Simultaneous removal of NOx and SO2 with H2O2 over silica sulfuric acid catalyst synthesized from fly ash. Waste Manag. 2020, 109, 65–74. [Google Scholar] [CrossRef]
- Han, Z.; Lan, T.; Han, Z.; Yang, S.; Dong, J.; Sun, D.; Yan, Z.; Pan, X.; Song, L. Simultaneous removal of NO and SO2 from exhaust gas by cyclic scrubbing and online supplementing pH-buffered NaClO2 solution. Energ. Fuel 2019, 33, 6591–6599. [Google Scholar] [CrossRef]
- Maria, J.; Dariusz, Ł.; Arkadiusz, Ś.; Mieczysław, A.G.; Mariola, K. Simultaneous removal of NOx, SO2, and Hg from flue gas in FGD absorber with oxidant injection (NaClO2)– full-scale investigation. J. Air Waste Manage. 2020, 70, 629–640. [Google Scholar]
- Yang, S.L.; Pan, X.X.; Han, Z.T.; Zhang, D.S.; Liu, B.J.; Zheng, D.K.; Yan, Z.J. Removal of NOx and SO2 from simulated ship emissions using wet scrubbing based on seawater electrolysis technology. Chem. Eng. J. 2018, 331, 8–15. [Google Scholar] [CrossRef]
- Li, S.; Huang, Y.; Wang, F.; Liu, J.; Feng, F.; Shen, X.; Zheng, Q.; Liu, Z.; Wang, L.; Yan, K. Fundamentals and Environmental Applications of Non-thermal Plasmas: Multi-pollutants Emission Control from Coal-Fired Flue Gas. Plasma Chem. Plasma Process. 2014, 34, 579–603. [Google Scholar] [CrossRef]
- Ma, S.; Zhao, Y.; Yang, J.; Zhang, S.; Zhang, J.; Zheng, C. Research progress of pollutants removal from coal-fired flue gas using non-thermal plasma. Renew. Sust. Energ. Rev. 2017, 67, 791–810. [Google Scholar] [CrossRef]
- Chen, R.; Zhang, T.; Wang, J.; Gao, Y.; Wang, J.; Wei, J.; Yu, Q. Recent advances in simultaneous removal of SO2 and NOx from exhaust gases: Removal process, mechanism and kinetics. Chem. Eng. J. 2020, 420, 127588. [Google Scholar] [CrossRef]
- Yu, W.X. Plasma Desulfurization and Denitrification Andits Application in the Study of Marine Diesel Engine Exhaust Treatment. Master’s Thesis, Wuhan Textile University, Wuhan, China, 2013. [Google Scholar]
- Xie, D.Y.; Sun, Y.; Zhu, T.L.; Ding, L. Removal of NO in mist by the combination of plasma oxidation and chemical absorption. Energy Fuel 2016, 30, 5071–5076. [Google Scholar] [CrossRef]
- Zhang, C.; Yang, L. One-Dimensional Simulation of Synergistic Desulfurization and Denitrification Processes for Electrostatic Precipitators Based on a Fluid-Chemical Reaction Hybrid Model. Energies 2018, 11, 3249. [Google Scholar] [CrossRef] [Green Version]
- Chmielewski, A.G.; Zwolińska, E.; Licki, J.; Sun, Y.; Zimek, Z.; Bułka, S. A hybrid plasma-chemical system for high-NOx flue gas treatment. Radiat Phys. Chem. 2017, 144, 1–7. [Google Scholar] [CrossRef]
- Gui, S.P.; Zhong, Z.; Liao, Y.J.; Qi, L.; Fu, D. Simultaneous Removal of NO and SO2 via an Integrated System of Nonthermal Plasma Combined with Catalytic Oxidation and Wet Electrostatic Precipitator. Energy Fuel 2019, 33, 10078–10089. [Google Scholar]
- Zwolińska, E.; Sun, Y.; Chmielewski, A.G.; Pawelec, A.; Bułka, S. Removal of high concentrations of NOx and SO2 from diesel off-gases using a hybrid electron beam technology. Energy Rep. 2020, 6, 952–964. [Google Scholar] [CrossRef]
- Zhao, L.; Sun, Y.X.; Chmielewski, A.G.; Pawelec, A.; Bułka, S. NO Oxidation with NaClO, NaClO2, and NaClO3 Solution Using Electron Beam and a One Stage Absorption System. Plasma Chem. Plasma Process. 2020, 40, 433–447. [Google Scholar] [CrossRef] [Green Version]
- Cai, Y.K.; Lv, L.; Li, P. Study on the effect of structure parameters on NO oxidation in DBD reactor under oxygen-enriched condition. Appl. Sci. 2020, 10, 6766. [Google Scholar] [CrossRef]
- Cai, Y.K.; Lu, L.; Lu, X.P. The effects of inner electrode diameter on the performance of dielectric barrier discharge reactor for desulfurization and denitrification. IEEE Trans. Plasma Sci. 2021, 49, 786–793. [Google Scholar] [CrossRef]
- Chen, M.H.; Cong, D.Z.; Fang, T.N.; Qi, M.Z.; Pan, H.L. Principles of Chemical Engineering (Part II), 4th ed.; Chemical Industry Press: Beijing, China, 2015. [Google Scholar]
- Liu, D.T. Study on the Absorption, Oxidation Characteristics and Comprehensive Evaluation System of Sodium Alkali Desulfurization of Marine Exhaust Gas. Ph.D. Thesis, Harbin Engineering University, Harbin, China, 2017. [Google Scholar]
- Ye, C.W. Study on the Optimum Oxidation Degree of NO in Simultaneous Desulfurization and Denitrification by Urea. Master’s Thesis, Wuhan University of Technology, Wuhan, China, 2018. [Google Scholar]
- Gao, F.; Liu, F.; Zhang, J.F.; Huang, Y.; Yang, L.C. Mechanism of NO2 promoting NO absorption by alkali liquor. Chin. J. Process. Eng. 2012, 12, 796–802. [Google Scholar]
- Wu, J.J.; Liu, T.; Zhu, X. Parameter Weight Analysis of Flexible Microgripper Based on Orthogonal Test. Mach. Tool Hydraul. 2019, 48, 7–11. [Google Scholar]
- Chen, K. Experimental Design and Analysis, 1st ed.; Tsinghua University Press: Beijing, China, 2005. [Google Scholar]


| Sensor | Range | Accuracy | Resolution | Response Time |
|---|---|---|---|---|
| NO | 0–2000 ppm | 5 ppm (0–99 ppm) ±5% of the measured value (100–2000 ppm) | 1 ppm | 30 s |
| NO2 | 0–500 ppm | 5 ppm (0–99 ppm) ±5% of the measured value (100–2000 ppm) | 0.1 ppm | 40 s |
| SO2 | 0–2000 ppm | ±5% of the measured value | 1 ppm | 30 s |
| O2 | 0–25 Vol% | ±0.2 Vol% | 0.01% | 20 s |
| CO2 | 0–25 Vol% | ±0.3 Vol% + 1% of the measured value | 0.01% | 20 s |
| Type | Diameter (mm) × Height (mm) | Specific Surface Area () |
|---|---|---|
| Dg mm Pall ring | 10 × 10 | 482 |
| Dg mm Pall ring | 6 × 6 | 905 |
| Dg mm Dixon ring | 6 × 6 | 950 |
| Dg mm Cannon ring | 6 × 6 | 910 |
| Mass Fraction of NaOH Solution /% | 0 | 0.5 | 1.0 | 1.5 |
| pH Value | 7.0 | 13.1 | 13.4 | 13.5 |
| Factor | A (-) | B (cm) | C () | D (%) | E (W) | F (L/min) | |
|---|---|---|---|---|---|---|---|
| Level | |||||||
| 1 | Dg mm Pall ring | 40 | 1.8 | 0 | 10.9 | 3 | |
| 2 | Dg mm Pall ring | 80 | 5.4 | 0.5 | 19.5 | 5 | |
| 3 | Dg mm Dixon ring | 120 | 10.8 | 1 | 26.6 | 7 | |
| NO. | A | B | C | D | E | F | Results |
|---|---|---|---|---|---|---|---|
| 1 | 1 | 1 | 1 | 1 | 1 | 1 | 12.17% |
| 2 | 1 | 2 | 2 | 2 | 2 | 2 | 67.62% |
| 3 | 1 | 3 | 3 | 3 | 3 | 3 | 81.65% |
| 4 | 2 | 1 | 1 | 2 | 2 | 3 | 40.68% |
| 5 | 2 | 2 | 2 | 3 | 3 | 1 | 95.62% |
| 6 | 2 | 3 | 3 | 1 | 1 | 2 | 15.07% |
| 7 | 3 | 1 | 2 | 1 | 3 | 2 | 76.02% |
| 8 | 3 | 2 | 3 | 2 | 1 | 3 | 12.63% |
| 9 | 3 | 3 | 1 | 3 | 2 | 1 | 79.88% |
| 10 | 1 | 1 | 3 | 3 | 2 | 2 | 54.85% |
| 11 | 1 | 2 | 1 | 1 | 3 | 3 | 53.41% |
| 12 | 1 | 3 | 2 | 2 | 1 | 1 | 17.06% |
| 13 | 2 | 1 | 2 | 3 | 1 | 3 | 10.94% |
| 14 | 2 | 2 | 3 | 1 | 2 | 1 | 65.76% |
| 15 | 2 | 3 | 1 | 2 | 3 | 2 | 84.95% |
| 16 | 3 | 1 | 3 | 2 | 3 | 1 | 92.98% |
| 17 | 3 | 2 | 1 | 3 | 1 | 2 | 16.00% |
| 18 | 3 | 3 | 2 | 1 | 2 | 3 | 36.56% |
Publisher’s Note: MDPI stays neutral with regard to jurisdictional claims in published maps and institutional affiliations. |
© 2021 by the authors. Licensee MDPI, Basel, Switzerland. This article is an open access article distributed under the terms and conditions of the Creative Commons Attribution (CC BY) license (https://creativecommons.org/licenses/by/4.0/).
Share and Cite
Yang, L.; Cai, Y.; Lu, L. Experimental Study on Simultaneous Desulfurization and Denitrification by DBD Combined with Wet Scrubbing. Appl. Sci. 2021, 11, 8592. https://doi.org/10.3390/app11188592
Yang L, Cai Y, Lu L. Experimental Study on Simultaneous Desulfurization and Denitrification by DBD Combined with Wet Scrubbing. Applied Sciences. 2021; 11(18):8592. https://doi.org/10.3390/app11188592
Chicago/Turabian StyleYang, Liang, Yunkai Cai, and Lin Lu. 2021. "Experimental Study on Simultaneous Desulfurization and Denitrification by DBD Combined with Wet Scrubbing" Applied Sciences 11, no. 18: 8592. https://doi.org/10.3390/app11188592
APA StyleYang, L., Cai, Y., & Lu, L. (2021). Experimental Study on Simultaneous Desulfurization and Denitrification by DBD Combined with Wet Scrubbing. Applied Sciences, 11(18), 8592. https://doi.org/10.3390/app11188592