Article

Helium Atmospheric Pressure Plasma Jet Source Treatment of White Grapes Juice for Winemaking

by
Ramona Huzum
1 and
Andrei Vasile Nastuta
2,*
1
Integrated Center of Environmental Science Studies in the North-Eastern Development Region (CERNESIM), Department of Exact and Natural Sciences, Institute of Interdisciplinary Research, ‘Alexandru Ioan Cuza’ University of Iasi, 11 ‘Carol I’ Blvd., 700506 Iasi, Romania
2
Physics and Biophysics Education Research Laboratory (P&B-EduResLab), Biomedical Science Department, Faculty of Medical Bioengineering, ‘Grigore T. Popa’ University of Medicine and Pharmacy Iasi, M. Kogalniceanu Str., No. 9-13, 700454 Iasi, Romania
*
Author to whom correspondence should be addressed.
Appl. Sci. 2021, 11(18), 8498; https://doi.org/10.3390/app11188498
Submission received: 14 August 2021 / Revised: 8 September 2021 / Accepted: 10 September 2021 / Published: 13 September 2021
(This article belongs to the Special Issue Frontiers in Atmospheric Pressure Plasma Technology)

Abstract

:
In the last few years, new emerging technologies to develop novel winemaking methods were reported. Most of them pointed out the need to assess the barrel aging on the wine product, fermentation process, green technologies for wine treatment for long term storage. Among these, plasma technologies at atmospheric pressure are on the way of replacing old and expensive methods for must, wine and yeast treatment, the goal being the long-term storage, aging and even decontamination of such products, and seems to meet the requirements of the winemakers. Using the principles of dielectric barrier discharge, we power up an atmospheric pressure plasma jet in helium. This plasma is used for treatment of fresh must obtained from white grapes. Our research manuscript is focused on the correlation of plasma parameters (applied voltage, plasma power, reactive species, gas temperature) with the physico-chemical properties of white must and wine (1 and 2 years old), via ultraviolet–visible and infrared spectroscopy, and colorimetry. Two types of white must were plasma treated and studied over time. The 10 W plasma source did not exceed 40 °C during treatment, the must did not suffer during thermal treatment. A higher quantity of RONS was observed during plasma-must exposure, supporting further oxidation processes. The UV-Vis and FTIR spectroscopy revealed the presence of phenols, flavones and sugar in the wine samples. Simultaneous visualization of CIE L*a*b* and RGB in color space charts allows easier understanding of wine changing in color parameters. These experimental results supporting the possible usability of atmospheric pressure plasma for winemaking.

1. Introduction

Atmospheric pressure plasma sources are rapidly gaining importance as tools for material worldwide processing, since they are easy to use, technologically simple and environmentally friendly. Applications of these plasmas include: surface modification and deposition, plasma-based synthesis of bio-medical surfaces, decontamination and sterilization, oncotherapy and wound healing [1,2,3,4,5,6,7,8,9,10,11,12,13,14,15,16,17,18,19,20,21,22,23,24,25]. In the last few years, new emerging technology to develop novel winemaking methods were reported. Most of them pointed out the need to assess the barrel aging on the wine product, slowing down the fermentation process and even stopping it and green technologies for wine treatment for long term storage. Among these, plasma technologies based on gas discharges, at atmospheric pressure, are on the way to replacing old and expensive methods for fruit juice, wine and yeast treatment, the goal being the long-term storage, aging and even decontamination of such products, and seems to meet most of the criteria required by the winemakers [26,27,28,29,30,31,32,33,34,35,36,37,38,39,40,41,42,43,44]. Depending on the utilization, the plasma source needs be tuned as to comply with the application requirements (power, electric field, reactive species). This is why it is important to characterize and monitor plasma sources from electrical and optical point of view.
To date, most of the studies regarding plasma-grapes or plasma-wine have been focused on the inactivation of microorganisms by plasma treatment [29,35], few studies approaching the impact of plasma on food components [26,45,46]. Moreover, the huge variety of existing plasma sources and treatment conditions, as well as limitless process parameters in numerous researches, makes it challenging to compare plasma effects on food by-products such as fruit juice/beverages (in our case must or wine).
Vitis vinifera sp is cultivated worldwide for grapes, juice and wine because its large adaptability for different climate and soil type. Over the world, vines grow on all kinds of soil, but individual factors of soil formation particularities of an area give rise to soil variability and different challenges of vineyard management. The terroir concept is given by a complex of variables as: soil, local climate, cultivar and winemaking technique to describe the individual character or “personality” of wine from a specific vineyard area [47,48]. Vitis vinifera is the most important fruit species in the world, no matter its way of consumption as fresh grapes or being processed into raisins, juice or wine. Wine can be simply defined as an alcoholic beverage made from fermented juice of grapes. In total, 95% of wine composition is represented by water and ethanol, while the remaining 5% is by other components such as glycerol, organic acids, carbohydrates, minerals, volatile and phenolic compounds [49].
Wine and winemaking history is lost in time and is closely connected with the history of agriculture, cuisine, humanity and civilization itself. It is well known that people enjoy drinking wine for its taste, flavors and for the health benefits of moderate wine consumption, nowadays being a component of the culture of many countries. A moderate amount of alcohol from wine consumption (150–300 mL/day) can protect against cardiovascular disease, dietary cancers, ischemic stroke, diabetes, hypertension and so on [50]. Additionally, the polyphenols from wine have antioxidant, antiviral, antibacterial and anti-carcinogen proprieties which imply health benefits [50,51,52,53]. Apart this, vine and wine has an important economic status, including in the world trade market as well as the agro-tourism to wineries and wine-growing areas. The vineyards became a new attraction for tourism with the thematic trips “on the way of wine” in the vineyards as well as wine tasting directly from wineries and cellars.
Romania is one of the principal producers and consumers of wine from the European Union, which account for 53% of world consumers in 2019 (according to International Organization of Vine and Wine (OIV): OIV-state of the world vitivinicultural sector in 2019 [54]). In concordance with the OIV annual report, Romania is the 5th EU country with a vineyard surface area of 191 kha after Spain (966 kha), France (794 kha), Italy (708 kha) and Portugal (195 kha). Although the weather good condition favored a potentially large 2020 harvest, Romania (3.6 mhl) had a negative variation of production in relation with 2019 and the last 5 years (−7% and −17% respectively) (in compliance with the OIV-2020 world wine production first estimates from October 2020 [55]).
The Romanian wine-growing is divided into eight regions, after Cotea et al. [56]:
  • the Transylvanian Plateau (Târnave, Alba, Sebeş-Apold, Aiud, Lechinţa vineyards)
  • the Moldavian Plateau (Cotnari, Iaşi, Huşi, Dealurile Fălciului, Colinele Tutovei, Zeletin, Dealu Bujorului, Nicoreşti, Iveşti, Covurlui vineyards)
  • the Piedmont at the Carpathian’s Curvature (Panciu, Odobeşti, Coteşti, Buzău’s, Dealu Mare vineyards)
  • the Getic Plateau (Ştefăneşti-Argeş, Sâmbureşti, Drăgăşani, Dealurile Craiovei, Plaiurile Drâncei, Severin Vineyards)
  • The Banat-Crişana-Maramureş (Banat, Miniş-Măderat, Diosig, Valea lui Mihai, Silvaniei vineyards)
  • the Sands in the South of Oltenia (Dacilor, Calafat, Sadova-Corabia vineyards)
  • the Romanian Plain (Greaca, independent wine-growing centers situated in the Romanian plain)
  • The Dobrogea Plateau (Sarica-Niculiţel, Istria-Babadag, Murfatlar, Ostrov vineyards)
The Moldavian Plateau, situated in the Eastern part of Romania, is the biggest wine-growing region (69,154 ha) with vines planted at 200–500 m altitude, on different types of soil. From a geological point of view the wine-growing area corresponds to the Moldavian Platform, with soil developed on Sarmatian (Bassarabian and Chersonian) sedimentary rocks consisting of clays and interlayer sand or interbanded clays and carbonates [57]. The climatic conditions of the area are characteristic of a temperate continental type.
In this report, by using the principles of dielectric barrier discharge (DBD), in a cylindrical configuration, we power up an atmospheric pressure plasma jet (appj) in helium. This plasma is used for treatment of fresh (just prepared) juice obtained from white grapes from a small family vineyard. Our research is focused on the correlation of He-appj parameters (like: applied voltage, plasma current, power, plasma excited/reactive nitrogen and oxygen species) with the physico-chemical properties of white must and the resulting white wine (1- and 2-year old), via ultraviolet–visible spectroscopy (UV-Vis) and attenuated total reflection-Fourier transform infrared (ATR-FTIR) spectroscopy, thus proving the possible usage of atmospheric pressure plasma treatment for winemaking.

2. Materials and Methods

This section contains information about the materials and methods used in conducting the experiments involved in this study. The section is divided into two parts: one related to the experimental arrangement and methods used for plasma source ignition, characterization and treatment—Section 2.1; the second includes the material (must) subject to plasma treatment, the method of obtaining it, spectroscopic and physico-chemical methods used for must and wine characterization—Section 2.2.
White grapes juice (must) and winemaking
The grapes used in these experiments were harvested at their technological maturity from the wine region of Moldova (North-Eastern Romania) as follows:
  • A set of grapes was collected from a small family wineyard with hybrid white Noble grapes situated in the Bârzeşti-Ştefan cel Mare region (N46°4440,18; E27°3342,63), Vaslui county. These samples were marked with ‘B’. This studied parcel of 600 m2 was placed close to the house and no soil or leaves treatments were applied. The only agricultural practices were manual cutting and tying of vine shoots and digging.
  • A second set of grapes was collected from a vineyard parcel with a mixture of white grapes (Chasselas, Fetească, Busuioacă) situated in Pâhneşti-Arsura-Huşi (N46°4654,93; E28°0238,21), Vaslui county. These samples were marked with ‘H’. The studied parcel of 2300 m2 was located in a vineyard of around 90 ha, where mechanical ploughing and different treatments for soil and plant were applied. Only cutting and tying of shoots, as well as grapes harvests, were manually made.
The Vitis vinifera cv. and hybrid Nobles grapes were harvested (from the above mentioned areas) manually at their optimum point of maturity in good sanitary stage, in 2018. The grapes were transported from both harvest location to the processing point, in plastic boxes, weighted and evaluated for shape, size and health. Around 4 kg of each type of grapes (around 40 bunches each) were used for the must and winemaking procedure. The white grapes were split from bunches (the de-stemming) and the berries (1–2 g each) were evaluated manually for any visible defects before hand-crushing, the resulting juice being transferred in vessels for further analysis and winemaking (alcoholic fermentation). Around 2 L of wine, for each set, was obtained and bottled for maturation.

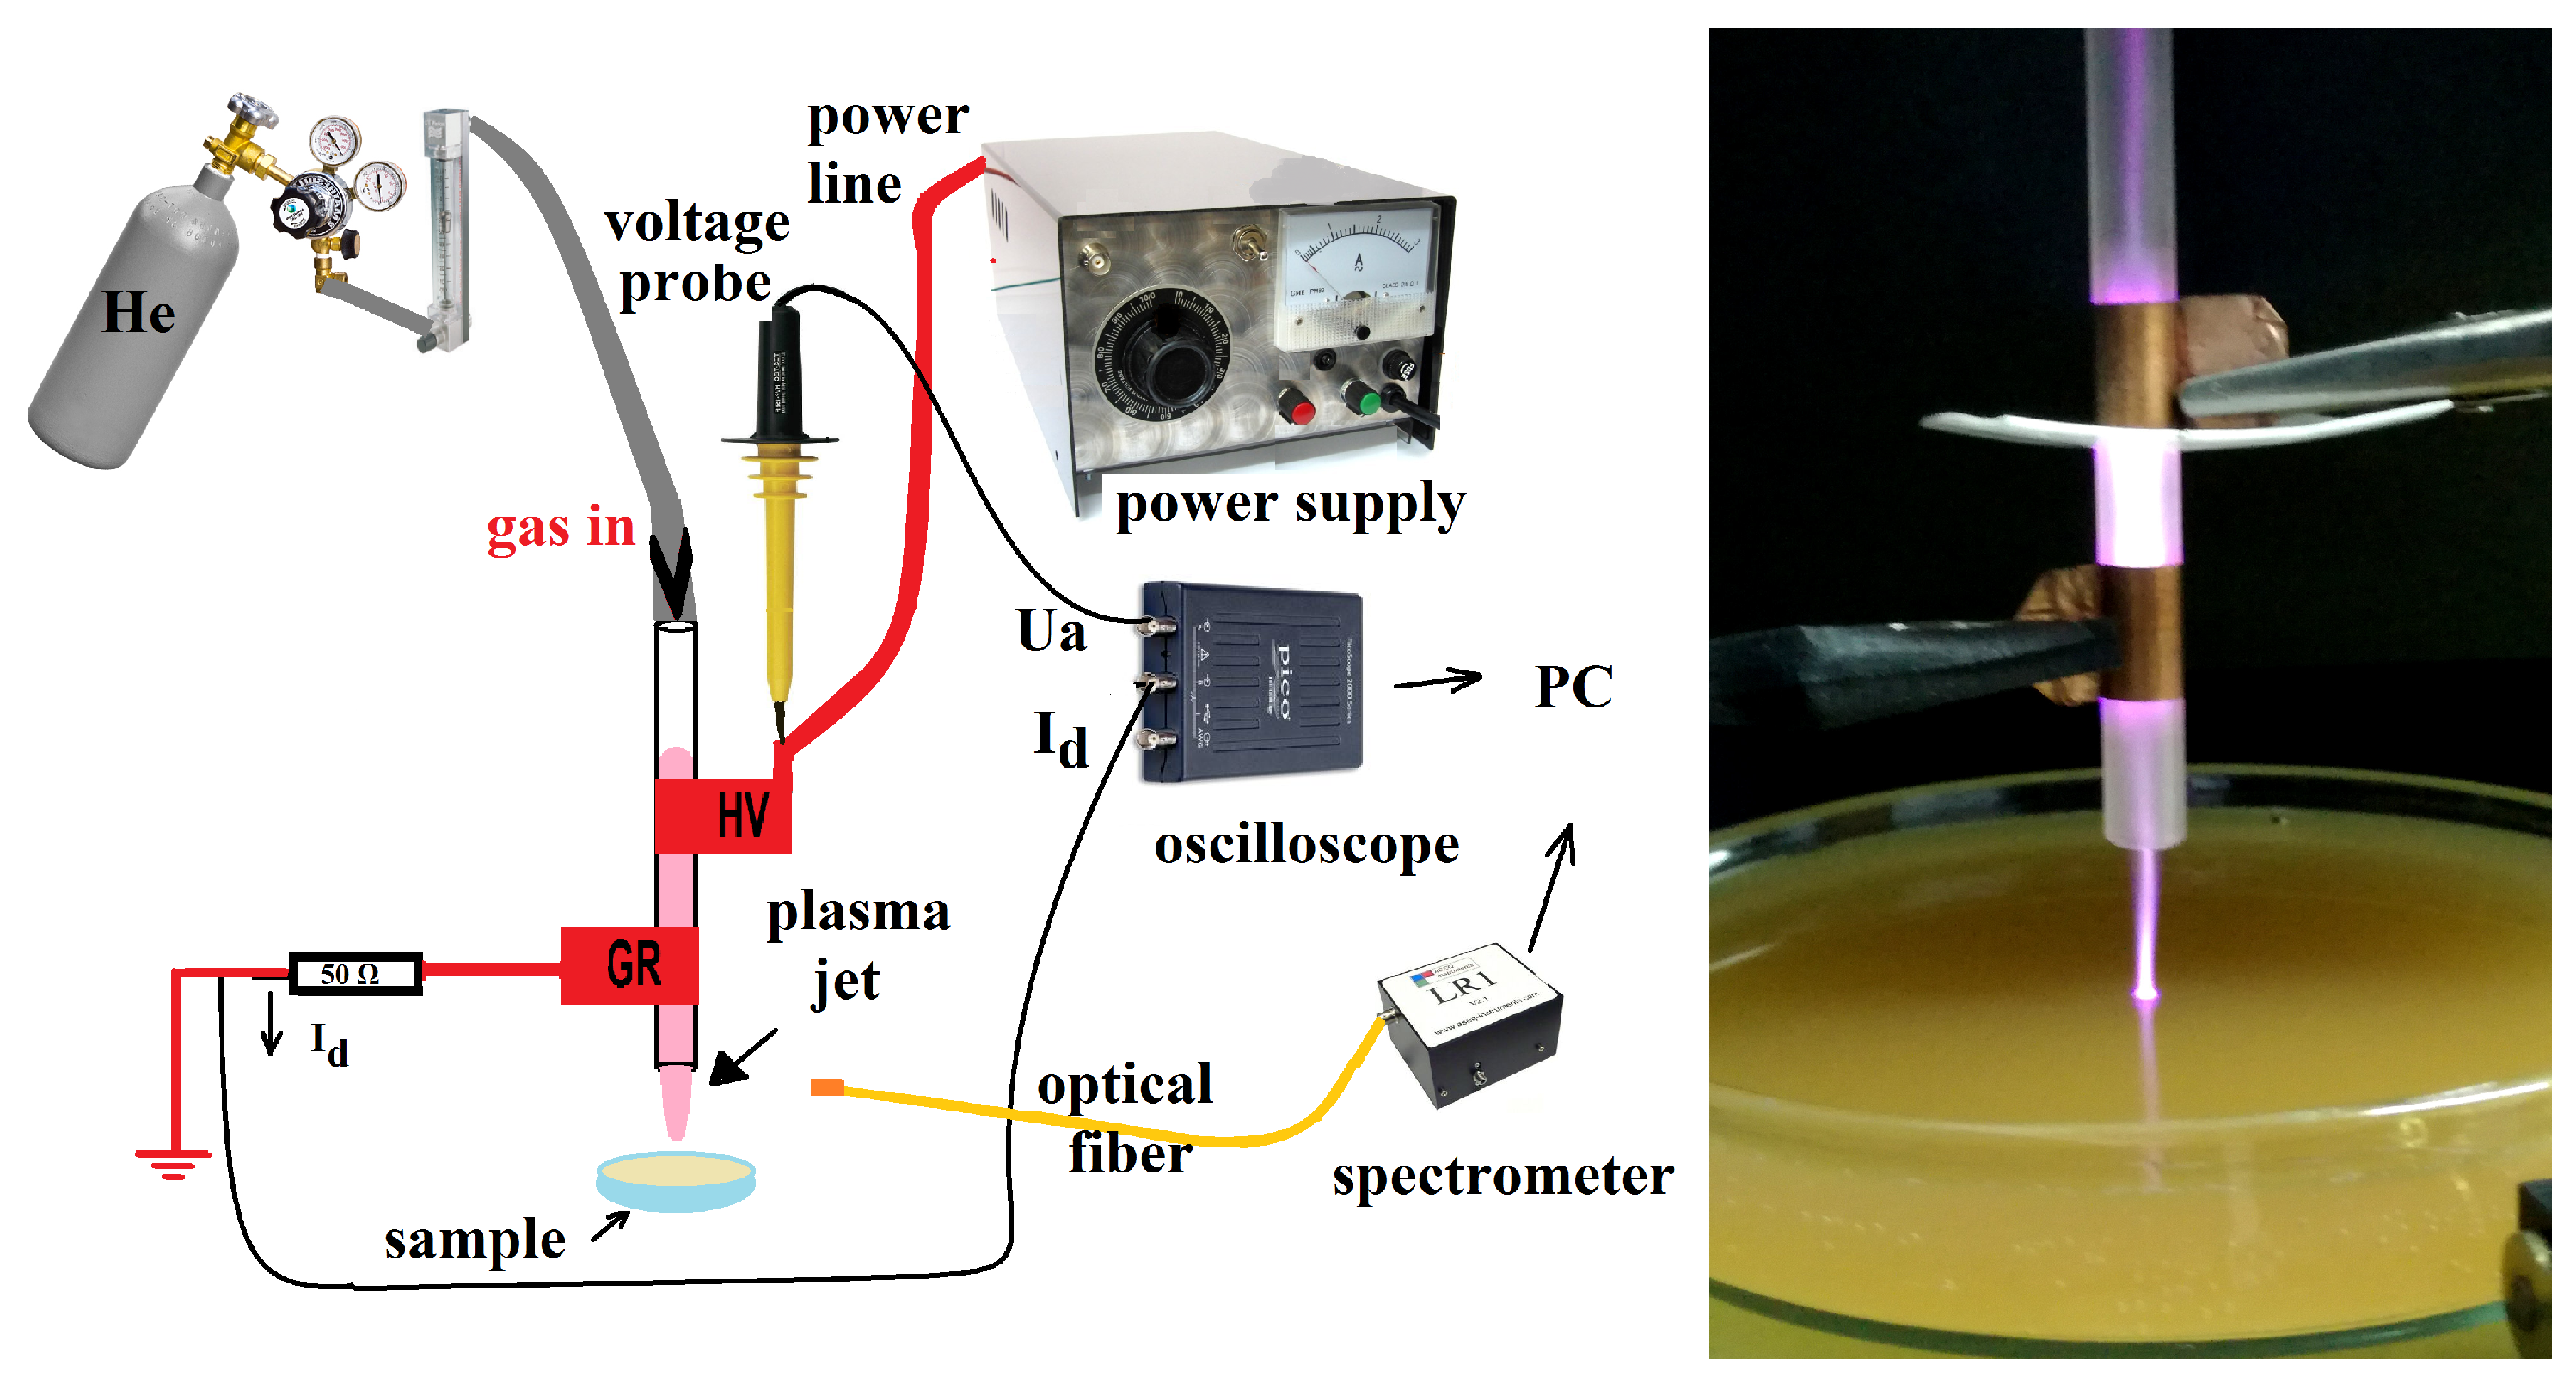
2.1. Plasma Source and Electro-Optical Diagnosis

The discharge configuration consisted of a 100 mm long quartz tube, with inner and outer diameter of 4 and 6.1 mm respectively, and two 10 mm long copper tape electrodes. One power electrode (HV) and a grounded electrode (Gr) were wrapped on the glass tube, with an electrode gap width of 10 mm, similar to that reported by [8,11,16]. The discharge was driven by a PVM500 plasma power generator (Information Unlimited) with independent voltage, current, and frequency adjustment: voltage 1–40 kV, frequency 20–70 kHz, output power 1–300 W. The applied sinusoidal voltage Ua (up to 16 kVpp, @ 50 kHz) and the total current of the discharge Id, were monitored using voltage and current probes (Testec HVP-15HF, Pico TA131, a 50 Ω resistor) and a 200 MHz digital oscilloscope (Picoscope 2208A, two channels, 1 GS/s, 8 to 12 bits resolution, function generator + AWG 1MHz). The working gas, supplied through the discharge tube, was pure helium (spectral helium, He 5.0, Siad Romania). The gas flow rate of 2 slm was regulated using a needle valve rotameter (Platon 0–5 slm NGVS312 series). Long exposure photos of the plasma interacting with samples were captured using a Canon 600D (18Mpx, 400–750 nm spectral sensitivity) and Tamron 18–200 mm Di II lenses; IR photos of plasma-surface interaction was captured using a FLIR TG165 camera (8–14 μm spectral range, ±1.5°). The spectral emission of the discharge in the UV-Vis-NIR range (200–1100 nm) was analyzed by using a ASEQ Instruments LR1 broad range spectrometer (monochromator with a 50 μm entrance slit, a 600 gr/mm diffraction grating blazed at 300 nm, and a CCD Toshiba TCD1304DG linear array detector, calibrated for Absolute Irradiation Measurements), via a 0.4 mm diameter and 1 m long optical fiber (for 200–1400 nm, kevlar reinforced, cosine corrected adapter, Thorlabs), placed at 5 mm from the plasma.
The must samples were plasma treated (marked from now on ‘PB’ and ‘PH’) as follows: 50 mL of must was placed in Petri dishes and treated for 3 min. The discharge tube was positioned centrally to the Petri dish (25 mm height, 150 mm diameter soda glass plate), 10 mm above the must level, as in Figure 1. The procedure was repeated for 750 mL, for the two sets of must samples (the one from Bârzeşti, respectively from Huşi). The control samples (marked with ‘MB’ and ‘MH’) were also placed in identical volumes in Petri dishes and kept for 3 min each outdoors.

2.2. Methods for Characterization of Must and Wine

Conventional wine analytical methods usually imply multidisciplinary approaches in order to rate wine quality and its authenticity. Just the official methods published in the OIV’s Compendium of International Methods of Analysis of Wines and Musts are commonly of use for verification purposes and settling disputes upon the true origin of the wine. These analytical methods for wine investigation involve the determination of: total and volatile acidity, total and free sulfur dioxide, alcoholic strength, ethanol origin by isotope ratio mass spectrometry (IRMS), ethanol deuterium distribution by nuclear magnetic resonance (NMR), volatile compounds by gas chromatography (GC), reducing substance, principal organic acid concentration by high-pressure capillary electrophoresis (HPCE) and mineral elements by inductive plasma atomic emission spectrometry (ICP-AES) [54,55,58,59,60].
Regulatory authorities also assess wine for the presence of artificial sweeteners or colorants, preservatives as well as fermentation inhibitors. In any case, OIV encourages member states to continue research in the areas of interest to avoid any non-scientific evaluation of results [54,55,58,59].
Spectroscopic methods, like Ultraviolet-to-Visible spectroscopy (UV-Vis) [61,62,63,64], Fourier Transformed Infrared spectroscopy (FTIR) [48,65,66,67,68,69,70,71] are also applied due to their easiness of use, cost-effective and no sample preparation also in combination with numerical/statistical methods (e.g., chemometric methods) [48,66,68,72,73,74,75].

2.2.1. The Ultraviolet (UV) to Infrared (IR) Spectroscopy

The advantage of the UV-Vis method is given by the low cost due to the simple samples preparation, mainly represented by a set of dilutions, as well as saving time. The UV-VIS spectroscopy is used to identify the polyphenolic groups (non-flavoids and flavoids) that are released from solid parts of the grapes (skin, seeds, stems) into the must during the winemaking process and ageing. The polyphenols are important due to their large attribute of sensory characteristic of wine as color, taste and aroma. The UV-Vis measurements are widely used combined with multivariate regression approaches to obtain the spectroscopic calibration for prediction of phenolic compounds in grape and wine. More advanced techniques as liquid chromatography and fluorescence spectroscopy can be also used to quantify the phenolic content but UV-Vis spectroscopy remains one of higher importance due its simplicity, availability and minimal sample preparation. The UV-Vis absorption spectroscopy complies with the ‘no sample pretreatment, fast and low-cost’ criteria and can be easily applied to the analysis of grapes and wines and the qualitative detection of phenolic composition. The absorption spectrum in the UV-Vis region may be even used as a fingerprint in wine discrimination. Most of the studies employing UV-Vis spectroscopy are based on absorbance values in a specific wavelength region in order to quantify classes of phenolic compounds and color characteristics [61,62,63,64,66]. Recently, Minute et al. [75] proposed alternative methods for studying the pinking alteration of white wines based on spectroscopic and color properties of wine.
Another technique, the mid-range Attenuated Total Reflectance-Fourier Transform Infrared spectroscopy (ATR-FTIR) spectroscopy has become a valuable tool in wine analysis since it has been successfully used not only to detect and quantify key wine compounds but also to classify wines and monitor their fermentation or aging process, being a rapid-usage and minimum waste-producting method [65,66,67,68,69,70,71,72,76,77,78,79,80]. Nowadays the FTIR technique is used even for authenticity and traceability of wine [48,69,73,81]. Most of the characteristic wavenumbers associated with functional groups found in wine samples, as reported in literature, are shown in Table 1. For the presented experiments, UV-Vis absorption spectroscopy (using a Thermo Scientific Evolution 300, 190–1100 nm wavelength range, 1 nm bandwidth, quartz cuvette of 10 mm path length). Deionized water was used as the baseline in the selected wavelength range.
An ATR-FTIR FT/IR4700 spectrometer (Jasco) was used for the vibrational spectroscopy measurements. The mid-range infrared spectroscopy using the Fourier-Transform attenuated total reflection mode unveiled the followings absorbance spectra of the pristine and plasma treated must. For these measurements, 50 μL of each wine sample was positioned in contact with the diamond crystal of the attenuated total reflectance IR interferometer. All FTIR spectra were recorded in the range from 500 to 4000 cm−1, at 4 cm−1 spectral resolution and 2 mm/s scan speed.The ATR crystal was carefully cleaned before each analysis, first with distilled water, then dried with soft tissue paper. Before each sample measurement, spectra of the clean and dry diamond against air were recorded and used as background. Each FTIR spectra was averaged from 54 scans. All measurements were performed in triplicate.

2.2.2. The Colour of the Wine and Its Colour Space Parameters (CIELab)

Wine is a product that can be described nowadays both as a commodity but also as a luxury, depending on its marketing price. Moreover, wine is a complex mixture of water and ethanol (as major components), and glycerol, aliphatic and aromatic alcohols, phenols, sugar, salt or organic acids (as minor components). That being said, the concentration of these minor components is of great importance for the quality and preferences classification from the industry and consumers point of view. Nonetheless, the color of wine is one of the first parameters evaluated by consumers and contributes, as well, to the wine’s quality perception and acceptance. The color is mainly due to the phenols in the wine [82]. More, even the tasting of these beverages is strongly influenced by wine color, in the detriment of other sensorial parameters (temperature, aroma). Furthermore, the study of wine color is a must, bearing in mind that it is relative easy to be done. Nevertheless, many techniques are being used, even if some standardized methods are accepted by the OIV.
Through colorimetry we have the possibility to define every color as a combination of three values, mainly known as color coordinates. Moreover, in the fields of enology the determination of the color spaces of liquid samples is of great importance, therefore being widely applied. For example, researchers evaluate color using the CIE L*a*b* model of organic dyes and colorants and pH indicators, and enologists analyze the color of beverages (wine and spirit) samples.
The color is one of the most fundamental descriptors of wine, an attribute to which viticulturists and wine producers offer all their attention for growing grapes and winemaking. Due to different people’s visual perception of wine color during tasting or organoleptic examination, a measurement of color was proposed by the Commission Internationale de l’Eclairage (CIE) and the OIV described the procedure as the one which offer the largest amount of information [83]. The CIE defines 3D graphs of all colors that humans can see, as a Cartesian coordinate system defined by three colorimeter coordinates L* (lightness, from 0 –black to 100-white), a* (redness/greenness, positive values for reddish and negative for greenish) and b* (yellowness/blueness, positive for yellowish and negative for bluish) [83,84,85,86], along parameters as chroma ( C a b * ), angular hue or tone (H*), color intensity (C.I.), hue, color difference ( Δ E a b * ) and whiteness index (WI). Furthermore, chroma is the quantitative characteristic of colorfulness that enables the characterization of differences in the grey color between samples with the same lightness for each hue. Moreover, hue is regarded as the qualitative attribute of color, being the parameter from which colors are traditionally defined, e.g., blueish, pinkish, reddish or yellowish. It is the peculiarity that specifically allows a color to be differentiated from a grey color with the same lightness. The most used mathematical relations, accepted by OIV, for the chromatic characterization of wine samples are included in the system of Equations (1).
L * = 116 f ( Y / Y n ) 16 a * = 500 [ f ( X / X n ) f ( Y / Y n ) ] b * = 200 [ f ( Y / Y n ) f ( Z / Z n ) ] C a b * = ( a * 2 + b * 2 ) 0.5 H * = t a n 1 ( b * / a * ) C . I . = A 420 n m + A 520 n m + A 620 n m h u e = A 420 n m / A 520 n m Δ E a b * = [ ( Δ L * ) 2 + ( Δ a * ) 2 + ( Δ b * ) 2 ] 0.5 W I = 100 [ ( 100 L * ) 2 + ( a * ) 2 + ( b * ) 2 ] 0.5
The absorbance spectra were measured with a spectrophotometer, using a 1 cm path length rectangular cell. Measurements were taken every 1 nm between 200 and 1000 nm. Distilled water was used as the blank. From the absorption spectra, the rectangular coordinates L* a* b* and the cylindrical coordinates CIE C a b * and H* were calculated using CIE method, as well as the color intensity (C.I.), the hue, Delta E ( Δ E a b * ) and the whiteness index (WI) values, like in [47,49,59,82,86,87,88], presented in equations 1.
Once the transmittance spectra of the wine samples were recorded, the color coordinates were obtained by applying mathematical treatment (according to OIV and CIE). Based on these mathematical formulas (described previously in equation system (1)) Delgado-Gonzalez et al. [83] proposed an easy-to-use model using Microsoft Excel. These values of the color parameters obtained using the Delgado-Gonzalez et al. method were plotted in color graphs.
The wine color is given by the phenolic compounds and depending of their quantity the color can be: white, white-greenish, white-yellowish, yellow, yellow-golden, pink, pink-purplish, purple, red, red-purplish, red [82].
Usually, the white wine phenols that are responsible for browning (color changing of the wine) are the flavonoid catechins (such as: epicatechin, gallocatechin, and catechin) as well as the non-flavonoid cinnamic acid derivatives (like caftaric acid, coutaric acid or fertaric acid). The non-flavonoid phenols are known to be the primary phenols in white wine. In these beverages the oxidation followed by polymerization results in the development of a golden brown color [87].

2.2.3. The pH Value, Brix and Potential Alcohol of Must and Wine

As general rule, winemakers should keep the pH under recommended ranges and the correction by adjusting free sulfur dioxide should be made quickly because pH plays an important role in the form of SO2 which inhibits microorganisms. The management of acidity is very important for wine stability and hence for its quality.
The wine pH values usually range from 2.8 to 3.8. Lower pH 2.8–3.2 ensures the pleasant refreshing taste of wine and the bright color, the wines are easily clarified and are resistant to microorganisms. The low-value pH wine will taste tart/sour, owing to the higher acid concentration. Higher pH values (>3.5) affect the wine quality [82]. High pH values for a grape juice make it less stable to oxidation and microbial spoilage and gives it a flat and unbalanced taste while musts with low pH (naturally occurring or after acid adjustment) require less SO2 quantity to control the native flora and to ensure the onset of a desired fermentation [89].
The pH measurements of the pristine and plasma treated samples were performed via a PH-009(I)A Series pen pH and Temperature Tester, the measurements being taken at 20 °C.
Brix testing plays a huge role in determining when grapes are at their highest sugar content and suitable for harvest. Furthermore, Brix measurements can also be used with other forms of produce for determine the mineral, protein or amino acid concentration of the plant. Determination of carbohydrates in the samples was performed using the Abbe type refractometer, by determining the refractive index. The reading was made for the Brix index (the unit of measurement of carbohydrates in an aqueous solution), and the conversion was done with the help of a table of transformation in grams of carbohydrates / L: 1 Brix = 10.04 g/L measured at 20 °C.
The Brix determination was made by using a portable refractometer (RWN10-ATC, Czech Republic) with five scales: 5–22% VOL (±0.2%); 10–37° ČNM (±0.5°); 0–30° KMW (±0.5°); 0–150° Oe (±1°); 0–35° Bx (±0.5°).
The potential alcohol/densitometry determinations were made by using a glass glucometer (GUYOT glucometer, three thermometer bench scales: sugar 0–30, alcohol 0–20% VOL, Baume 0–18°, Enolandia) and a vinometer (0–25 % VOL, Enolandia). The pH, Brix and alcohol measurements were made in in triplicate, the values being expressed as mean ± standard deviation (SD).
The formula used for estimating the potential alcohol (pa) from Brix measurements [59,87,90] of the untreated and plasma treated must samples, is usually referred to: pa (% v/v) = 1000(sgi-1.0)/[7.757.75-3.75(s3.75(sgi-1.007)], where sgi is the initial specific gravity of the must.
Moreover, according to OIV International Standard for the Labelling of Wines, (Edition 2015) [58], depending on their sugar content, table and quality wines are divided into:
  • dry, with a sugar content of up to 4 g/L but not less than 2 g/L;
  • medium-dry, with a sugar content between 4.01 g/L and 12 g/L, but can go up to 18 g/L;
  • mellow or semi-sweet, with a sugar content above 18 g/L and up to 45 g/L inclusive;
  • sweet, with a sugar content of more than 45 g/L.

3. Results and Discussion

This section is divided into two subheadings (one dedicated to plasma source characterization-Section 3.1 and the second dedicated to the characterization of must and wine-Section 3.2) and provides to the reader a concise and precise description of the experimental results as well as their interpretation.

3.1. Plasma Source Electro-Optical Characterization

Plasma diagnosis methods, applied to low-temperature and atmospheric pressure, are usually related to the measurement of the applied voltage and the discharge current, the estimation of the average electric power of the discharge, but also the acquisition of the light emitted by the plasma and the identification, as well as interpretation of the excited species from the discharge.

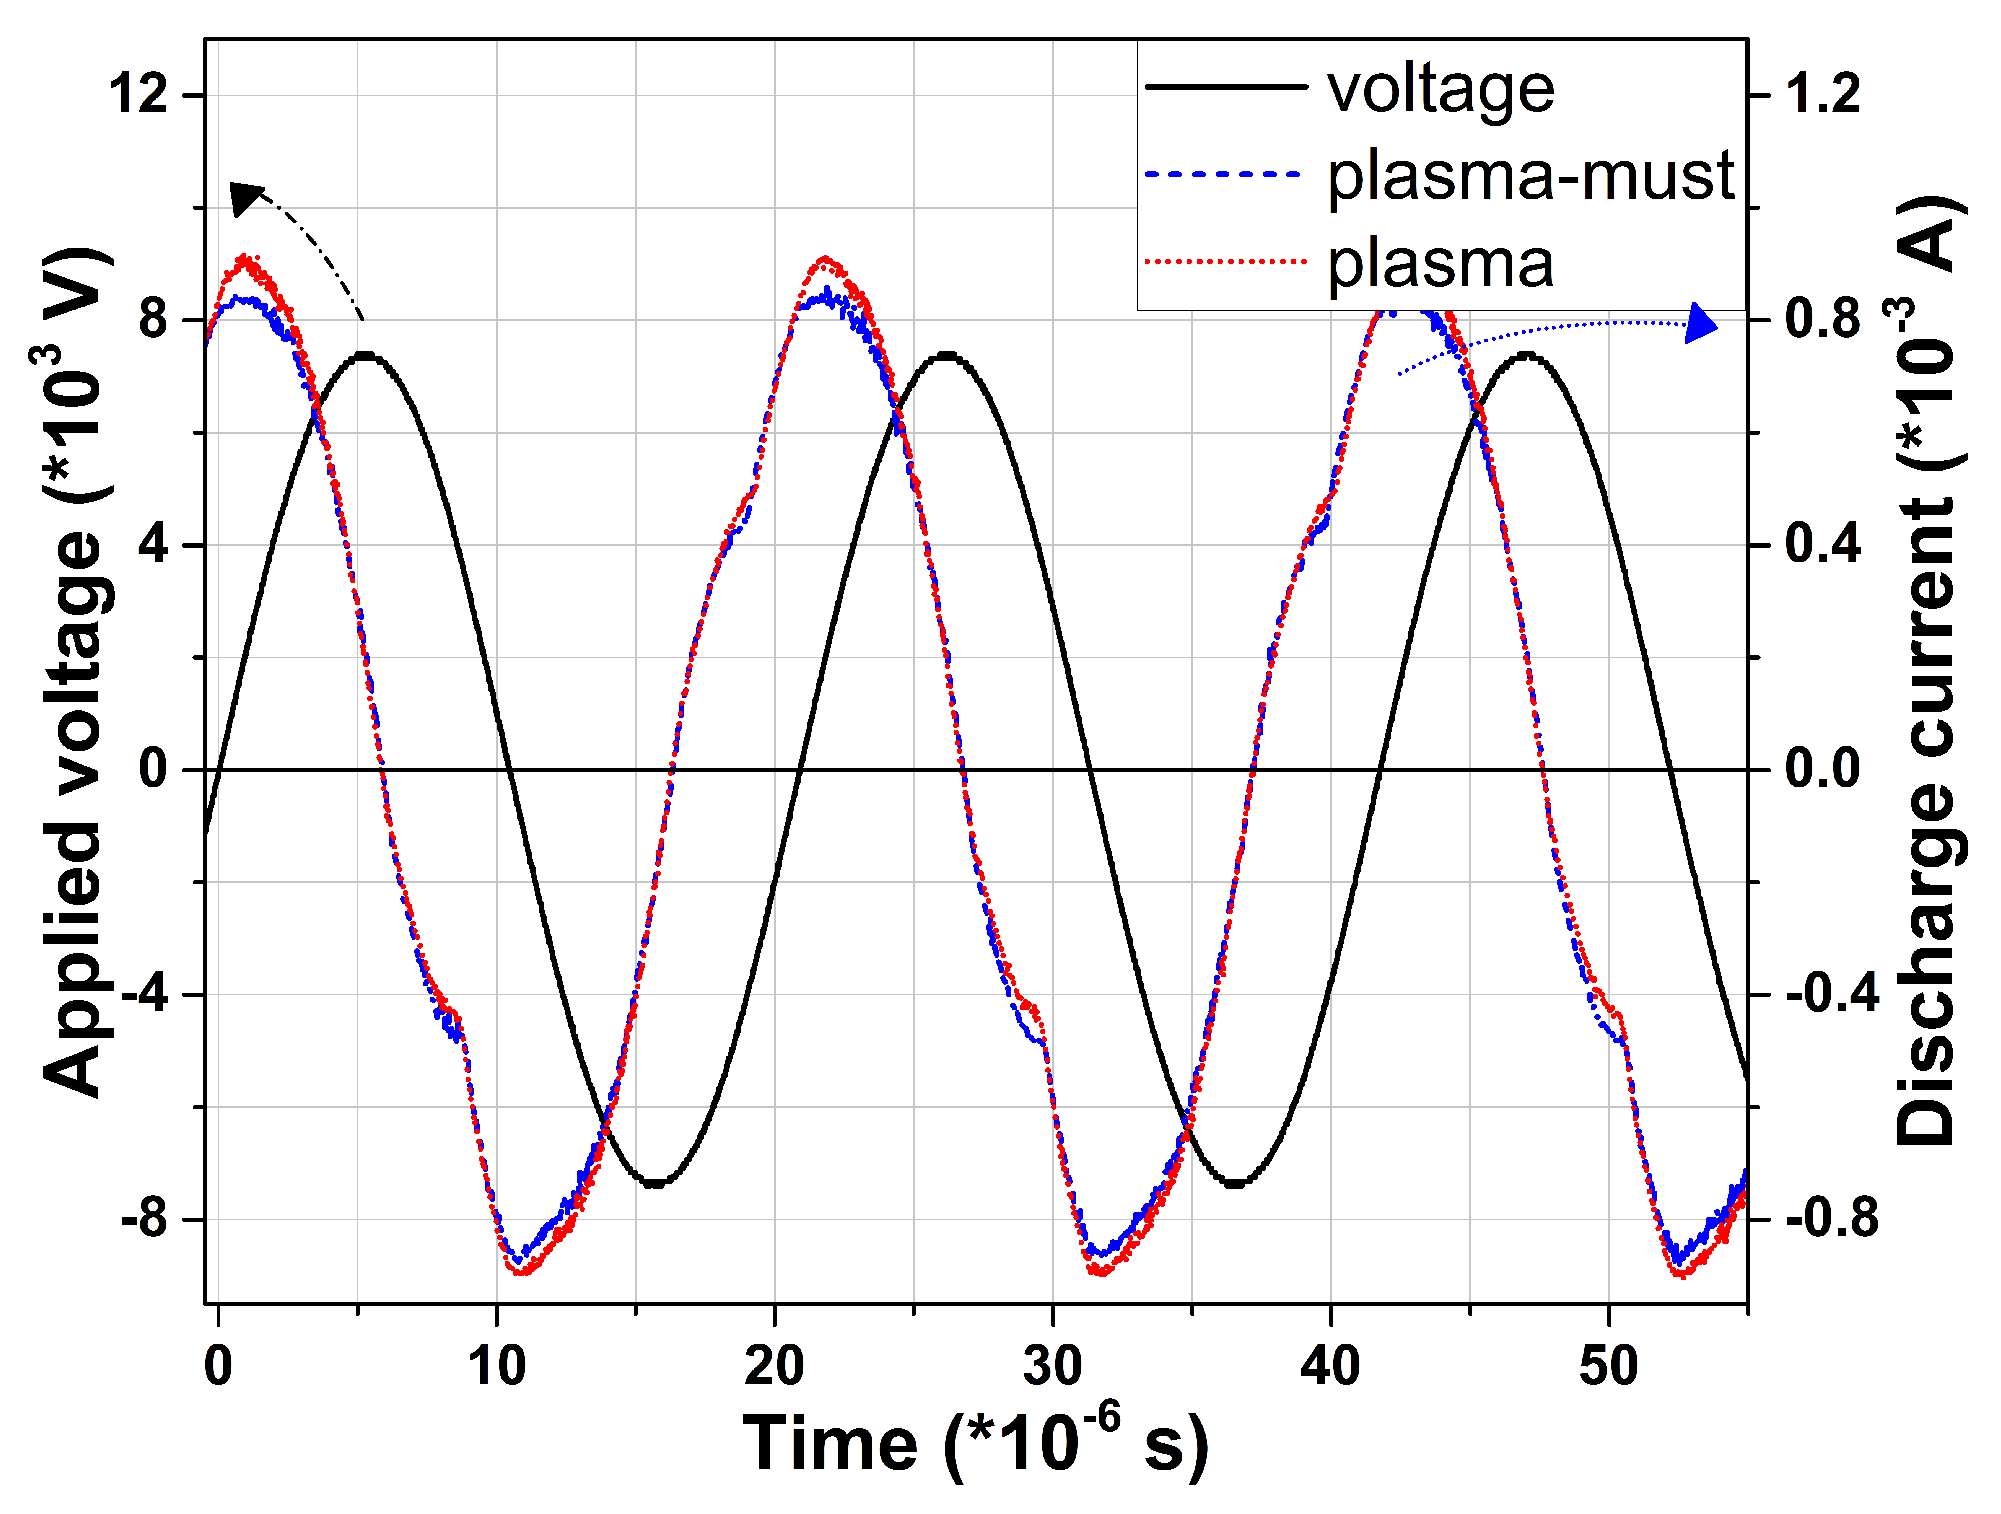
3.1.1. Plasma Source Electrical Diagnosis

The electric characterization of the plasma was related in this study to the applied voltage, discharge current waveform visualization and power estimation. Typical waveforms are shown below in Figure 2.
The applied voltage on the discharge electrodes was around 16 kV peak-to-peak with a corresponding discharge current in the order of 0.8–0.9 mA (with a total charge of 1 nC per cycle), at a repetition frequency of 48 kHz. The average dissipated electrical power, estimated by integrating over one cycle the applied voltage times the discharge current [91], was in the range of 7–8 W (or a energy of up to 0.5 mJ). The estimated power density was in the 200–300 W/cm2 range, while the energy dose (a specific energy = energy per treated area in cm2) was between 4.6–6.6 mJ/cm2.
Minor changes were observed in the discharge current waveform between the He-appj operating in mid air (the red-dotted line) or interacting with the white grape must (the blue-dashed line), as depicted from Figure 2. Insignificant differences were to be seen in the current waveforms of plasma-Bârzeşti-must and plasma-Huşi-must.
Our plasma source mean electrical power, around 8 W, was close to the values reported by Guo, Lukic, Nishime, Pankaj and Sarangapani (2–20 W) [26,36,92,93,94], but lower than 20–50 W as reported by Starek, Mujahid, Wang [38,95,96], or less than 50–200 W as reported by Bao, Pan, Zhao, Xiang, Laurita, Sainz-Garcia [29,40,41,43,97,98], and even far less than 300–750 W as reported by Ashtiani, Huang, Fan, Jambrak, Zhou [30,42,44,99,100]. The higher the dissipated plasma power got, the higher the possibility of thermal treatment of the sample was. Our appj source (up to 10 W) ensured relatively low temperature of discharge, as will be discussed in the following paragraph.

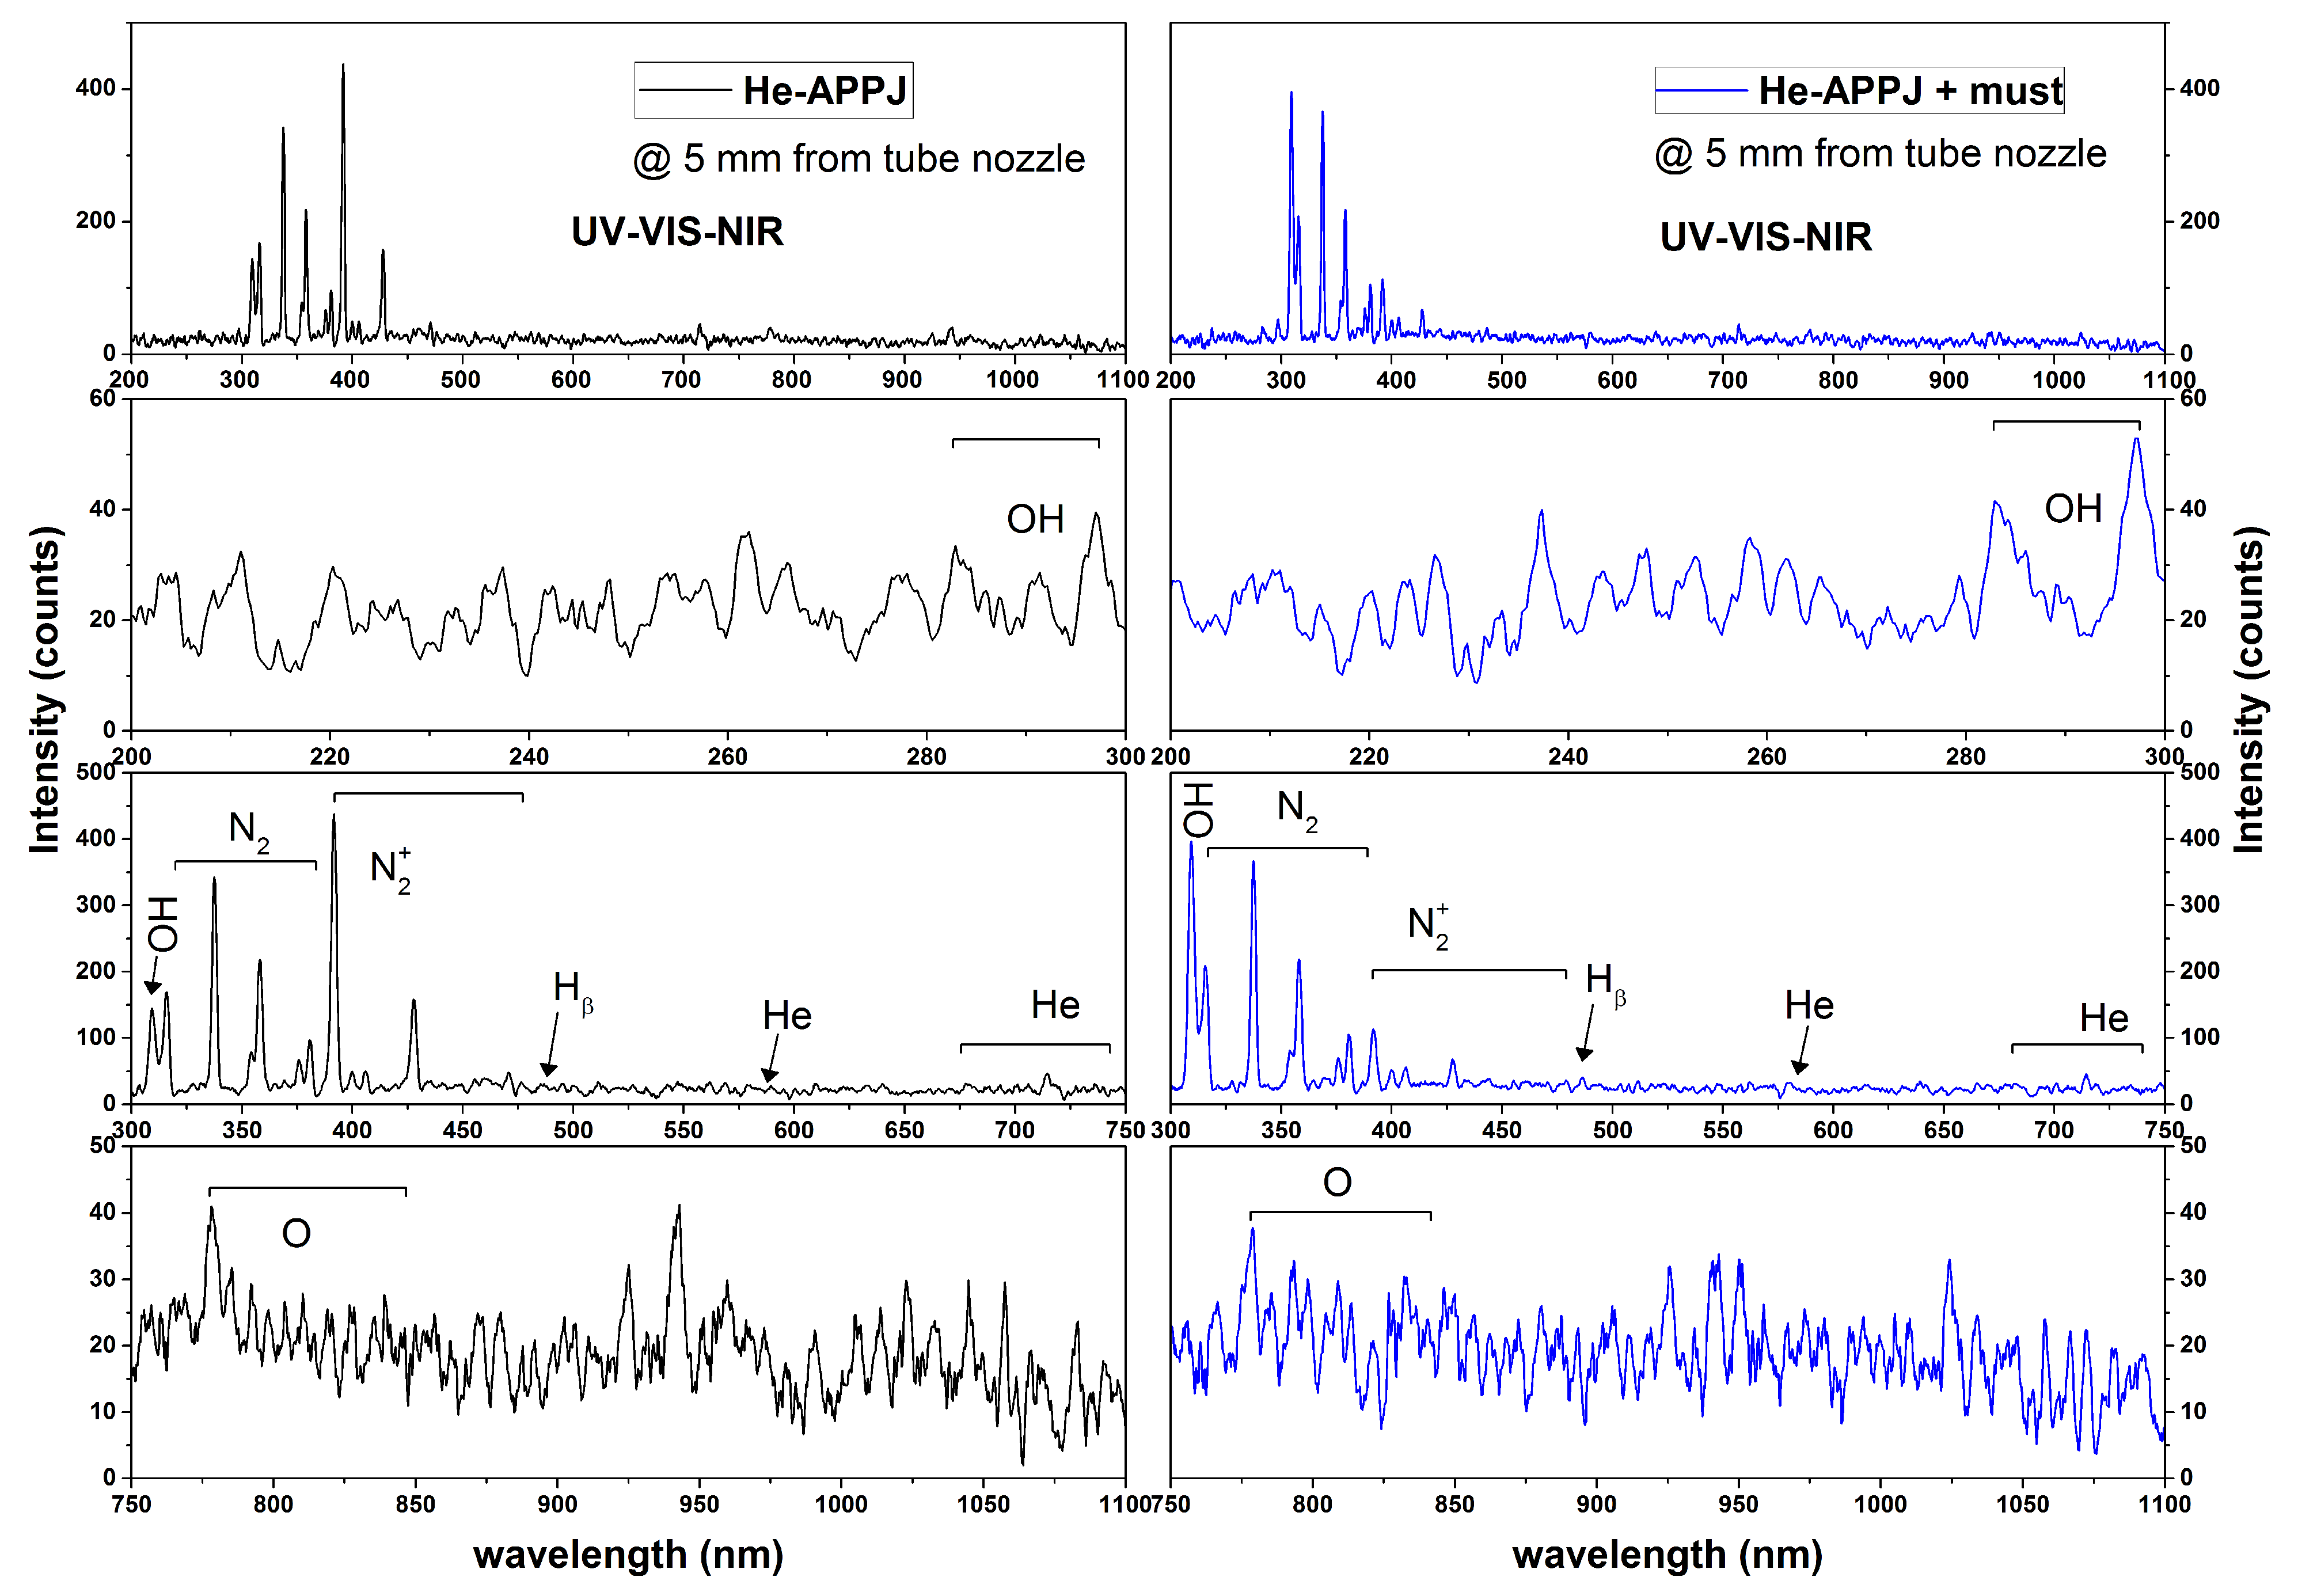
3.1.2. Plasma Source Optical Diagnosis

The Optical Emission Spectroscopy (OES) characterization of the plasma source in mid-air, as well as the OES spectra at the interface plasma-must are presented in in Figure 3.
Emission spectra shown in the plasma emitted light graphs, in the UV-Vis-NIR range (200–1100 nm) of the plasma jet (at 5 mm from the discharge tube nozzle) contained signatures of atomic and molecular excited species. The molecular bands, present in the low wavelength region, were assigned to hydroxyl radicals, neutral nitrogen molecules and nitrogen molecular ion.
The OH radical presented signatures between 306–310 nm. Bands of the molecular nitrogen ( N 2 ) were seen between 315–380 nm and 399–405.9 nm. The nitrogen molecular ions ( N 2 + ) had bands at 391.4 nm, 427.8 nm and 470.0 nm. The generation and excitation of N 2 (the second positive nitrogen system) and N 2 + (first negative nitrogen system) were based on the Penning effect of He metastability. Around 486 nm the atomic line corresponding to the emission of H β was observed. Atomic lines were assigned to helium atoms (lines at 588.8 nm, 668.5 nm, 706.6 nm and 727.5 nm), as working gas, and to oxygen atoms (lines at 777.8 nm and 845.5 nm) as products of ambient O2 and H2O dissociation [8,11,16,21,101,102].
The presence of other excited species beside the working gas-He, suggests that these reactive oxygen and nitrogen species (RONS) can and will participate in the white grape must sample treatment. Moreover, the importance of some plasma active species changed in the case of interaction with must, as seen in the third line (300–750 nm range). More precisely, it was about the changes regarding the intensity of the hydroxyl radical bands, of the bands of nitrogen molecules as well as of the bands of molecular nitrogen ions. In the case of He-appj running in mid air, as also reported in the literature for such discharges, the bands of molecular nitrogen ions were important in intensity in the emission spectrum, often being used to normalize the entire spectrum for further spectroscopic analyses [8,11,16,21,91]. Thus, as seen in Figure 3, for appj in air, the highest intensity was attributed to the molecular nitrogen ion band, centered at 391 nm. It was followed by the intensities of the molecular bands of nitrogen (337 nm, 357 nm, 315 nm), respectively of the band corresponding to the OH radicals (308 nm). The normalized intensities can be quickly followed in Table 2. In the case of He-appj in interaction with the must, the OES spectra revealed different distribution of intensities of lines and bands. More precisely, the most intense band was now attributed to OH radicals (at 308 nm), followed by the bands of molecular nitrogen (337 and 357 nm). These intensity changes of plasma excited species can be seen and followed both in Figure 3 and Table 2.
We further used the optical emission spectroscopy, which allowed the estimation of rota-vibrational temperatures, as well as the identification of radiating species in the discharge volume. In Figure 3, an overview of the emission spectrum in the range between 200 and 1100 nm is shown. It can be seen that for the appj in mid air (Figure 3 left side graphs), nitrogen dominated the emission spectrum of the plasma as an essential element in ambient air resulting in peaks at 315, 337, and 357 nm, which were in the so called UVA region (315–400 nm). In addition, smaller peaks were found in the UVB region (280–315 nm), attributed to OH radicals bands. Below 280 nm, no radiation was observed and, thus, we can say that no UVC radiation was emitted by the studied plasma source. For the case when plasma met the must (Figure 3 right side graphs), the dominant peaks were found around 308 nm, corresponding to OH radicals, in the UVB region. Smaller peaks of molecular nitrogen and molecular nitrogen ions were found (at the same peaks wavelengths) in the UVA region. Again, no significant lines/bands were identified in the UVC region (bellow 280 nm).
Since atmospheric pressure plasma treatments are usually seen as oxidative methods, and due to the fact that phenols (the main component of white wines) are the primary support for oxidation, it is reasonable to understand the importance of knowing the plasma RONS and the changes in the UV-Vis absorption spectra of wine. Besides plasma reactive species, another important parameter in plasma treatment of matter is the plasma temperature. Since the studied plasma source is at atmospheric pressure, working in gas flow, it is easy to assume that this is a non-thermal plasma, meaning that the temperature of the electrons differs from the temperature of the ions, and that of the neutrals. In this context, of the electric discharges characteristic temperatures, it is interesting to determine these values in order to understand how these plasmas can interact with matter. Moreover, using simulation software like Lifbase [103] and Spectrum Analyzer [104], we determined, from the acquired plasma emission spectra, the characteristic plasma temperatures, such as: the rotational temperature of OH radicals, the rotational temperature of nitrogen molecular ions N 2 + , the vibrational temperature of nitrogen molecules N 2 . Then, a spot thermal camera (FLIR TG165, pointed onto the surface of the must during the plasma treatment) and k-type probe thermocouple (placed bellow as well as in the Petri dish, via a PeakTech 3415 USB DMM digital multimeter) were used for monitoring the plasma gas temperature as well as the surface temperature in front of the plasma (Table 3).
As can be observed from the temperature values estimated through spectroscopic measurements, the rotational temperature of hydroxyl radicals and nitrogen molecular ions, which is often attributed/equaled to the gas temperature in many plasma sources reported in literature (especially DBD based sources), was determined to be 340–355 K (66 to 80 °C). These values corresponded to a ’spectroscopic temperature’ meaning energies that those plasma species (OH and N 2 + ) could achieve and could be used in the plasma environment to initiate various physico-chemical reactions/processes that could take place on the surface or in the plasma volume.
The gas temperature of the gas/liquid in interaction with the plasma was measured, the values being around 35–40 °C (±1.5 to 3 °C). The temperature during plasma treatment of must did not exceed 40 °C, so no thermal treatment (temperature above 80–85 °C that could induce thermal pasteurization) of the must proteins and all other must components was made [26,107].

3.2. Characterization of White Grapes Juice and Wine

This section is intended for the characterization of white grapes juice and wine. Spectroscopic methods of investigation such as UV-Vis and ATR-FTIR, as well as colorimetric and other physio-chemical methods (pH, Brix).

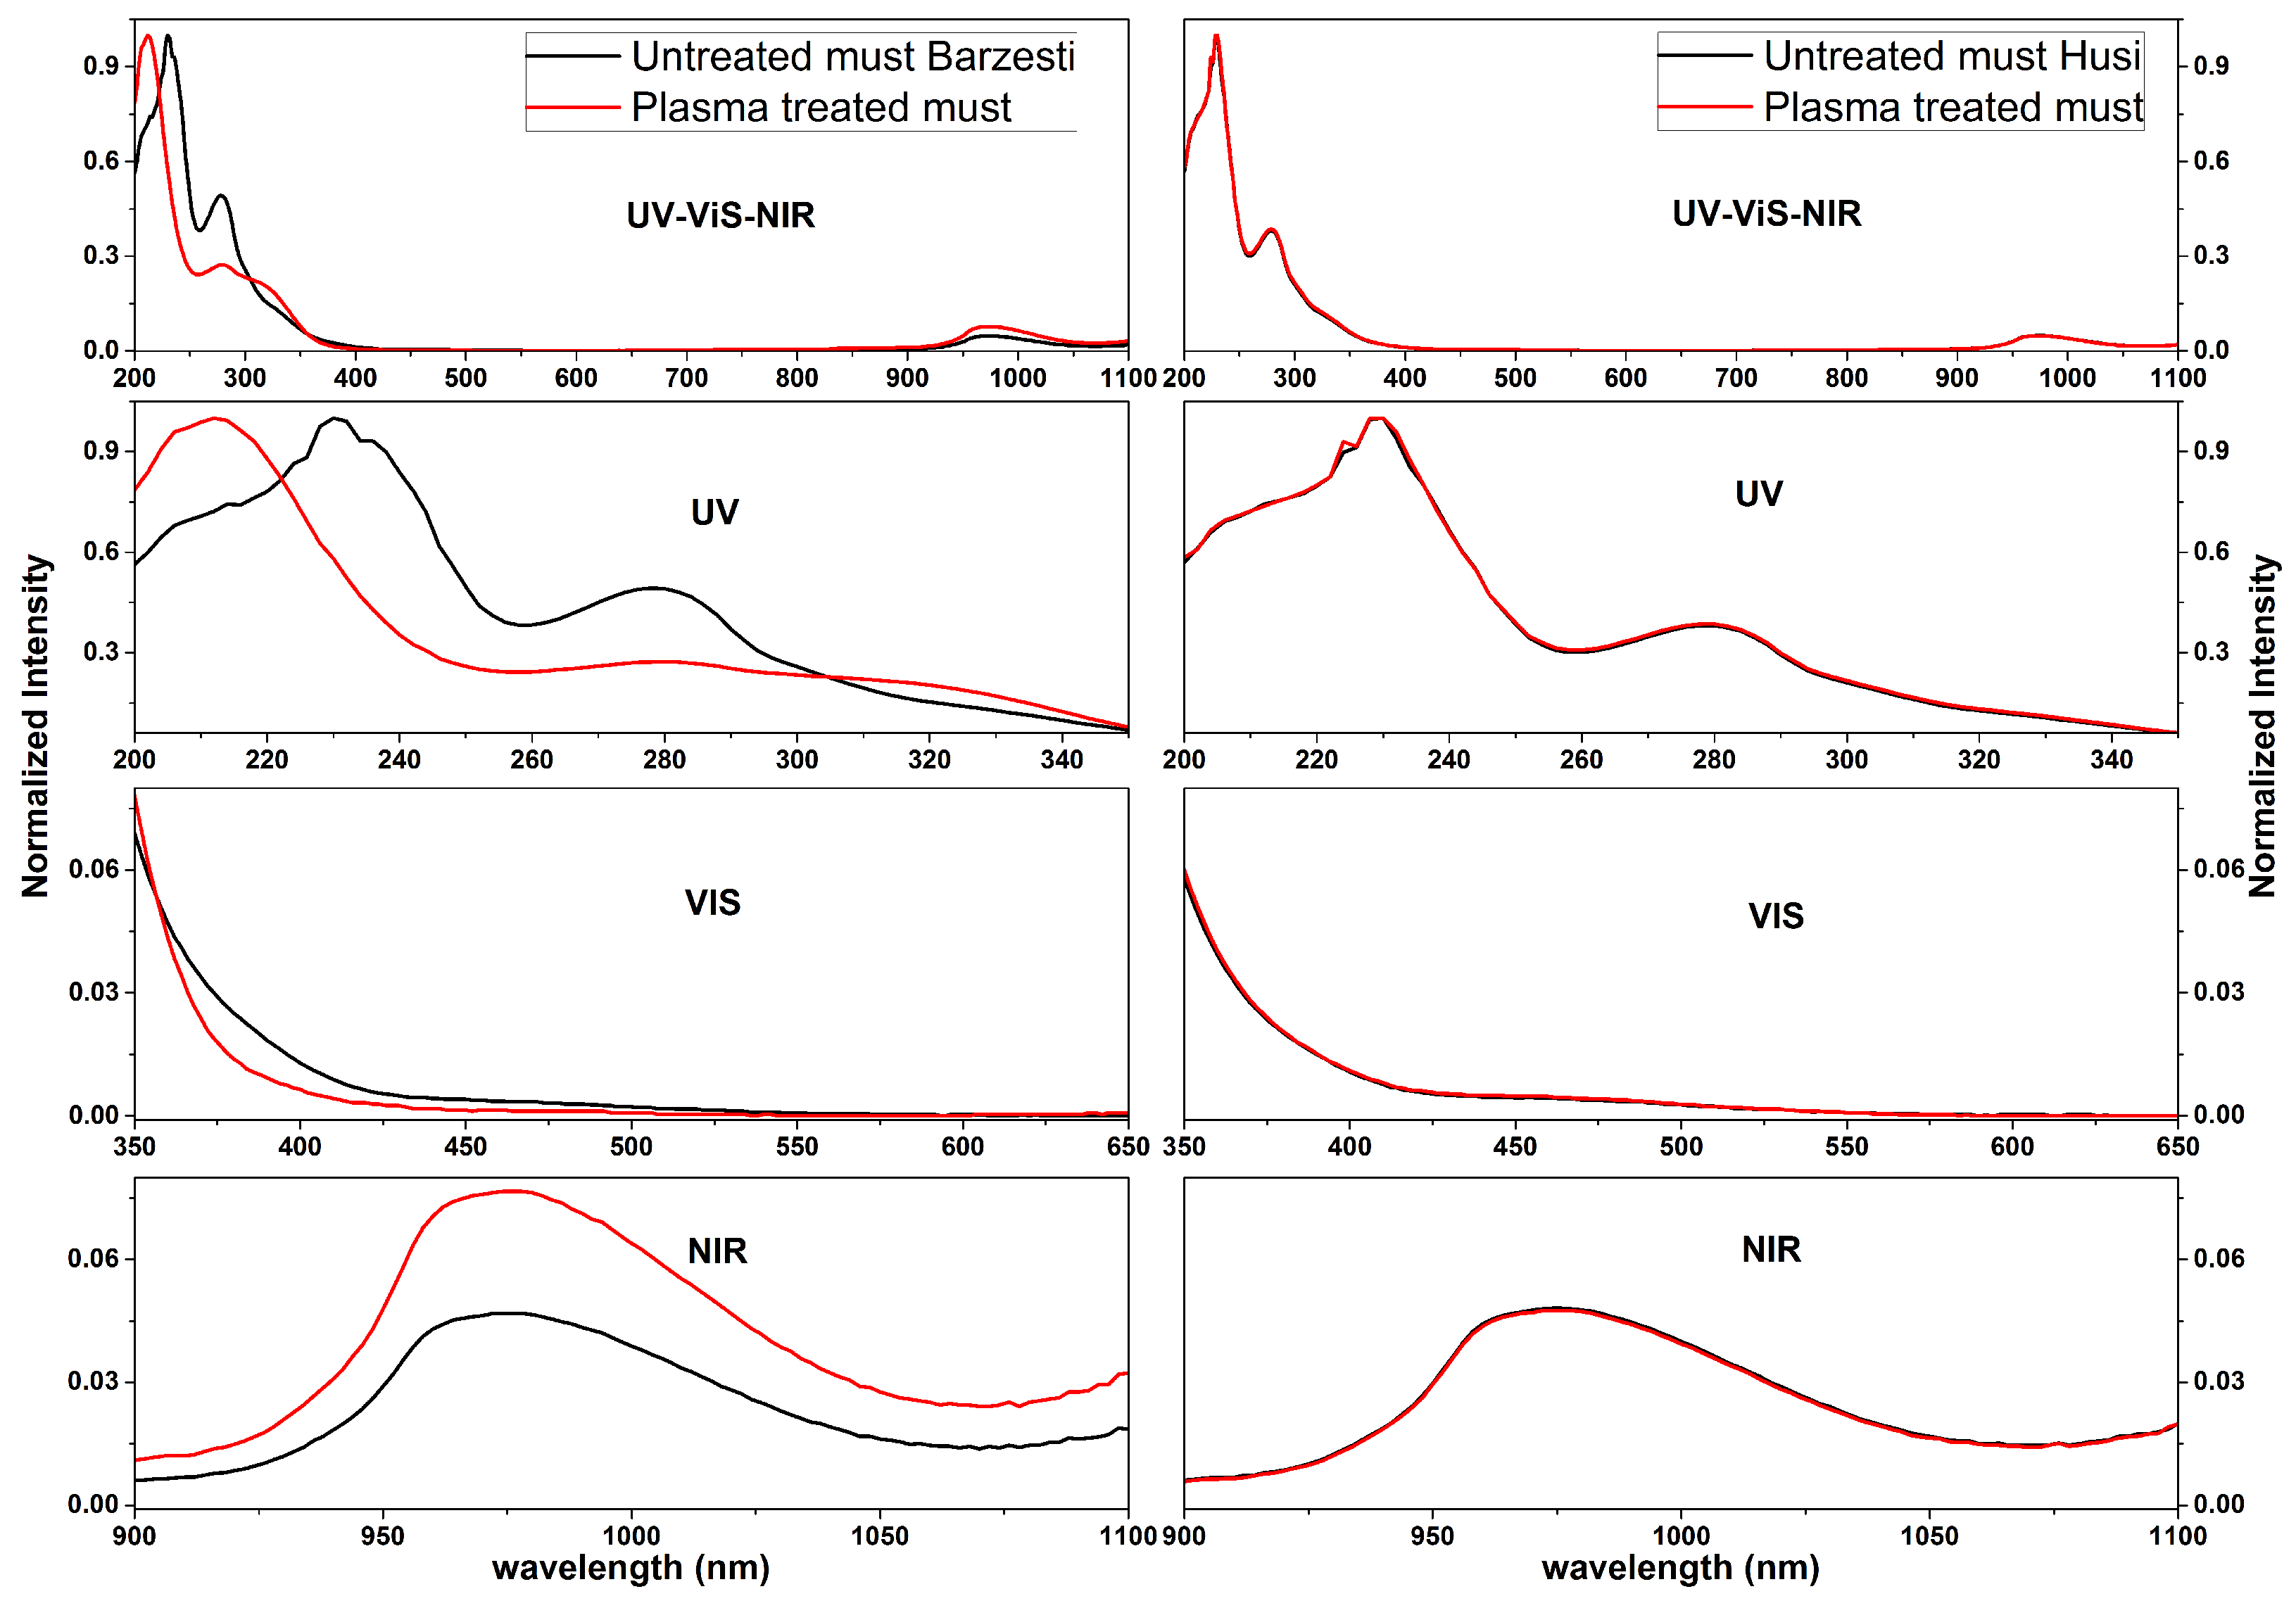
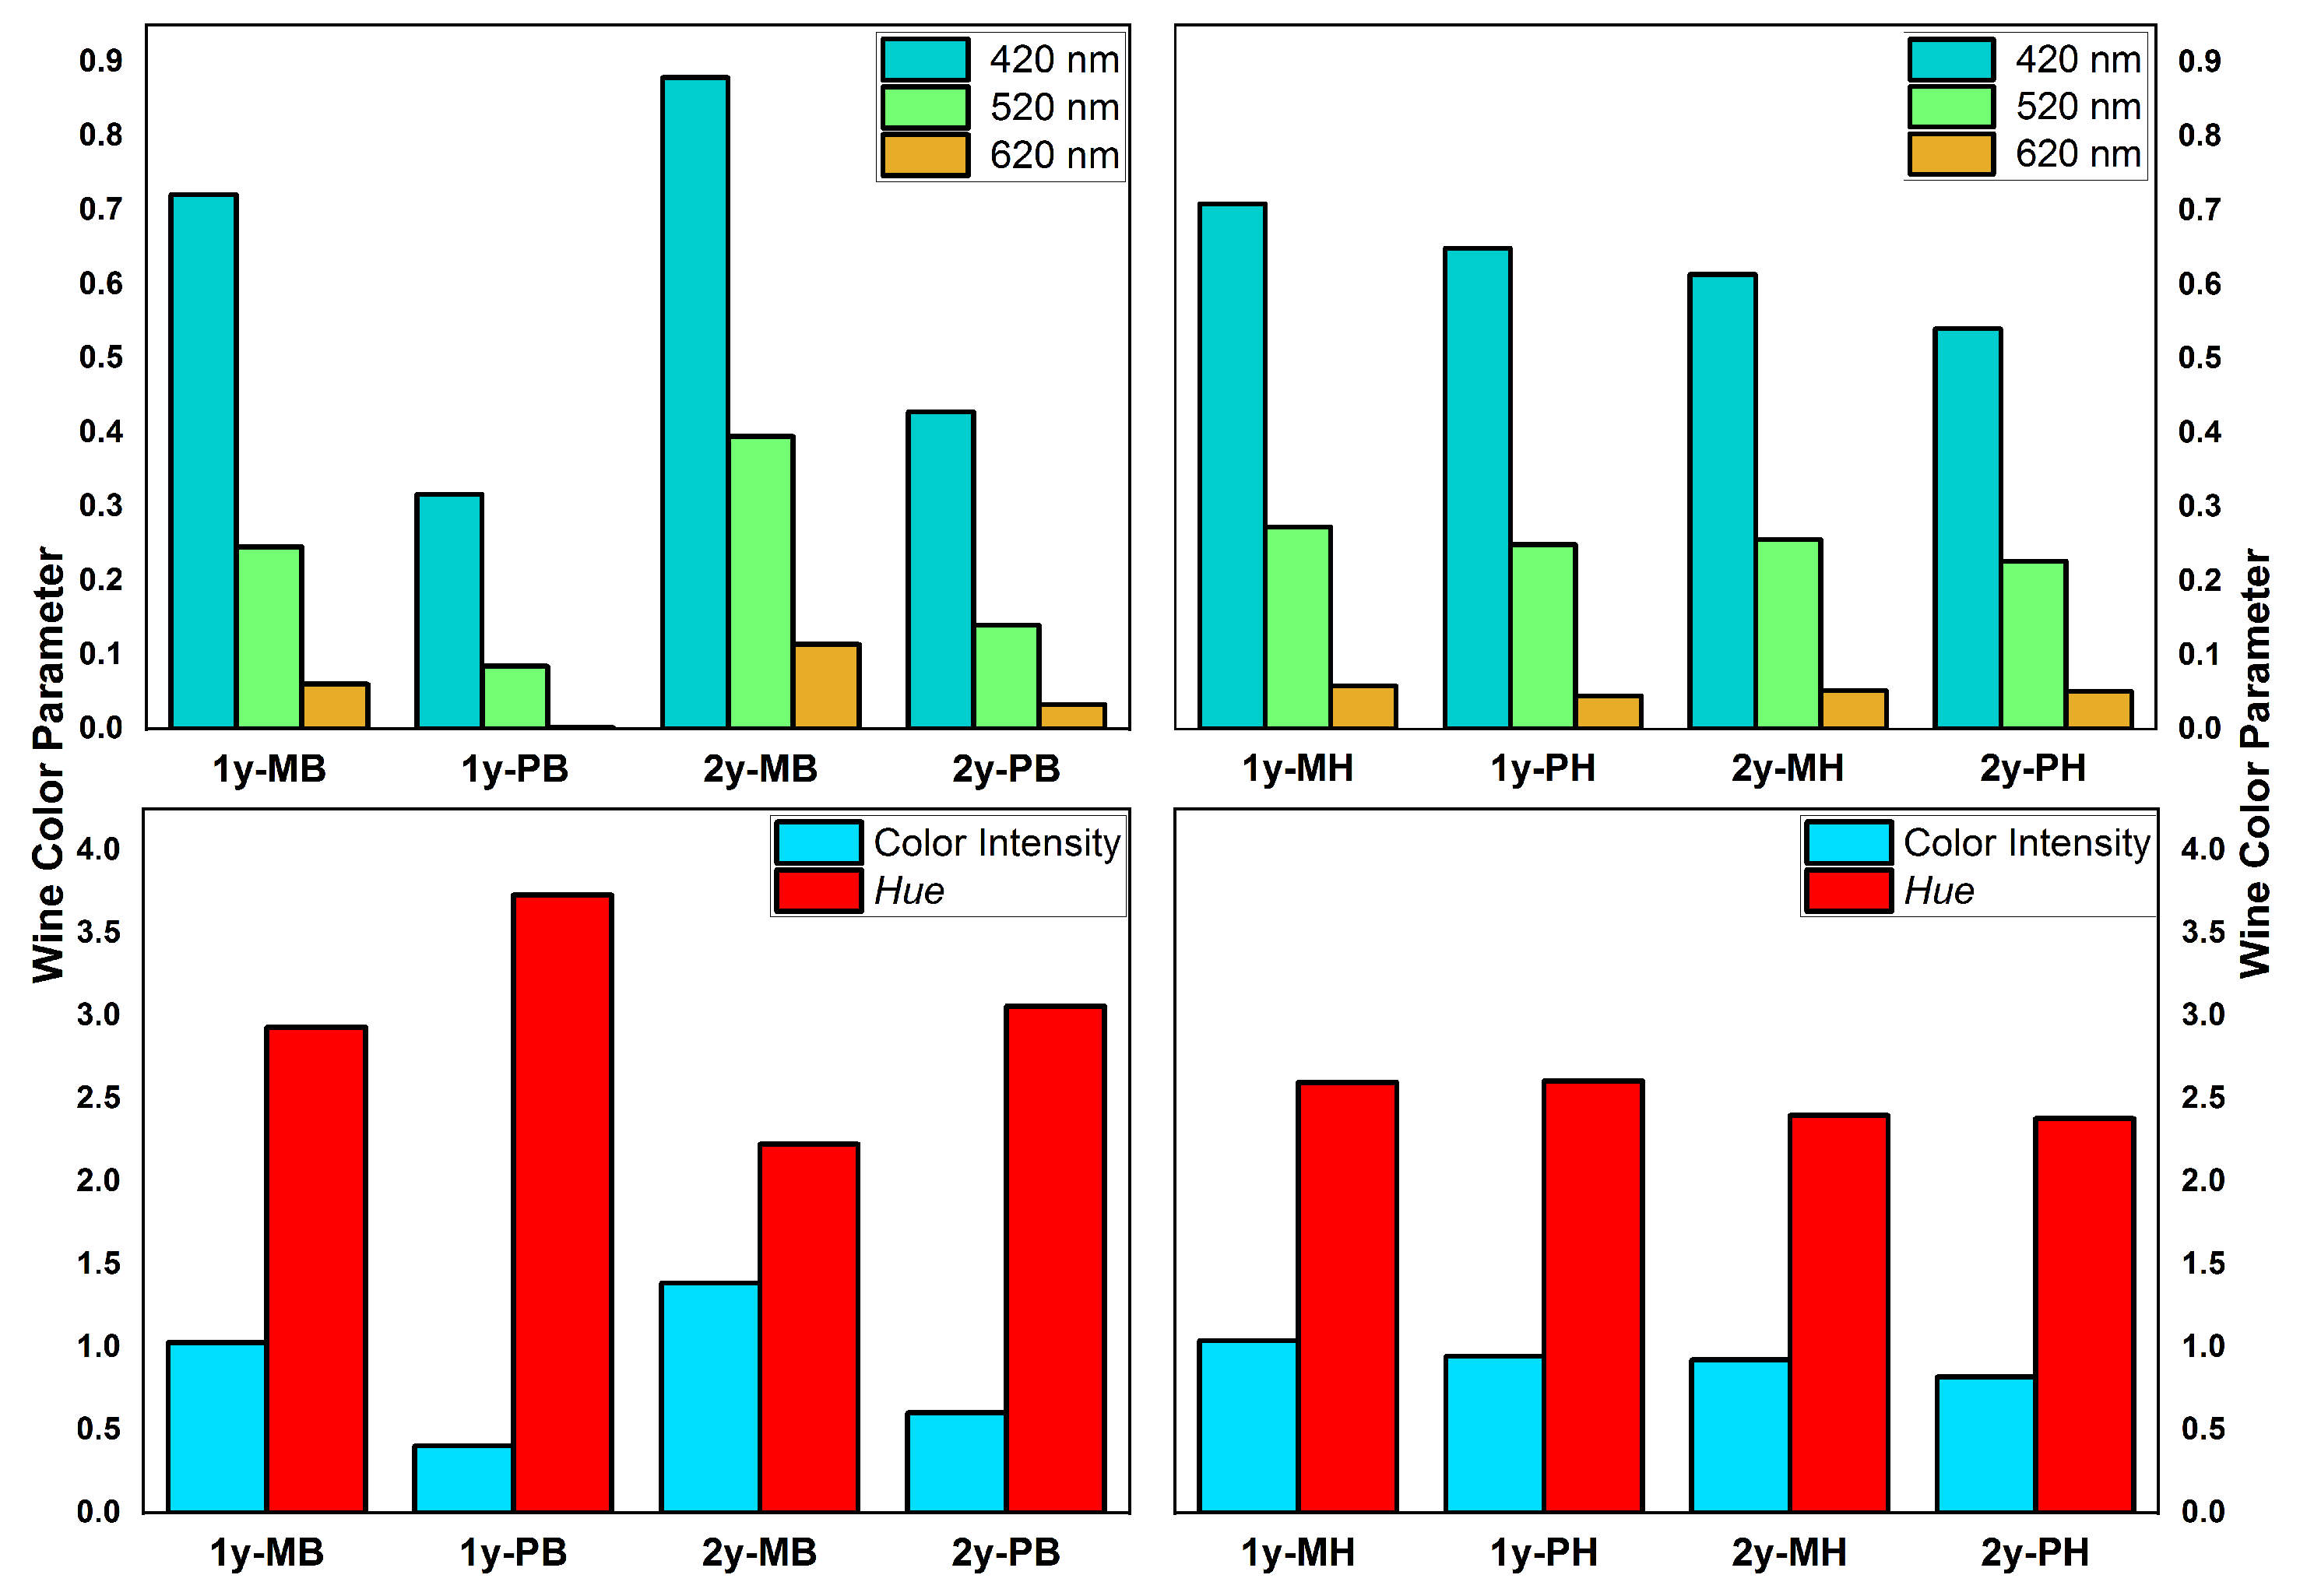
3.2.1. UV-Vis Spectroscopy of White Grapes Juice and Wine

As can be seen in Figure 4 the total wave range (200–1100 nm) revealed a typical waveform, as for the white wines reported in literature [61,62,66,108,109,110]. The spectral region from Figure 4 expressed the influence/contribution of specific organic compounds found in the wine samples. More precisely, for white wines the absorption spectra in the 240 to 400 nm region were related to the presence of esters and hydroxycinnamic acids (HCA), but correlations with pattern recognition techniques were recommended. Namely from 250 to 300 nm (around 280 nm) the absorption band was usually related to esters and different types of phenolic compounds (the absorption of benzene cycles of most of phenols), as for the 300 to 350 nm region, the band was associated with the presence of flavones and/or to nonflavonoid compounds and hydroxycinnamic acids [110]. For wines, the absorption spectrum in the UV-Vis region contained information about organic acids and phenolic compounds, including here hydroxycinnamic acids (227–245 nm, 310–332 nm), benzoic acids (235–305 nm), flavonols (250–270 nm, 350–390 nm), anthocyannins (267–275 nm, 475–545 nm) or catechins (280 nm) [109,111].
Water-related absorption bands were found between 920 nm and 1050 nm. These bands were related to the third overtone of O-H stretch (around 950 nm, usually in the case of fruits, vegetables and their juices, with 70–80% of water) and to the second overtone of O-H stretch (around 990 nm, sugars and organic acid related) [111]. Therefore it was convenient to measure these components and color of wines via UV-Vis absorption spectroscopy [112]. Another aspect was related to the oxidation degree of white wines, mainly to exposure to O2 species, that could be followed up by means of HCA changes (usually these differences are easily observed in the first or second derivative of the UV-Vis spectra [48,61,62,63,64,66,68,75].
As far as one can see, the absorption spectra of wine samples (as in Figure 4) indicated that we had notable differences only in the case of MB-PB samples. For MH-PH samples, almost imperceptible differences could hardly be traced. It can be seen from Figure 4 that the absorption spectra of the untreated MB differed from the treated one PB but also from the MH-PH. Consequently, in the UV region the maximum for MB was at 215 nm, rather than at 230 nm as for PB and MH-PH. Moreover, a second peak centered at 280 nm for all samples, seemed more broadened for the MB samples, in contrast with the narrow and well defined peak seen in PB, MH and PH samples. Furthermore, in the 350–600 nm region for the MB-PB samples a difference in the Vis absorption spectra could be observed, and also for the 900–1100 nm part of the spectra.

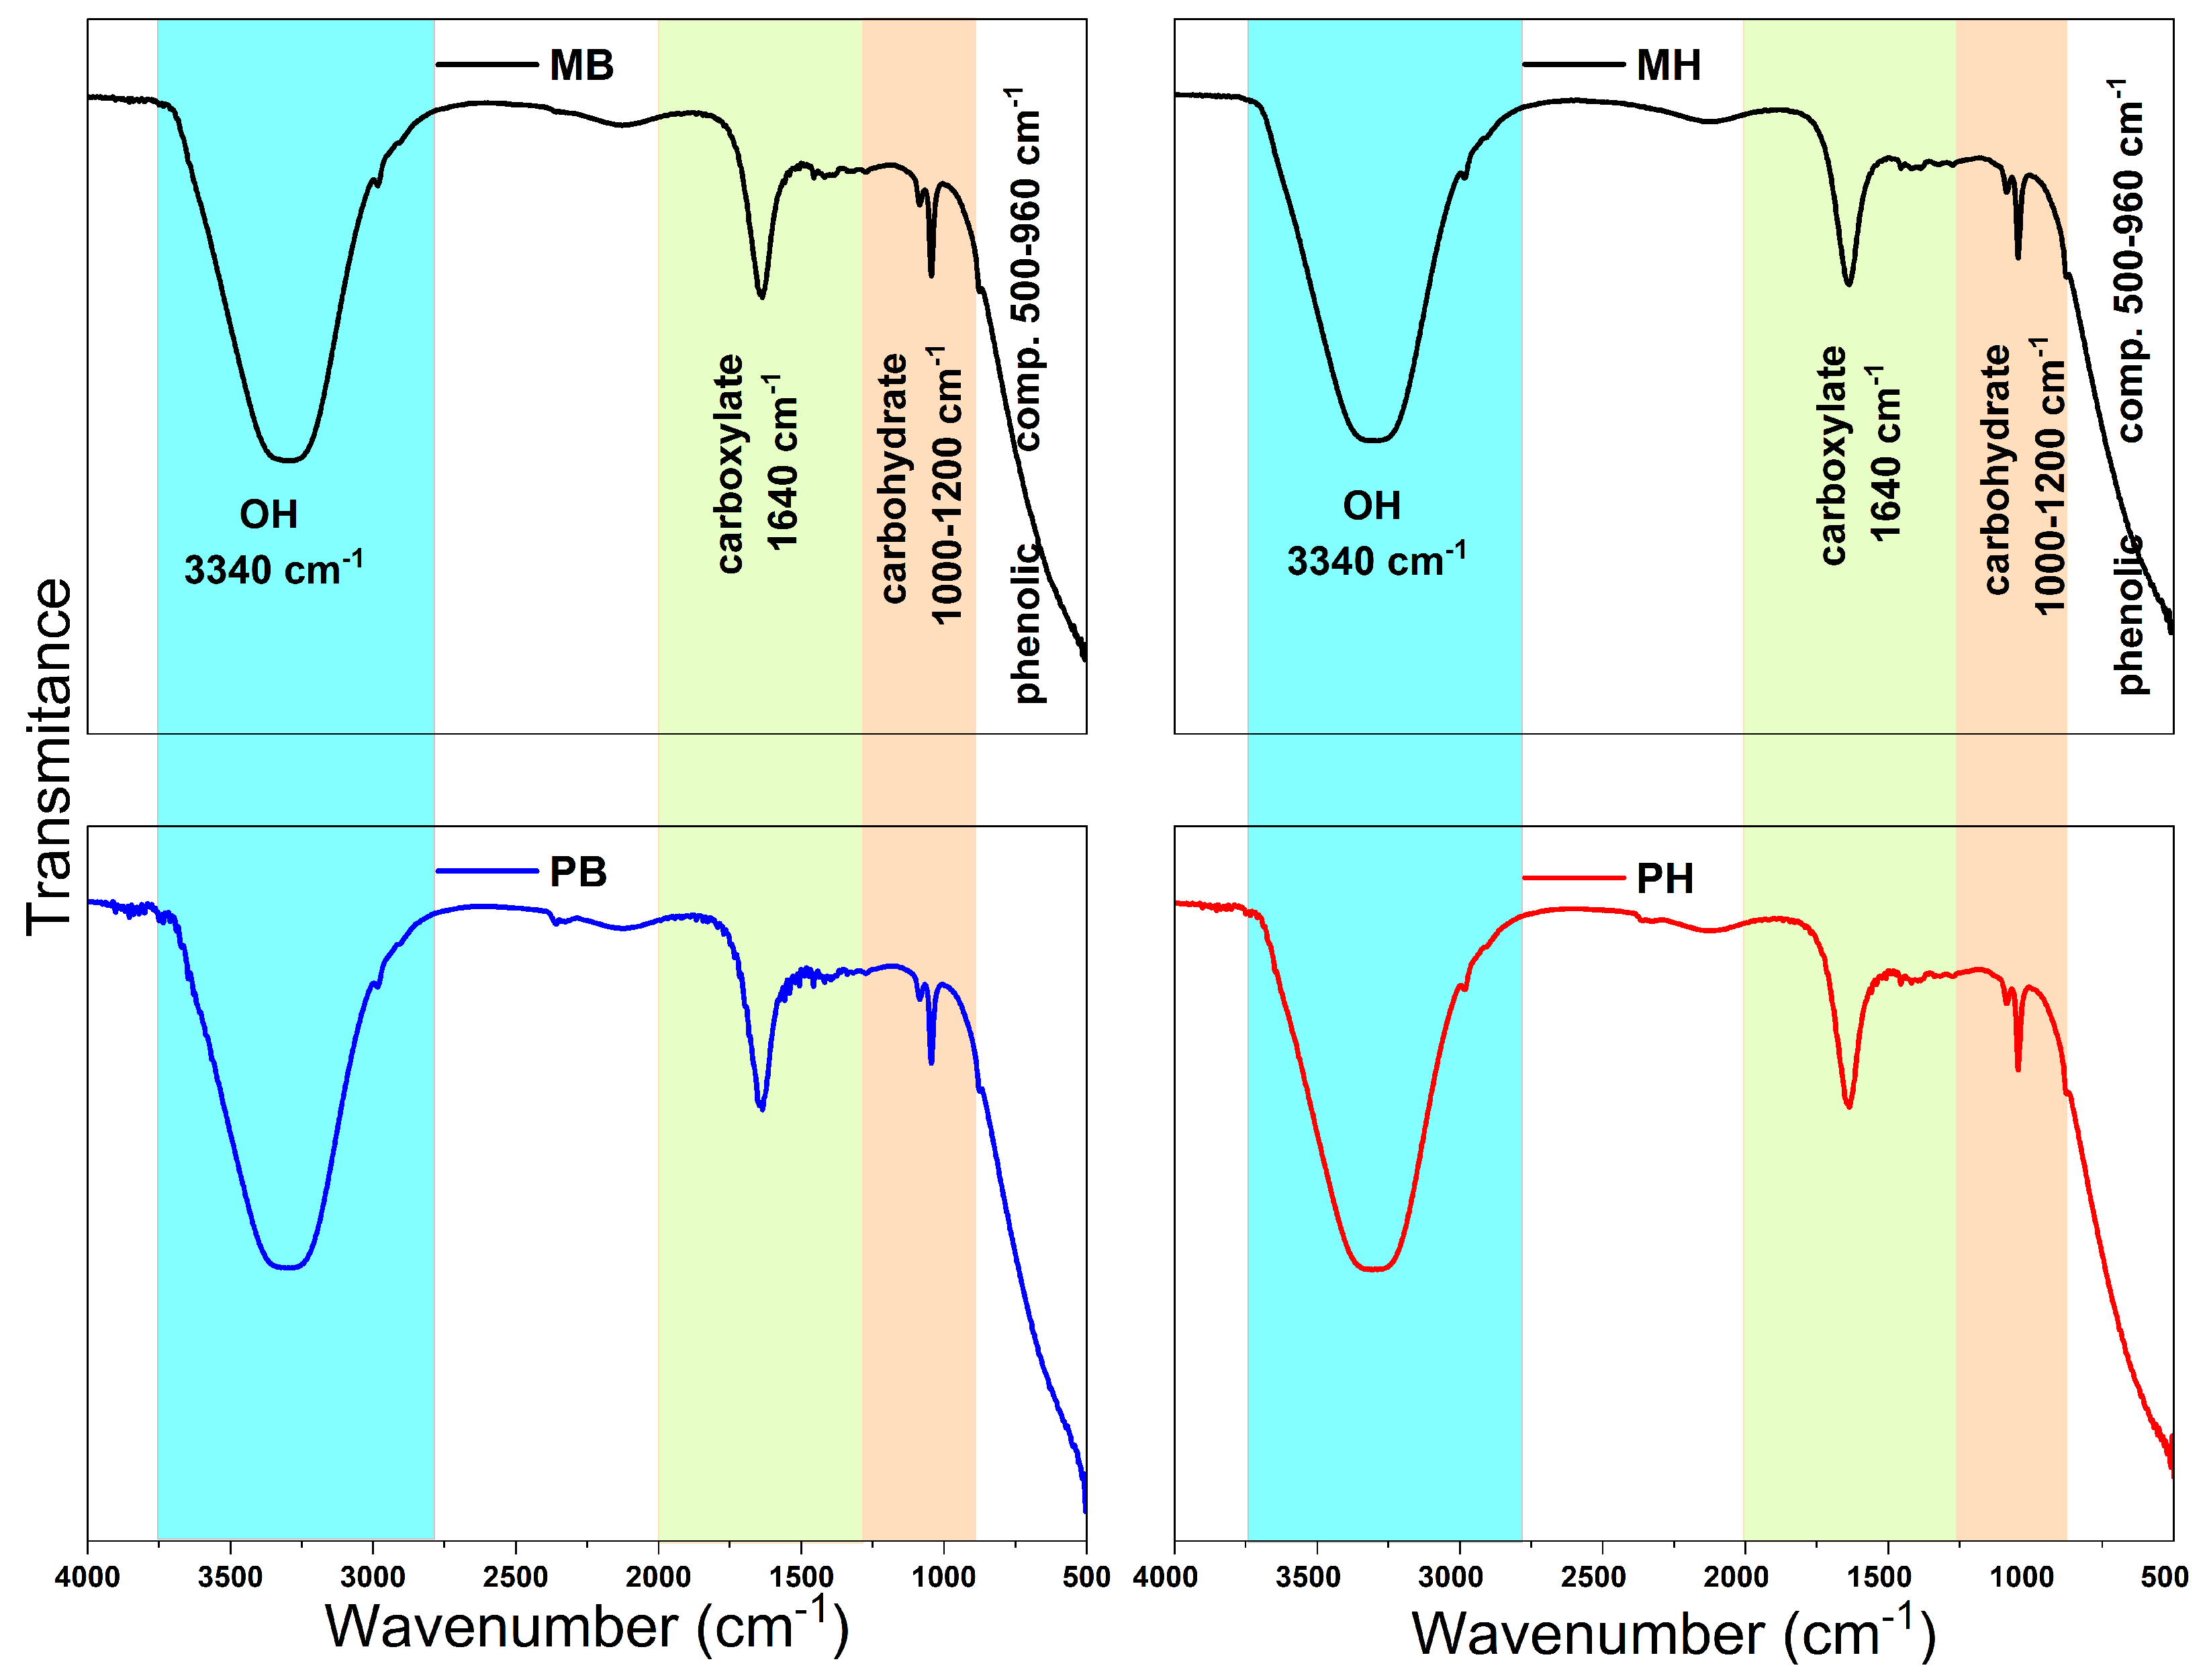
3.2.2. ATR-FTIR Spectroscopy of White Grapes Juice and Wine

As it can be depicted from Figure 5, the transmittance spectra of the wine samples, in the 500–4500 cm−1 wavenumber range, could be divided into four regions important for wine characterization, both from the chemical content as well as from the chemometric point of view.
These regions of interest, as can be seen in the Figure 5, expressed the content of polyols, glycerin/glycerol and hydroxil radicals in the 2800–3500 cm−1; the presence of organic acids (known also as ‘total acidity’) and amino acids, or carboxylates in the 1250–2000 cm−1; the extant of carbohydrates, including polysaccharides (namely glucose, fructose, oligosaccharides) and polyols, in the 1000–1200 cm−1, and also the presence of phenolic compounds (like phenols, esters, acetals or ketols) in the 500–960 cm−1 region [68,72,73,76,77,112,113]. Moreover, two clear absorption bands between 3600–3200 cm−1 and 1700–1560 cm−1 were correlated with O-H stretching vibrations. The small, yet evident, peak between 3040–2800 cm−1 is usually associated with the stretching vibration of C-H bond. Small differences were noticed in the FTIR spectra of all wine samples, plasma treated or untreated. These were related to the shift of the wavenumber of some observed peaks and further on listed in Table 4.
FTIR spectroscopy was involved in monitoring of wine process and prediction of its parameters (e.g., monitoring wine aging), as well as wine authenticity and traceability, or prediction of a white wine aromatic potential, as well as studies of phenolic profile and antioxidant activity during the winemaking process. All of these (and other aspects previously mentioned) make this technique very important in the vine and winemaking industry, underlining the usage of it in this study.

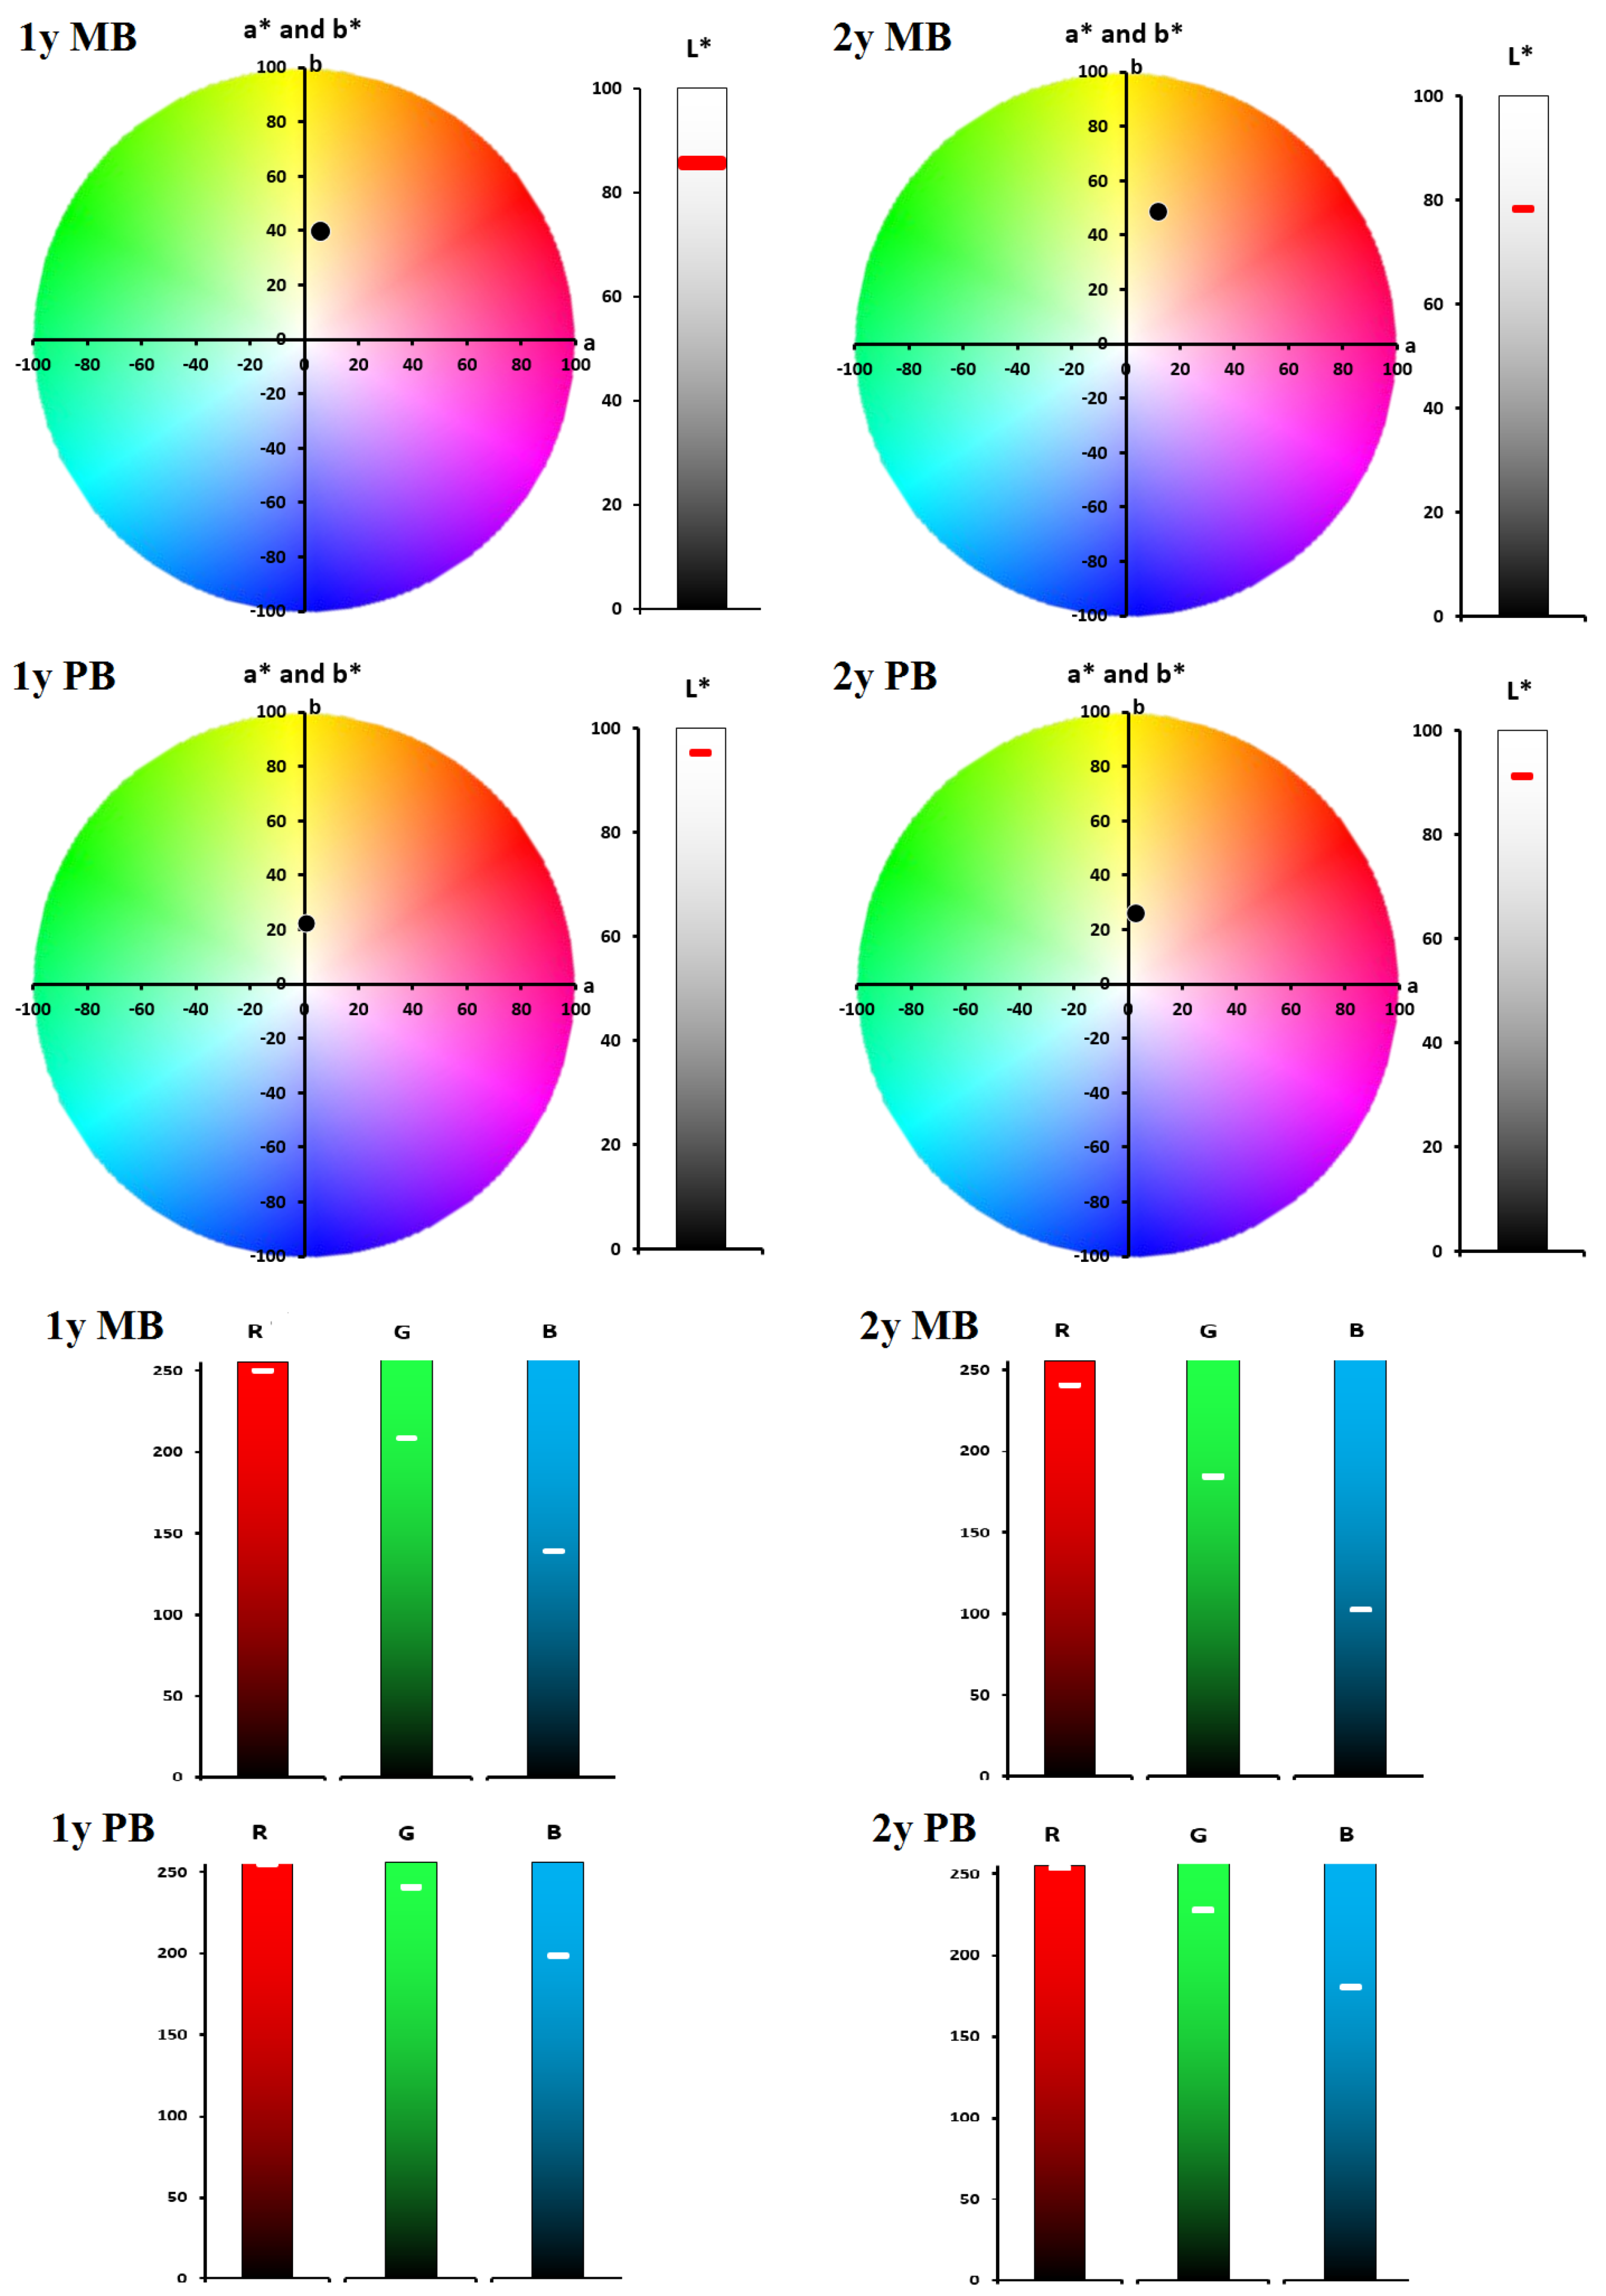
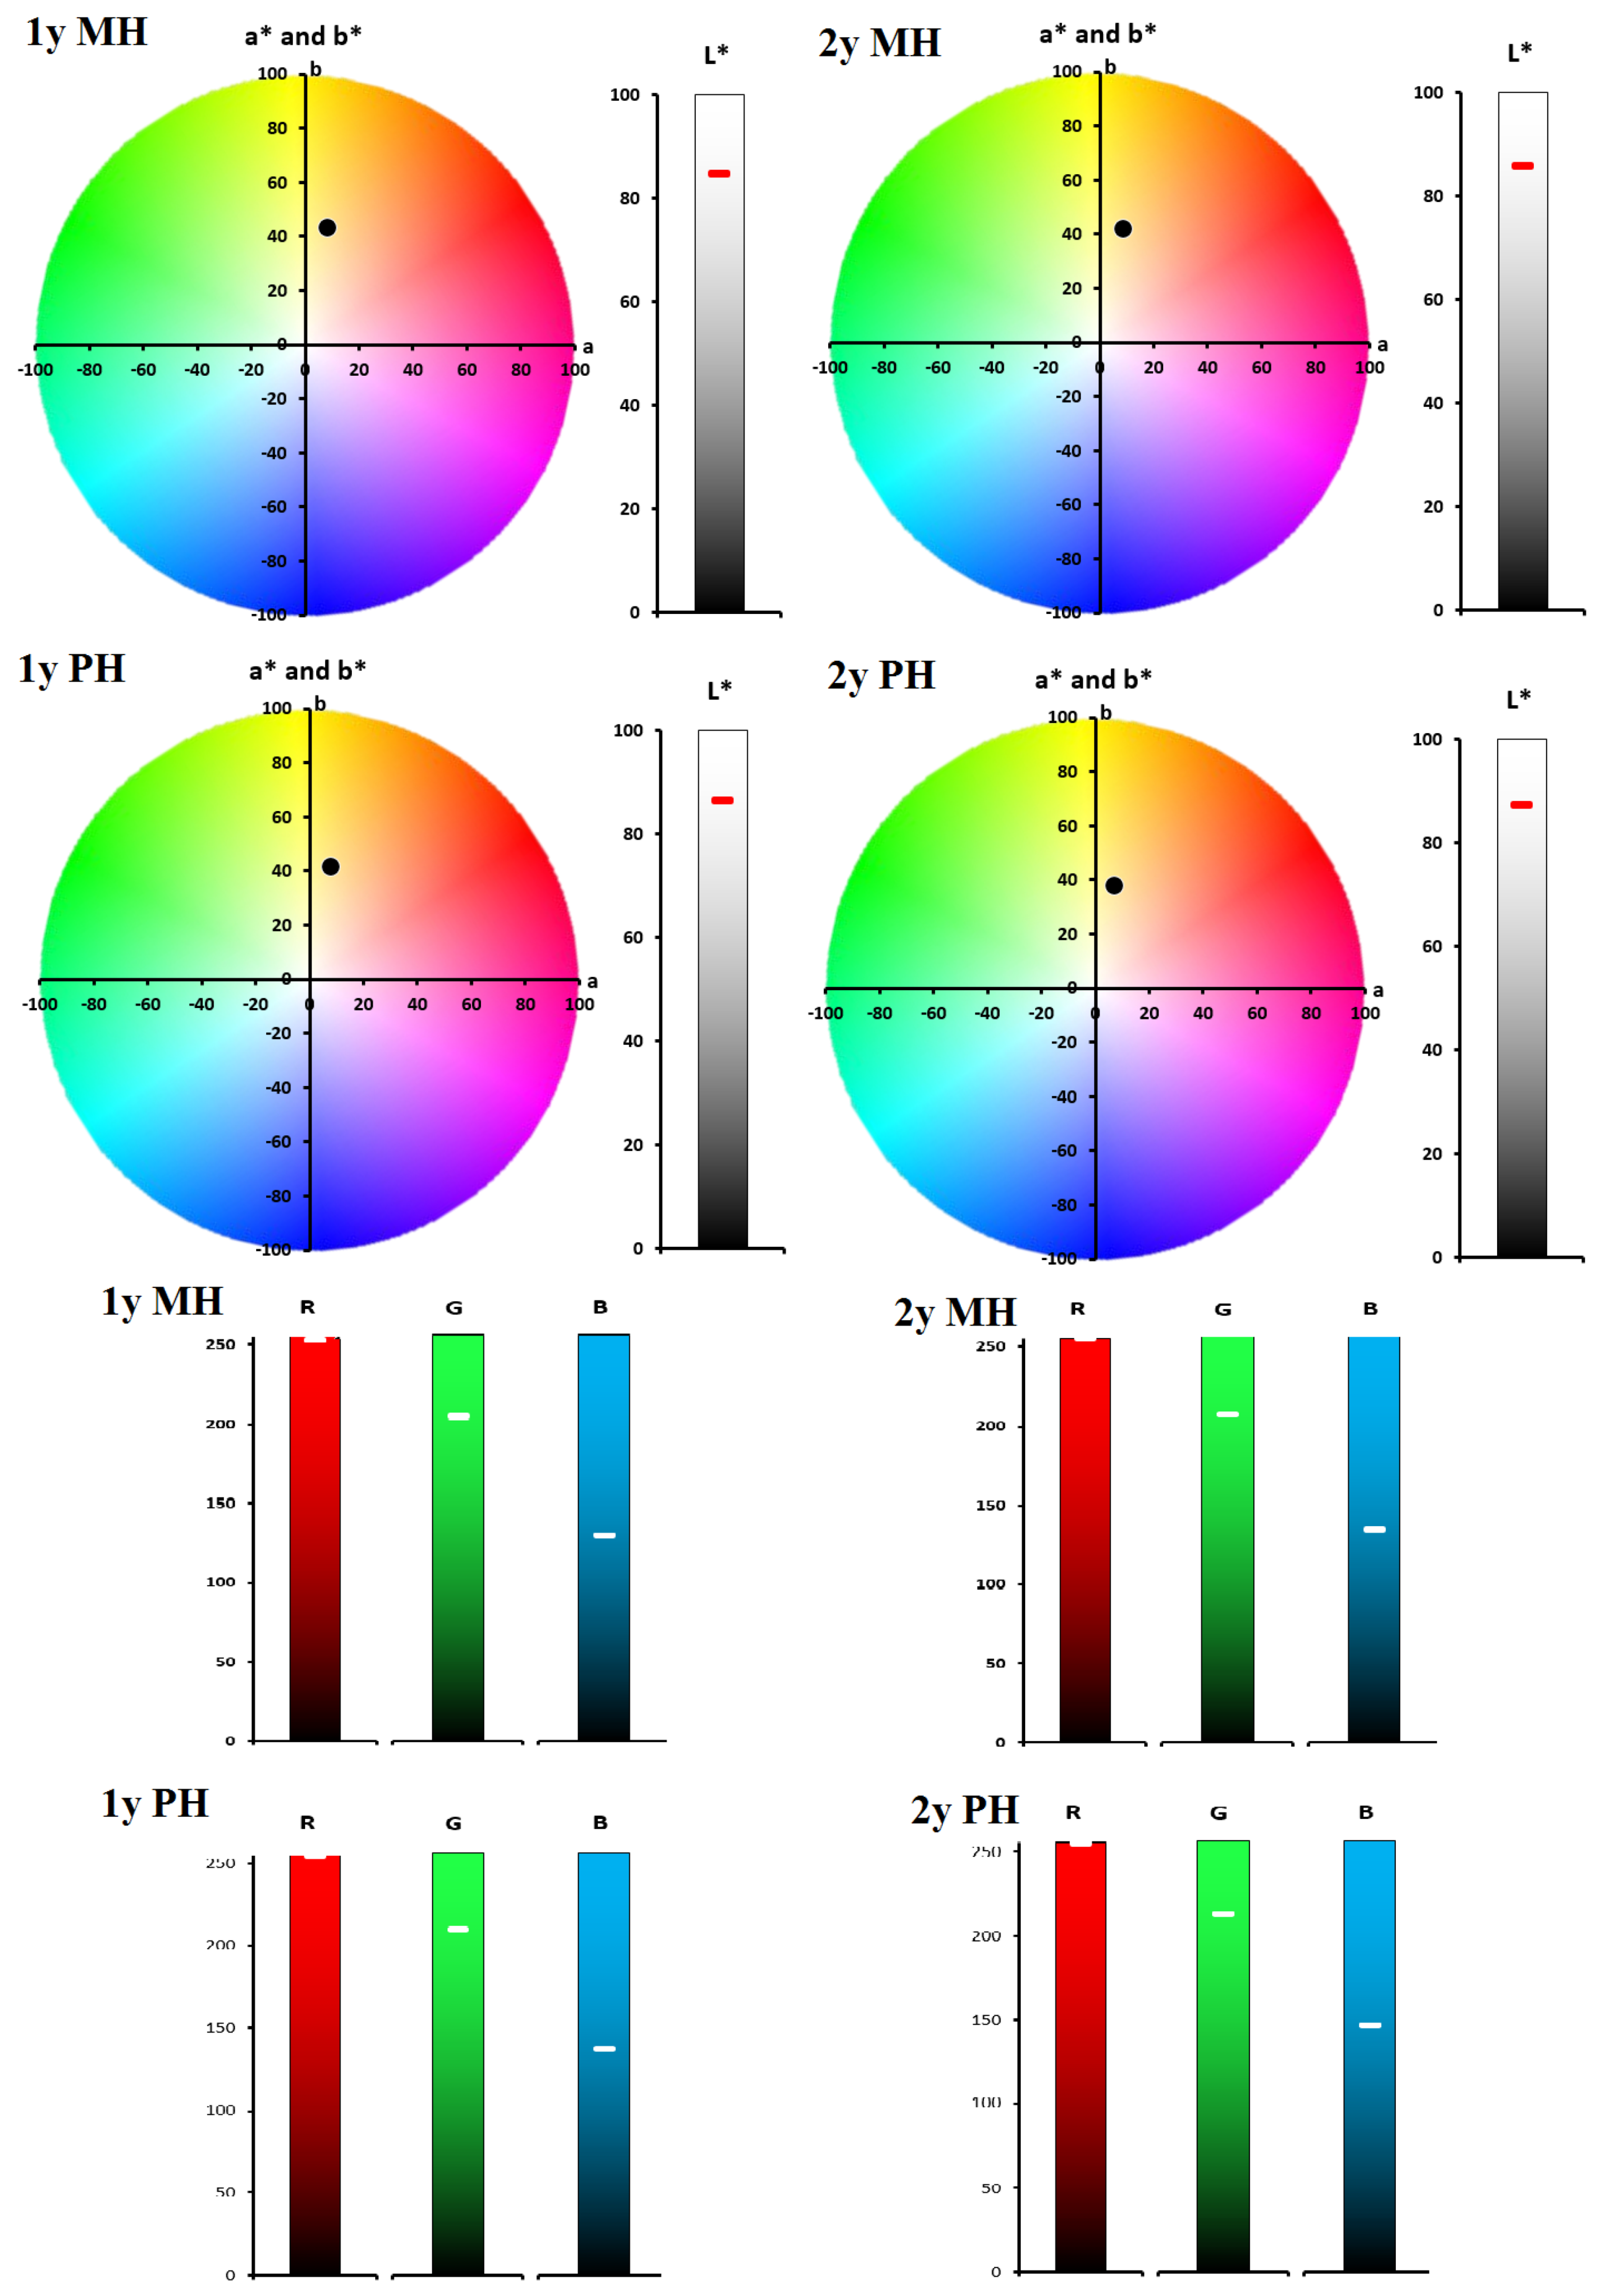
3.2.3. Colour of Must and Wine

The color and the hue of the white must/wine samples are presented as follows. In the case of white wines, the absorbance value read at wavelength 420 nm, in relation to distilled water, represented an estimate of the oxidation state of the color, the so called ‘color closure’ [82]. The color parameters of the wine samples under study, the variation of absorbance at 420, 520 and 620 nm, as well as the C.I. and hue, are shown bellow in Figure 6. As a first notable aspect, the redness/red component of the wine sample, after 2 years’ increase, was seen from the absorbance at 620 nm.
The color properties/characteristics of the wine samples under study can be observed in Figure 6. Even if both studies’ wines were white, the color properties were different. Moreover, for the Bârzeşti wine the color parameters, mainly the absorption values at 420, 520 and 620 nm increased with age (from 1 to 2 years) for both untreated (MB) and plasma treated samples (PB). Further on, the absorbance values of the untreated samples were greater than those for plasma treated ones. For these wine samples the color intensity (CI) increased with age and had greater value for the untreated samples unlike those treated. The Hue value depreciated over time for all wine samples, but it was with higher value for plasma treated ones. For the samples from Huşi, the 420 nm absorbance fell off significantly, while for the 520 and 620 nm the absorbance slightly reduced its value. Moreover for these Huşi wine samples the color intensity values also declined in time, as well as for the Hue parameter. However, the values were somehow bigger for plasma treated wines (PH). These aspects can be seen in Figure 6. Thus, having these values we could estimate the color differences between wine samples. As a notable fact, the Bârzeşti wine samples color were more intense unlike the Huşi wine samples, that had close values for both untreated and plasma treated samples.
The color parameters: CIELab, WI, chroma, angle hue and delta E (measured against the untreated must) of white wine are presented in the Table 5, shown below. Moreover the color parameters graphs (Figure 7 and Figure 8) were obtained using the same method described in [83]. As reported by other researchers, a difference smaller than 3 of the wine sample color change, Δ E a b * , cannot be observed by human naked eye [107].
The effects of plasma treatment upon the color of the must samples under study are presented in the Table 5. As already seen in the UV-Vis absorption spectroscopy results, the two types of white must had different behaviour in respect to plasma treatment. The most noticeable plasma treatment results were upon the Bârzeşti samples. The L* parameter (lightness) increased after plasma treatment compared to the control, for both Bârzeşti and Huşi samples. These changes in the values of the L* parameter were: for the Bârzeşti wine, the L* value depreciated by 8.5% after another one year (2y against 1y) for the control sample, while for the plasma treated one the decrease was by 4.3%. However, comparing the plasma treated wine after 1 year of storage with the control one, L* values were 11.5% higher, and after the second year of storage the difference was about 16.5%, so an extra 5% increase of the difference between control and treated with the aging of the wine, for the Bârzeşti wine. These differences were less noticeable in the case of Huşi wine samples. More over, for the Huşi samples L* tended to increase both over time and with plasma treatment, but with smaller percentages in comparison to Bârzeşti wines. More precisely, after 1 year of storage the L* for the treated samples was higher with almost 1.8%, and after another year with about 1.9%, so the value of L* remained constant over time. For the a* and b* coordinates (a*-redness and b*-yellowness), a general increase value could be observed for Bârzeşti samples, while for the plasma treated ones of the Huşi samples, a small decrease was seen ( 10% for a* and b*).
The white index (WI) had an overall tendency of increase for all samples, both with age and plasma treatment. The same was true for chroma ( C a b * ), with almost 25% enhancement, for the Bârzeşti control, and 18% for the plasma treated, although between control and treated samples there was a 50% difference in the control favour, while it was up to 10% for the Huşi wines. The angular hue had similar tendency of decreasing over time, in the range of around 5%. The interesting result was related to the color differences ( Δ E a b * ) that for the Bârzeşti plasma treated samples was 20 in the first year of aging, and up to 27 in the second year. For the Huşi wines, after 1 year Δ E a b * < 3 (no visible changes), and increased a bit, 4.6 after another 1 year.
For better visualization of color parameter differences, the color space diagrams in L*a*b* and corresponding RGB coordinates, as resulted using Delgado-Gonzalez model [83], are presented in Figure 7 and Figure 8.
By using this model and the absorption (converted to transmittance) spectrum of the must and wine samples we were able to not only calculate the color coordinates of CIE L*a*b* and RGB color space but also to visualize these parameters in a way comfortable to the reader.
The parameters L*a*b* and RGB presented in Figure 7 and Figure 8 are easily to follow on the graphs, where the differences between the studied wine samples are visualized simultaneously.

3.2.4. pH, Brix and Densitometry Measurements of Must and Wine

Following the OIV classification (enumeration 2.2.3) and based on the estimated values of sugar (g/L) from the studied wine samples we could conclude that both Barzeşti and Huşi wines were sweet wines (>45 g/L). This aspect could be deduced even from the values obtained for the must (Table 6), so that later it could be confirmed by the data obtained for the wine samples of 1 and 2 years old respectively (Table 7).
Thus, the values of the pH for the fresh must indicate that the acidity of the samples was in general agreement with those reported in literature. More, the Brix reading showed a clear differentiation between the two types of must, mainly by 5% in the favor of the Huşi sample, giving it an increased content of potential alcohol. This would further influence the properties of the wine. However, these must parameters did not guarantee the final amount of alcohol in the young or old wine.
Table 7 show the physico-chemical parameters of studied wine samples. It can be pointed out that the pH value was closed to 3.5, a value that ensured the wine’s microbiological stability.
Comparing the wines from those two studied areas, it is obviously that after plasma treatment the alcohol content was a bit lower than for the untreated sample. In the case of Bârzeşti area, the Brix value started from 6 and rose to 7 for untreated wine, while the plasma treated samples were constant at 6. In the case of dissolved sugar a higher content was present after another aging year, but a higher content of alcohol the previously year. The same conclusions could be taken for the Huşi wine samples, that the pH values were around 3.5 and that the Brix diminished from 15% as it was in the must, to 10% and down to 6 % for the 1 and 2 year old wine. Even if the estimated dissolved sugar was higher in comparison to Bârzeşti wine samples, the measured amount of alcohol was lower. Nevertheless, after 2 years, both wines were with high alcohol amounts, around 16 % v/v.
As a reference, for the 1-year-old wine aged in oak barrels (200 L volume) as ’normal procedure’, the measured amount of alcohol was 15 % v/v for MB samples and respectively 13 % v/v for MH, values that remained constant in the second year. These wines are usually made for domestic, non-commercial use.
Future research directions will include phenolic content and phenols identification through HPLC determinations. Additionally, studies in the first weeks of winemaking, to better capture the must-to-wine transition, using the UV-Vis / ATR-FTIR / colorimetric techniques. The ‘pinking effect’ as well as the ‘browning’ of the aged wine samples are to be considered as well as further work. Correlation with the plant-soil components is another important aspect in our future research. Nevertheless, variation of plasma parameters (higher power, increase RONS content, activated medium) in relationship to winemaking and wine preservation will be carry on as well.

4. Conclusions

This report presents the possible usability of atmospheric pressure plasma in the winemaking process. Because these processes are well-founded, there are specific ways that researchers can act to increase the quality of wine. A new method that is gaining ground is the use of plasma sources in the field of winemaking.
The electrical diagnosis revealed a stable, quiet and diffuse discharge, mainly due to helium flow and medium operating power, of up to 10 W, at 48 kHz. Moreover, the chosen working parameters ensured a cold treatment of the white must, proven also by several temperature determination methods. Through thermocouple, IR and spectroscopic techniques, the gas temperature during plasma treatment increased to a maximum 40 °C, so no pasteurization processes occurred. The spectroscopic / specific temperatures of plasma species along with their designated excitation energy provides enough information upon the energetic potential of plasma for interaction with external medium species, the white must.
The UV-to-NIR absorption spectroscopic methods showed that in must and wine there are functional groups corresponding to phenols, sugars and flavones, with differences that can be relatively easily highlighted between the control samples and plasma treated ones. The most notable differences could be seen in the Bârzeşti samples, compared to the Huşi samples.
The simultaneous visualization of CIE L*a*b* and RGB in color space charts allows easier understanding of wine changing in color parameters. Overall, the lightness parameter L* is enhanced after plasma treatment in both PB and PH samples, and the a* and b* values decrease with plasma treatment. The aging influences all parameters both in control and plasma treated samples. The biggest difference in color coordinates are seen in Bârzeşti samples.
The Brix readings were used for both monitoring the must and wine as well as for estimating the dissolved sugar, density or potential alcohol. Based on the estimated sugar content, both wine types are sweet, the amount of measured alcohol being around 16 % v/v.
From this point of view, it can be concluded that there are many challenges involving atmospheric pressure plasma applications in winemaking. It includes optimized plasma parameters for must and wine processing, choosing the right type of wine for proper aging, targeting the proper compounds as well as the reaction mechanisms. Nonetheless, these results are the first phase towards improving our knowledge about the impact of plasma sources on wine quality, while also bringing additional helpful information in support of the subsequent optimization of plasma-assisted winemaking processes.

Author Contributions

Conceptualization: R.H. and A.V.N.; methodology and software: R.H. and A.V.N.; validation: R.H. and A.V.N.; formal analysis, investigation and data curation: R.H. and A.V.N.; writing—original draft preparation—review and editing, R.H. and A.V.N. All authors have read and agreed to the published version of the manuscript.

Funding

This research received no external funding.

Institutional Review Board Statement

Not applicable.

Informed Consent Statement

Not applicable.

Data Availability Statement

The data presented in this study are available, on reasonable request, from the corresponding author.

Acknowledgments

The Authors express their gratitude to the Iasi Plasma Advanced Research Center (IPARC), from Faculty of Physics, “Alexandru Ioan Cuza” University of Iasi, Romania, for allowing the authors to use the infrastructure (UV-Vis and FTIR spectrometers) during part of the experiment described in this manuscript.

Conflicts of Interest

The authors declare no conflict of interest.

References

  1. Kogelschatz, U. Dielectric-barrier discharges: Their history, discharge physics, and industrial applications. Plasma Chem. Plasma Process. 2003, 23, 1–46. [Google Scholar] [CrossRef]
  2. Kim, H.H. Nonthermal plasma processing for air-pollution control: A historical review, current issues, and future prospects. Plasma Process. Polym. 2004, 1, 91–110. [Google Scholar] [CrossRef]
  3. Kogelschatz, U. Atmospheric-pressure plasma technology. Plasma Phys. Control. Fusion 2004, 46, B63. [Google Scholar] [CrossRef]
  4. Fridman, G.; Friedman, G.; Gutsol, A.; Shekhter, A.B.; Vasilets, V.N.; Fridman, A. Applied plasma medicine. Plasma Process. Polym. 2008, 5, 503–533. [Google Scholar] [CrossRef]
  5. Nastuta, A.; Rusu, G.; Topala, I.; Chiper, A.; Popa, G. Surface modifications of polymer induced by atmospheric DBD plasma in different configurations. J. Optoelectron. Adv. Mater 2008, 10, 2038–2042. [Google Scholar]
  6. Von Woedtke, T.; Kramer, A.; Weltmann, K.D. Plasma sterilization: What are the conditions to meet this claim? Plasma Process. Polym. 2008, 5, 534–539. [Google Scholar] [CrossRef]
  7. Weltmann, K.D.; Kindel, E.; Brandenburg, R.; Meyer, C.; Bussiahn, R.; Wilke, C.; Von Woedtke, T. Atmospheric pressure plasma jet for medical therapy: Plasma parameters and risk estimation. Contrib. Plasma Phys. 2009, 49, 631–640. [Google Scholar] [CrossRef]
  8. Nastuta, A.V.; Topala, I.; Grigoras, C.; Pohoata, V.; Popa, G. Stimulation of wound healing by helium atmospheric pressure plasma treatment. J. Phys. D Appl. Phys. 2011, 44, 105204. [Google Scholar] [CrossRef] [Green Version]
  9. Topala, I.; Nastuta, A.V. Helium atmospheric pressure plasma jet: Diagnostics and application for burned wounds healing. In Plasma for Bio-Decontamination, Medicine and Food Security. NATO Science for Peace and Security Series A: Chemistry and Biology; Machala, Z., Hensel, K., Akishev, Y., Eds.; Springer: Dordrecht, The Netherlands, 2012; pp. 335–345. [Google Scholar] [CrossRef]
  10. Han, J. Review of major directions in non-equilibrium atmospheric plasma treatments in medical, biological, and bioengineering applications. Plasma Med. 2013, 3. [Google Scholar] [CrossRef] [Green Version]
  11. Nastuta, A.V.; Pohoata, V.; Topala, I. Atmospheric pressure plasma jet—Living tissue interface: Electrical, optical, and spectral characterization. J. App. Phys. 2013, 113, 183302. [Google Scholar] [CrossRef]
  12. Von Woedtke, T.; Reuter, S.; Masur, K.; Weltmann, K.D. Plasmas for medicine. Phys. Rep. 2013, 530, 291–320. [Google Scholar] [CrossRef]
  13. Keidar, M. Plasma for cancer treatment. Plasma Sources Sci. Technol. 2015, 24, 033001. [Google Scholar] [CrossRef]
  14. Bruggeman, P.J.; Kushner, M.J.; Locke, B.R.; Gardeniers, J.G.E.; Graham, W.G.; Graves, D.B.; Hofman-Caris, R.C.H.M.; Maric, D.; Reid, J.P.; Ceriani, E.; et al. Plasma–liquid interactions: A review and roadmap. Plasma Sources Sci. Technol. 2016, 25, 053002. [Google Scholar] [CrossRef]
  15. Bekeschus, S.; Wende, K.; Hefny, M.M.; Rödder, K.; Jablonowski, H.; Schmidt, A.; von Woedtke, T.; Weltmann, K.D.; Benedikt, J. Oxygen atoms are critical in rendering THP-1 leukaemia cells susceptible to cold physical plasma-induced apoptosis. Sci. Rep. 2017, 7, 2791. [Google Scholar] [CrossRef] [PubMed] [Green Version]
  16. Nastuta, A.V.; Topala, I.; Pohoata, V.; Mihaila, I.; Agheorghiesei, C.; Dumitrascu, N. Atmospheric pressure plasma jets in inert gases: Electrical, optical and mass spectrometry diagnosis. Rom. Rep. Phys. 2017, 69, 407. [Google Scholar]
  17. Dai, X.; Bazaka, K.; Richard, D.J.; Thompson, E.R.W.; Ostrikov, K.K. The emerging role of gas plasma in oncotherapy. Trends Biotechnol. 2018, 36, 1183–1198. [Google Scholar] [CrossRef] [PubMed]
  18. Bekeschus, S.; Favia, P.; Robert, E.; von Woedtke, T. White paper on plasma for medicine and hygiene: Future in plasma health sciences. Plasma Process. Polym. 2019, 16, 1800033. [Google Scholar] [CrossRef] [Green Version]
  19. Brandenburg, R.; Bogaerts, A.; Bongers, W.; Fridman, A.; Fridman, G.; Locke, B.R.; Miller, V.; Reuter, S.; Schiorlin, M.; Verreycken, T.; et al. White paper on the future of plasma science in environment, for gas conversion and agriculture. Plasma Process. Polym. 2019, 16, 1700238. [Google Scholar] [CrossRef] [Green Version]
  20. Cvelbar, U.; Walsh, J.L.; Černák, M.; de Vries, H.W.; Reuter, S.; Belmonte, T.; Corbella, C.; Miron, C.; Hojnik, N.; Jurov, A.; et al. White paper on the future of plasma science and technology in plastics and textiles. Plasma Process. Polym. 2019, 16, 1700228. [Google Scholar] [CrossRef] [Green Version]
  21. Nastuta, A.V.; Popa, G. Surface oxidation and enhanced hydrophilization of polyamide fiber surface after He/Ar atmospheric pressure plasma exposure. Rom. Rep. Phys. 2019, 71, 1–16. [Google Scholar]
  22. Šimek, M.; Černák, M.; Kylián, O.; Foest, R.; Hegemann, D.; Martini, R. White paper on the future of plasma science for optics and glass. Plasma Process. Polym. 2019, 16, 1700250. [Google Scholar] [CrossRef] [Green Version]
  23. Weltmann, K.D.; Kolb, J.F.; Holub, M.; Uhrlandt, D.; Šimek, M.; Ostrikov, K.; Hamaguchi, S.; Cvelbar, U.; Černák, M.; Locke, B.; et al. The future for plasma science and technology. Plasma Process. Polym. 2019, 16, 1800118. [Google Scholar] [CrossRef] [Green Version]
  24. Branỳ, D.; Dvorská, D.; Halašová, E.; Škovierová, H. Cold Atmospheric Plasma: A Powerful Tool for Modern Medicine. Int. J. Mol. Sci. 2020, 21, 2932. [Google Scholar] [CrossRef] [Green Version]
  25. Keidar, M. Introduction: Plasma for Cancer Therapy. In Plasma Cancer Therapy; Keidar, M., Ed.; Springer: Berlin/Heidelberg, Germany, 2020; pp. 1–13. [Google Scholar] [CrossRef]
  26. Pankaj, S.K.; Wan, Z.; Colonna, W.; Keener, K. Effect of high voltage atmospheric cold plasma on white grape juice quality. J. Sci. Food Agric. 2017, 97, 4016–4021. [Google Scholar] [CrossRef] [PubMed]
  27. Kalli, E.; Lappa, I.; Bouchagier, P.; Tarantilis, P.; Skotti, E. Novel application and industrial exploitation of winery by-products. Bioresour. Bioprocess. 2018, 5, 46. [Google Scholar] [CrossRef]
  28. Perinban, S.; Orsat, V.; Raghavan, V. Nonthermal Plasma—Liquid Interactions in Food Processing: A Review. Compr. Rev. Food Sci. Food Saf. 2019, 18, 1985–2008. [Google Scholar] [CrossRef] [PubMed] [Green Version]
  29. Sainz-García, E.; López-Alfaro, I.; Múgica-Vidal, R.; López, R.; Escribano-Viana, R.; Portu, J.; Alba-Elías, F.; González-Arenzana, L. Effect of the Atmospheric Pressure Cold Plasma Treatment on Tempranillo Red Wine Quality in Batch and Flow Systems. Beverages 2019, 5, 50. [Google Scholar] [CrossRef] [Green Version]
  30. Huang, C.; Wu, J.; Wu, J.; Ting, Y. Effect of novel atmospheric-pressure jet pretreatment on the drying kinetics and quality of white grapes. J. Sci. Food Agric. 2019, 99, 5102–5111. [Google Scholar] [CrossRef]
  31. Chen, Y.Q.; Cheng, J.H.; Sun, D.W. Chemical, physical and physiological quality attributes of fruit and vegetables induced by cold plasma treatment: Mechanisms and application advances. Crit. Rev. Food Sci. Nutr. 2020, 60, 2676–2690. [Google Scholar] [CrossRef]
  32. Ozen, E.; Singh, R. Atmospheric cold plasma treatment of fruit juices: A review. Trends Food Sci. Technol. 2020, 103, 144–151. [Google Scholar] [CrossRef]
  33. Munekata, P.E.S.; Domínguez, R.; Pateiro, M.; Lorenzo, J.M. Influence of Plasma Treatment on the Polyphenols of Food Products—A Review. Foods 2020, 9, 929. [Google Scholar] [CrossRef]
  34. Santamera, A.; Escott, C.; Loira, I.; del Fresno, J.M.; González, C.; Morata, A. Pulsed Light: Challenges of a Non-Thermal Sanitation Technology in the Winemaking Industry. Beverages 2020, 6, 45. [Google Scholar] [CrossRef]
  35. Sainz-García, A.; González-Marcos, A.; Múgica-Vidal, R.; Muro-Fraguas, I.; Escribano-Viana, R.; González-Arenzana, L.; López-Alfaro, I.; Alba-Elías, F.; Sainz-García, E. Application of atmospheric pressure cold plasma to sanitize oak wine barrels. LWT 2020, in press. [Google Scholar] [CrossRef]
  36. Sarangapani, C.; Scally, L.; Gulan, M.; Cullen, P.J. Dissipation of Pesticide Residues on Grapes and Strawberries Using Plasma-Activated Water. Food Bioproc. Tech. 2020, 13, 1728–1741. [Google Scholar] [CrossRef]
  37. Song, Y.; Fan, X. Cold plasma enhances the efficacy of aerosolized hydrogen peroxide in reducing populations of Salmonella Typhimurium and Listeria innocua on grape tomatoes, apples, cantaloupe and romaine lettuce. Food Microbiol. 2020, 87, 103391. [Google Scholar] [CrossRef] [PubMed]
  38. Mujahid, Z.; Tounekti, T.; Khemira, H. Cold plasma treatment to release dormancy and improve growth in grape buds: A promising alternative to natural chilling and rest breaking chemicals. Sci. Rep. 2020, 10, 2667. [Google Scholar] [CrossRef]
  39. Xiang, Q.; Zhang, R.; Fan, L.; Ma, Y.; Wu, D.; Li, K.; Bai, Y. Microbial inactivation and quality of grapes treated by plasma-activated water combined with mild heat. LWT 2020, 109336. [Google Scholar] [CrossRef]
  40. Laurita, R.; Contaldo, N.; Zambon, Y.; Bisag, A.; Canel, A.; Gherardi, M.; Laghi, G.; Bertaccini, A.; Colombo, V. The use of plasma-activated water in viticulture: Induction of resistance and agronomic performance in greenhouse and open field. Plasma Process. Polym. 2020, 18, e2000206. [Google Scholar] [CrossRef]
  41. Zhao, Y.M.; Patange, A.; Sun, D.W.; Tiwari, B. Plasma-activated water: Physicochemical properties, microbial inactivation mechanisms, factors influencing antimicrobial effectiveness, and applications in the food industry. Compr. Rev. Food Sci. Food Saf. 2020, 19, 3951–3979. [Google Scholar] [CrossRef] [PubMed]
  42. Ashtiani, S.H.M.; Rafiee, M.; Morad, M.M.; Khojastehpour, M.; Khani, M.; Rohani, A.; Shokri, B.; Martynenko, A. Impact of gliding arc plasma pretreatment on drying efficiency and physicochemical properties of grape. Innov. Food Sci. Emerg. Technol. 2020, 63, 102381. [Google Scholar] [CrossRef]
  43. Bao, Y.; Reddivari, L.; Huang, J. Enhancement of phenolic compounds extraction from grape pomace by high voltage atmospheric cold plasma. LWT 2020, 133, 109970. [Google Scholar] [CrossRef]
  44. Jambrak, A.R.; Ojha, S.; Šeremet, D.; Nutrizio, M.; Maltar-Strmečki, N.; Valić, S.; Kljusurić, J.G.; Tiwari, B. Free radical detection in water after processing by means of high voltage electrical discharges and high power ultrasound. J. Food Process. Preserv. 2020, 45, e15176. [Google Scholar] [CrossRef]
  45. Muhammad, A.I.; Xiang, Q.; Liao, X.; Liu, D.; Ding, T. Understanding the impact of nonthermal plasma on food constituents and microstructure—A review. Food Bioprocess Technol. 2018, 11, 463–486. [Google Scholar] [CrossRef]
  46. López, M.; Calvo, T.; Prieto, M.; Múgica-Vidal, R.; Muro-Fraguas, I.; Alba-Elías, F.; Alvarez-Ordóñez, A. A review on non-thermal atmospheric plasma for food preservation: Mode of action, determinants of effectiveness, and applications. Front. Microbiol. 2019, 10, 622. [Google Scholar] [CrossRef]
  47. White, R.E. Understanding Vineyard Soils, 2nd ed.; Oxford University Press: Oxford, UK, 2015. [Google Scholar]
  48. Basalekou, M.; Pappas, C.; Tarantilis, P.; Kallithraka, S. Wine Authenticity and Traceability with the Use of FT-IR. Beverages 2020, 6, 30. [Google Scholar] [CrossRef]
  49. Aleixandre-Tudo, J.; Buica, A.; Nieuwoudt, H.; Aleixandre, J.; du Toit, W. Spectrophotometric analysis of phenolic compounds in grapes and wines. J. Agric. Food Chem. 2017, 65, 4009–4026. [Google Scholar] [CrossRef]
  50. Guilford, J.M.; Pezzuto, J.M. Wine and health: A review. Am. J. Enol. Vitic. 2011, 62, 471–486. [Google Scholar] [CrossRef] [Green Version]
  51. Golan, R.; Gepner, Y.; Shai, I. Wine and Health—New Evidence. Eur. J. Clin. Nutr. 2019, 72, 55–59. [Google Scholar] [CrossRef]
  52. Albu, C.; Radu, L.E.; Radu, G.L. Assessment of Melatonin and Its Precursors Content by a HPLC-MS/MS Method from Different Romanian Wines. ACS Omega 2020, 5, 27254–27260. [Google Scholar] [CrossRef] [PubMed]
  53. Ferraz da Costa, D.C.; Pereira Rangel, L.; Quarti, J.; Santos, R.A.; Silva, J.L.; Fialho, E. Bioactive Compounds and Metabolites from Grapes and Red Wine in Breast Cancer Chemoprevention and Therapy. Molecules 2020, 25, 3531. [Google Scholar] [CrossRef]
  54. OIV. State of the World Vitivinicultural Sector in 2019. 2020. Available online: http://www.oiv.int/public/medias/7298/oiv-state-of-the-vitivinicultural-sector-in-2019.pdf (accessed on 1 December 2020).
  55. OIV. 2020 Wine Production First Estimates 27/10/2020. 2020. Available online: http://www.oiv.int/public/medias/7541/en-oiv-2020-world-wine-production-first-estimates.pdf (accessed on 1 December 2020).
  56. Cotea, D.V.; Barbu, N.; Grigorescu, C.; Cotea, V.V. Vineyards and Wines of Romania; Academiei Române: Bucureşti, Romania, 2005. [Google Scholar]
  57. Ionesi, L.; Ionesi, B.; Lungu, A.; Rosca, V.; Ionesi, V. Sarmaţianul mediu şi superior de pe Platforma Moldovenească; Middle and Upper Sarmatian on Moldavian Platform; Academiei Române: Bucureşti, Romania, 2005; pp. 1–439. [Google Scholar]
  58. OIV. International Standard for the Labelling of Wines-Edition 2015. Available online: http://www.oiv.int/public/medias/4776/oiv-wine-labelling-standard-en-2015.pdf (accessed on 1 December 2020).
  59. OIV. Compendium of International Methods of Wine and Must Analysis. 2020. Available online: http://www.oiv.int/public/medias/7372/oiv-compendium-volume-1-2020.pdf (accessed on 1 December 2020).
  60. Tzachristas, A.; Pasvanka, K.; Calokerinos, A.; Proestos, C. Polyphenols: Natural antioxidants to be used as a quality tool in wine authenticity. Appl. Sci. 2020, 10, 5908. [Google Scholar] [CrossRef]
  61. Sanna, R.; Piras, C.; Marincola, F.; Lecca, V.; Maurichi, S.; Scano, P. Multivariate statistical analysis of the UV-vis profiles of wine polyphenolic extracts during vinification. J. Agric. Sci. 2014, 6, 152. [Google Scholar] [CrossRef] [Green Version]
  62. Aleixandre-Tudo, J.L.; du Toit, W. The Role of UV-Visible Spectroscopy for Phenolic Compounds Quantification in Winemaking. In Frontiers and New Trends in the Science of Fermented Food and Beverages; Solís-Oviedo, R.L., de la Cruz Pech-Canul, A., Eds.; IntechOpen: Rijeka, Croatia, 2018; pp. 1–22. [Google Scholar] [CrossRef] [Green Version]
  63. Yalçın, O.; Tekgündüz, C.; Öztürk, M.; Tekgündüz, E. Investigation of the traditional organic vinegars by UV–VIS spectroscopy and rheology techniques. Spectrochim. Acta Part A Mol. Biomol. Spectrosc. 2020, 246, 118987. [Google Scholar] [CrossRef]
  64. Ríos-Reina, R.; Azcarate, S.M.; Camiña, J.; Callejón, R.M. Assessment of UV–visible spectroscopy as a useful tool for determining grape-must caramel in high-quality wine and balsamic vinegars. Food Chem. 2020, 323, 126792. [Google Scholar] [CrossRef]
  65. Louw, L.; Roux, K.; Tredoux, A.; Tomic, O.; Naes, T.; Nieuwoudt, H.; Van Rensburg, P. Characterization of selected South African young cultivar wines using FTMIR spectroscopy, gas chromatography, and multivariate data analysis. J. Agric. Food Chem. 2009, 57, 2623–2632. [Google Scholar] [CrossRef]
  66. Sen, I.; Ozturk, B.; Tokatli, F.; Ozen, B. Combination of visible and mid-infrared spectra for the prediction of chemical parameters of wines. Talanta 2016, 161, 130–137. [Google Scholar] [CrossRef] [Green Version]
  67. Basalekou, M.; Kallithraka, S.; Tarantilis, P.A.; Kotseridis, Y.; Pappas, C. Ellagitannins in wines: Future prospects in methods of analysis using FT-IR spectroscopy. LWT 2019, 101, 48–53. [Google Scholar] [CrossRef]
  68. Topala, C.M.; Tataru, L.D. ATR-FTIR Spectroscopy Coupled with Chemical and Chemometric Analysis to Distinguish Between Some Sweet Wines. Rev. Chim. 2019, 70, 2355–2361. [Google Scholar] [CrossRef]
  69. Álvarez, Á.; Yáñez, J.; Neira, Y.; Castillo-Felices, R.; Hinrichsen, P. Simple distinction of grapevine (Vitis vinifera L.) genotypes by direct ATR-FTIR. Food Chem. 2020, 328, 127164. [Google Scholar] [CrossRef] [PubMed]
  70. Ferrer-Gallego, R.; Rodríguez-Pulido, F.; Toci, A.; García-Estevez, I. Phenolic Composition, Quality and Authenticity of Grapes and Wines by Vibrational Spectroscopy. Food Rev. Int. 2020, 1–29. [Google Scholar] [CrossRef]
  71. Lucarini, M.; Durazzo, A.; Kiefer, J.; Santini, A.; Lombardi-Boccia, G.; Souto, E.; Romani, A.; Lampe, A.; Nicoli, F.; Gabrielli, P.; et al. Grape seeds: Chromatographic profile of fatty acids and phenolic compounds and qualitative analysis by FTIR-ATR spectroscopy. Foods 2020, 9, 10. [Google Scholar] [CrossRef] [Green Version]
  72. Coimbra, M.; Gonçalves, F.; Barros, A.; Delgadillo, I. Fourier transform infrared spectroscopy and chemometric analysis of white wine polysaccharide extracts. J. Agric. Food Chem. 2002, 50, 3405–3411. [Google Scholar] [CrossRef]
  73. Banc, R.; Loghin, F.; Miere, D.; Fetea, F.; Socaciu, C. Romanian wines quality and authenticity using FT-MIR spectroscopy coupled with multivariate data analysis. Notulae Botanicae Horti Agrobotanici Cluj-Napoca 2014, 42, 556–564. [Google Scholar] [CrossRef] [Green Version]
  74. Aleixandre-Tudo, J.; Nieuwoudt, H.; Olivieri, A.; Aleixandre, J.; du Toit, W. Phenolic profiling of grapes, fermenting samples and wines using UV-Visible spectroscopy with chemometrics. Food Control 2018, 85, 11–22. [Google Scholar] [CrossRef]
  75. Minute, F.; Giotto, F.; Filipe-Ribeiro, L.; Cosme, F.; Nunes, F.M. Alternative Methods for Measuring the Susceptibility of White Wines to Pinking Alteration: Derivative Spectroscopy and CIEL*a*b* Colour Analysis. Foods 2021, 10, 553. [Google Scholar] [CrossRef] [PubMed]
  76. Gorinstein, S.; Moshe, R.; Deutsch, J.; Wolfed, F.; Tilis, K.; Stiller, A.; Flam, I.; Gat, Y. Determination of basic components in white wines by HPLC, FT-IR spectroscopy, and electrophoretic techniques. J. Food Compos. Anal. 1992, 5, 236–245. [Google Scholar] [CrossRef]
  77. Todasca, M.C.; Chira, N.; Deleanu, C.; Rosca, S. Romanian wine study using IR spectroscopy in comparison with 1 HNMR. UPB Sci. Bull. B Chem. Mater. Sci. 2007, 69, 3–10. [Google Scholar]
  78. Olejar, K.J.; Ricci, A.; Swift, S.; Zujovic, Z.; Gordon, K.; Fedrizzi, B.; Versari, A.; Kilmartin, P. Characterization of an antioxidant and antimicrobial extract from cool climate, white grape marc. Antioxidants 2019, 8, 232. [Google Scholar] [CrossRef] [Green Version]
  79. Bañuelos, M.A.; Loira, I.; Guamis, B.; Escott, C.; Del Fresno, J.M.; Codina-Torrella, I.; Quevedo, J.M.; Gervilla, R.; Chavarría, J.M.R.; de Lamo, S.; et al. White wine processing by UHPH without SO2. Elimination of microbial populations and effect in oxidative enzymes, colloidal stability and sensory quality. Food Chem. 2020, 332, 127417. [Google Scholar] [CrossRef]
  80. Dienes-Nagy, Á.; Marti, G.; Breant, L.; Lorenzini, F.; Fuchsmann, P.; Baumgartner, D.; Zufferey, V.; Spring, J.; Gindro, K.; Viret, O.; et al. Identification of putative chemical markers in white wine (Chasselas) related to nitrogen deficiencies in vineyards. OENO One 2020, 54, 583–599. [Google Scholar] [CrossRef]
  81. Mendes, E.; Duarte, N. Mid-Infrared Spectroscopy as a Valuable Tool to Tackle Food Analysis: A Literature Review on Coffee, Dairies, Honey, Olive Oil and Wine. Foods 2021, 10, 477. [Google Scholar] [CrossRef]
  82. Ţârdea, C. Chimia şi Analiza Vinului [Chemistry and Wine Analysis]; Ion Ionescu de la Brad: Iaşi, Romania, 2007. [Google Scholar]
  83. Delgado-González, M.; Carmona-Jiménez, Y.; Rodríguez-Dodero, M.; García-Moreno, M. Color Space Mathematical Modeling Using Microsoft Excel. J. Chem. Educ. 2018, 95, 1885–1889. [Google Scholar] [CrossRef]
  84. García-Marino, M.; Escudero-Gilete, M.; Escribano-Bailón, M.; González-Miret, M.; Rivas-Gonzalo, J.; Heredia, F. Colorimetric characteristics of the phenolic fractions obtained from Tempranillo and Graciano wines through the use of different instrumental techniques. Anal. Chim. Acta 2012, 732, 153–161. [Google Scholar] [CrossRef] [Green Version]
  85. Rolle, L.; Giordano, M.; Giacosa, S.; Vincenzi, S.; Segade, S.; Torchio, F.; Perrone, B.; Gerbi, V. CIEL*a*b* parameters of white dehydrated grapes as quality markers according to chemical composition, volatile profile and mechanical properties. Anal. Chim. Acta 2012, 732, 105–113. [Google Scholar] [CrossRef]
  86. Briones-Labarca, V.; Perez-Wom, M.; Habib, G.; Giovagnoli-Vicuña, C.; Cañas-Sarazua, R.; Tabilo-Munizaga, G.; Salazar, F.N. Oenological and quality characteristic on young white wines (sauvignon blanc): Effects of high hydrostatic pressure processing. J. Food Qual. 2017, 2017, 8524073. [Google Scholar] [CrossRef] [Green Version]
  87. Jacobson, J.L. Introduction to Wine Laboratory Practices and Procedures, 1st ed.; Springer: Berlin/Heidelberg, Germany, 2006; p. 135. [Google Scholar] [CrossRef]
  88. Bührle, F.; Gohl, A.; Weber, F. Impact of Xanthylium Derivatives on the Color of White Wine. Molecules 2017, 22, 1376. [Google Scholar] [CrossRef] [PubMed] [Green Version]
  89. Ewart, A. White wines. In Fermented Beverage Production; Lea, A.G.H., Piggott, J., Eds.; Springer: Berlin/Heidelberg, Germany, 2003; pp. 89–106. [Google Scholar] [CrossRef]
  90. Musther, J. VinoCalc. 2020. Available online: https://www.vinolab.hr/calculator/gravity-density-sugar-conversions-en19 (accessed on 1 May 2020).
  91. Gerber, I.; Mihaila, I.; Hein, D.; Nastuta, A.V.; Jijie, R.; Pohoata, V.; Topala, I. Time behaviour of helium atmospheric pressure plasma jet electrical and optical parameters. Appl. Sci. 2017, 7, 812. [Google Scholar] [CrossRef] [Green Version]
  92. Guo, J.; Huang, K.; Wang, X.; Lyu, C.; Yang, N.; Li, Y.; Wang, J. Inactivation of yeast on grapes by plasma-activated water and its effects on quality attributes. J. Food Prot. 2017, 80, 225–230. [Google Scholar] [CrossRef]
  93. Lukić, K.; Vukušić, T.; Tomašević, M.; Ćurko, N.; Gracin, L.; Ganić, K.K. The impact of high voltage electrical discharge plasma on the chromatic characteristics and phenolic composition of red and white wines. Innov. Food Sci. Emerg. Technol. 2019, 53, 70–77. [Google Scholar] [CrossRef]
  94. Nishime, T.; Wannicke, N.; Horn, S.; Weltmann, K.D.; Brust, H. A Coaxial Dielectric Barrier Discharge Reactor for Treatment of Winter Wheat Seeds. Appl. Sci. 2020, 10, 7133. [Google Scholar] [CrossRef]
  95. Starek-Wójcicka, A.; Sagan, A.; Terebun, P.; Kwiatkowski, M.; Kiczorowski, P.; Pawlat, J. Influence of a Helium–Nitrogen RF Plasma Jet on Onion Seed Germination. Appl. Sci. 2020, 10, 8973. [Google Scholar] [CrossRef]
  96. Wang, J.; Han, R.; Liao, X.; Ding, T. Application of plasma-activated water (PAW) for mitigating methicillin-resistant Staphylococcus aureus (MRSA) on cooked chicken surface. LWT 2020, 137, 110465. [Google Scholar] [CrossRef]
  97. Pan, Y.; Cheng, J.; Sun, D. Inhibition of fruit softening by cold plasma treatments: Affecting factors and applications. Crit. Rev. Food Sci. Nutr. 2020, 61, 1935–1946. [Google Scholar] [CrossRef] [PubMed]
  98. Xiang, Q.; Fan, L.; Li, Y.; Dong, S.; Li, K.; Bai, Y. A review on recent advances in plasma-activated water for food safety: Current applications and future trends. Crit. Rev. Food Sci. Nutr. 2020, 1–19. [Google Scholar] [CrossRef]
  99. Fan, L.; Liu, X.; Ma, Y.; Xiang, Q. Effects of plasma-activated water treatment on seed germination and growth of mung bean sprouts. J. Taibah Univ. Sci. 2020, 14, 823–830. [Google Scholar] [CrossRef]
  100. Zhou, Y.H.; Vidyarthi, S.K.; Zhong, C.S.; Zheng, Z.A.; An, Y.; Wang, J.; Wei, Q.; Xiao, H.W. Cold plasma enhances drying and color, rehydration ratio and polyphenols of wolfberry via microstructure and ultrastructure alteration. LWT 2020, 134, 110173. [Google Scholar] [CrossRef]
  101. Gerling, T.; Nastuta, A.V.; Bussiahn, R.; Kindel, E.; Weltmann, K.D. Back and forth directed plasma bullets in a helium atmospheric pressure needle-to-plane discharge with oxygen admixtures. Plasma Sources Sci. Technol. 2012, 21, 034012. [Google Scholar] [CrossRef] [Green Version]
  102. Gerling, T.; Wild, R.; Nastuta, A.V.; Wilke, C.; Weltmann, K.D.; Stollenwerk, L. Correlation of phase resolved current, emission and surface charge measurements in an atmospheric pressure helium jet. Eur. Phys. J. Appl. Phys. 2015, 71, 20808. [Google Scholar] [CrossRef]
  103. Luque, J.; Crosley, D.R. LIFBASE: Database and spectral simulation program (version 1.5). SRI Int. Rep. MP 1999, 99. Available online: https://ci.nii.ac.jp/naid/10011750245 (accessed on 5 August 2021).
  104. Navrátil, Z.; Trunec, D.; Šmíd, R.; Lazar, L. A software for optical emission spectroscopy-problem formulation and application to plasma diagnostics. Czechoslov. J. Phys. 2006, 56, B944–B951. [Google Scholar] [CrossRef]
  105. Radzig, A.A.; Smirnov, B.M. Reference Data on Atoms, Molecules, and Ions; Springer: Berlin/Heidelberg, Germany, 1985; pp. 230–235. [Google Scholar] [CrossRef]
  106. Kramida, A.; Ralchenko, Y.; Reader, J.; Team, N.A. NIST Atomic Spectra Database (version 5.8). 2020. Available online: https://physics.nist.gov/asd (accessed on 1 December 2020). [CrossRef]
  107. Junqua, R.; Carullo, D.; Ferrari, G.; Pataro, G.; Ghidossi, R. Ohmic heating for polyphenol extraction from grape berries: An innovative prefermentary process. OENO One 2021, 55, 39–51. [Google Scholar] [CrossRef]
  108. Azcarate, S.M.; Cantarelli, M.Á.; Pellerano, R.G.; Marchevsky, E.J.; Camiña, J. Classification of Argentinean Sauvignon blanc wines by UV spectroscopy and chemometric methods. J. Food Sci. 2013, 78, C432–C436. [Google Scholar] [CrossRef]
  109. Kerslake, F.; Longo, R.; Dambergs, R. Discrimination of juice press fractions for sparkling base wines by a UV-Vis spectral phenolic fingerprint and chemometrics. Beverages 2018, 4, 45. [Google Scholar] [CrossRef] [Green Version]
  110. Scutaru, I.; Balanuta, A.; Zgardan, D. The determination of oxidation behavior of white wines produced from local and european grape varieties using spectrophotometric method. J. Eng. Sci. 2018, XXV, 82–93. [Google Scholar] [CrossRef]
  111. Martelo-Vidal, M.J.; Vazquez, M. Evaluation of ultraviolet, visible, and near infrared spectroscopy for the analysis of wine compounds. Czech J. Food Sci. 2014, 32, 37–47. [Google Scholar] [CrossRef] [Green Version]
  112. Yu, J.; Wang, H.; Zhan, J.; Huang, W. Review of recent UV–Vis and infrared spectroscopy researches on wine detection and discrimination. Appl. Spectrosc. Rev. 2018, 53, 65–86. [Google Scholar] [CrossRef]
  113. Banc, R.; Loghin, F.; Miere, D.; Ranga, F.; Socaciu, C. Phenolic composition and antioxidant activity of red, rosé and white wines originating from Romanian grape cultivars. Notulae Botanicae Horti Agrobotanici Cluj-Napoca 2020, 48, 716–734. [Google Scholar] [CrossRef]
Figure 1. Plasma source set-up (left) and plasma-must treatment in a Petri dish (right).
Applsci 11 08498 g001
Figure 2. Typical voltage–current waveforms of the He–appj in mid air (dash line) and interacting with the withe must (short dot line).
Applsci 11 08498 g002
Figure 3. The emission spectra of the He-appj in mid air (left side) and interacting with the white must (right side).
Applsci 11 08498 g003
Figure 4. The absorbance spectra of untreated and treated must in the 200–1100 nm range.
Applsci 11 08498 g004
Figure 5. The IR transmittance spectra of untreated and plasma treated wine samples (1y old).
Applsci 11 08498 g005
Figure 6. Colour parameters, C.I. and hue, for the untreated and plasma treated must.
Applsci 11 08498 g006
Figure 7. Color space for control (MB) and plasma treated (PB) Bârzeşti must, according to [83]. The black dots represent the points (a*, b*) of the samples, while the red horizontal line in the bar graphs represents the L*, R, G and B of the 1 and 2 year old samples.
Applsci 11 08498 g007
Figure 8. Color space for the control (MH) and plasma treated (PH) Huşi must, according to [83]. The black dots represent the points (a*, b*) of the samples, while the red horizontal line in the bar graphs represents the L*, R, G and B of the 1 and 2 year old samples.
Applsci 11 08498 g008
Table 1. Characteristic wavenumbers (cm−1) for bending vibrations and stretching in wine samples, as reported by [67,68,69,72,76,77].
Wavenumber Regions (cm−1)GroupsAssignment
<1000stretching and bending vibrationsphosphates, phenolics, mono-substituted phenyl derivates, unsaturated lipids, carotenoids
1068–1065 1107–1110 1200stretching vibration of C-O O-H stretch second overtonessugars and organic acids
950–1250stretching and bending vibrationshydrolyzable and condensed tannins glucose, oligo- and polysaccharides, alcohols
1457–1288C=O, C=C, -CH2-, C-H, -CH3, O-Haldehydes, carboxy
1530–1600C-Namino acids and derivatives
1516–1519 1610–1614C=Caromatic compounds, flavonoids
1700C=Oorganic acids
1704–1712C=Oesters of hydrolyzable tannins, derivatives of gallic acid and flavors
1600–1900O-H stretching C-H3 stretch first overtone C-H2, C-H stretch first overtoneswater, ethanol, glucose
2100–2300C-H combinations vibrations and overtonessugar and ethanol
2800–3000C-H stretching of hydrocarbons -CH3 asymmetric stretching vibration O-H stretching of carboxylic acidsglycerol, catechins and free phenolic acids
3000–3500-OHalcohols, phenols, water
Table 2. Normalized spectral lines and bands intensity observed in the discharge with energies Ek of the upper states from [105,106].
λ
[nm]
TransitionNormalized IntensityEk
[eV]
in Midairwith Must
308 OH ( A 2 Σ + ) ( X 2 Π i ) 0.33314
337 N2 ( C 3 Π u ) ν = 0 ( B 3 Π g ) ν = 0 0.7820.92711.0
391 N 2 + ( B 2 Σ u + ) ν = 0 ( X 2 Σ g + ) ν = 0 10.29918.7
486 H β 4 ← 20.0700.11712.7
587 He ( 3 d ) ( 2 p ) 0.0670.07823.1
667 He ( 3 d ) ( 2 p ) 0.0580.09123.1
706 He ( 3 s ) ( 2 p ) 0.0730.08822.7
728 He ( 3 s ) ( 2 p ) 0.0670.07622.9
777 O 3 s 5 S 2 0 3 p 5 P i 0.0970.11110.7
844 O 3 s 3 S 1 0 3 p 3 P i 0.0540.08711.0
Table 3. Characteristic temperatures derived from the OES spectra of the plasma source and measured via IR and k-type thermocouple (mean ± standard deviation).
MethodTrot (OH)
[K]
Trot ( N 2 + )
[K]
Tv ( N 2 )
[K]
Tgas
[°C]
Spectrum Analyzerxx2265 − 2566 ± 190x
Lifbase340 − 350 ± 2345 − 355 ± 2xx
IR cameraxxx40 ± 1.5
k-type probexxx35 ± 3.0
Table 4. Wavenumber regions measured in the studied wine samples, similar to those reported by [68,72,73,76,77,112].
Wine SamplesRegion 1
500–960
(cm−1)
Region 2
1000–1200
(cm−1)
Region 3
1250–2000
(cm−1)
Region 4
2800–3500
(cm−1)
MB865, 9031044, 10841318, 1385, 16362983, 3290
PB8761044, 10881317, 1397, 1456, 16362984, 3303
MH8761044, 10851274, 1392, 1455, 16362983, 3290
PH8751044, 10841320, 1388, 1456, 16362980, 3313
Table 5. Plasma effect on color parameters: CIE L*a*b*, WI, chroma, angle hue and Δ E a b * (measured against the untreated must) of white wine and the corresponding R G B coordinates (using equation system (1) and [83]), for 1 and 2 years old wine (mean ± standard deviation).
SampleL*a*b*WI C a b * h ab Δ E a b * RGB
1y MB85.49 ± 0.036.43 ± 0.0239.19 ± 0.0357.72 ± 0.0639.71 ± 0.0680.68 ± 0.09-250208138
1y PB95.26 ± 0.021.20 ± 0.0522.00 ± 0.0877.46 ± 0.0522.03 ± 0.0986.88 ± 0.0120.45 ± 0.03255239198
2y MB78.22 ± 0.0712.18 ± 0.0448.34 ± 0.0645.60 ± 0.0249.85 ± 0.0175.85 ± 0.06-241183102
2y PB91.13 ± 0.063.01 ± 0.0325.89 ± 0.0172.46 ± 0.0926.07 ± 0.0683.36 ± 0.0327.47 ± 0.05254226179
1y MH84.75 ± 0.058.48 ± 0.0242.98 ± 0.0953.62 ± 0.0543.80 ± 0.0478.83 ± 0.07-252204129
1y PH86.26 ± 0.087.98 ± 0.0541.58 ± 0.0455.49 ± 0.0842.34 ± 0.0879.13 ± 0.052.12 ± 0.02255209136
2y MH85.64 ± 0.048.95 ± 0.0841.75 ± 0.0754.95 ± 0.0342.70 ± 0.0577.90 ± 0.01-255206134
2y PH87.32 ± 0.097.19 ± 0.0637.83 ± 0.0459.46 ± 0.0738.51 ± 0.0979.24 ± 0.034.62 ± 0.05255212146
Table 6. Physico-chemical parameters of fresh must, control and plasma treated (MB-PB, MH-PH). Measured pH, Brix, as well as the estimated (italic) dissolved sugar and density by using VinoCalc [90], and potential alcohol by using Equation (1) (mean ± standard deviation).
SamplepHBrix
(%)
Dissolved Sugar
(g/L)
Density
(g/L)
Potential Alcohol
(% v/v)
MB3.3 ± 0.110.5 ± 0.5109.410425.55
PB3.3 ± 0.110.5 ± 0.5109.410425.55
MH3.4 ± 0.115.0 ± 0.5159.210618.13
PH3.4 ± 0.115.0 ± 0.5159.210618.13
Table 7. Physico-chemical parameters of 1 and 2-year-old wine, control and plasma treated (MB-PB, MH-PH) samples. Measured pH, Brix, the estimated (italic) dissolved sugar and density by using VinoCalc [90], and measured alcohol by using vinometer (mean ± standard deviation).
SamplepHBrix
(%)
Dissolved Sugar)
(g/L)
Density
(g/L)
Alcohol
(% v/v)
1y MB3.5 ± 0.16.0 ± 0.561.4102316.5 ± 1
1y PB3.5 ± 0.16.0 ± 0.561.4102315.0 ± 1
2y MB3.6 ± 0.17.0 ± 0.571.9102717.0 ± 1
2y PB3.6 ± 0.16.0 ± 0.561.4102316.0 ± 1
1y MH3.5 ± 0.110.0 ± 0.5104.5104013.0 ± 1
1y PH3.5 ± 0.110.0 ± 0.5104.5104011.0 ± 1
2y MH3.4 ± 0.16.5 ± 0.566.6102516.0 ± 1
2y PH3.4 ± 0.16.0 ± 0.561.4102315.5 ± 1
Publisher’s Note: MDPI stays neutral with regard to jurisdictional claims in published maps and institutional affiliations.

