Article

Analysis of Bearing Strength of Post-Tensioning Anchorage Zone with Respect to Relative Bearing Area and Lateral Confinement Design

1
Department of Civil Engineering, Seoul National University of Science and Technology, 232 Gongneung-ro, Nowon-gu, Seoul 01811, Korea
2
Department of Civil Engineering, Keimyung University, 1095 Dalgubeol-daero, Dalseo-gu, Daegu 42601, Korea
*
Author to whom correspondence should be addressed.
Appl. Sci. 2021, 11(18), 8386; https://doi.org/10.3390/app11188386
Submission received: 5 August 2021 / Revised: 2 September 2021 / Accepted: 3 September 2021 / Published: 9 September 2021
(This article belongs to the Section Civil Engineering)

Abstract

:
This study aimed to evaluate the bearing strength of the post-tensioning anchorage zone with respect to the relative bearing area and lateral confinement design of spiral and stirrup rebars. Eleven specimens were fabricated and tested to fracture in accordance with EAD 160004-00-0301. Load-displacement curves and fracture modes were analyzed. Then, the conventional design equation for the bearing strength and previous findings on the relative bearing area was re-investigated in comparison with the test results. From the test, the representative findings are as follows: (1) A specimen with relatively small size and less lateral reinforcement is more likely to be affected by the wedge action of the anchorage device; however, a larger specimen is affected by both concrete crushing and/or spalling; (2) The behavior of the anchorage zone is markedly affected by the local behavior near the anchorage bearing plate, and the sectional efficiency is mostly determined by A/Ag; (3) For specimens with A/Ag = 9.52, the proportional limit of the load-displacement curve is determined by the yield of spiral rebar or fracture of the bearing plate, but the later part of the curve is determined by lateral confinement; (4) The maximum A/Ag that could produce 100% sectional efficiency is about 2.0 for the anchorage bearing plate used in the test; (5) For a fully confined specimen with a small-diameter spiral for minimum anchorage spacing, the stirrup rebar design mainly influences crack occurrence and patterns when the size of the specimen is equal to the minimum anchorage spacing; however, the area of the load-displacement curve after the proportional limit as well as crack occurrence and patterns are also influenced by stirrup rebar design when A/Ag is relatively large; (6) Finally, a revised design model is proposed to effectively estimate the ultimate bearing strength of the post-tensioning anchorage zone without respect to A/Ag. From the comparison of the design equations, it was concluded that the proposed equation provides a more reliable prediction with a 14.0% average error rate and 5.7% standard deviation of error rate.

1. Introduction

Post-tensioning is a method of prestressing in which prestress steel is tensioned after the concrete has hardened [1]. Post-tensioning uses ducts, several bundles of high-strength steel strands, and anchorage systems. The ducts are installed prior to concrete casting to accommodate the strands. The strands are tensioned and anchored after concrete hardening, and the concrete is prestressed simultaneously with the tensioning of the tendon. Hundreds of tons of force are exerted on the anchorage device and transferred to the concrete. Therefore, high levels of local compressive and tensile stresses are concentrated near the anchorage device in the area referred to as the local anchorage zone. In order to avoid failure of the zone during and/or after prestressing, spiral and stirrup rebars are densely placed. Spiral rebars confine the concrete surrounding the anchorage device and enhance its compressive strength. Stirrup rebars resist the bursting force by the wedge action of the anchorage device.
Several studies have investigated anchorage zone behavior. Wurm and Daschner [2] found that reinforcement with spiral rebar was the most effective anchorage zone confining method, but that it was not effective if it did not cover the appropriate length. Suzuki and Nakatsuka [3] studied the failure modes of local anchorage zones according to reinforcement details and found that failures occurred by (1) splitting in an under-reinforced specimen; (2) concrete crushing beneath the anchorage device in cases of spiral reinforcement; and (3) cone-shaped wedge action in the transition zone between the local and general zones where the prestressing force spreads out over the entire cross-section. Roberts-Wollmann [4] and Wollmann and Roberts-Wollmann [5] proposed a design model, which is based on the work of Richart et al. [6]. The design model allows to consider the favorable confinement effect; thus, the estimated bearing strength is higher. They suggested a confining pressure limit of 8.3 MPa based on the results of Wurm and Daschner [2]. J.L. Zhao et al. [7] proposed a modified analysis approach for the interior anchorage zone of post-tensioned concrete structure, but their study focused on the bursting behavior of the anchorage zone.
Cervenka and Ganz [8] analyzed anchorage zone performance based on nonlinear numerical analysis in comparison with the design model of Wollmann and Roberts-Wollmann [5]. The study revealed that the design model of Wollmann and Roberts-Wollmann [5] should not be applied to cases that have not been confirmed by testing. The design model underestimates the bearing resistance of post-tensioning anchorage zones with rectangular cross-sections but overestimates it when the area is a square that is larger than the minimum anchorage spacing. The numerical results by Cervenka and Ganz [8] showed that the ultimate bearing strength is hardly affected by anchorage spacing or specimen size if it is greater than the minimum spacing. If the wedge action is dominant and stress is solely concentrated immediately beneath the bearing plate, the result could be reasonable. However, additional confinement or strengthening by the surrounding concrete should be expected in a large specimen.
Recently, some research groups [9,10,11,12] investigated the use of ultra-high performance concrete (UHPC) in prestressed concrete beams where slender anchorage zones with less rebar reinforcement are required. Due to the high compressive and tensile strength of UHPC compared to conventional concrete, the use of UHPC could significantly reduce or eliminate the need for rebar reinforcement in the local anchorage zone; it can most likely be replaced by steel fiber. Based on extensive experimental and numerical research, Kim et al. [11] proposed a design equation for the ultimate bearing strength in which the coefficient of strength enhancement by spiral rebar was formulated as a linear function of concrete compressive strength with positive slope. Theoretically, the greater strength of concrete should result in less strength enhancement by lateral pressure, so a more rigorous study may be required to clarify the effect of spiral rebar in the anchorage zone using UHPC.
Kim et al. [13] conducted a study on local anchorage zone behavior according to the relative size of the bearing plate based on numerical analyses, and they compared the results with the design equations of Wollmann and Roberts-Wollmann [5] and those of European post-tensioning anchorage systems such as Dywidag and VSL. The study concluded that estimation of the design model is highly affected by not only the minimum anchorage spacing but also the confining reinforcement details. Kwon et al. [14] and Kim et al. [15] carried out load-transfer tests of more than 30 specimens of post-tensioning anchorage concrete blocks. The research mainly focused on the effects of steel fiber and rebar reinforcement on the ultimate bearing strength of the local anchorage zone, but the relative sizes of the concrete cross-section and anchorage bearing plate were not considered. Kwon et al. [16] extended that research based on a numerical approach to identify the effect of horizontal ribs for the additional bearing area in special anchorage devices, and they proposed the modified bearing capacity equation based on the model of Wollmann and Roberts-Wollmann [4,5]. Mao et al. [17] and Lee and Kim [18] focused on stress distribution, crack formation, and ultimate capacity with respect to the bursting force in the anchorage zone. Bonetti et al. [19], Marchão et al. [20], Rebelo et al. [21] performed on the influence of confining reinforcement on the bearing strength of concrete blocks. Their research took similar approaches as other research, such as the investigation of the existing and proposed design equations for better estimation. Concrete strain and crack opening on the specimen surface are very difficult to measure because the strain is highly affected by the crack that is irregularly formed. So most research investigated strength rather than strain or crack opening.
In this study, 11 specimens were manufactured considering both the anchorage spacing (or concrete block size) and confinement effect and were tested to fracture in accordance with EAD 160004-00-0301 [22]. In the first group of specimens, the ratio of supporting concrete surface to bearing plate gross area (A/Ag) varied from 1.82 to 9.52. In the second group, the confinement effect of spiral rebar design was investigated by varying the spiral diameter and rebar size. In the final group, the additional confinement effect by stirrup rebar was investigated along with the effect of concrete between the spiral and stirrup. The load-displacement curve and fracture modes were analyzed for each case. The design model by Wollmann and Roberts-Wollmann [4,5] was reconstructed for the correct application to special anchorage bearing plates, and coefficients were proposed to correct the effect of A/Ag and lateral confinement in specimens larger than the minimum anchorage spacing. Finally, the proposed model in this paper was compared with test results and the previous design equations for the verification of its efficiency and correctness.

2. Design Models for Post-Tensioning Anchorage Zone Bearing Strength

Essentially, the strength of anchorage devices and anchorage zones must be sufficient for the transfer of tendon force to the concrete, and the formation of cracks in the anchorage zone must not impair the function of the anchorage device [23,24]. AASHTO [25] classifies anchorage devices as basic and special anchorages. For a basic anchorage device with a simple bearing plate, as shown in Figure 1, prestressing force is transferred from prestressing steel to concrete only through the bearing plate on the supporting concrete surface and the bearing resistance ( P r ) is expressed as a function of the relative size of the proportional supporting concrete surface area (A) to the gross area (Ag) of the anchorage bearing plate and the nominal concrete strength at the time of application of the tendon force ( f c i ). A special anchorage device with one or more horizontal ribs to increase the net bearing area (Ab) could be used based on test qualification even though the bearing resistance, as determined by Equations (1) and (2), is lower than the required strength. Equations (1) and (2) do not consider the strength enhancement due to confinement of concrete by spiral rebars around the anchorage device, and they often lead to highly conservative designs for special anchorage devices with spiral rebars [16]. Furthermore, Equation (2) limits the effective supporting concrete surface area to 10.33 times the gross bearing area ( A 10.33 A g ) without respect to reinforcement condition.
P r = f n A b
where
f n = 0.7 f c i A A g 2.25 f c i
PTI [5] presented an equation for the allowable stress ( f c p i ) for a basic anchorage bearing plate that adopted coefficients, α and κ , to consider lateral rebar confinement, as shown in Equation (3). The concrete stress under the maximum allowable tendon force should be equal to or less than f c p i when α and κ are 0.5 and 1, respectively, and the lateral rebar volume ratio ( ρ s ) is zero. α and κ are 0.75 and 1.5, respectively, when ρ s is larger than 2%. Between ρ s = 0 % and 2 % , α and κ are determined by interpolation. Equation (3) implies that A / A g is limited to 4.
f c p i = α f c i A / A g κ f c i
Eurocode [23] specifies additional rules for the design of anchorage zones for multiply anchored tendons along with the qualification test in accordance with EAD 160004-00-0301 [22]. The rectangular supporting concrete block associated with each anchorage device should satisfy Equation (4), and the reinforcement ( A s ) should not be less than the value determined by Equation (5) to prevent bursting and spalling of the concrete.
P m a x c · c 0.6 f c k ( t )
where P m a x is the maximum applied tendon force, c , c are the dimensions of the rectangular concrete block, and the rectangle should have approximately the same aspect ratio as the anchorage bearing plate. That is, c / a and c / a should not be greater than 1.25 c · c a · a where a and a are the dimensions of the smallest rectangle, including the bearing plate of the anchorage device. In addition, the maximum distribution area is limited to 9 times the loaded area ( A 9.0 A g ), and f c k ( t ) is the characteristic compressive cylinder strength of concrete at the time of tensioning.
A s = 0.15 P m a x f y γ p , u n f a v   with   γ p , u n f a v 1.20
where f y is the design strength of the reinforcing steel, γ p , u n f a v is the partial factor for prestress in unfavorable situations. The design model by Wollmann and Roberts-Wollmann [5] for special anchorage zones is shown in Equation (6). PTI [5] also includes the design model for special bearing plates. A special anchorage zone should be qualified based on an actual size test for typical sizes. The bearing strength of a special anchorage zone for which size has not been tested could be interpolated or extrapolated based on a comparison between the qualified test results and Equation (6). The ultimate bearing resistance, P n , comprises the bearing resistance by concrete, P c , and additional strength by confinement of spiral or stirrup rebar, P s . Equation (7) implies the bearing resistance of concrete by direct contact and confinement by the surrounding concrete, and the maximum relative bearing area of A / A g is limited to 6.25.
P n = η ( P c + P s ) 3 f c i A b
P c = 0.8 f c i A b A / A g 2 f c i A b
P s = 4.1 f l a t A c o r e  
where A b is the net bearing plate area, f l a t is the lateral confinement pressure, 2 A s f y D · s ( = f l a t , s p ) for spiral reinforcement and 2 A s f y L · s ( = f l a t , s t ) for stirrup reinforcement. f y is the yield strength of rebar. The maximum effective lateral confinement pressure is limited to 8.3 MPa, D, L, and s are the diameter of spiral, side length of stirrup, and spacing of spiral or stirrup rebars, respectively, A c o r e is the effectively confined concrete core area, D 2 π 4 ( 1 s D ) 2 A d u c t for spiral reinforcement (= A c o r e , s p ) and 1 2 L 2 A d u c t for stirrup reinforcement (= A c o r e , s t ), and the calibration factor, η , which ranges from 0.85 to 0.95, was assumed to be 0.85 in this study.
Unlike the basic anchorage bearing plate in Figure 1, the special anchorage bearing plates, as in Figure 2a, contains cones and ribs; thereby, those influences should be included in the contribution of lateral reinforcement (Ps). Considering that the behavior of the anchorage zone is highly dependent on the behavior of the concrete directly beneath the bearing plate, the above equation for A c o r e should be modified. In this study, average area loss ( A a n c h o r a g e ) by the anchorage bearing plate is substituted with A d u c t , and it was assumed to be a hollow column with a mid-point cone diameter of 115.5 mm.
A c o r e , s p = D 2 π 4 ( 1 s D ) 2 A a n c h o r a g e
A c o r e , s t = 1 2 L 2 A a n c h o r a g e
Meanwhile, the FEM-based research of Cervenka and Ganz [8] revealed that the ultimate bearing strength is rarely affected by the dimensions of the concrete block if the dimensions are larger than the minimum spacing specified by the anchorage supplier and the spiral remains unchanged. In that study, A / A g of the basic model was 2.8; it varied from 4.38 to 11.18 in additional FEM analysis. However, the authors stated that the design equation by Wollmann and Roberts-Wollmann [5] estimated an increase in the ultimate strength of 12%, 23%, and 45% for A / A g = 4.38, 6.25 and 11.18, respectively. Considering the design guides and research mentioned above, experimental verification is necessary to determine which design guide is more reasonable.
The modified model by Kwon et al. [16] proposed a method of determining the net bearing area of a special anchorage with horizontal ribs. The reduction coefficient, R , which is determined depending on the position and number of ribs, is factored into the additional net area by the ribs. In this study, a value of R = 0.85 was calculated, as a special anchorage device with a rib at the center in the longitudinal direction was used.

3. Experiments

Eleven specimens were fabricated for the load-transfer test in accordance with both the anchorage supplier’s design and EAD 160004-00-0301 [22], all of which were made using the same concrete mixture. All specimens had square sections ( c × c ) and lengths that were twice the sectional dimension ( h = 2 c ). Cylindrical specimens 100 mm in diameter and 200 mm in height were made based on ASTM C31 [26] and cured under the same conditions as the anchorage zone specimens. The average concrete strength, based on ASTM C39 [27], was 32.6 MPa on the day of the test. The average yield strength of the rebar was 455 MPa, and the average yield and tensile strength of the cast iron in the anchorage bearing plate were 184 and 288 MPa, respectively. The diameter of the anchor head and the diameter of the hole on the top surface of the anchorage bearing plate were 199 and 125 mm, respectively, as shown in Figure 2a.
Details of the specimens are given in Table 1 and Figure 3. Identical anchorage devices were used in the test, each of which accommodated 12 strands and had a square bearing plate and a horizontal rib at the center of the anchorage in the longitudinal direction, as shown in Figure 3. The specimens were placed on the strong bed of a 10 MN universal testing machine (UTM) and subjected to cyclic loading from 12% to 80% of the tendon strength ( F p k ) 10 times, followed by a continuous load increase up to fracture, as shown in Figure 4. Compressive test specimens are very sensitive to accidental eccentricity and surface contact conditions between the specimen bottom and UTM bed. An effort was made to increase precision during the fabrication process by using steel formwork and additional support for the sidewall of the formwork. If an unexpected surface flatness error occurred, a thin shim steel plate was used to fill the small gap that formed between the bottom surface of the specimen and the UTM bed. The load was applied to the anchor head on top of the anchorage device, as shown in Figure 4, to simulate the loading condition in a complete anchorage. Sensors in the UTM were used to measure load and displacement.
The basic model, A12H-1, was determined on the basis of the details provided by an anchorage supplier. The anchorage bearing strength exceeds the acceptance criteria, and the model satisfies the requirements of EAD 160004-00-0301 [22].
The first group of specimens from A12H-1 to 5 was made to investigate the effect of A / A g in the range from 1.82 to 9.52 under identical spiral conditions and to reinvestigate the numerical results of Cervenka and Ganz [8]. Figure 3a,b illustrate specimens with identical spirals but different A / A g values. Considering stress transfer from a smaller bearing plate to a larger concrete section, the stress dispersion ratio, m:n in Figure 1, can range from approximately 0.5:1 to 3:1, depending on the interaction between the two parts. Even though the bearing strength is not proportional to the dispersion ratio, a higher strength might be expected with higher A / A g .
The second group, A12H-1 and A12H-3–7 was created to investigate the confinement effect induced by the spiral and the concrete surrounding the spiral. Two different spiral diameters (D = 295 and 745 mm) and two different sizes of spiral and stirrup rebar (Φ10 and Φ16 mm) were chosen under a constant A / A g of 1.82 or 9.52. Theoretically, as shown in Figure 2, the concrete surrounding the spiral may contribute additional lateral confinement with a pressure of f l a t , c o n c = f r ( L D ) D , where f r (= 0.63 f c i ) is the modulus of rupture of concrete. However, this is only possible in the absence of bursting cracks, so the additional confinement effect of the surrounding concrete should be carefully considered. In the absence of cracking in the 550 and 800 mm specimens with spiral diameters of 295 mm, f l a t , c o n c was calculated as 3.11 and 6.16 MPa, respectively.
The third group, A12H-1 and -3 and A12H-8–11, was made to investigate the additional confinement effect of stirrup rebar, which is mainly intended to resist the bursting force due to wedge action of the anchorage. According to Kwon et al. [14], placement of the stirrup such that it resists the bursting force more than necessary could contribute to the additional confinement. However, the maximum confining pressure is limited to 13 MPa. The additional confinement of the stirrup ( f l a t , s t ) can be expressed as shown in Equation (11), and it confines the concrete as shown in Figure 2b. The lateral confinement contribution on the bearing strength by stirrup can be expressed by Equation (16) or Equation (17). When the spacing between the spiral and stirrup is negligibly small, Equation (16) may be used. Otherwise, Equation (17) may be used.
f l a t , s t = 2 A s f y , s t * L · s
f y , s t * = f y f s t , b u r s t i n g
f s t , b u r s t i n g = T A s t η
T = k P ( 1 a b )
f l a t , e q = f l a t , s p + β f l a t , s t
P s = 4.1 f l a t , e q A c o r e , s p
P s = 4.1 f l a t , s p A c o r e , s p + 4.1 f l a t , s t A c o r e , s t
where f y , s t * is the remaining strength of the stirrup up to the yield strength f s t , b u r s t i n g is the stress acting on the stirrup rebar by the bursting force, T. P is the tendon force. To compare the test results and the estimations, the maximum load in the load-transfer test is used. a and b are the widths of the bearing plate and concrete block, respectively. k is a coefficient that represents the stress dispersion ratio; 0.25 is frequently used. f l a t , e q is the equivalent lateral confinement pressure induced by the spiral and stirrup. β is a confined area correction factor, β = A c o r e , s t A c o r e , s p 1.0 .

4. Test Results and Analysis

4.1. Effect of A/Ag Ratio (A12H-1–5)

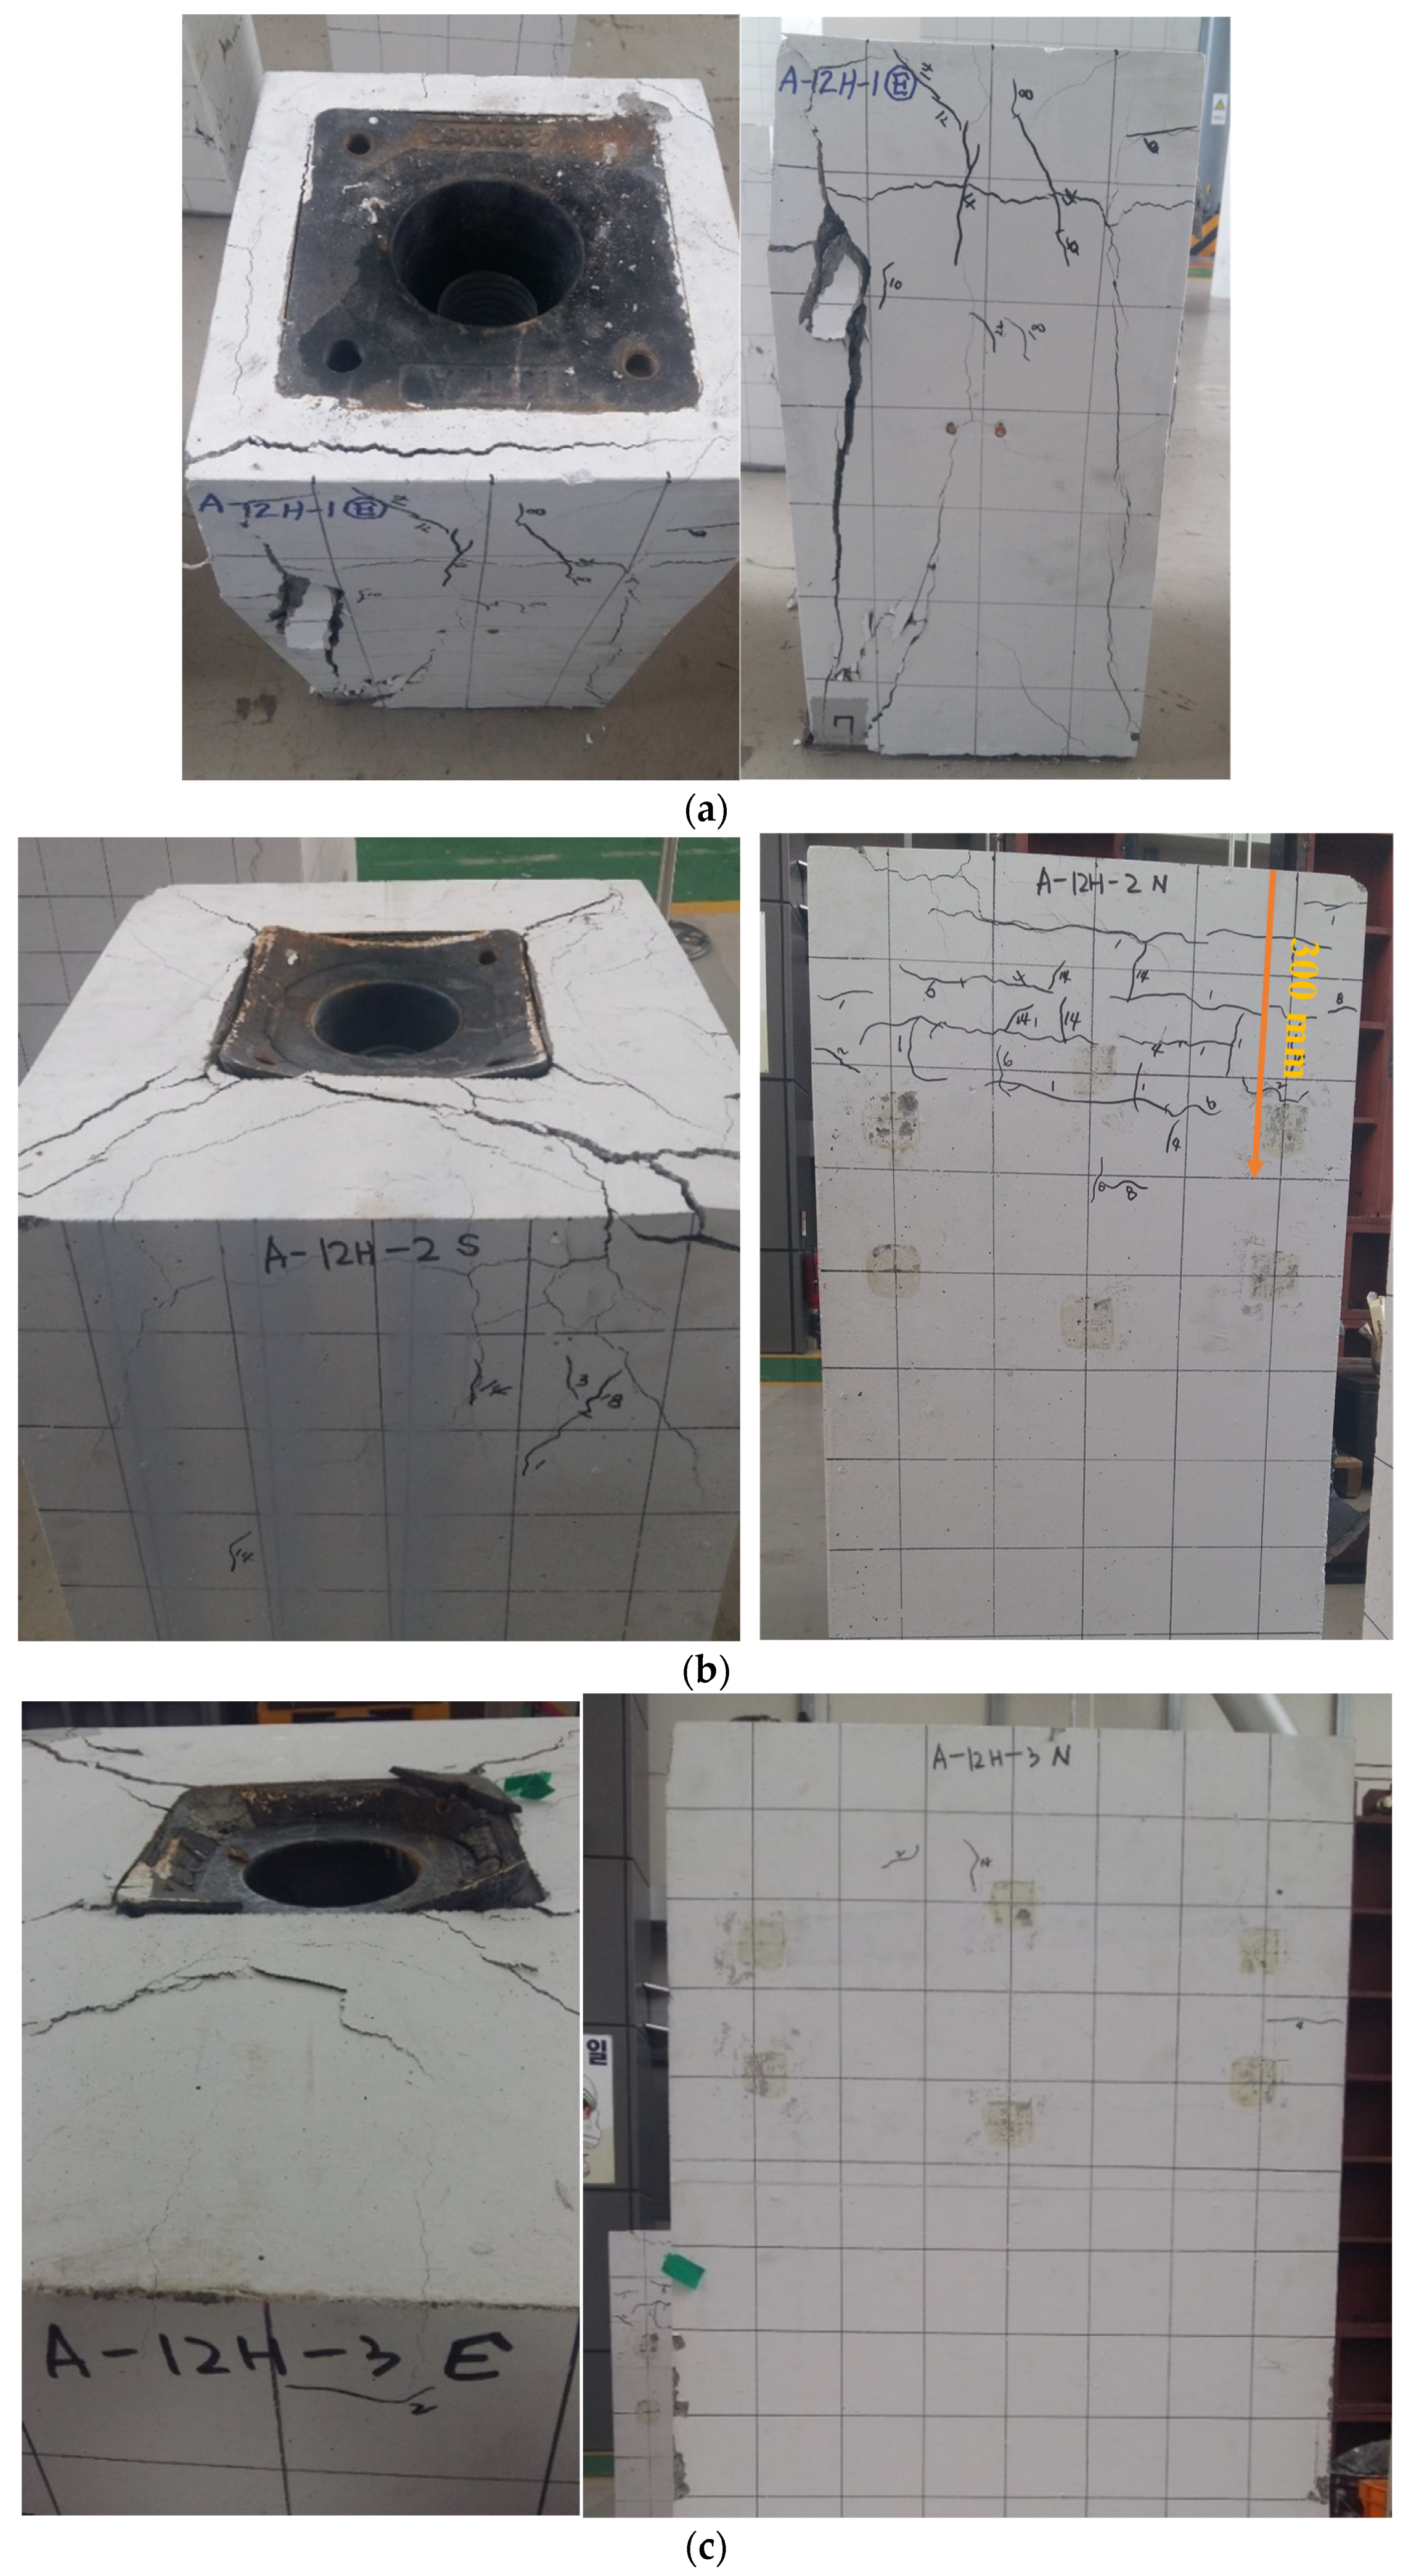
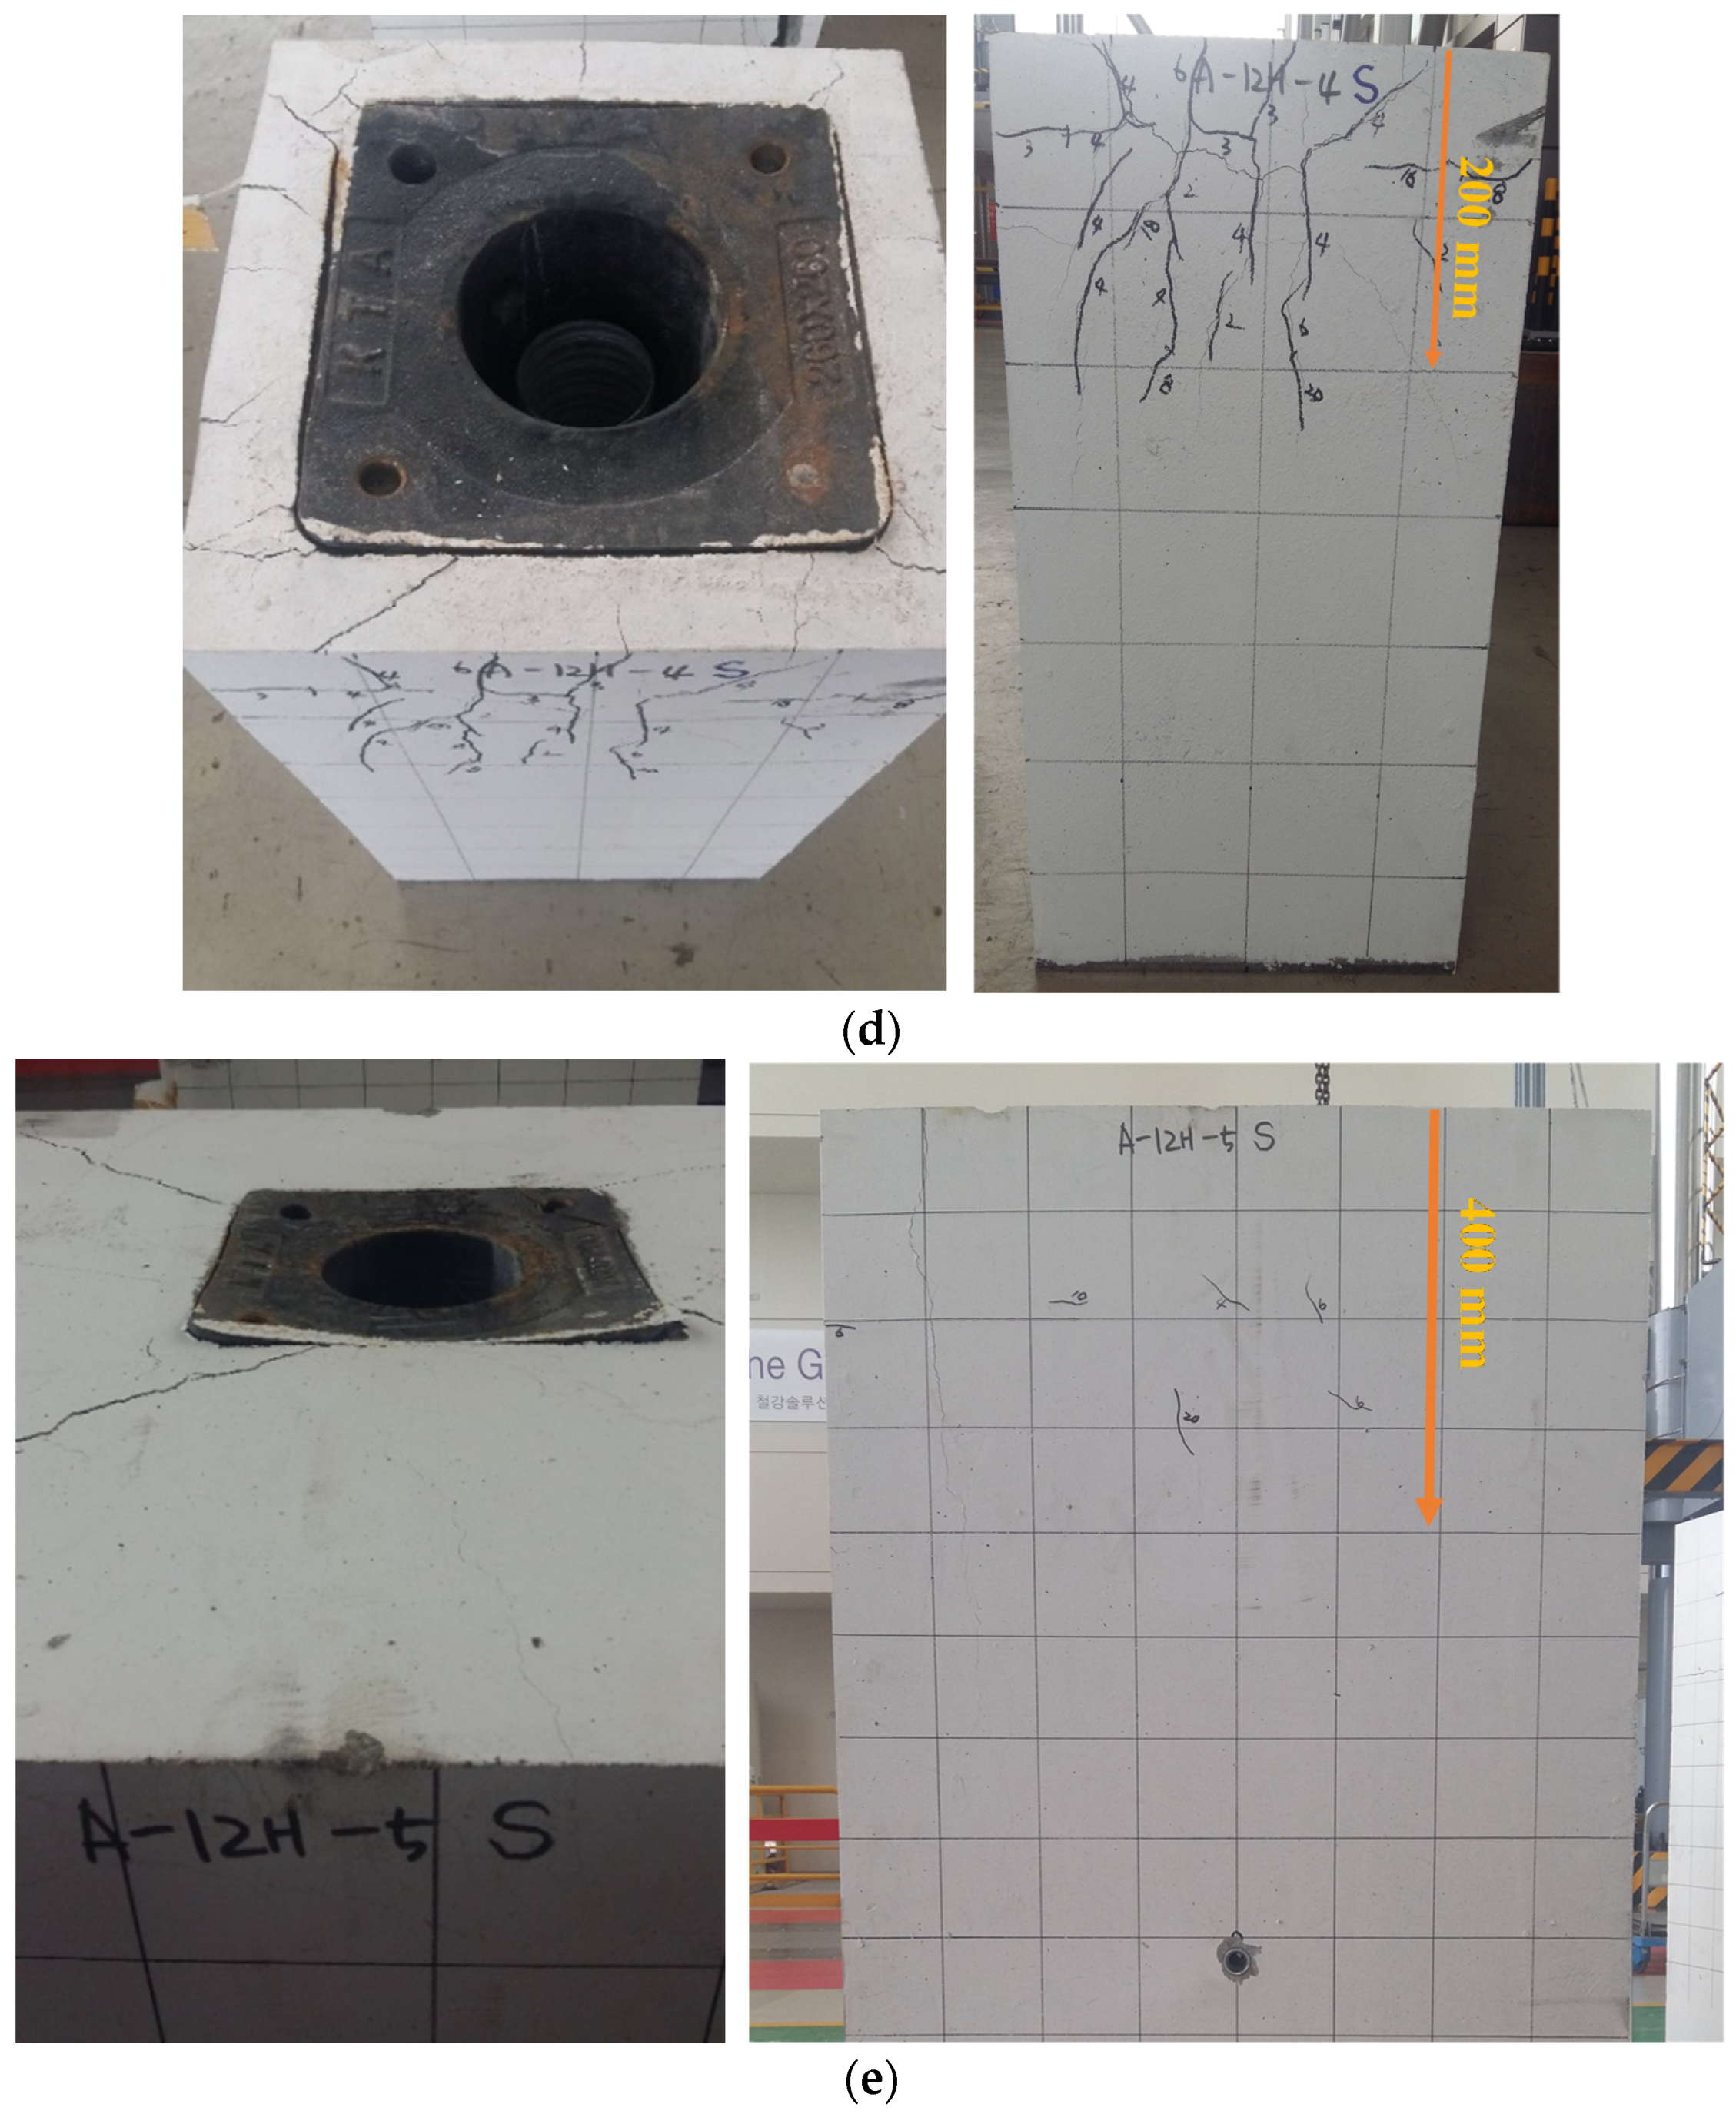
4.1.1. Fracture Mode

Figure 5 shows the test results for all specimens. In Figure 6, which shows the fracture modes of group 1 specimens, A12H-1 and -4, with side lengths of 350 mm, show more cracks on the side surfaces of the concrete blocks than the other specimens; however, the cracks were more concentrated near the anchorage bearing plate in A12H-4. This implies that local concrete fracture right beneath the bearing plate was involved in A12H-4 due to a lack of lateral confinement. On the other hand, overall concrete failure was observed in A12H-1 along the height. This confirmed that the entire concrete section in the specimen was used effectively because the maximum test load (4093 kN) exceeded the net compressive strength of the concrete block (3834 kN) computed by multiplying the concrete compressive strength ( f c i ) by the concrete net area excluding the duct area. That is, the sectional load-carrying efficiency, defined as P u / ( f c i ( A A d u c t ) ) , of A12H-1 was larger than 100%, as shown in Figure 5b.
A12H-2, with a side length of 550 mm, also showed concentrated horizontal cracks on the side surfaces of the concrete block, as well as wide cracks on the top surface of the block. That is, the specimen seemed to be governed by spalling more than bursting, and the behavior was concentrated near the top surface. Given the fracture mode, it seems that the concrete within the spiral rebar was crushed and, as a consequence, the anchorage bearing plate sunk slightly, and the cast iron bearing plate was inelastically deformed. However, the behavior seemed to be localized within the spiral so that fewer cracks were observed than in A12H-1 and A12H-4.
A12H-3 and -5, with 800 mm sides, showed very narrow cracks on the side surfaces of the concrete block; however, a few wider cracks were observed on the top surface of the block after the test. In A12H-3, the anchorage bearing plate was fractured along the anchor head perimeter, but A12H-5 showed slight inelastic deformation in the cast iron bearing plate. Simple computations could be used to check whether the fracture in A12H-3 was due to the bearing strength of cast iron. That is, the yield and tensile strength of the cast iron multiplied by the net contact area between the anchor head and bearing plate (3471 and 5423 kN, respectively) could be compared with the test results. As shown in Figure 6, the anchorage bearing plate of A12H-5 had yielded but not fractured because its maximum load (3947 kN) was only slightly higher than the yield strength. On the other hand, even though the maximum load of A12H-3 (5228 kN) is slightly lower than the tensile strength of the cast iron (5423 kN), the bearing plate was fractured. This is because the inelastic deformation of the concrete beneath the bearing plate increased the concentration of stress on the bearing plate under the anchor head.
In contrast to A12H-2, fracture of A12H-3 began with fracture of the anchorage bearing plate. This means that the concrete beneath the bearing plate was still available before the cast iron bearing plate broke, indicating that more confinement was applied to the concrete within the spiral of A12H-3 than A12H-2 by the concrete surrounding the spiral. Therefore, if stronger cast iron had been used, the ultimate strength could have been increased in A12H-3. It is reasonable to conclude that a larger concrete block with a size of more than A / A g   = 4.50 is more effective for enhancement of the ultimate bearing strength if the cast iron strength is secured.
Figure 6 also shows that the length of the area with cracks and crack pattern depends on the size of the specimen and particular details of the reinforcement. In A12H-4, the length of the area through which cracks had propagated was approximately 200 mm, and most cracks grew in the vertical direction. In A12H-2, the length of that area was approximately 300 mm, and most cracks grew in the horizontal direction. These crack patterns might help to explain the fracture modes: a relatively small specimen with less lateral reinforcement is more likely to be affected by the wedge action of the anchorage device. On the other hand, a specimen with A / A g ≥ 4.50 is affected by both concrete crushing and/or spalling.

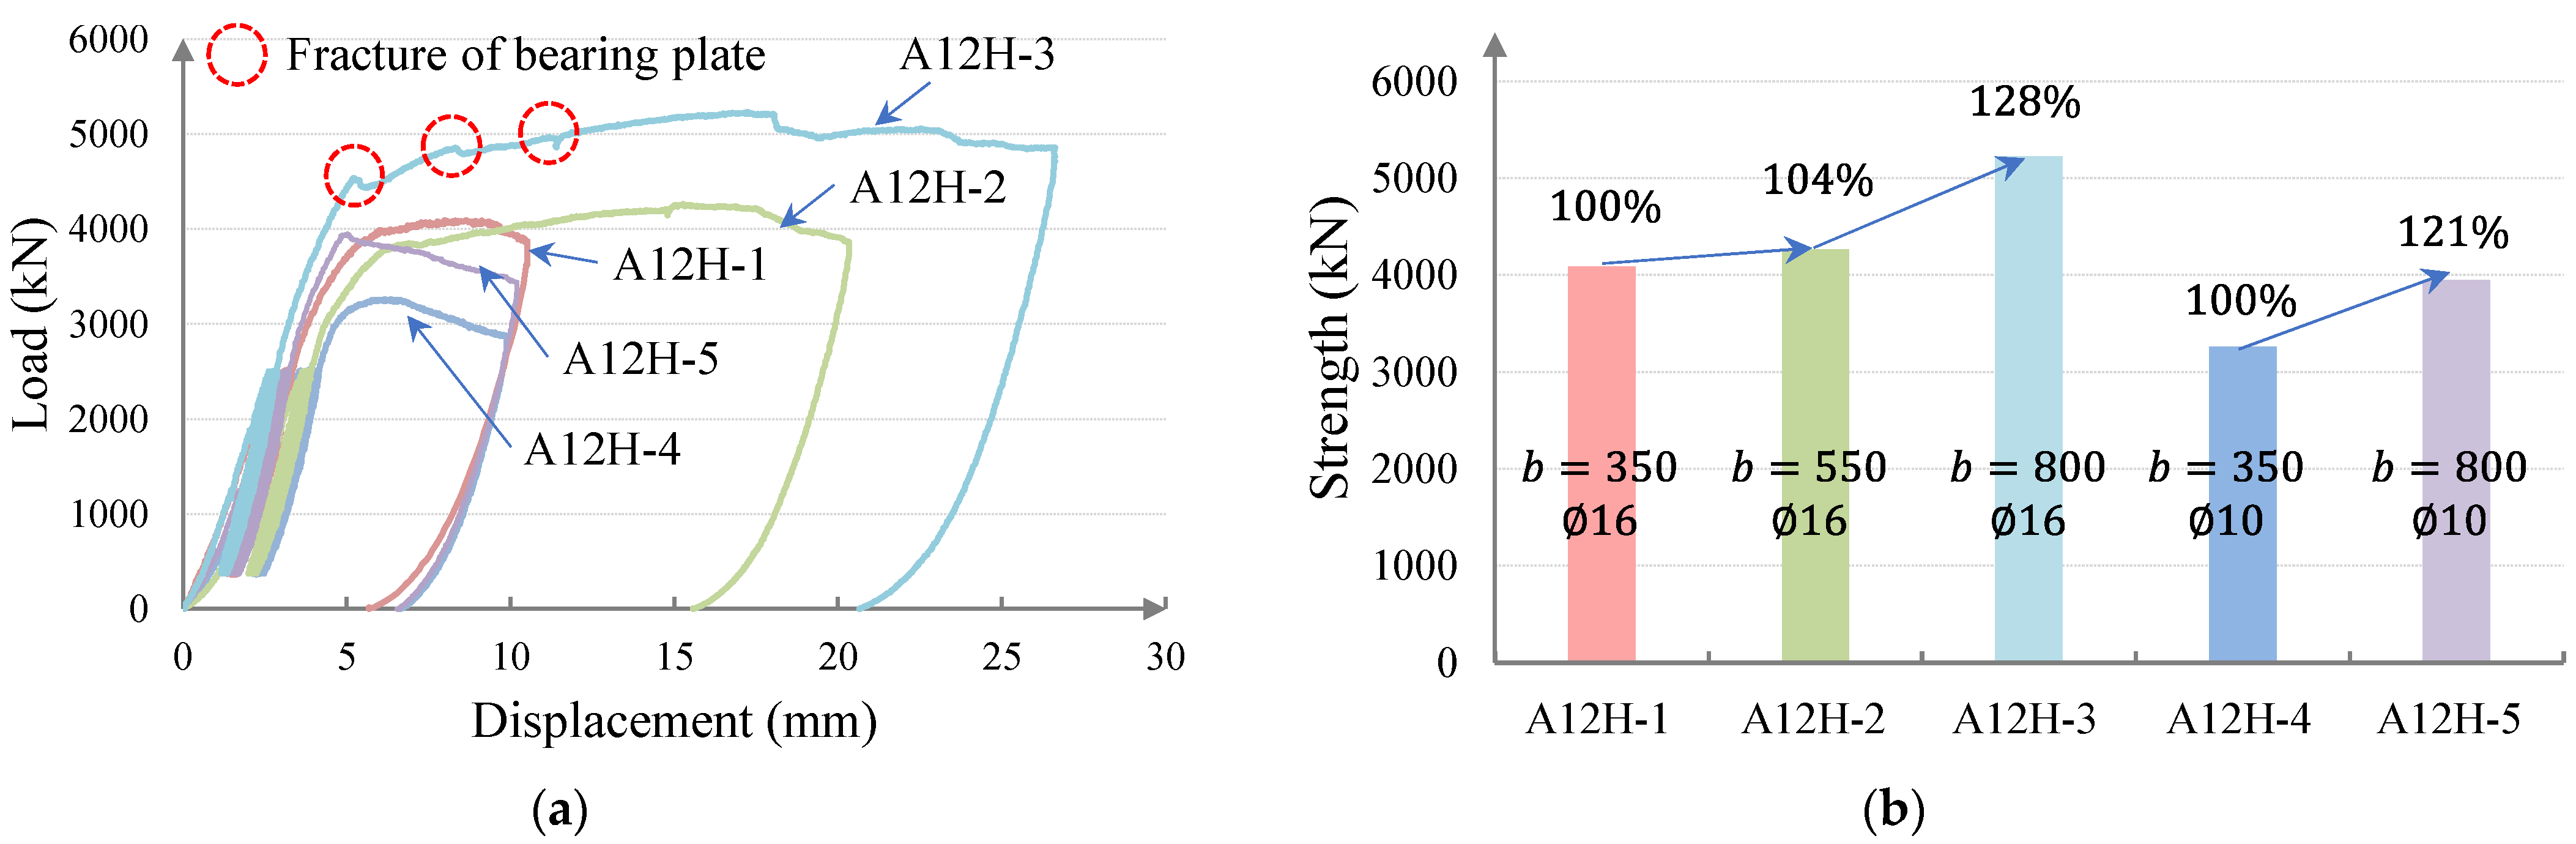
4.1.2. Ultimate Bearing Strength

Figure 7 shows the load-displacement curves and ultimate bearing strengths with respect to A / A g ratio. A12H-4 and -5 have the same dimensions as A12H-1 and 3, respectively, but they are reinforced with Φ10 mm spiral rebars, resulting in reduced lateral confining pressure. A12H-2 and -3 have identical spiral rebars and lateral confining pressure as A12H-1, but they have larger supporting concrete surface area or A / A g . The load-displacement curves of specimens with high lateral confinement, A12H-1 to -3, show hardening behavior after the proportional limit. Sudden drops after the proportional limit at around 4500 kN are observed in the curve of A12H-3, which is attributable to fracture of the anchorage bearing plate. However, the hardening of the curve is still evident, meaning that the concrete beneath the bearing plate remained unfractured with the aid of sufficient lateral confinement. It would be reasonable to conclude that a specimen with A / A g = 9.52 could have greater strength than the test result if a stronger cast iron is used.
A12H-4 and -5 have identical spiral rebar designs, but the larger specimen, A12H-5, showed 21% greater strength, and the curves of A12H-4 and -5 in Figure 7a showed similar softening of their slopes after the proportional limit. This reveals that the concrete surrounding the spiral played a role in the increase in the peak load, but the post-peak behaviors of both specimens were governed by the same factors. These factors may include crushing of the concrete under weak confinement because splitting failure and vertical crack formation were not observed in A12H-5, as shown in Figure 6e. In addition, the few narrow cracks on the side surface of A12H-5 may have been caused by the spiral-controlled transfer of splitting stress to the outer concrete.
The sudden change but almost linear slope after the proportional limit of A12H-5, as seen in Figure 7a, may be attributable to the yielding of the spiral rebar because the yield of the rebar shows similar behavior. Additionally, the local concrete beneath the bearing plate may have reached peak stress right after the rebar yielded because the softening curve was almost linear. Considering the fracture mode and crack patterns of the two specimens leads to the following conclusions: (1) The peak load of A12H-4 was determined mostly by wedge action, and the post-peak softening curve was due to lateral reinforcement; and (2) The peak load of A12H-5 was determined mostly by yielding of the spiral rebar, and the post-peak softening curve was due to lateral reinforcement.
Under identical spiral-induced lateral confinement, an increase in the concrete block area from A / A g = 1.82 to A / A g = 9.52 increased the ultimate strength, as shown in Figure 7b. However, the ultimate strength increased by only 4% between A12H-1 and A12H-2 even though the A / A g of A12H-2 is 2.47 times that of A12H-1. This may be because the effective lateral confinement pressures were the same in the two specimens, as shown in Table 2, and the side surface cracking of A12H-2, as shown in Figure 6b, lessens the additional confinement by the surrounding concrete. A12H-3, unlike A12H-1 and 2, exhibited only negligible cracking, so the surrounding concrete should contribute to confinement of the local zone; indeed, the strength of this specimen increased by 28%.
The effect of the surrounding concrete was confirmed again by the comparison between A12H-4 and -5. However, the increase in strength between A12H-4 and -5 was less than that between A12H-1 and -3. This is reasonable because more cracks were seen in A12H-5 even though those cracks were very narrow, and the micro-cracks weakened the confinement by the surrounding concrete. Thus, in contrast to the FEM-based results by Cervenka and Ganz [8], the use of a concrete bearing area larger than the specified minimum spacing should be considered in the prediction of ultimate bearing strength. In addition, the effect of the additional bearing area is also influenced by lateral confinement conditions.
A full section efficiency of over 100% was only seen in A12H-1, where A / A g = 1.82 , and the lateral pressure reached the maximum effective value of 8.3 MPa for f l a t , s p and 13 MPa for f l a t , e q . In the specimens with identical spiral diameters (295 mm) but different rebar diameters and concrete block sizes, as A / A g increased the sectional efficiency decreased, as shown in Figure 5b. The efficiencies for A12H-1 through -5 were 107%, 44%, 25.3%, 85.1%, and 19.1%, respectively. These results imply that the behavior of the anchorage zone is highly affected by the local behavior near the anchorage bearing plate, and the sectional efficiency is mostly determined by A / A g .
In sum, the following conclusions can be drawn for A12H-1–5, which are confined with a small-diameter spiral for minimum anchorage spacing: (1) Strength varies by about 30% depending on A / A g ; (2) The effect of additional bearing area on the ultimate bearing strength is influenced by lateral confinement; (3) The sectional efficiency varies from about 20% to 110%, mostly depending on A / A g .
The net maximum bearing stress ( P u / A b ) on the concrete in direct contact with the bearing plate is presented in Figure 5c, where A b was determined from the intact bearing plate in Figure 2a. The maximum stress of A12H-1 was computed as 65.8 MPa; it increased to 84.1 MPa in A12H-3. This reconfirms that the surrounding concrete increased the confinement and resulted in an increase in the net maximum bearing stress under the ultimate state. The 84.1 MPa seen in A12H-3 is high enough to be achieved by confinement. Therefore, even if the bearing plate had not been fractured in A12H-3, the net maximum bearing stress may not have exceeded approximately 100 MPa. To be conservative, the current test results were used for further analysis.

4.1.3. Calibration of the Design Equation

According to Equations (2), (3), and (7), the bearing strength is proportional to A / A g , and it should increase by 124% between A / A g = 1.82 and 9.52. However, the measured increase in the test was 28% between A12H-1 and A12H-3 and 21% between A12H-4 and A12H-5. That is, the effective increase in A / A g between A / A g = 1.82 and 9.52 was 28% or 21% in Equations (2), (3), and (7).
To calibrate the effect of A / A g , a coefficient, α , as a function of A / A g , was proposed in this paper, as shown in Equation (18). Because Equation (7) was verified for the minimum anchorage spacing [14,15], α is 1.0 at the minimum anchorage spacing. Then, a revised equation for the contribution of concrete to the bearing strength can be presented, as shown in Equation (19). The exponent in Equation (18) was determined to make α in Equation (19) identical to the average increase ( 1.245 = 1.28 + 1.21 2   ) from A / A g for the minimum anchorage spacing.
α = ( A / A g ( A A g ) ) 0.26  
P c = 0.8 α f c i A b ( A A g )
where ( A A g ) is A A g for the minimum anchorage spacing.

4.2. Confinement Effect by Spiral Rebar Design (A12H-1 and 3–7)

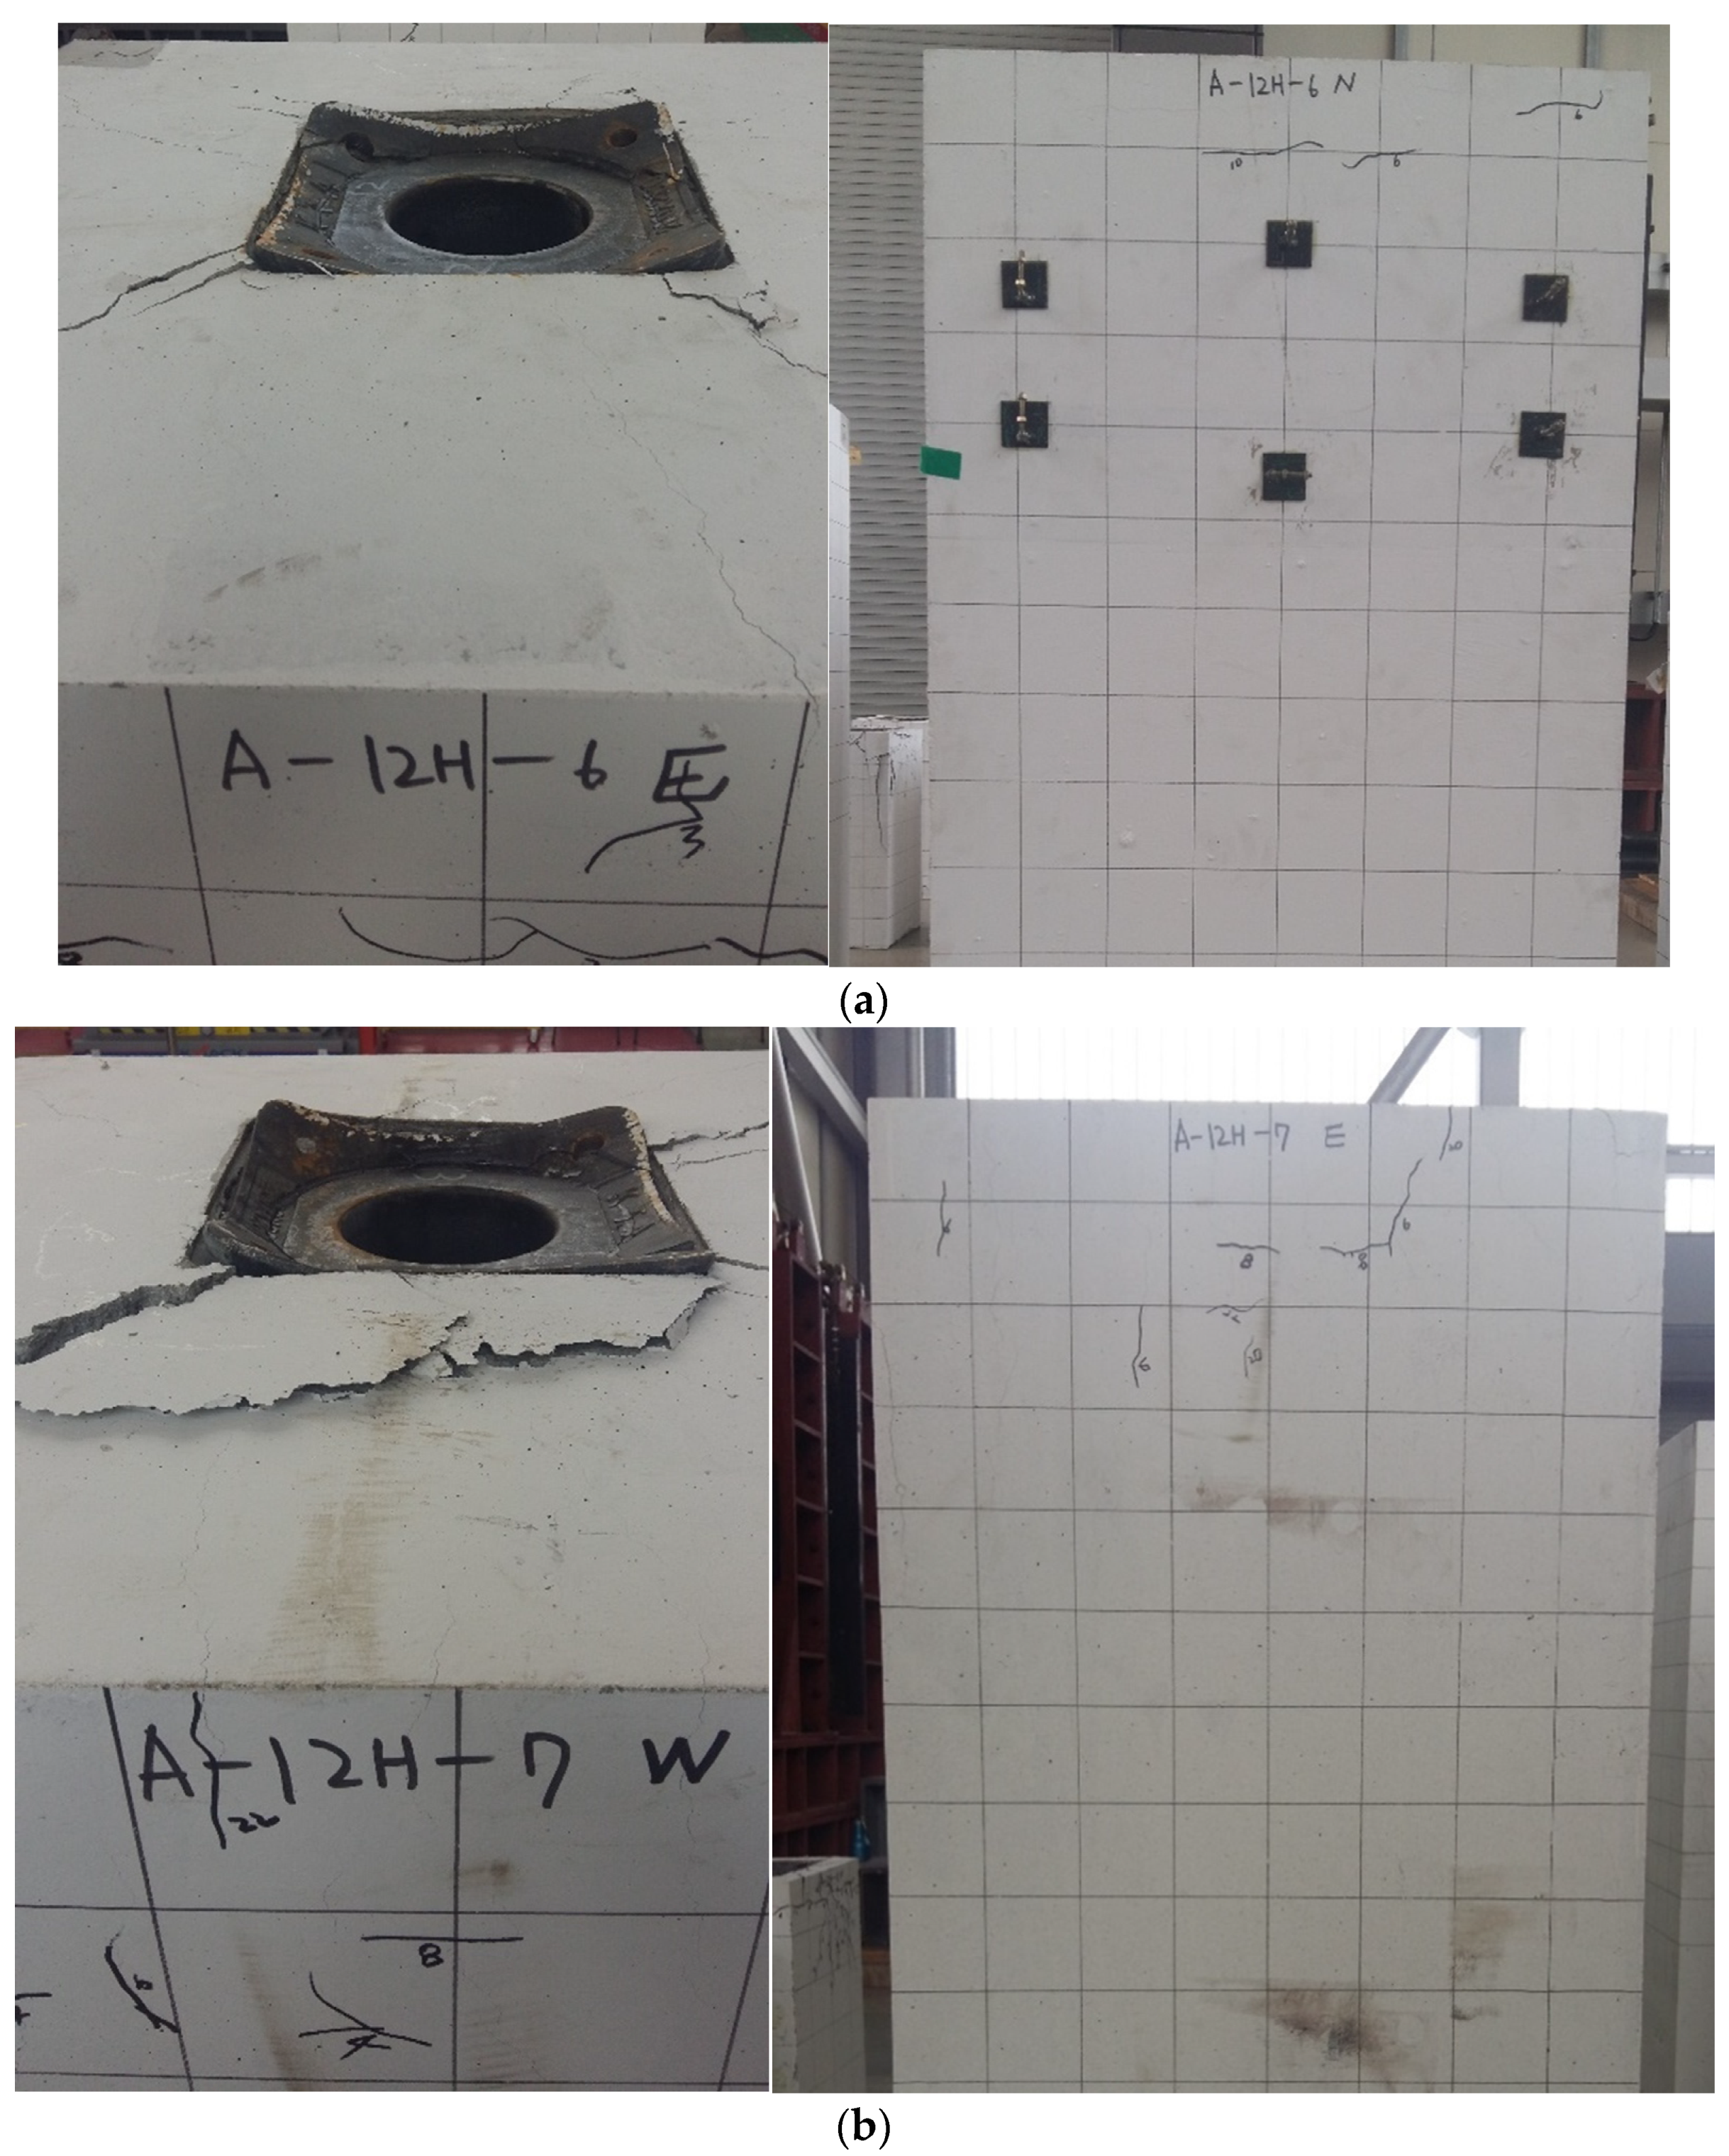
4.2.1. Fracture Mode

In this section, the effect of spiral diameter or confined area on the anchorage zone behavior is investigated through a comparison with the group 1 specimens. The dimensions of the concrete blocks in A12H-1 and -4 were 350 × 350 mm, while that in A12H-3, 5–7 were 800 × 800 mm. For A12H-1 and -4, the effect of confining pressure was investigated. For A12H-3 and -5–7, the effect of spiral diameter was additionally investigated.
As shown in Figure 8, both A12H-6 and -7 show breakage of the anchorage devices at the ultimate state regardless of the reinforcement details, and the fracture modes were very similar to those of A12H-3 and -5. However, in the comparison of A12H-5 and -7, which only differed in spiral diameter, the peak loads and plastic behavior after the proportional limit of the load-displacement curves were different, as shown in Figure 9a. A12H-5 ( b 800 D 295 10 ) exhibited a smaller peak value and softening behavior after the peak point, so the test was terminated, but A12H-7 ( b 800 D 745 10 ) exhibited a long flat curve after the proportional limit, and it was tested up to about 20 mm displacement. The bearing plate of A12H-7 broke at a displacement of around 15 mm, and the fracture load was smaller, and the displacement at fracture was much smaller than those of A12H-3 and -6. This implies that deformation of the specimen was concentrated at the local zone below the bearing plate; then, local damage to the concrete leads to uneven support by the concrete, resulting in an excessive concentration of stress on the bearing plate followed by fracture of the plate.
A sudden change but almost linear slope was observed after the proportional limit of A12H-7, as shown in Figure 9a, as also seen in the curve of A12H-5, and the proportional limits of the two were almost the same. This reveals that the sudden change in A12H-7 may have originated from yielding of the spiral rebar, as for A12H-5, and implies that the local concrete beneath the bearing plate reached peak stress right after yielding of the rebar because the curve after the proportional limit was almost linear. Considering that the only difference between A12H-5 and -7 was the diameter of the spiral, these findings suggest that the concrete within the spiral of A12H-7 played a greater role in the load-transfer behavior of the local anchorage zone than the concrete outside the spiral of A12H-5.
In sum, the behaviors of the two specimens were governed by yielding of the rebar followed by localized concrete damage beneath the bearing plate, and the behavior may be due to the small amount of lateral reinforcement that was used. For A12H-5, the damage in the ultimate state seemed to be concentrated in the inner part of the spiral, and local stress was not properly transferred to the surrounding concrete because the confined area by the spiral was as small as 295 mm in diameter and the load-displacement curve exhibited softening behavior right after the proportional limit. For A12H-7, the long flat curve after the proportional limit implies that the local stress beneath the bearing plate was properly transferred to the surrounding concrete within the large spiral of D = 745 mm. However, the confining pressure was not sufficient to enhance the strength and hardening behavior after the proportional limit.
For A12H-6, a proportional limit and fluctuations in the curves similar to those of A12H-3 were seen at around 4500 kN when a fracture or severe damage to the bearing plate occurred. However, in contrast to A12H-3, A12H-6 exhibited a steep hardening curve after the proportional limit, even after fracture of the bearing plate. This may have been because, as in A12H-7, the larger spiral diameter led to proper stress distribution in the inner part of the spiral and introduced confinement over the large area of the inner concrete. Therefore, it can be concluded that for the anchorage zone specimens with A / A g = 9.52, the proportional limit of the load-displacement curve is determined by yielding of the spiral rebar or fracture of the bearing plate, but the latter part of the curve is determined by lateral confinement.

4.2.2. Ultimate Bearing Strength

Figure 9 shows the load-displacement curves and ultimate bearing strengths according to spiral rebar design. For A12H-1 and -4, the effect of confining pressure by rebar size was investigated. For A12H-3 and -5–7, the effect of spiral diameter was additionally investigated.
The net maximum bearing stress ( P u / A b ) on the part of the concrete in direct contact with the bearing plate is presented in Figure 5c. The maximum stress of A12H-3 was computed as 84.1 MPa; it increased to 96.8 MPa in A12H-6. This implies that confinement of the larger concrete area made the concrete more effective and resulted in an increase in the net maximum bearing stress under the ultimate state. The maximum stress of 96.8 MPa in A12H-6 was high enough to be achieved by confinement. Therefore, even if the bearing plate had not been fractured in A12H-6, the net maximum bearing stress may not have exceeded approximately 100 MPa.
In the comparison between A12H-4 and -1, the ultimate strength increased by 25% when the 10 rebars were substituted with 16 rebars. Substitution by 16 rebars increased the spiral-induced lateral pressure ( f l a t , s p ) and the total equivalent lateral pressure by both the spiral and stirrup ( f l a t , e q ) by 89% and 19%, respectively, as shown in Table 3. Considering that the contribution of lateral confinement to bearing strength is generally less than 50% of the ultimate bearing strength, the additional contribution due to the use of 16 rebar should be less than 39.5% or 9.5% of the ultimate bearing strength. Therefore, the observed 25% increase in strength indicates that the effect of lateral confinement should be determined considering not only the spiral but also the stirrup for the specimens with minimum anchorage spacing.
Between A12H-5 and -3, the increase in strength was 32%, but between A12H-7 and -6, the strength increased by about 46%. Even though the lateral pressure was much greater in A12H-5 and -3 than A12H-7 and -6, as shown in Table 3, the larger confined area in A12H-7 and -6 produced more bearing capacity and more of an increase in strength between A12H-7 and -6. The increase in strength between A12H-5 ( D = 295 ,   10 ) and -7 ( D = 745 ,   10 ) was 5%, but that between A12H-3 ( D = 295 ,   16 ) and -6 ( D = 745 ,   16 ) was approximately 16% ( = 153 % / 132 % ). Thus, the effect of lateral confinement is determined by the combined effect of both lateral pressure and confined area (or spiral diameter).
For the sectional efficiency, it seemed that the maximum efficiency for A / A g = 9.52 was limited to around 30% regardless of the lateral rebar design, as shown in Figure 5b. The limitation may be because fracture of the bearing plate occurred before fracturing of the concrete and, for the concrete supporting the unfractured part of the bearing plate, the stress dispersion ratio is limited and fracture of all of the specimens with relatively large A / A g were governed by the local failure of the concrete beneath the anchorage bearing plate. Considering the sectional efficiency of A / A g = 4.5 and the net maximum bearing pressure of A12H-6 close to 100 MPa, the maximum efficiency of the anchorage zone with A / A g = 9.52 might be expected to not exceed 35%.
Considering the results of all specimens with A / A g = 1.82 , the efficiency of such specimens ranges from 80% to 110%, depending on the lateral reinforcement design. Therefore, the maximum value of A / A g that produces 100% sectional efficiency is about 2.0 for the anchorage bearing plate used in the test.
In sum, the following conclusions can be drawn: (1) The strength of the specimens can increase by over 50% depending on the lateral rebar design; (2) The rate of increase in strength is lower for specimens with relatively small A / A g ; (3) There is a limitation on the increase in sectional efficiency regardless of lateral reinforcement; (4) The effect of lateral confinement is determined by the combined effect of both lateral pressure and confined area; and (5) The maximum A / A g that can produce 100% sectional efficiency is about 2.0 for the anchorage bearing plate used in the test.

4.2.3. Calibration of the Design Equation

According to Equations (8) and (17), the enhancement in strength by lateral confinement can be estimated as a function of f l a t and A c o r e . The equation estimates the increase in strength due to the change in spiral diameter as 1974 kN between A12H-5 and A12H-7, and 5496 kN between A12H-3 and A12H-6, as shown in Table 4. However, the increases observed in the test results were 184 and 793 kN. That means that the effective A c o r e fraction was only 14.4% for A12H-5/-7 and 9.3% for A12H-3/-6.
To calibrate the effective concrete core area ( A c o r e ), a coefficient, κ , as a function of spiral/stirrup dimensions, was introduced in Equation (20). Because Equations (8) and (17) were verified for the minimum anchorage spacing [15,16], κ is 1.0 for the minimum anchorage spacing. Next, a revised equation for the spiral-dependent contribution of lateral confinement to the bearing strength was presented as Equation (21). The exponent of Equation (20) was determined to create κ in Equation (21), which is identical to the average increase ( 1.12 = 1.144 + 1.093 2   ) from A c o r e for the minimum anchorage spacing.
κ s p = ( D D ) 0.12
P s = 4.1 κ s p f l a t , s p A c o r e , s p
where D ,   f l a t , s p ,   A c o r e , s p are D ,   f l a t , s p ,   A c o r e , s p for the minimum anchorage spacing.

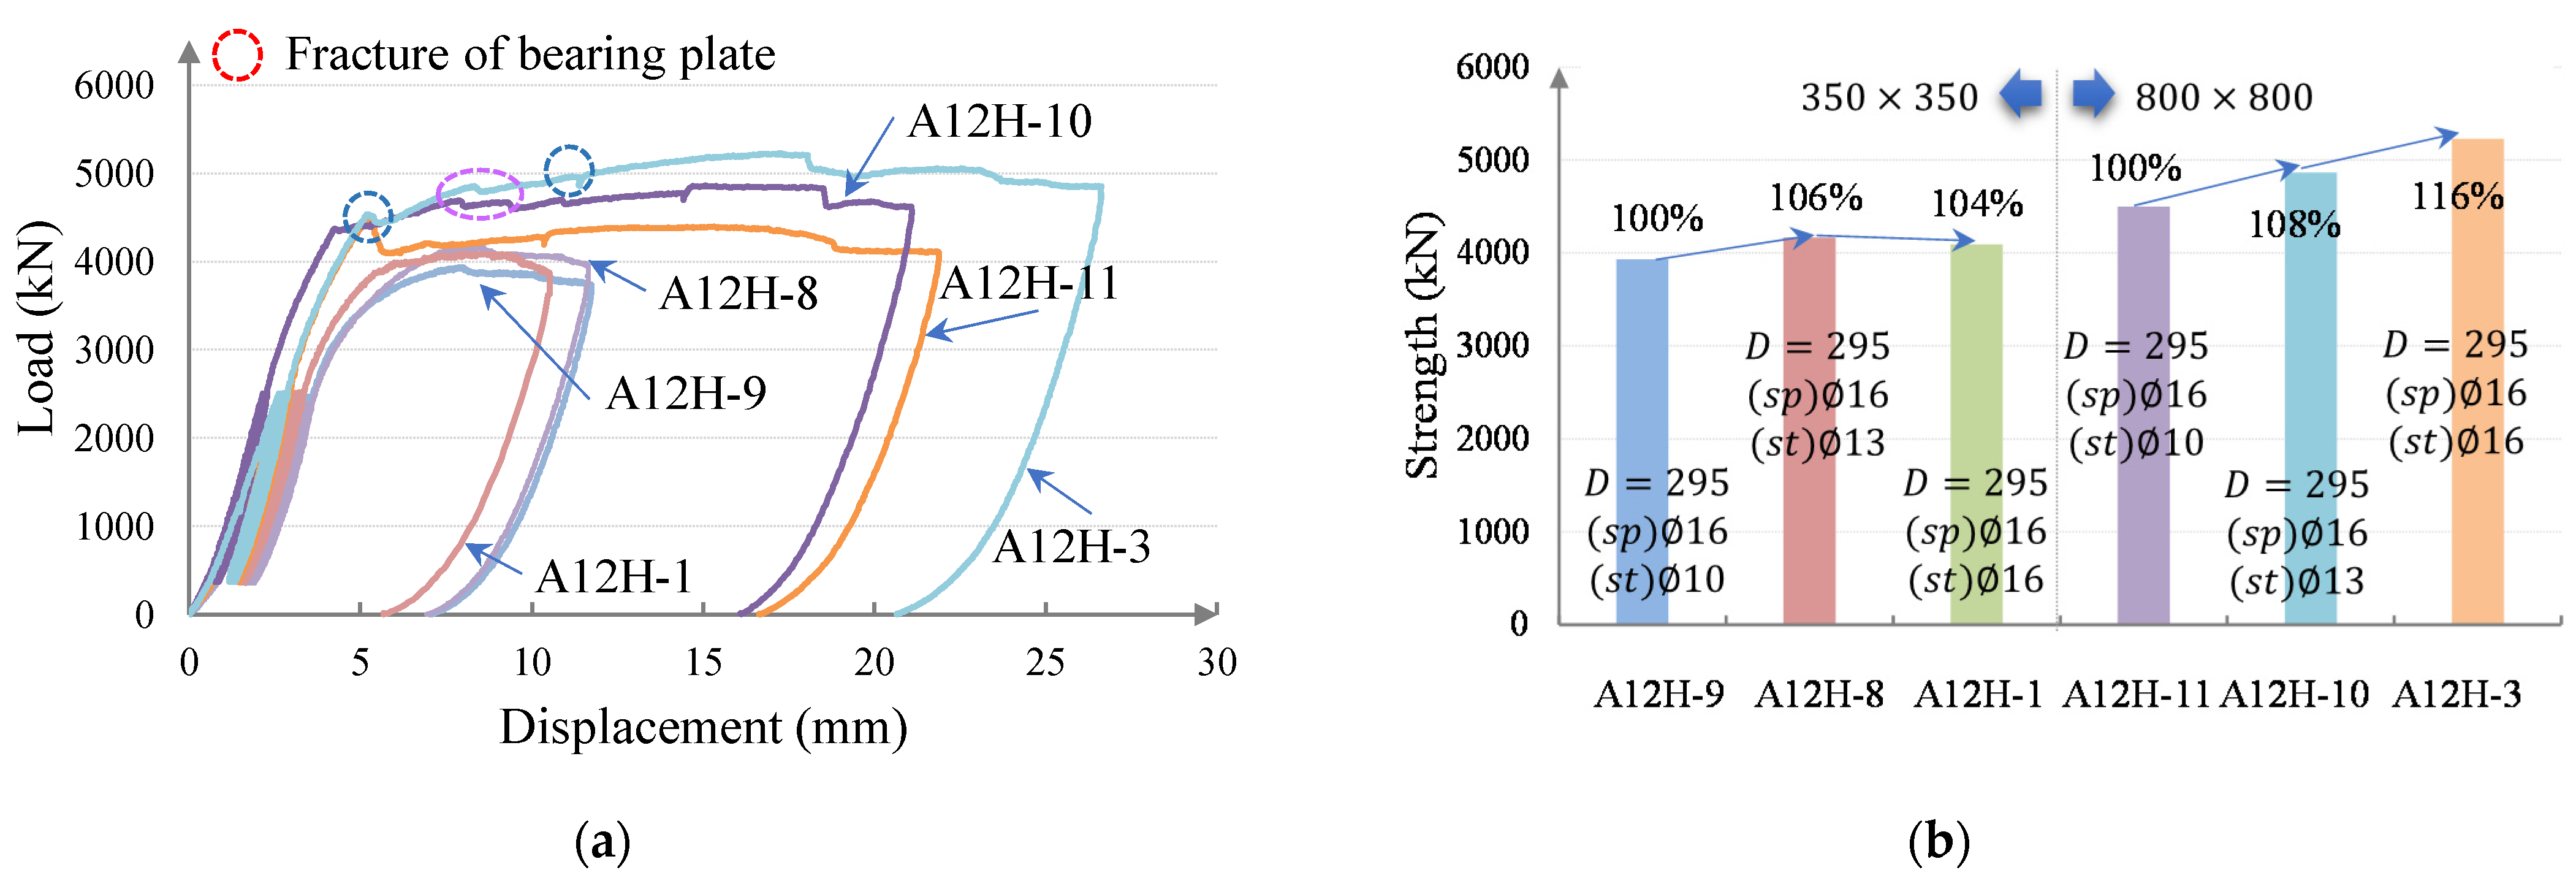
4.3. Additional Confinement Effect of Stirrup Rebars (A12H-1 and -3, A12H-8 − -11)

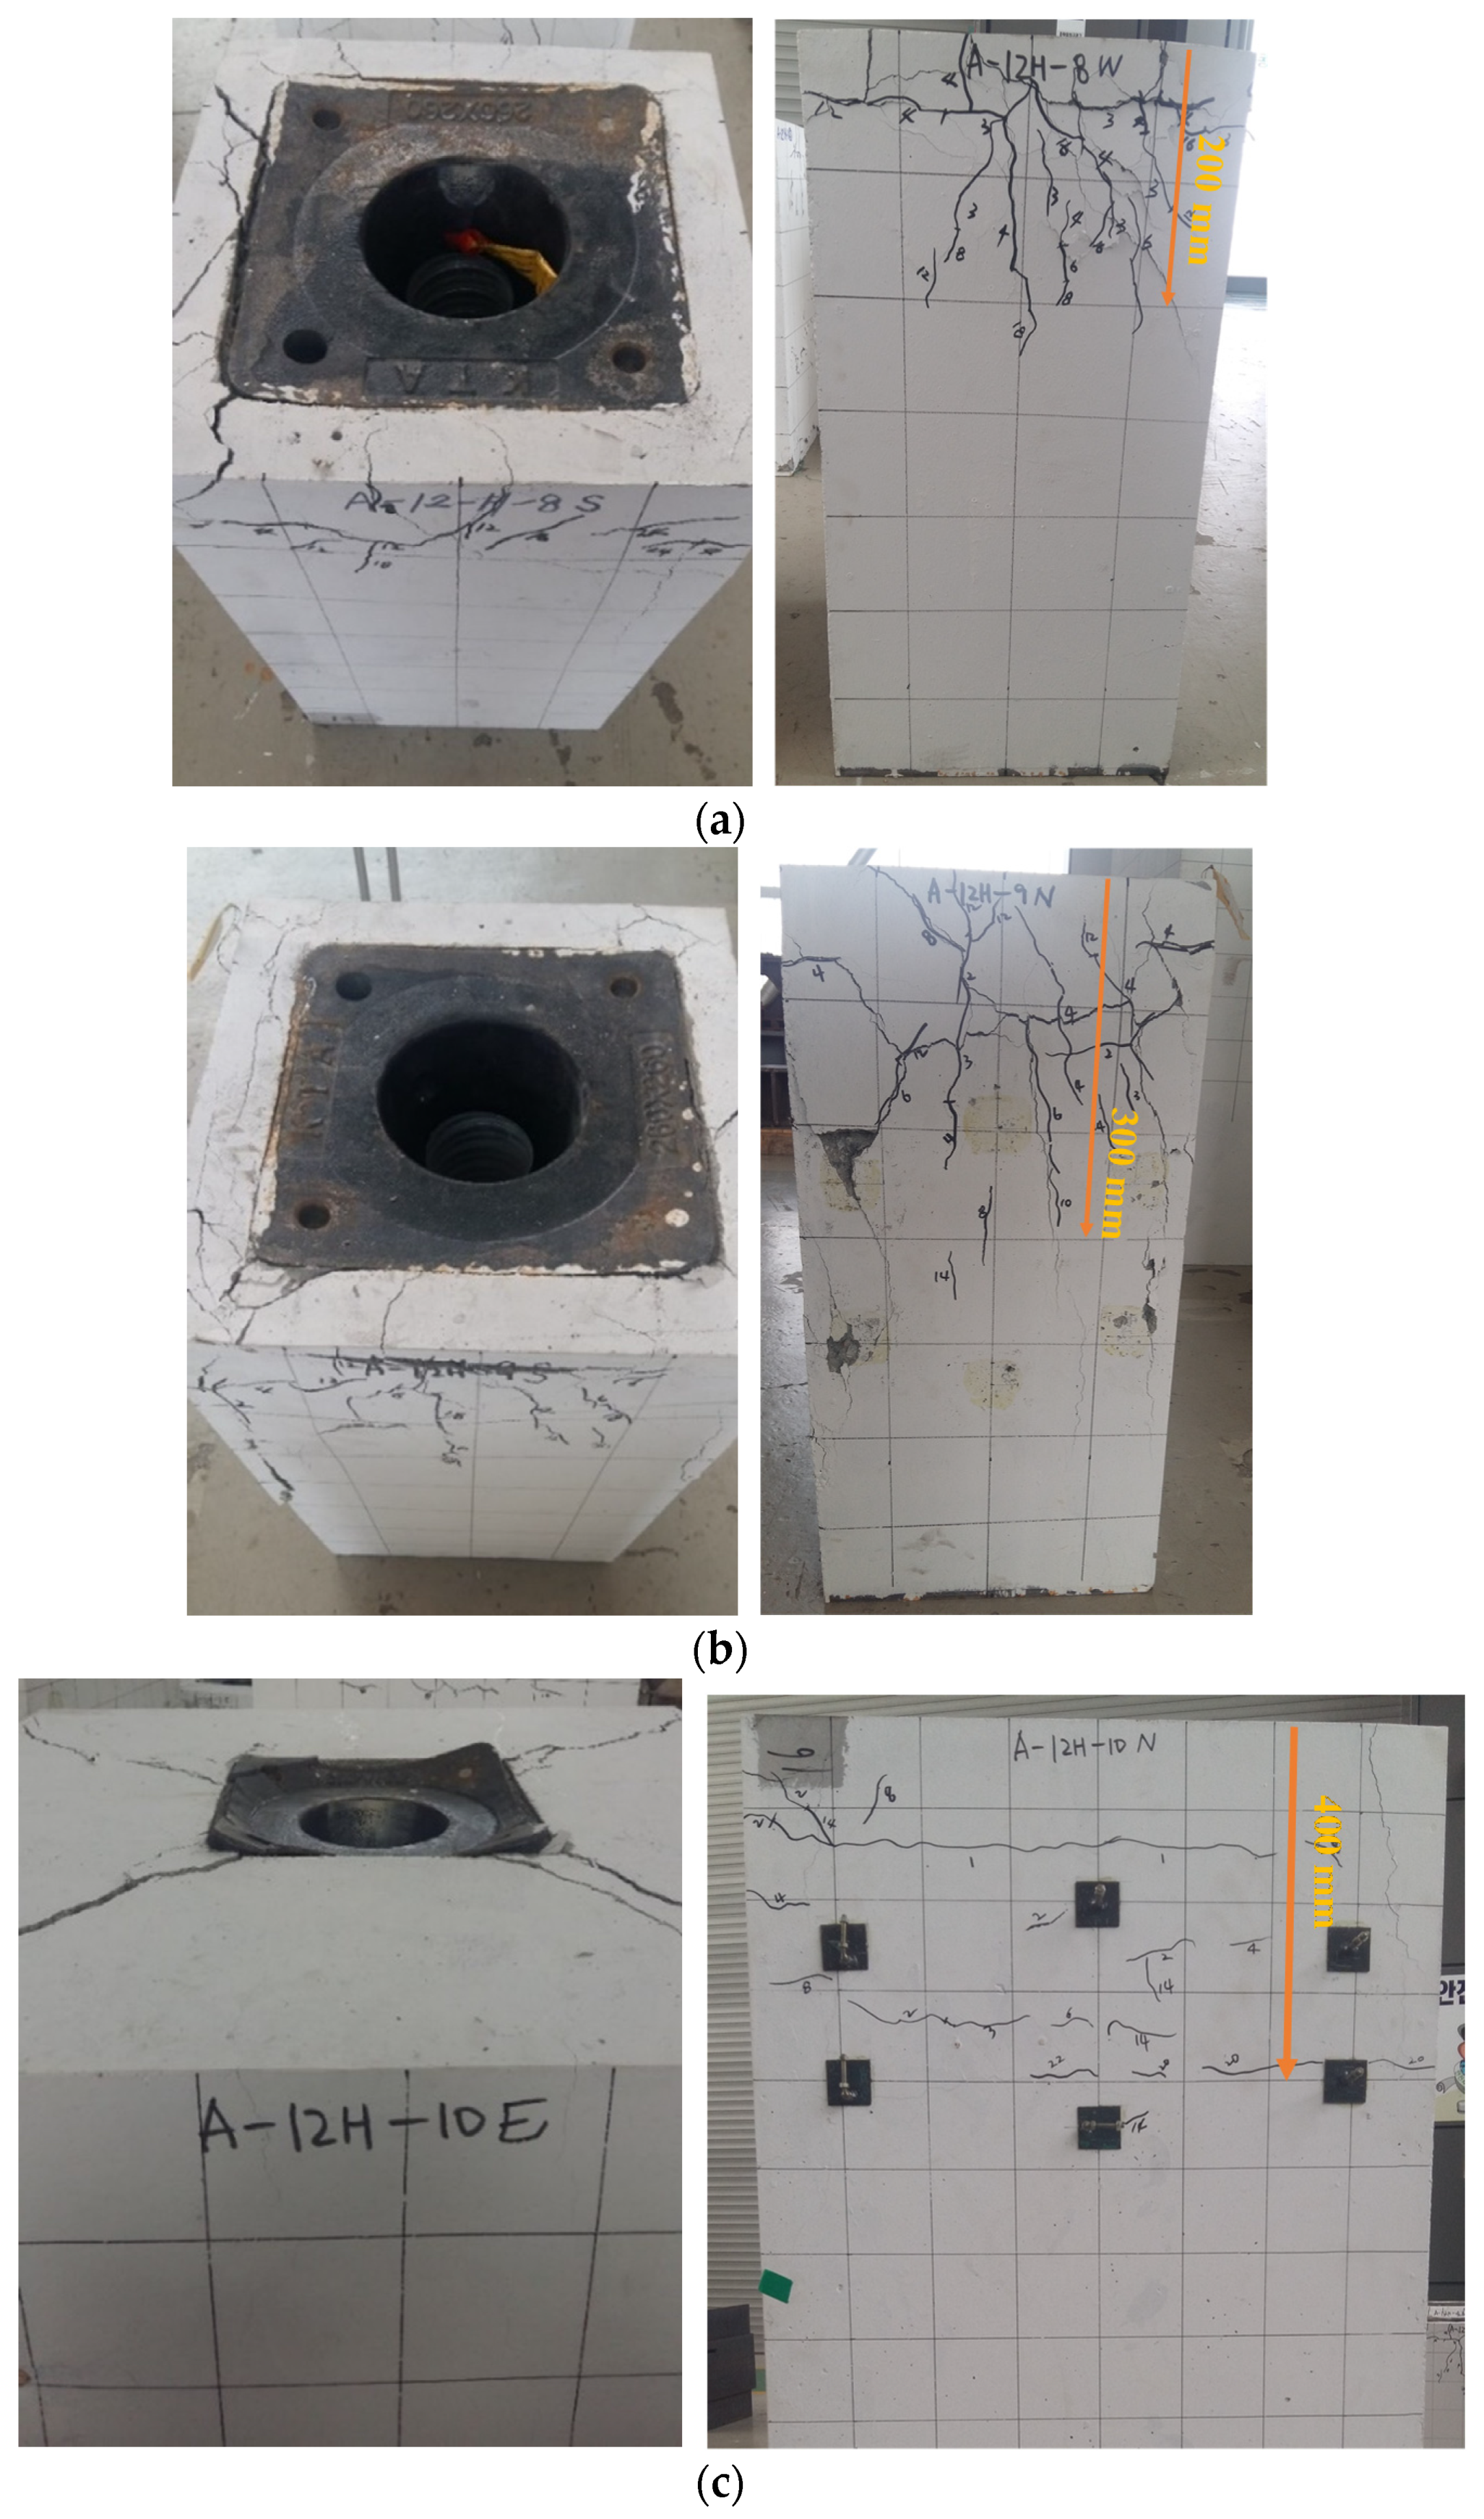
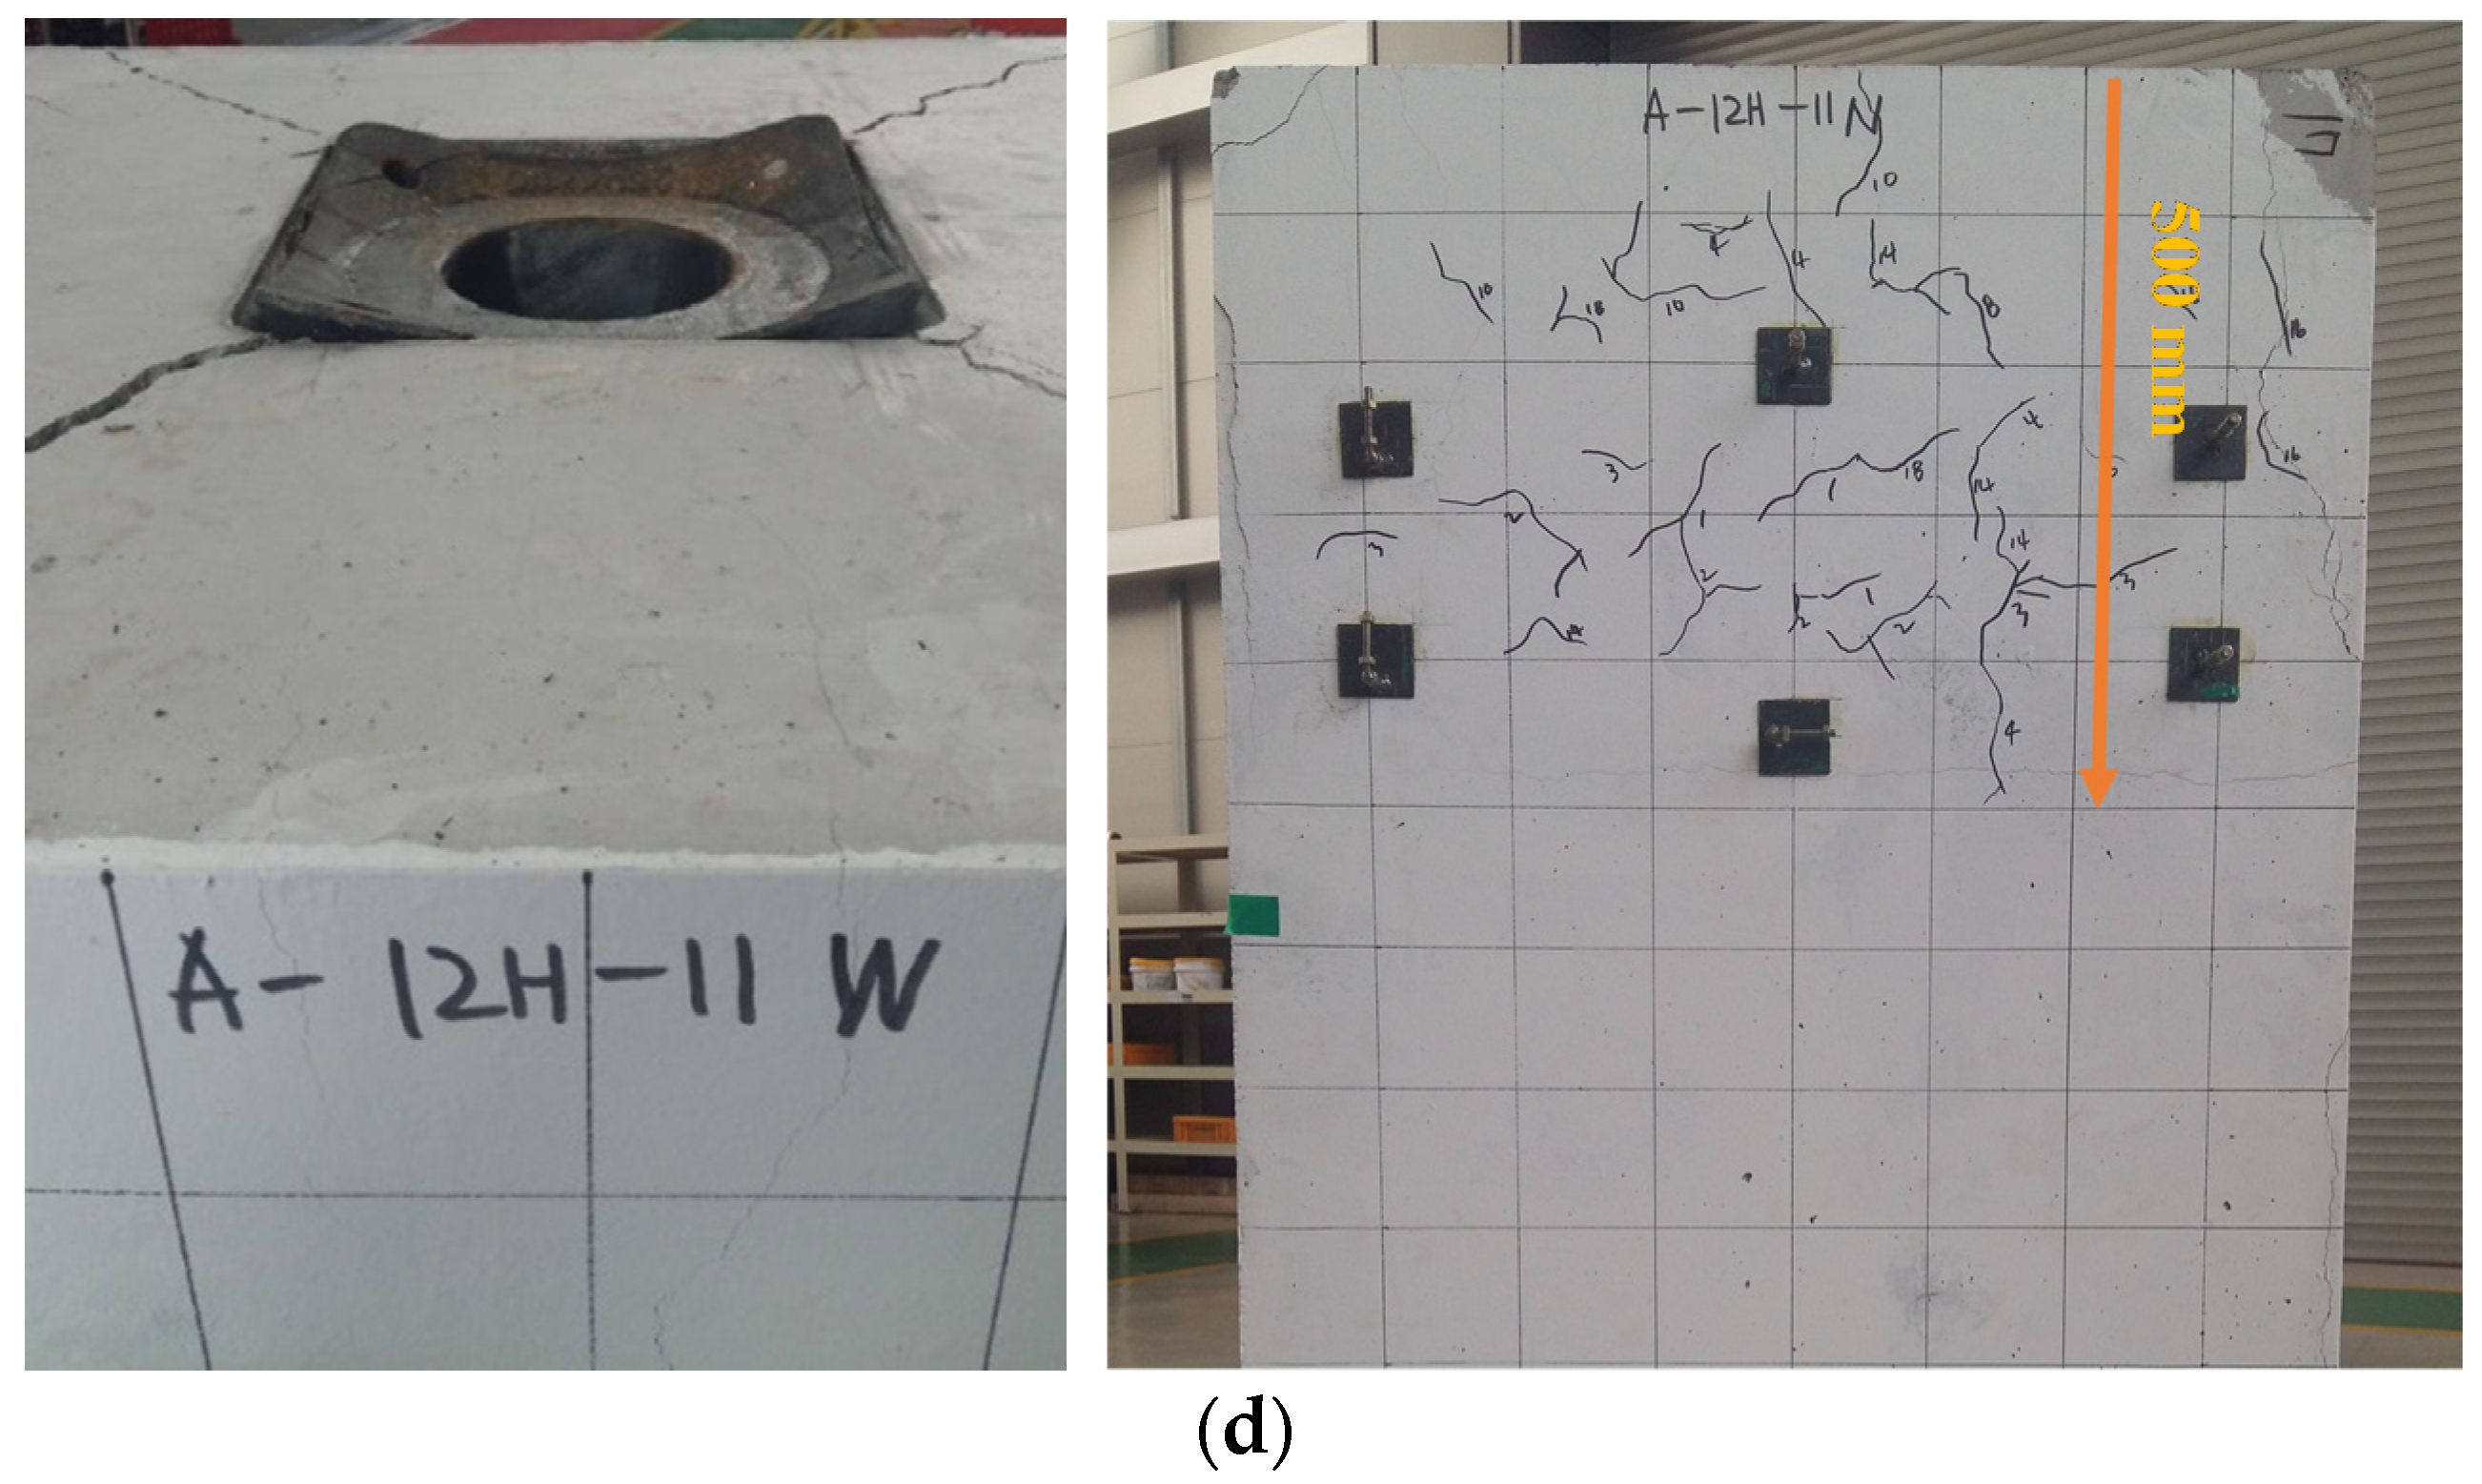
4.3.1. Fracture Mode

The dimensions of the concrete blocks in A12H-1, -8, -9 and A12H-3, -10, -11 were 350 × 350   mm and 800 × 800   mm , respectively. A12H-1, -8, -9 and A12H-3, -10, -11 all had identical spirals with D = 295 mm and 16 , but different stirrup rebars. A12H-9 and -11 had 10 stirrups, A12H-8 and -10 had 13 stirrups, and A12H-1 and -3 had 16 stirrups. The A12H-1, -8, -9 specimens had A / A g = 1.82 and were fully confined by the spiral and stirrup, as shown in Table 5. That may be why they exhibited similar load-displacement curves, as shown in Figure 10. The crack patterns shown in Figure 6 and Figure 11 might imply that their behavior was different. Obviously, more cracks and a greater cracked area were observed on the side surface of the concrete block in the specimen with the smallest stirrup rebar. This confirms that for the specimen fully confined with the spiral with A / A g = 1.82 , the load-displacement curve and ultimate behavior were rarely affected by the stirrup, but crack occurrence and pattern were highly related to the stirrup rebar reinforcement.
The A12H-3, -10, -11 specimens had A / A g = 9.52 and were fully confined with the spiral and stirrup, as shown in Table 5. However, differences in the crack patterns were observed between specimens. As mentioned previously, a negligible amount of cracking was observed in A12H-3 with 16 stirrups, but a few horizontal cracks were observed in A12H-10 with 13 . In A12H-11 with 10 stirrups, a few more cracks were observed in a wider area, as shown in Figure 10. This result implies that for the specimen with A / A g = 9.52 , crack occurrence and pattern are also highly related to the stirrup rebar reinforcement.
In contrast to the A12H-1, -8, -9 specimens, the load-displacement curves of A12H-3, -10, -11 differed depending on the stirrup rebar size. Especially in A12H-11 with 10 stirrups, a sudden drop in load after the proportional limit was observed, as shown in Figure 11a. However, all curves showed load fluctuations at around 4500 kN, which were also seen in other specimens with A / A g = 9.52 . This confirms that all specimens with A / A g = 9.52 except for A12H-7, which is reinforced with a negligibly small amount of lateral rebar, first experienced fracture of the anchorage bearing plate, and their later behavior was determined by the lateral confinement. The difference between A12H-7 and -11 lies in the spiral diameter and spiral rebar size. The local confinement due to the spiral in A12H-11 was sufficient to exceed the maximum effective lateral confinement, but the load suddenly dropped as the bearing plate fractured and did not recover. This means that the lateral confinement of locally damaged concrete is not sufficient to carry all load acting on the bearing plate.
In sum, for the specimens that were fully confined with small-diameter spirals: (1) For relatively small A / A g , the stirrup rebar design mainly influenced crack occurrence and pattern; (2) For relatively large A / A g , not only the crack occurrence and pattern but also the curve after the proportional limit in the load-displacement curve was influenced by stirrup rebar design.

4.3.2. Ultimate Bearing Strength

Figure 10 compares the load-displacement curves and ultimate bearing strengths with respect to the stirrup rebar design. The A12H-1, -8, -9 specimens showed almost identical load-displacement curves, ultimate strengths, and sectional efficiency despite their differences in stirrup rebars, as shown in Figure 5 and Figure 10. This is because they were fully confined, with the spiral and stirrup exceeding the maximum effective lateral confinement.
In contrast to the A12H-1, -8, -9 specimens, the load-displacement curves and ultimate strengths of A12H-3, -10, -11 reveal that the additional stirrup rebar enhanced the ultimate performance. This means that the concrete between the spiral and stirrup played a role, and its effect increased as the stirrup rebar size increased. In these specimens, the ultimate strength increased by 8% between 10 and 13 and 16% between 10 and 16 . However, a comparison between A12H-6 (D = 745 mm, Pu = 6022 kN) and A12H-3 (D = 295 mm, Pu = 5,228 kN) reveals that confining of a larger concrete area with a large spiral and stirrup is more effective than confining two separate areas where the core is partially confined by the spiral and stirrup, and the outer part is confined only by the stirrup.

4.3.3. Calibration of the Design Equation

Calibration of the design equation for stirrup confinement that was similar to that of spiral confinement was proposed. Unfortunately, the specimens were fully reinforced with the lateral rebars, so the effect of the stirrup alone could not be isolated. Thus, an identical form of the coefficient equation was proposed as Equation (22) because the effect of stirrup confinement on the bearing strength is similar to that of spiral confinement. Instead, Equation (22) can be applied to the equation for P s , the contribution of lateral confinement to the bearing strength, as Equation (23).
κ s t = ( L L ) 0.12
P s = 4.1 κ s p f l a t , s p A c o r e , s p + 4.1 κ s t f l a t , s t A c o r e , s t
where L ,   f l a t , s t ,   A c o r e , s t are L ,   f l a t , s t ,   A c o r e , s t for minimum anchorage spacing.

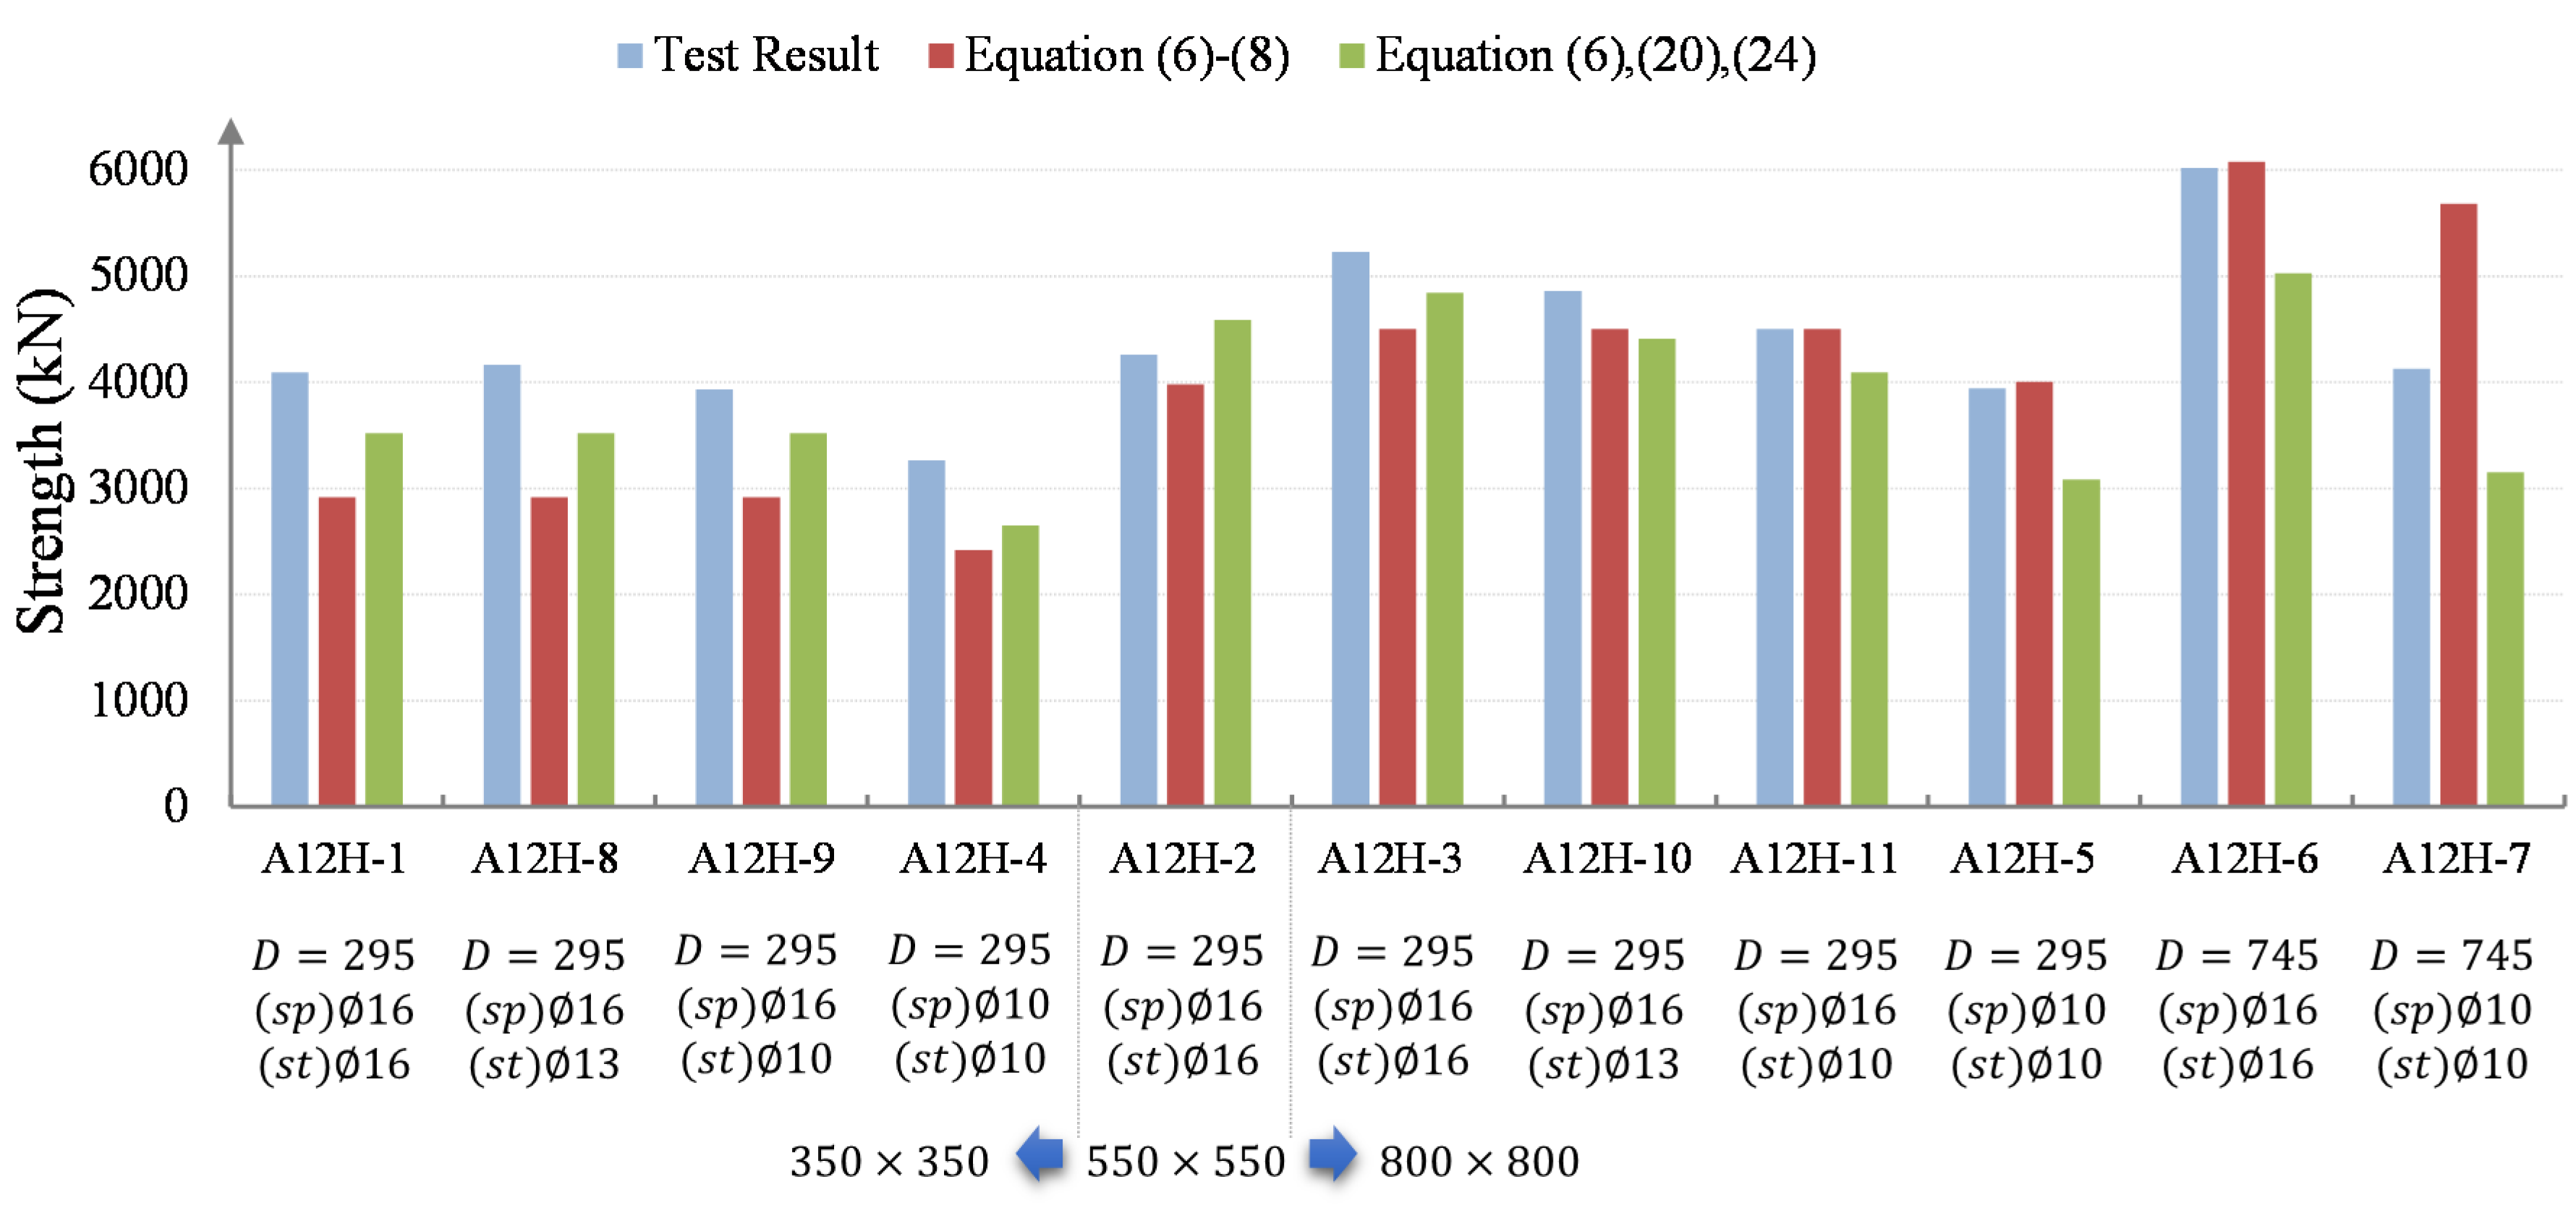
5. Comparison of Test Results and Design Equation Results

Among previous design equations, Equations (6)–(8) by Wollmann and Roberts-Wollmann [4,5] are generally used to estimate the ultimate bearing strength of the post-tensioning anchorage zone. The intended use of these equations concerns strength interpolation or extrapolation for anchorage bearing plates that were not qualified through testing. However, there is some ambiguity in each of the variables in the equations, such as A b of a special anchorage with horizontal ribs. In addition, the average area loss in lateral confinement by the anchorage bearing plate ( A a n c h o r a g e ) should be substituted for A d u c t , as shown in Equations (9) and (10), when a cone-shaped special anchorage bearing plate is used. In this paper, the model by Kwon et al. [16] was adopted for the computation of A b , and A a n c h o r a g e was used instead of A c o r e . In this paper, the coefficients representing the effect of A / A g and lateral confinement for a specimen larger than the minimum anchorage spacing were proposed from Equation (18) through Equation (23). The test results were compared with those of Equations (6)–(8) and Equations (18)–(23) (Figure 12). When applying the two design equations, identical values of A b and average area loss in lateral confinement ( A a n c h o r a g e ) were used.
As seen in Figure 12, for the minimum anchorage spacing, both Equations (6)–(8) and Equations (18)–(23) present conservative estimations, and Equations (18)–(23) show better agreement with the test results than Equations (6)–(8). The difference between the two sets of equations for this group lies in limiting the lateral confinement pressure to 8.3 MPa in Equations (6)–(8). Therefore, for the minimum anchorage spacing, the limitation of the lateral confinement pressure could be revised to 13 MPa or more for Equations (18)–(23). For the specimens larger than the minimum anchorage spacing, Equations (18)–(23) estimate the strength well overall except for A12H-5 and -7, which were reinforced with 10 spiral rebars. Meanwhile, Equations (6)–(8) greatly overestimates the strength of A12H-7, which could lead to an unsafe design. This is because the large spiral diameter led to overestimation of the effective core area, A c o r e , resulting in an overestimation of strength. Considering that anchorage zone designs such as A12H-5 or -7 are generally avoided by engineers, both design equations might be used to estimate the anchorage zone without respect to A / A g . However, to ensure safe and efficient design, the proposed equations are more effective, according to the comparison in Figure 12. Table 6 shows error rate comparisons between design equations. Each column in Table 6 presents the absolute value of prediction error for both design equations. Even though Equations (6)–(8) predicted very precisely for some specimens with errors less than 5%, but the average error was larger, and the error deviated much more than the proposed equation. Therefore, it can be concluded that the proposed equation provides a more reliable prediction of the bearing strength of the post-tensioning anchorage zone.

6. Conclusions

In this study, the bearing strength, load-displacement curve, and fracture modes of the post-tensioning anchorage zone were investigated based on load-transfer tests of 11 specimens, using variables of the relative bearing area ( A / A g ), confinement effect of spiral rebar design, and additional confinement effect of stirrup rebars. The following conclusions were drawn through an analysis of the test results:
(a).
A specimen with relatively small dimensions and less lateral reinforcement is more likely to be affected by the wedge action of the anchorage device. However, a specimen with A / A g ≥ 4.50 is affected by both concrete crushing and/or spalling;
(b).
For specimens with a small-diameter spiral for minimum anchorage spacing, the strength varies by about 30% depending on A / A g , and the effect of the additional bearing area on the ultimate bearing strength is influenced by lateral confinement. In addition, the behavior of the anchorage zone is highly affected by the local behavior near the anchorage bearing plate, and the sectional efficiency is mostly determined by A / A g . In the tests, it varied from about 20% to 110%, mostly depending on A / A g ;
(c).
For anchorage zone specimens with A / A g = 9.52, the proportional limit of the load-displacement curve is determined by the yield of the spiral rebar or fracture of the bearing plate, but the latter part of the curve is determined by lateral confinement;
(d).
The bearing strength can increase by over 50% depending on the lateral rebar design, but the rate of increase in strength decreases for specimens with relatively small A / A g ;
(e).
The effect of lateral confinement is determined by the combined effect of both lateral pressure and confined area;
(f).
The maximum A / A g that can produce 100% sectional efficiency is about 2.0 for the anchorage bearing plate used in this test;
(g).
For specimens that are fully confined with small-diameter spirals for minimum anchorage spacing, the stirrup rebar design mainly influences crack occurrence and patterns when A / A g is relatively small. However, not only the crack occurrence and pattern but also the section of the load-displacement curve after the proportional limit is influenced by stirrup rebar design when A / A g is relatively large;
(h).
The design model by Wollmann and Roberts-Wollmann [4,5] was reconstructed for the special anchorage bearing plate, and coefficients were proposed to consider the effect of A / A g and lateral confinement of a specimen larger than the minimum anchorage spacing. The comparison between the test results and the results of previous design equations verified the efficiency and accuracy of the proposed equation;
(i).
From the comparison of the design equations, it was concluded that the proposed equation provides a more reliable prediction with a 14.0% average error rate and 5.7% standard deviation of error rate.
In the future, the proposed design model will be compared with various anchorage and various reinforcement conditions used in post-tension work in the field and improved continuously as an anchorage zone design model.

Author Contributions

Conceptualization, J.-K.K.; methodology, J.-M.Y.; writing—original draft preparation, J.-K.K.; writing—review and editing, J.-M.Y.; validation, J.-K.K. and J.-M.Y.; investigation, J.-K.K. and J.-M.Y. All authors have read and agreed to the published version of the manuscript.

Funding

This work was supported by the National Research Foundation of Korea (NRF) grant funded by the Korea government (MSIT) (No. 2019R1F1A1053967).

Institutional Review Board Statement

Not applicable.

Informed Consent Statement

Not applicable.

Data Availability Statement

Not applicable.

Conflicts of Interest

The authors declare no conflict of interest.

Glossary

a , dimensions of the smallest rectangle including the bearing plate of the anchorage device
b section length of the specimen
Aconcrete surface area
A a n c h o r a g e average area loss by the anchorage bearing plate
A b net bearing plate area
A c o r e effectively confined concrete core area
A c o r e , s p effectively confined concrete core area of spiral
A c o r e , s p effectively confined concrete core area of spiral for the minimum anchorage spacing
A c o r e , s t effectively confined concrete core area of stirrup
A c o r e , s t effectively confined concrete core area of stirrup for minimum anchorage spacing.
A d duct area
Aggross area of the anchorage bearing plate
c , c dimensions of the rectangular concrete block
Ddiameter of spiral
D diameter of spiral for the minimum anchorage spacing
f c i   nominal concrete strength at the time of application of the tendon force
f c k ( t ) characteristic compressive cylinder strength of concrete at the time of tensioning.
f c p i allowable   stress   ( f c p i ) for a basic anchorage bearing plate
f l a t lateral confinement pressure
f l a t , c o n c lateral confinement pressure by concrete surrounding the spiral
f l a t , e q equivalent lateral confinement pressure induced by the spiral and stirrup
f l a t , s p lateral confinement pressure by spiral
f l a t , s p lateral confinement pressure by spiral for the minimum anchorage spacing
f l a t , s t lateral confinement pressure by stirrup
f l a t , s t lateral confinement pressure by stirrup for minimum anchorage spacing.
f r modulus of rupture of concrete
f s t , b u r s t i n g stress acting on the stirrup rebar by the bursting force
f y yield strength of reinforcing steel
f y , s t * remaining strength of the stirrup up to the yield strength
F p k characteristic tendon strength
h height of specimen
kcoefficient that represents the stress dispersion ratio
Lside length of stirrup
L side length of stirrup for minimum anchorage spacing.
Ptendon force
P c bearing resistance by concrete
P m a x maximum applied tendon force
P n ultimate bearing resistance
P r bearing resistance of anchorage
P s additional strength by confinement of spiral or stirrup rebar
P u maximum applied load of load-transfer test
sspacing of spiral or stirrup rebars
β confined area correction factor
γ p , u n f a v partial factor for prestress in unfavorable situations
η calibration factor for bearing strength

References

  1. ACI Committee 318. Building Code Requirements for Structural Concrete (ACI 318-14) and Commentary (318R-14); American Concrete Institute: Farmington Hills, MI, USA, 2014. [Google Scholar]
  2. Wurm, P.; Daschner, F. Experiments on spatial surface load of normal concrete. In German Committee for Reinforcement Concrete, Report No. 286; DAfStb: Berlin, Germany, 1977. (In German) [Google Scholar]
  3. Suzuki, K.; Nakatsuka, T. Estimation of Bearing Strength of Reinforced Anchorage Zone in Post-Tensioned Prestressed Concrete Members; Technology Reports; Osaka University: Osaka, Japan, 1982. [Google Scholar]
  4. Roberts-Wollmann, C.L. Behavior and Design of the Local Anchorage Zone of Post-Tensioned Concrete Members. Master’s Thesis, University of Texas at Austin, Austin, TX, USA, 1990. [Google Scholar]
  5. Wollmann, G.P.; Roberts-Wollmann, C.L. Anchorage Zone Design; Post Tensioning Institute: Chicago, IL, USA, 2000. [Google Scholar]
  6. Richart, F.E.; Brandtzaeg, A.; Brown, R.L. A Study of the Failure of Concrete under Combined Compressive Stresses; Bulletin No. 185; Engineering Experiment Station, University of Illinois at Urbana-Champaign: Champaign, IL, USA, 1928. [Google Scholar]
  7. Zhao, J.L.; Shen, S.L.; Wang, L.B.; Chen, J. A design approach for the interior anchorage zone of post-tensioned concrete structure. KSCE J. Civ. Eng. 2011, 15, 487–495. [Google Scholar] [CrossRef]
  8. Cervenka, V.; Ganz, H.R. Validation of post-tensioning anchorage zones by laboratory testing and numerical simulation. Struct. Concr. 2014, 15, 258–268. [Google Scholar] [CrossRef]
  9. Choi, E.S.; Lee, J.W.; Joh, C.B.; Kwark, J.W.; Kim, J.S.; Choi, Y.S. A local compression tests of UHPC anchor blocks for post-tensioning tendons. Key Eng. Mater. 2014, 525–526, 561–564. [Google Scholar] [CrossRef]
  10. Kim, J.S.; Kim, T.H. A stress analysis of the post-tensioned anchorage zones using UHPC. Key Eng. Mater. 2018, 737, 500–504. [Google Scholar] [CrossRef]
  11. Kim, J.R.; Kwak, H.G.; Kim, B.S.; Kwon, Y.S.; Bouhjiti, E.M. Finite element analyses and design of post-tensioned anchorage zone in ultra-high-performance concrete beams. Adv. Struct. Eng. 2019, 22, 323–339. [Google Scholar] [CrossRef]
  12. Marchão, C.; Lúcio, V.; Ganz, H.R. Optimization of anchorage corner blisters for posttensioning tendons. Struct. Concr. 2017, 18, 334–348. [Google Scholar] [CrossRef]
  13. Kim, J.K.; Kwon, Y.S.; Yang, J.M. Numerical analysis on the local anchorage zone behavior according to the relative size of bearing plate. J. Korean Soc. Hazard Mitig. 2017, 17, 171–179. (In Korean) [Google Scholar] [CrossRef]
  14. Kwon, Y.S.; Yang, J.M.; Kim, J.K. Experimental study on the ultimate bearing strength of post-tensioning anchorage zone. J. Korean Soc. Hazard Mitig. 2016, 16, 175–183. (In Korean) [Google Scholar] [CrossRef] [Green Version]
  15. Kim, J.K.; Yang, J.M.; Kwon, Y.S. Influence of steel fiber and reinforcing details on the ultimate bearing strength of the post-tensioning anchorage zone. Struct. Eng. Mech. 2016, 59, 867–883. [Google Scholar] [CrossRef]
  16. Kwon, Y.S.; Kim, J.K.; Yang, J.M. Development of efficient anchorage device and estimation of its bearing strength of posttensioning anchorage zone. J. Struct. Eng. 2018, 144, 04017219. [Google Scholar] [CrossRef]
  17. Mao, W.; Gou, H.; He, Y.; Pu, Q. Local stress behavior of post-tensioned prestressed anchorage zones in continuous rigid frame arch railway bridge. Appl. Sci. 2018, 8, 1833. [Google Scholar] [CrossRef] [Green Version]
  18. Lee, Y.H.; Kim, M.S. Investigation and improvement of bursting force equations in posttensioned anchorage zone. Adv. Mater. Sci. Eng. 2019, 2019, 9807975. [Google Scholar] [CrossRef] [Green Version]
  19. Bonetti, R.; Roberts-Wollmann, C.L.; Santos, J.T. Bearing strength of confined concrete. ACI Struct. J. 2014, 111, 1317–1324. [Google Scholar] [CrossRef]
  20. Marchão, C.; Lúcio, V.; Ganz, H.R. Efficiency of the confinement reinforcement in anchorage zones of posttensioning tendons. Struct. Concr. 2019, 20, 1182–1198. [Google Scholar] [CrossRef]
  21. Rebelo, J.; Marchão, C.; Lúcio, V. The efficiency of confinement reinforcement in post-tensioning anchorage zones. Mag. Concr. Res. 2021, 73, 271–287. [Google Scholar] [CrossRef]
  22. EOTA. Post-Tensioning Kits for Prestressing of Structures; EAD 160004-00-0301; European Organization for Technical Approvals: Brussels, Belgium, 2016. [Google Scholar]
  23. Eurocode 2. Design of Concrete Structures. Concrete Bridges—Design and Detailing Rules; EN1992-2; European Committee for Standardization: Brussels, Belgium, 2005. [Google Scholar]
  24. Collins, M.P.; Mitchell, D. Prestressed Concrete Structures; Prentice-Hall: Englewood Cliffs, NJ, USA, 1997. [Google Scholar]
  25. AASHTO. AASHTO LRFD Bridge Design Specifications, 8th ed.; American Association of State Highway and Transportation Officials: Washington, DC, USA, 2017. [Google Scholar]
  26. ASTM C31/31M. Standard Practice for Making and Curing Concrete Test Specimens in the Field; American Society for Testing and Materials International: West Conshohocken, PA, USA, 2015. [Google Scholar]
  27. ASTM C39/39M. Standard Test Method for Compressive Strength of Cylindrical Concrete Specimens; American Society for Testing and Materials International: West Conshohocken, PA, USA, 2014. [Google Scholar]
Figure 1. Geometry of the post-tensioning anchorage zone with a basic anchorage device.
Applsci 11 08386 g001
Figure 2. Lateral confinement: (a) anchorage device, duct, and confinement by rebar; (b) confinement by spiral and stirrup rebar; (c) confinement by spiral rebar; (d) confinement by the surrounding concrete.
Applsci 11 08386 g002aApplsci 11 08386 g002b
Figure 3. Representative drawings of test specimens: (a) A12H-1; (b) A12H-3.
Applsci 11 08386 g003
Figure 4. Test setup and loading procedure: (a) specimen under loading by UTM; (b) load-transfer test loading procedure.
Applsci 11 08386 g004
Figure 5. Test results: (a) maximum load; (b) load-carrying efficiency ( P u f c i ( A A d u c t ) ) ; (c) net bearing stress at maximum load ( P u / A b ).
Applsci 11 08386 g005
Figure 6. Fracture mode of group 1 specimens: (a) A12H-1; (b) A12H-2; (c) A12H-3; (d) A12H-4; (e) A12H-5.
Applsci 11 08386 g006aApplsci 11 08386 g006b
Figure 7. Group 1 test results ( D = 295   mm ): (a) load-displacement curve; (b) ultimate bearing strength.
Applsci 11 08386 g007
Figure 8. Fracture modes of group 2 specimens: (a) A12H-6; (b) A12H-7.
Applsci 11 08386 g008
Figure 9. Test results of group 2 specimens: (a) load-displacement curve; (b) ultimate bearing strength.
Applsci 11 08386 g009
Figure 10. Test results of group 3 specimens: (a) load-displacement curve; (b) ultimate bearing strength.
Applsci 11 08386 g010
Figure 11. Fracture mode of group 3 specimens: (a) A12H-8; (b) A12H-9; (c) A12H-10; (d) A12H-11.
Applsci 11 08386 g011aApplsci 11 08386 g011b
Figure 12. Comparison of test results and results of design equations.
Applsci 11 08386 g012
Table 1. Test specimens.
No. f c i
(MPa)
c
(mm)
a
(mm)
A / A g D
(mm)
Spiral RebarStirrup Rebar
A12H-132.63502601.82295Φ16 mm–8@50 mmΦ16 mm–8@50 mm
A12H-232.65502604.50295Φ16 mm–11@50 mmΦ16 mm–11@50 mm
A12H-332.68002609.52295Φ16 mm–16@50 mmΦ16 mm–16@50 mm
A12H-432.63502601.82295Φ10 mm–8@50 mmΦ10 mm–8@50 mm
A12H-532.68002609.52295Φ10 mm–16@50 mmΦ10 mm–16@50 mm
A12H-632.68002609.52745Φ16 mm–16@50 mmΦ16 mm–16@50 mm
A12H-732.68002609.52745Φ10 mm–16@50 mmΦ10 mm–16@50 mm
A12H-832.63502601.82295Φ16 mm–8@50 mmΦ13 mm–8@50 mm
A12H-932.63502601.82295Φ16 mm–8@50 mmΦ10 mm–8@50 mm
A12H-1032.68002609.52295Φ16 mm–16@50 mmΦ13 mm–16@50 mm
A12H-1132.68002609.52295Φ16 mm–16@50 mmΦ10 mm–16@50 mm
Table 2. Lateral confinement in group 1 specimens.
No. f l a t , s p
(MPa)
Effective   f l a t , s p
  ( 8.3   MPa )
f l a t , s t   ( MPa ) f l a t , e q   ( MPa ) Effective   f l a t , e q
  ( 13   MPa )
Confinement by
Surrounding Concrete Outside Spiral (MPa)
A12H-112.258.38.9622.7513(cracked)
A12H-212.258.34.8927.8313(cracked)
A12H-312.258.33.2234.86136.16 (negligibly cracked)
A12H-44.404.402.347.157.15(cracked)
A12H-54.404.400.608.598.596.16 (negligibly cracked)
Table 3. Lateral confinement of group 2 specimens.
No. f l a t , s p   ( MPa ) Effective   f l a t , s p
  ( 8.3   MPa )
f l a t , s t   ( MPa ) f l a t , e q   ( MPa ) Effective   f l a t , e q
  ( 13   MPa )
Confinement by
Surrounding Concrete Outside Spiral (MPa)
A12H-44.404.402.347.157.15(cracked)
A12H-112.258.38.9622.7513(cracked)
A12H-54.404.400.608.598.596.16 (negligibly cracked)
A12H-312.258.33.2234.86136.16 (negligibly cracked)
A12H-71.741.740.552.182.186.16 (negligibly cracked)
A12H-64.854.853.017.267.266.16 (negligibly cracked)
Table 4. Test strength and P s of Equation (8) according to the spiral diameter.
No.Spiral f l a t , s p   ( MPa ) A c o r e   ( mm 2 ) 4.1 f l a t , s p A c o r e   ( kN ) Difference
(kN, ①)
Test Results
(kN)
Difference
(kN, ②)
②/①
A12H-5 D 295 ,   10 4.4036,6666621974394718414.4%
A12H-7 D 745 ,   10 1.74368,89026364130
A12H-3 D 295 ,   16 12.2536,6661842549652287939.3%
A12H-6 D 745 ,   16 4.85368,89073386022
Table 5. Lateral confinement of group 3 specimens.
No. f l a t , s p (MPa) Effective   f l a t , s p
(≤8.3 MPa)
f l a t , s t (MPa) f l a t , e q (MPa) Effective   f l a t , e q
(≤13 MPa)
Confinement by
Surrounding Concrete Outside Spiral (MPa)
A12H-912.258.32.0214.6213(cracked)
A12H-812.258.34.9618.0613(cracked)
A12H-112.258.38.9622.7513(cracked)
A12H-1112.258.30.4515.39136.16 (negligibly cracked)
A12H-1012.258.31.6423.78136.16 (negligibly cracked)
A12H-312.258.33.2234.86136.16 (negligibly cracked)
Table 6. Error rate comparisons between design equations.
No. | 1 Equations   ( 6 ) ( 8 ) T e s t   R e s u l t | | 1 Equations   ( 6 ) , ( 20 ) , ( 24 ) T e s t   R e s u l t |
A12H-129%14%
A12H-230%15%
A12H-326%11%
A12H-426%19%
A12H-57%8%
A12H-614%7%
A12H-77%9%
A12H-80%9%
A12H-92%22%
A12H-101%16%
A12H-1138%24%
Average16.2%14.0%
Standard deviation13.7%5.7%
Publisher’s Note: MDPI stays neutral with regard to jurisdictional claims in published maps and institutional affiliations.

