Abstract
Rock failure during tunnel excavation is still a matter of concern. The influence of groundwater is generally taken into account along discontinuities or in “soil-like” formations. However, brittle saturated porous rocks can be subject to undrained conditions during tunnel excavation. Negative effective stresses develop close to the tunnel boundary. This study aims at identifying a limit pore pressure in the rock around the tunnel, which induces failure in the tension zone. A discussion related to the strength parameters in the tension zone, with the Hoek and Brown criterion, is presented. A comparative analysis with different far-field stresses and rock properties indicates that the limit pore pressure decreases with the depth of the tunnel. The limit pore pressure is directly proportional to the uniaxial compressive strength and inversely proportional to the constant m. When the uniaxial compressive strength is close to the state of stress around the tunnel, the role of m reduces. Numerical models set up with FLAC indicate that the tension zone around the tunnel has a thickness of about 1 m. Due to uncertainties in the far-field stresses, hydro-mechanical behavior, and properties of the rock, the tension zone requires a careful investigation, in order to avoid stability problems.
1. Introduction
Failure caused by the excavation of tunnels in rocks has been largely studied in many civil and mining engineering projects. The main mechanical factors affecting the stability are the far-field stresses, groundwater, strength, and deformability of the rock.
The failure process that controls the stability of openings excavated in hard rocks at large depths is ruled by brittle crack initiation and propagation, which leads to spalling, slabbing, and, in extreme cases, rock-bursts [1]. The prediction of crack initiation and propagation at the boundary of tunnels and the identification of the appropriate parameters to model this occurrence were largely investigated over the past decades [2,3,4,5,6,7,8].
Tunnels excavated in very poor quality rock masses have received wide attention. An extensive analysis of squeezing problems in tunnel excavation in weak heterogeneous rock masses and rock masses of very poor quality is reported in the literature [1,9,10,11,12,13,14,15,16]. These studies take into account the effect of weak rock strata, such as joints and bedding planes, which can trigger rock mass disintegration at large depths [17]. Furthermore, the analysis of the orientation of thinly spaced weakness planes on the boundary of excavations has received wide attention, because of the occurrence of unexpected slip failure [18,19,20,21,22]. On the other hand, when rocks such as marls, claystones, siltstones, and weak sandstones have experienced geological stable conditions or a post tectonic environment, they have few discontinuities and can be treated as continuous intact rock material [1].
These studies outlined that the influence of groundwater on the behavior of the rock mass surrounding a tunnel is very important because it can cause severe tunneling problems, such as due to either physical deterioration of the components of the rock mass or the reduction of the effective stress confinement due to pore water pressure [10,14,16,23].
Rock mass classification schemes aim at classifying and characterizing the rock masses and provide a basis for estimating deformation and strength properties for the design of underground excavation and support [1,23,24,25]. In some classification schemes, attempts are made to account for the influence of groundwater pressure or flow on the stability of underground excavations [1,23,24,25,26]. In these schemes, the rock masses are of reasonable quality, and the effect of water is taken into account along the discontinuities. In this way, the resulting rock parameters are affected by the presence of water and the role of water pressure is not directly accounted for.
Hoek [10] and Marinos et al. [1] outlined that the design of tunnels in rock masses affected by water pressure should include a full effective stress numerical analysis. Accordingly, the GSI rock mass classification scheme, developed for the Hoek and Brown criterion (H&B) [27], does not take into account the presence of groundwater.
Coupled hydro-mechanical analyses are frequently carried out in saturated rocks with low strength and high deformability that are prone to ground squeezing [28,29,30]. Consequently, the influence of pore water pressure on tunnel excavation is mainly investigated in “soil-like” clay formations [31,32,33,34]. The excavation induces the development of a wide plastic zone where pore pressure may significantly decrease up to reach negative values, in a wide area surrounding the tunnel. This results in a long-term critical condition with the occurrence of swelling. [31,32,33,34]. The analysis of squeezing occurrence during TBM excavation in a low-permeability ground indicates that the water content remains constant, and the negative excess pore pressure generation determines a more favorable condition in the short-term [34].
The occurrence of undrained conditions during the tunnel excavation in brittle “moderately weak” porous rocks has been less investigated [35]. In these brittle rocks, the spread of plasticity close to the boundary of the tunnel is not as catastrophic as in “soil-like” clay formations. Consequently, a different scenario occurs during the process of excavation. In fact, the pore pressure is always positive in undrained conditions. This pore pressure induces negative effective stresses (Figure 1a), which result in a state of stress in the tension zone (Figure 1b) close to the boundary of the excavation.
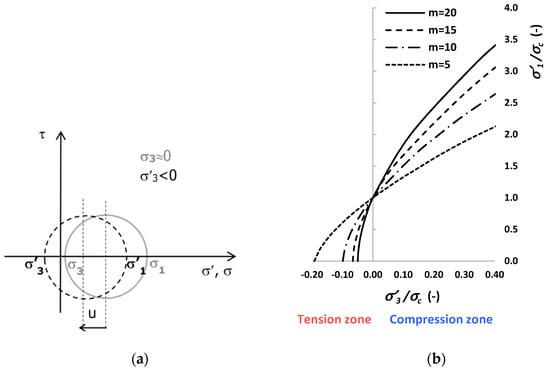
Figure 1.
(a) Effect of the pore pressure close to the excavation boundary; (b) Variation of the strength with parameter m in the tension and compression zone.
The paper focuses on the analysis of failure in isotropic brittle porous rock, in undrained conditions, during the tunnel excavation. The purpose of this study is the identification of a limit pore pressure in the rock around the tunnel, which induces failure in the tension zone. The first part of this study discusses the issue related to the determination of the tensile strength of the rock and the related tension zone with the Hoek and Brown criterion [27]. Data fitting of the results of triaxial tests carried out on sandstone at different ranges of confinement allows determining different strength parameters and tension zones (Section 2). Next, the undrained condition in moderately weak brittle rocks is discussed. The coupling between the Kirsch solution and the H&B criterion for an unsupported tunnel identifies a limit condition of pore pressure at the boundary of the tunnel in the tension zone in undrained conditions (Section 3). The study proceeds with a comparative analysis of synthetic cases with different far-field stresses and rock properties. The generation of an excess pore pressure during tunnel excavation and the investigation of the extent of the tension zone around the tunnel is carried out with FLAC (Fast Lagrangian Analysis of Continua, ver. 8.1) (Section 4). The results of these analyses indicate that unexpected tensile failures can occur around the tunnel immediately after the excavation.
2. The H&B Criterion in the Compression and Tension Zone
The Hoek and Brown criterion [27] was introduced in 1980 and was derived for applications in the underground excavation in hard brittle rocks.
Practitioners in rock engineering have applied the Hoek and Brown criterion successfully for over 40 years to a wide range of intact and fractured rock types [36,37]. The original criterion has been updated by the authors based on the experience acquired in its practical application in several geological and engineering contexts [38]. For a saturated rock with a water pore pressure u the criterion is expressed in terms of effective stresses: σ′1 = σ1 − u and σ′3 = σ3 − u. The general nonlinear criterion for intact rock is:
where: σc is the uniaxial compressive strength of the intact rock obtained from data fitting, and m and s are empirical dimensionless constants. For hard intact rock, the parameter s is always equal to 1, and the constant a = 0.5.
The uniaxial compressive strength σc and the constant m are obtained by data fitting of uniaxial and triaxial compression tests.
The range of applicability of the criterion is determined by the transition from shear to ductile failure. Furthermore, tensile failure is not dealt with by the H&B criterion [38]. As tensile failure can occur in some rock engineering problems, Fairhurst [39] proposed the Griffith crack theory to set the ratio of compressive strength σc to tensile strength σt. For practical purposes, Fairhurst [39] proposed a tensile cut-off. Hoek and Brown [38] suggested an empirical relationship, σc/σt = 0.81 m + 7, for the definition of the cut-off.
The parameter m is a constant, which describes the slope of the strength envelope. The value of m affects the strength in the compression zone (high and low confinement) and in the tension zone (Figure 1b). In general, the uniaxial compressive strength estimated with data fitting with H&B criterion can be higher from the measured one, in particular when data fitting is carried out with the use of high confinements. On the other hand, the tensile strength obtained with data fitting is underestimated for strong and brittle rocks and overestimated for soft rocks [40].
An analysis of data fitting carried out by Cai [41], indicated that the H&B criterion “is very good for hard, strong crystalline rocks at high confining pressure, but much less so in the low confining pressure and tension zone”, consequently the m value is not a constant but confining pressure dependent. Figure 1b clearly shows that the H&B criterion predicts a higher tensile strength with low values of m. Cai [41] presented a study focused on the practical estimates of the tensile strength with the H&B criterion in weak rocks with pores. The study indicates that the compressive stress to tensile stress ratio at crack initiation is less than 8 (according to the Griffith theory). Using the same analog of Griffith’s theory and accounting for the difference of crack propagation in compression and tension, the following stress ratio R is proposed:
where: σc_exp is the experimental value of the uniaxial compressive strength, σci is the crack initiation stress level, and α is a constant for the tension zone.
The tensile strength σt of the rock can be estimated from:
As the parameter m of the H&B criterion is not a constant, but changes from the compression zone mc to the tension zone mt, Cai [41] introduced the constant β for the compression zone and proposed the following relationships for the determination of m in the two zones:
α and β are constants that depend on the rock texture (e.g., grain size and shape), mineral content (e.g., clay and/or calcite content), and the crack initiation mechanism [41]. The range of the constant α for weak rocks is 3 < α < 8 and β < α.
Determination of the H&B Parameters of a Porous Rock
The Vosges sandstone is a porous, soft rock, classified as a pink quartz sandstone, with a few percent of feldspar and white mica [42]. This rock is poorly cemented, and the cohesion is due to the interpenetration between grains. The porosity is about 22%. The results of triaxial tests carried out on this sandstone show the occurrence of (1) a combination of axial splitting and inclined failure surfaces at low pressure (≈0); (2) one or two parallel bands (failure surfaces) visible throughout the specimen with confinements between 10 and 30 MPa; (3) Conjugate shear bands with confinements from 40 to 60 MPa [42].
The considered range of confinement of the triaxial tests is 0.1–40 MPa because the transition from brittle to ductile failure occurs at 40 MPa. The tests are interpreted by assuming s = 1 and a = 0.5 (intact rock material, without crack damage).
Figure 2a shows two typical interpretations of the laboratory tests with the H&B criterion, with the following ranges of confinement: (1) 0.1–40 MPa (2) 0.1–30 MPa. The data fitting clearly indicates a higher predicted value of σt when the confinement range is 0.1–40 MPa, as expected.
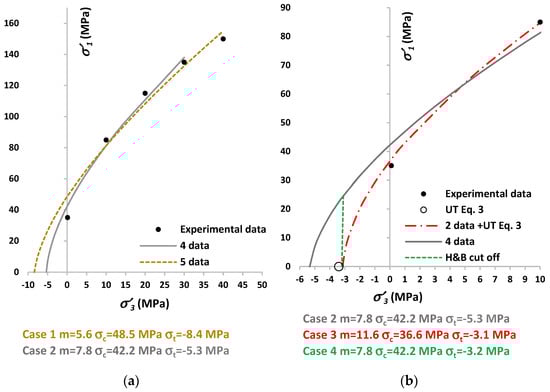
Figure 2.
(a) Comparison of data fitting of triaxial compression tests of Vosges sandstone with a confinement range σ′3 = 0.1–40 MPa and σ′3 = 0.1–30 MPa. (b) Comparison of data fitting with confinement range σ′3 = 0.1–30 MPa (grey line) and σ′3 = −3.4–10 MPa (red line). The open symbol, UT Equation (3), is the uniaxial tensile strength estimated with Equation (3). The green line is the tensile cut off calculated with σc/σt = 0.81m + 7.
As the tensile strength of Vosges sandstone is not measured, Equations (2) and (3) are used to estimate the uniaxial tensile strength of this rock. From the results of the tests carried out by [42], the estimated properties are: σc_exp ≈ 35 MPa and σci ≅ 17 MPa. This value of σci ≅ 48%σc_exp is in agreement with [2,3,4,5,6,7,8,41]. By assuming α = 5, the stress ratio is R = 10.3. The estimated tensile strength is σt = −3.4 MPa, which is lower than the predicted tensile strength of Figure 2a.
In the analysis of rock failure at the boundary of the tunnel, the confinement σ′3 is expected to be lower (<5 MPa) than σ′3 used in the high compression zone of triaxial tests. However, the available confinements in the compression zone are 0.1 MPa and 10 MPa. The red line in Figure 2b shows data fitting in the range −3.4 ≤ σ′3 ≤ 10 MPa. The regression gives mt = 11.6 and σt =−3.1 MPa. For comparison, the figure also shows data fitting in the confinement range 0.1 ≤ σ′3 ≤ 30 MPa.
By introducing mc = 7.8, mt = 11.6 and σc_exp/σci ≅ 2.06 in Equation (4), a back calculation of the constants α and β gives α = 5.6 and β = 3.9. These values are in agreement with the range proposed by Cai [41].
The tensile strength calculated with the relationship σc/σt = 0.81m + 7, proposed by Hoek and Brown [38], with σc = 42.2 MPa and m = 7.8, gives σt = −3.2 MPa, which is in agreement with the previous finding. Figure 2b also shows the H&B strength envelope with this cut-off (green line).
Although the difference between the uniaxial tensile strengths from the regressions shown in Figure 2b is not so high (σt = −3.1 MPa and σt = −5.3 MPa), however, the extent of the tensile zones identified by the two data fitting can change the results of the analysis of rock failure near to the excavation boundary. The strength envelope with the H&B cut-off has a tension zone, which is intermediate between the two other cases shown in Figure 2b.
The parameters of the three data fitting shown in Figure 2 (Case 1, 2, 3, and 4) are used to carry out sensitivity analysis of rock failure close to the boundary of the excavation (in the tension zone). Here the effect of uniaxial compressive strength reduction observed in saturated specimens is disregarded, because the purpose is a comparative analysis related to the data fitting procedure. The strength parameters of Case 1 are the less reliable for the tension zone and their use has just the purpose to complete the scenario of this study. The m constant is set mc = mt in the tension zone in Case 1, Case 2, and Case 4. Table 1 reports the summary of these parameters.

Table 1.
Parameters obtained by data fitting of Vosges sandstone.
3. Identification of the Limit Pore Pressure around a Circular Tunnel in a Saturated Brittle Rock
The analysis focuses on a horizontal circular tunnel excavated in a porous saturated rock. The induced state of stress at the wall of the tunnel excavated along a principal direction (Figure 3) is calculated with the Kirsch solution when σ′ϑ > σ′r:
where: σ′ϑ is the effective tangential stress, σ′r is the effective radial stress, Po is the support pressure and corresponds to σr = σ3, u is the pore water pressure and S is the induced state of stress (tangential stress) at the wall:
where K < 1 defines the anisotropy of the far field stresses (Figure 3).
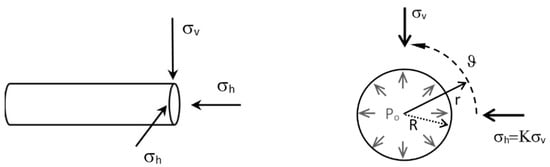
Figure 3.
Far field stresses (σv, σh), radial distance (r), tunnel radius (R), azimuth (ϑ), and support pressure (Po) in a horizontal circular tunnel.
In many porous rocks, the permeability is generally low, and immediately after the excavation (t = 0+), the condition near to the wall can result undrained.
According to Skempton, in an isotropic linear elastic soil, in axial symmetry conditions, the excess pore pressure Δu is equal to the variation of the total mean stress p = 1/3 (σ1 + σ2 + σ3):
where B is the Skempton’s pore pressure parameter, which is a function of the bulk moduli of the solid skeleton, solid grains, and water.
When the far field stresses are unequal, i.e., anisotropic far field stresses (K ≠ 1), the excavation induces volumetric strains [43,44,45], which are positive (compaction) and negative (dilatancy). Correspondingly, the undrained condition results in a change of pore pressure, which can be calculated with Equation (7). By using the complete Kirsch solution and imposing plane strain conditions, the mean stress variation Δp and the excess pore pressure Δu in a horizontal circular tunnel are:
where: σaxis is the induced stress parallel to the hole axis (plane strain condition), and νu is the undrained Poisson ratio.
Equation (8) shows that the excess pore pressure is positive Δu > 0 in the direction of the minimum far field stress (where the tangential stress is σϑmax) and is negative Δu < 0 in the direction of the maximum far field stress (where the tangential stress is σϑmin). The excess pore pressure at ϑ = 45° is Δu = 0.
The amount of excess pore pressure depends on the far field stress magnitude and anisotropy (K) and on the elastic parameters (B and νu). In practical applications, drained and undrained conditions depend on the relative magnitude of permeability, stiffness, and rate of loading. The undrained condition in soils is considered isochoric, while in rocks a change in volume can occur. The undrained condition in rocks is defined as a “no change of the pore fluid mass” at the time t = 0+. In this general case, the excess pore pressure can be Δu = 0 (at any azimuth ϑ) or Δu ≠ 0 (with variation at different azimuth ϑ in anisotropic far field state of stress). Practically, the pore pressure can increase, decrease, or remain constant immediately after the excavation, but drainage does not occur over the time scales of loading for a given time. This fact indicates that u ≠ 0 at the excavation boundary in the short term. In the elastoplastic case, the magnitude of the excess pore pressure also depends on the strength parameters of the rock and on the stress redistribution related to the spread of plasticity.
In moderately weak brittle rocks, the excess pore pressure can be Δu = 0 or Δu ≠ 0, but the total pore pressure is always positive and not negligible, at least at some azimuths.
In the following analysis, the total pore pressure, immediately after the excavation, at the boundary of the tunnel is assumed u > 0 (with Δu = 0 or Δu ≠ 0).
By coupling the Kirsch solution with the H&B criterion (Equation (1)), the limit support pressure Po = σr, when σϑ > σaxis > σr at the wall of the tunnel is:
The pore pressure u in Equation (9) is the total pore pressure, which can also take into account the excess pore pressure (Δu ≠ 0). The parameter m can be in the tension zone or in the compression zone in dependence of the type of stress condition of the analysis. Equation (9) indicates whether the rock is self-supporting (Po ≤ 0) or needs a support pressure (Po > 0).
The purpose of this study is the identification of a limit pore pressure ulim that induces failure in the tension zone in a given real case, characterized by rock strength properties and far field stresses. Consequently, the support pressure must be set Po = 0. The comparison of this limit pore pressure ulim with the in-site pore pressure indicates if failure is expected to occur in a given real case. If the in-site pore pressure is higher than the limit pore pressure, countermeasures are necessary, such as drainage or pre-reinforcements.
By imposing Po = 0 in Equation (9) and introducing X = S/σc, the limit condition of the pore pressure ulim is:
The sign of the term in the right side of Equation (10) depends on the parameter X, which expresses the relative magnitude of S and σc. The equation indicates that ulim increases with increasing σc. An overestimate of ulim occurs if m is fitted in the compression zone at high confinement (m = mc) because the limit pore pressure decreases with increasing m. Equation (10) indicates that the limit pore pressure is ulim = 0 when X = S/σc = 1. In this case, failure can already occur in dry conditions, because Po = 0. Consequently, a support pressure Po > 0 is always required when X ≥ 1.
If Equation (4) holds (mt fitted in the tension zone), the expression of ulim becomes:
when S is very small compared to σc (tunnel at shallow depth/strong rock), the term X becomes negligible, and the limit pore pressure in Equation (11) can be approximated by:
Equation (12) represents the occurrence of “pure” tensile failure with σ′1 ≈ 0.
Equations (10)–(12) show the importance of the choice of design input parameters for the analysis of tunnel stability: far field stresses and strength parameters of the rock. On the other hand, the strength and deformability parameters of the rock also affect the generation of undrained conditions and excess pore pressure Δu. Furthermore, a reliable estimation of the in-site pore pressure is necessary, for the calculation of Δu and the subsequent comparison of the in-site total pore pressure u with ulim.
This study aims at investigating the role of each parameter of Equation (10) in the variation of the limit pore pressure. To this end, deterministic analyses are presented in the following Section.
A development of this study can be the application of probabilistic analyses to take into account the uncertainty and variability of the far field stresses, pore pressure, and rock properties. In this framework, the methodologies proposed by Cai [46], Ji et al. [47], Fattahi et al. [48], and Lü et al. [49] can be applied to deal with the parametric uncertainties and their statistical correlations, in order to identify possible scenarios of tunnel instability.
4. Rock Failure in the Tension Zone during Tunnel Excavation: Results and Discussion
The pattern of rock failure in the tension zone in undrained condition (u > 0 with Δu = 0 or Δu ≠ 0), can be analyzed with the Mohr circles and the origin of planes. Figure 4 shows two conjugate failure planes that isolate a prismatic rock solid. The shape of the rock-solid changes in relation to the azimuth, and induced state of stress and pore pressure. A similar shape of damage in the tension zone of a circular test tunnel was noted and identified with AE, even though no cracking or fracturing could be visually observed [4]. On the other hand, the well-observed and investigated brittle failure process results in classic V-shaped notches, in the region of maximum compressive stress. In this case, shallow spalling notches, experienced in tunnels in the compression zone, are associated with pure tensile failure at the microscale and cause thin slivers or plates of rock to peel off the tunnel surface [2,3,4,5,6,7,8,50]. However, under overall tensile loading, the stress levels of crack initiation (σci)t and crack propagation (σcd)t (stress level at which crack coalescence occurs) are very close to the tensile peak strength σt: (σci)t ≅ (σcd)t ≅ σt [41]. The occurrence of failure in the tension zone results in a negative radial effective stress, induced by the pore pressure. In this case, failure is expected to occur at the time of the excavation of the tunnel, because the induced tensile stress is close to σt.
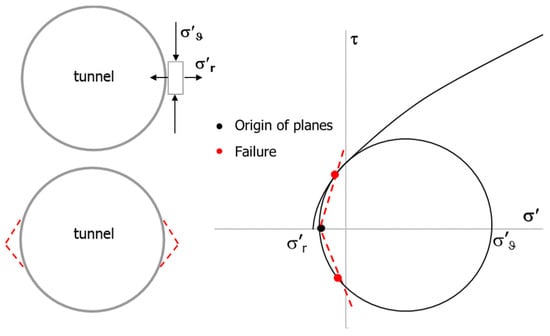
Figure 4.
Failure in the tension zone as a function of the induced state of stress. The dotted red lines are the failure planes.
The variation of ulim with the state of stress S and the different couples of m and σc (Figure 2 and Table 1), with Po = 0 and X < 1, is analyzed in the following. Two cases of far field stresses, which induce different S at r = R, are selected (Table 2). The state of stress S = 8 MPa occurs in case A and Case B at ϑ = 90° and at ϑ = 0°, respectively.
Table 2.
Stresses used in the analysis of ulim. The factor K = 0.7 in both cases.
The first analyses are in undrained condition with Δu = 0, which results in a total pore pressure equal to the initial pore pressure u = uini at r ≥ R.
Figure 5a shows that ulim increases when S decreases, according to Equation (10). The figure shows that, due to the change of m and σc (high m combined with low σc and viceversa), ulim is almost equal in Cases A (S = 8 MPa) and B (S = 4 MPa). Figure 5a also shows that ulim decreases with increasing m. This outcome is related to the tension zone, which is reduced when the slope of the strength envelope increases. However, here any m is associated with a different σc and the term X varies along the lines.
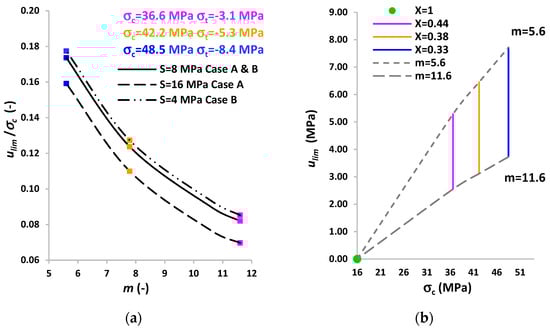
Figure 5b shows the influence of the strength parameters σc and m when S = 16 MPa at ϑ = 0° (Case A). The figure shows the variation of ulim with m (5.6 ÷ 11.6) at three fixed uniaxial compressive strengths: σc = 36.6 MPa σc = 42.2 MPa σc = 48.5 MPa. A decrease of the influence of m in the determination of ulim occurs at the lower σc. However, the effect of σc is related to the magnitude of S. In fact, an increase of X, due to a lower σc, corresponds to a decrease of the influence of m in the determination of ulim, because σc becomes closer to S. The green symbol in Figure 5b refers to X = 1, which corresponds to ulim = 0.
The role of X is furtherly investigated in Figure 6a, with the strength parameters of Case 2 and Case 3 (Table 1). The figure shows the normalized strength envelopes and the effective state of stress of the correspondent 4 cases of Figure 5a. The two filled symbols lying on each envelope correspond to the two values of S at ϑ = 0° (Case A, S = 16 MPa and Case B, S = 8 MPa). For any strength envelope, the symbols with the lower values of σ′1/σc correspond to lower values of X. This indicates that low values of X can induce tensile failure close to the uniaxial tensile strength, in agreement with Equation (12). Furthermore, the assumption mc = mt overestimates the tensile strength of the rock in the tension zone and can actually result in an unexpected failure close to the tunnel wall. Figure 6a also shows the H&B cut-off (Figure 2b). Although the predicted tensile stress is almost equal to that of Case 3, however, the identified tension zone cannot predict the occurrence of failure of Case 3, because the uniaxial compressive strength is σc = 42.24 MPa.
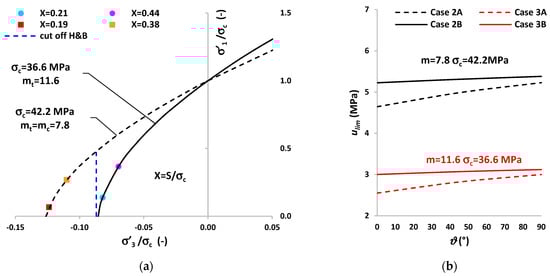
Figure 6.
(a) Strength envelopes calculated with the different couples of m and σc found in the data fitting (Case 2 and Case 3 in Figure 2b and Table 1). The filled symbols are the states of stress in the limit condition ulim at the tunnel boundary. The normalized states of stress are: σ′1/σc = (S-ulim)/σc and σ′3/σc = (Po-ulim)/σc = -ulim/σc; (b) Variation of ulim with ϑ (Table 3 and Table 4).
Table 3 and Table 4 report the limit pore pressures calculated in different cases at different azimuths. Figure 6b shows the comparison between Cases 2A,B, and 3A,B of Table 3 and Table 4. The variation of ulim with the two sets of strength parameters indicates that ulim is almost constant with ϑ at low far field state of stress (Cases 2B and 3B). The difference of ulim between Case A and Case B decreases with increasing ϑ, because S reduces with ϑ. An analysis of the data reported in Table 4 demonstrates that at this depth (z = 150 m) failure in the tension zone is not expected to occur; because ulim is very high compared with the hydrostatic pore pressure (1.5 MPa) and a very high excess pore pressure cannot be practically generated. This outcome indicates that, at shallow depths, failure in the tension zone should not occur with moderately weak rocks and geostatic stresses.
Table 3.
Influence of strength parameters and limit pore pressures in Case A.
Table 4.
Influence of strength parameters and limit pore pressures, in Case B.
A complete analysis of the Cases reported in Table 3 is shown in Figure 7a. The difference between these Cases can be interpreted as percentages of the ulim calculated with the strength parameters of the tension zone: σc = 36.6 MPa and mt = 11.6 (Case 3A). The highest increase is 82% and occurs in Case 2A, which refers to the strength parameters of the compression zone: σc = 42.2 MPa and mc = 7.8. An increase of 49% occurs in Case 3A*. This outcome indicates the influence of m on the magnitude of ulim. Finally, an increase of 22% occurs in Case 2A*, indicating the influence of σc on the magnitude of ulim. The two fitted σc (36.6 MPa and 42.2 MPa) differ by 15%, which is a usual range of variability.
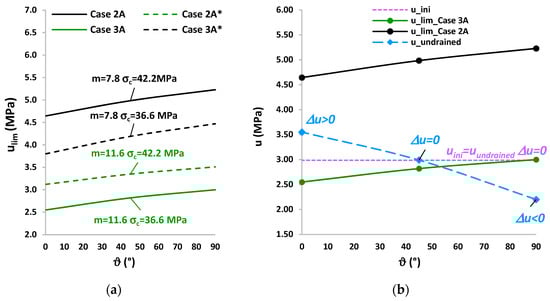
Figure 7.
(a) Variation of ulim with ϑ in all the Cases reported in Table 3; (b) Variation of ulim with ϑ in Case 2A and Case 3A at r = R. Comparison with the initial pore pressure uini and the pore pressure in undrained condition Δu = 0 and Δu ≠ 0 (calculated with FLAC in Case 3A).
A comparison between the hydrostatic pore pressure (Case A with z ≈ 300 m) uini = 3 MPa and the limit pore pressures of Case 2A and Case 3A is shown in Figure 7b. If Δu = 0 the undrained pore pressure is equal to the initial one uundrained = uini = 3 MPa. The figure shows that ulim > uini in Case 2A (black line), indicating that failure does not occur. In Case 3A (green line) ulim ≤ uini = 3 MPa which indicates that at all azimuths failure in the tension zone can occur.
The previous analyses refer to the boundary of the excavation r = R and Δu = 0. The generation of excess pore pressures Δu ≠ 0 and the hydro-mechanical response of the rock at r > R (with Δu = 0 and Δu ≠ 0) are calculated with FLAC. Given the symmetry of the tunnel with respect to its axis and assuming isotropic behavior of the rock, the numerical model represents one-quarter of the full section of a tunnel and the surrounding rock, with a radial grid with 60 × 60 elements. The radius of the tunnel is R = 2 m and the radial dimension r = 20 m. The simulations are set up with the data of Case A (Table 2). The excess pore pressure in the elastic (Equation (8)) and elastoplastic field generated by the excavation of the tunnel, is calculated with the initial pore pressure uini = 3 MPa (hydrostatic). The elastic constants, estimated from the available data [36], are Eu = 10 GPa νu = 0.33. The strength parameters, used in the elastoplastic simulation, are mt = 11.6 σc = 36.6 MPa σt = −3.1 MPa (Case 3A). Figure 8 shows the results of the elastic and elastoplastic numerical models: in both cases, the average pore pressure calculated in the zones of the grid increases in the horizontal direction and decreases in the vertical direction, as expected.
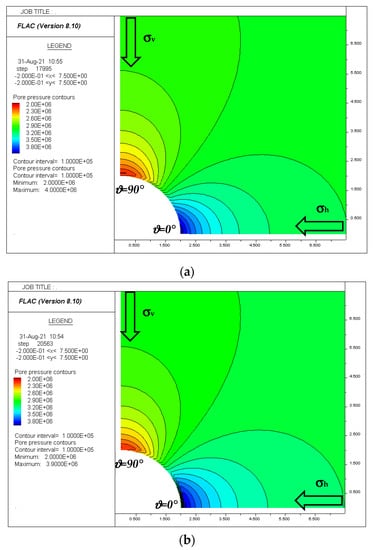
Figure 8.
Numerical simulations of the undrained condition carried out with FLAC, when Δu ≠ 0. Input data: Po = 0, K = 0.7, z ≈ 300 m,σv = 7 MPa, σh = 5 MPa S = 16 MPa, uini = 3 MPa Eu = 10 GPa νu = 0.33, mt = 11.6 σc = 36.6 MPa σt = −3.1 MPa: (a) Elastic; (b) Elastoplastic.
Figure 9a shows that the maximum pore pressure (with a positive excess pore pressure) at ϑ = 0° is u ≈ 4 MPa in the elastic case (at r = R). Figure 9b shows the comparison between the trend of the pore pressures in the elastic and elastoplastic field at 30 cm from the wall. The occurrence of plasticity and the stress redistribution determine a pore pressure u ≈ 3.2 MPa at r = R. The maximum pore pressure in the elastoplastic case is u ≈ 3.9 MPa and occurs at r = 2.15 m. The averaged pore pressure in 15 cm (2.00 ≤ r ≤ 2.15 m) is u = 3.55 MPa. The pore pressure at a radial distance r ≥ 2.20 m coincides with the elastic and elastoplastic solutions and the effect of the excavation on pore pressure disappears from a radial distance r ≥ 12.5 m. On the other hand, the pore pressure, at ϑ = 90° and r = R, is u = 2.2 MPa in both cases (negative excess pore pressure), because plasticity does not occur.
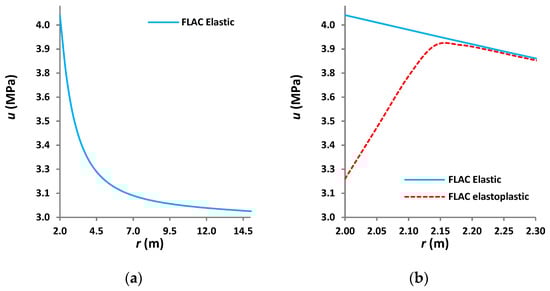
Figure 9.
Numerical simulations of the undrained condition carried out with FLAC at ϑ = 0° The initial pore pressure is uini = 3 MPa (a) Trend of the pore pressure in the elastic field versus radial distance r. (b) Comparison between the pore pressures calculated in the elastic and elastoplastic field.
A comparison between these pore pressures calculated with FLAC and ulim is shown in Figure 7b. At ϑ = 0° the total pore pressure is the averaged u = 3.55 MPa. The figure shows that in the azimuth range ϑ = 0°–45°, there is the occurrence of the limit condition in Case 3A. In Case 2A, plasticity does not occur, and ulim is always above uundrained.
Figure 10 shows the hydro-mechanical response of the rock at r ≥ R calculated with FLAC: the occurrence of the tension zone (red) around the tunnel and tensile failure (yellow symbols) when Δu = 0 and Δu ≠ 0. Figure 10a refers to Δu = 0 and shows that tensile failure occurs from ϑ = 0° to ϑ = 90°, in agreement with the analytical results (Figure 7b), and a thin plastic zone is generated. The tension zone is more extended in the vertical direction (ϑ = 90°). Figure 10b refers to Δu ≠ 0 and shows that the tension zone is more extended in the horizontal direction and the generation of a plastic zone from ϑ = 0° to ϑ = 45°, with a thickness of about 15 cm at ϑ = 0°.
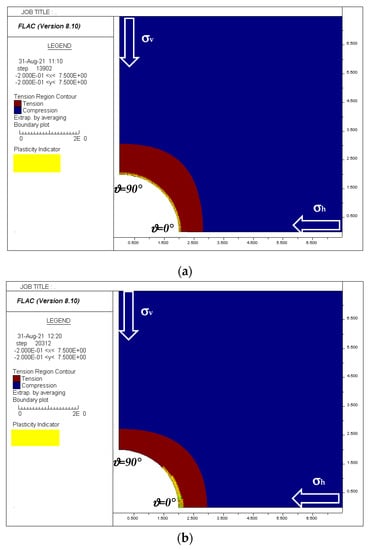
Figure 10.
Undrained condition simulated with FLAC in Case 3A; (a) Tension zone (red) and tensile failure (yellow) calculated with Δu = 0. The occurrence of tensile failure is obtained with uini = 3.2 MPa, because of the numerical finite difference procedure. (b) Tension zone (red) and tensile failure (yellow) calculated with Δu ≠ 0 (pore pressure shown in Figure 8b).
Figure 11 shows the trend of the radial effective stresses with the radial distance r ≥ R at different azimuths, when Δu = 0 and Δu ≠ 0, calculated with FLAC. The numerical simulations indicate that, in both undrained conditions, the thickness of the tension zone varies from 0.80 m to 1 m. Figure 11a shows that the worst situation is at ϑ = 90° when Δu = 0, because the total radial stress increases slowly at this azimuth. A similar worst situation occurs at ϑ = 0°, when Δu ≠ 0 (Figure 11b) because in this case the total radial stress increases more than in the previous case, but a positive excess pore pressure is generated.
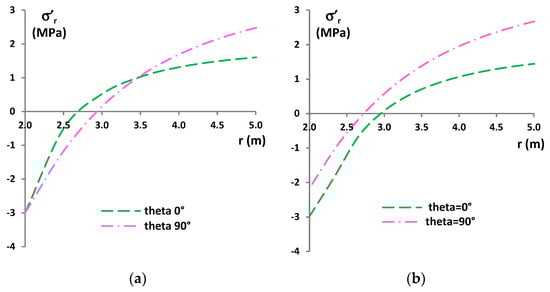
Figure 11.
Undrained condition simulated with FLAC in Case 3A. Trend of the effective radial stress with radial distance r. (a) Δu = 0; (b) Δu ≠ 0 (pore pressure shown in Figure 8b).
The thickness of the plastic zone in both cases is not wide, but the occurrence of a tension zone of thickness 0.8 ÷ 1 m is not negligible. A small variation of rock parameters, far field stresses, and pore pressure can result in an increase in the thickness of the plastic zone. As discussed in Section 3, a probabilistic analysis can define different scenarios of the tunnel instability and can help to avoid problems during the excavation.
5. Conclusions
The paper analyzed the occurrence of undrained conditions in moderately weak brittle rock during tunnel excavation. This condition can result in a tension zone around the tunnel. A limit condition of pore pressure based on the Hoek and Brown criterion is proposed. The limit pore pressure is a function of the strength parameters of the rock and far field stresses. Sensitivity analyses, by varying the depth of the tunnel (induced state of stress around the tunnel), m, and the uniaxial compressive strength, have defined the influence of each parameter on the magnitude of the limit pore pressure. The results are summarized in the following:
- The limit pore pressure decreases with the depth of the tunnel. This result indicates that, with moderately weak rocks and geostatic stresses, failure in the tension zone is more probable at large depths;
- The limit pore pressure is inversely proportional to the rock parameter m. This fact indicates that an appropriate data fitting of triaxial tests is necessary, by selecting the adequate confinement range and predicting a reliable uniaxial tensile strength.
- The influence of the uniaxial compressive strength on the limit pore pressure is combined with the magnitude of the induced state of stress around the tunnel. Furthermore, when the uniaxial compressive strength is close to the induced state of stress, the effect of m reduces.
Finally, the results of numerical models indicated that the tension zone is not just at the boundary of the excavation, but can affect a depth of about 1 m. Due to uncertainties in the field stresses, hydro-mechanical behavior, and rock properties, this tension zone must be carefully investigated, in order to avoid instability problems during tunnel excavation.
Funding
This research received no external funding.
Institutional Review Board Statement
Not applicable.
Informed Consent Statement
Not applicable.
Conflicts of Interest
The authors declare no conflict of interest.
References
- Marinos, V.I.I.I.; Marinos, P.; Hoek, E. The geological strength index: Applications and limitations. Bull. Eng. Geol. Environ. 2005, 64, 55–65. [Google Scholar] [CrossRef]
- Martin, C.D. Seventeenth Canadian geotechnical colloquium: The effect of cohesion loss and stress path on brittle rock strength. Can. Geotech. J. 1997, 34, 698–725. [Google Scholar] [CrossRef]
- Martin, C.D.; Kaiser, P.K.; McCreath, D.R. Hoek-Brown parameters for predicting the depth of brittle failure around tunnels. Can. Geotech. J. 1999, 36, 136–151. [Google Scholar] [CrossRef]
- Hajiabdolmajid, V.; Kaiser, P.K.; Martin, C.D. Modelling brittle failure of rock. Int. J. Rock Mech. Min. Sci. 2002, 39, 731–741. [Google Scholar] [CrossRef]
- Diederichs, M.S.; Kaiser, P.K.; Eberhardt, E. Damage initiation and propagation in hard rock during tunnelling and the influence of near-face stress rotation. Int. J. Rock Mech. Min. Sci. 2004, 41, 785–812. [Google Scholar] [CrossRef]
- Cai, M.; Kaiser, P.K.; Tasaka, Y.; Maejima, T.; Morioka, H.; Minami, M. Generalized crack initiation and crack damage stress thresholds of brittle rock masses near underground excavations. Int. J. Rock Mech. Min. Sci. 2004, 41, 833–847. [Google Scholar] [CrossRef]
- Martin, C.D.; Christiansson, R. Estimating the potential for spalling around a deep nuclear waste repository in crystalline rock. Int. J. Rock Mech. Min. Sci. 2009, 46, 219–228. [Google Scholar] [CrossRef]
- Hoek, E.; Martin, C.D. Fracture initiation and propagation in intact rock—A review. J. Rock Mech. Geotech. Eng. 2014, 6, 287–300. [Google Scholar] [CrossRef]
- Hoek, E.; Marinos, P. Predicting tunnel squeezing problems in weak heterogeneous rock masses. Tunn. Tunn. Int. 2000, 32, 45–51. [Google Scholar]
- Hoek, E. Big tunnels in bad rock. J. Geotech. Geoenviron. Eng. 2001, 127, 726–740. [Google Scholar] [CrossRef]
- Hoek, E.; Marinos, P.G.; Marinos, V.P. Characterisation and engineering properties of tectonically undisturbed but lithologically varied sedimentary rock masses. Int. J. Rock Mech. Min. Sci. 2005, 42, 277–285. [Google Scholar] [CrossRef]
- Marinos, P.; Hoek, E. Estimating the geotechnical properties of heterogeneous rock masses such as flysch. Bull. Eng. Geol. Environ. 2001, 60, 85–92. [Google Scholar] [CrossRef]
- Iasiello, C.; Torralbo, J.C.G.; Fernández, C.T. Large deformations in deep tunnels excavated in weak rocks: Study on Y-Basque high-speed railway tunnels in northern Spain. Undergr. Space 2021, in press. [Google Scholar] [CrossRef]
- Jeng, F.S.; Weng, M.C.; Huang, T.H.; Lin, M.L. Deformational characteristics of weak sandstone and impact to tunnel deformation. Tunn. Undergr. Space Technol. 2002, 17, 263–274. [Google Scholar] [CrossRef]
- Wang, X.; Iura, T.; Jiang, Y.; Wang, Z.; Liu, R. Deformation and mechanical characteristics of tunneling in squeezing ground: A case study of the west section of the Tawarazaka Tunnel in Japan. Tunn. Undergr. Space Technol. 2021, 109, 103697. [Google Scholar] [CrossRef]
- Zhu, Y.; Chen, L.; Zhang, H.; Zhou, Z.; Chen, S. Physical and mechanical characteristics of soft rock tunnel and the effect of excavation on supporting structure. Appl. Sci. 2019, 9, 1517. [Google Scholar] [CrossRef]
- Bewick, R.P.; Kaiser, P.K. Influence of rock mass anisotropy on tunnel stability. In Proceedings of the 3rd CANUS Rock Mechanics Symposium, ROCKENG09, Toronto, ON, Canada, 9–15 May 2009. [Google Scholar]
- Deangeli, C.; Cardu, M.; Martinelli, D. Analysis of the Stability of Openings Excavated in Anisotropic Rocks. Lecture Notes in Civil Engineering 126. In Proceedings of the International Conference of the International Association for Computer Methods and Advances in Geomechanics, Turin, Italy, 5–8 May 2021; Springer: Cham, Switzerland, 2021; pp. 361–368. [Google Scholar]
- Wang, T.T.; Huang, T.H. Anisotropic deformation of a circular tunnel excavated in a rock mass containing sets of ubiquitous joints: Theory analysis and numerical modeling. Rock Mech. Rock Eng. 2014, 47, 643–657. [Google Scholar] [CrossRef]
- Wang, S.Y.; Sloan, S.W.; Tang, C.A.; Zhu, W.C. Numerical simulation of the failure mechanism of circular tunnels in transversely isotropic rock masses. Tunn. Undergr. Space Technol. 2012, 32, 231–244. [Google Scholar] [CrossRef]
- Deangeli, C.; Omwanghe, O.O. Prediction of Mud Pressures for the Stability of Wellbores Drilled in Transversely Isotropic Rocks. Energies 2018, 11, 1944. [Google Scholar] [CrossRef]
- Parkash, D.; Deangeli, C. Wellbore Stability Analysis in Anisotropic Shale Formations. In Proceedings of the SPE/PAPG Pakistan Section Annual Technical Symposium and Exhibition, Society of Petroleum Engineers PATS 2019-201183-MS-SPE, 1–10, Islamabad, Pakistan, 18–20 November 2019. [Google Scholar]
- Sebbeh-Newton, S.; Ayawah, P.E.; Azure, J.W.; Kaba, A.G.; Ahmad, F.; Zainol, Z.; Zabidi, H. Towards TBM automation: On-the-fly characterization and classification of ground conditions ahead of a TBM using data-driven approach. Appl. Sci. 2021, 11, 1060. [Google Scholar] [CrossRef]
- Cai, M.; Kaiser, P. Visualization of rock mass classification systems. Geotech. Geol. Eng. 2006, 24, 1089–1102. [Google Scholar] [CrossRef]
- Abbas, S.M.; Konietzky, H. Rock mass classification systems. Introd. Geomech. 2017, 9, 1–48. [Google Scholar]
- Brady, B.; Brown, E. Rock Mechanics for Underground Mining; Kluwer Academic Publishers: Dorrecht, The Netherlands; Boston, MA, USA; London, UK, 2004. [Google Scholar]
- Hoek, E.; Brown, E.T. Empirical strength criterion for rock masses. J. Geotech. Eng. Div. 1980, 106, 1013–1035. [Google Scholar] [CrossRef]
- Kovári, K.; Staus, J. Basic considerations on tunnelling in squeezing ground. Rock Mech. Rock Eng. 1996, 29, 203–210. [Google Scholar] [CrossRef]
- Kovári, K. Tunneling in squeezing rock (Tunnelbau in druckhaftem Gebirge). Tunnel 1998, 5, 12–31. [Google Scholar]
- Vogelhuber, M.; Anagnostou, G.; Kovari, K. Pore water pressure and seepage flow effects in squeezing ground. In Proceedings of the X Ciclo di Conferenze di Meccanica e Ingegneria delle Rocce sulla Caratterizzazione degli Ammassi Rocciosi nella Progettazione Geotecnica, Torino, Italy, 24–25 November 2004; pp. 495–509. [Google Scholar]
- Graziani, A.; Boldini, D. Remarks on axisymmetric modeling of deep tunnels in argillaceous formations: I: Plastic clays. Tunn. Undergr. Space Technol. 2012, 28, 70–79. [Google Scholar] [CrossRef]
- Kavvadas, M.; Hewison, L.R.; Laskaratos, P.G.; Seferoglou, C.; Michalis, I. Experiences from the construction of the Athens Metro. In Proceedings of the International Symposium on Geotechnical Aspects of Underground Construction in Soft Ground, London, UK, 15–17 April 1996; pp. 1–7. [Google Scholar]
- Anagnostou, G.; Kovári, K. Tunnelling through geological fault zones. In Proceedings of the International Symposium on Design, Construction and Operation of Long Tunnels, Taipei, Taiwan, 7–10 November 2005. ETH-Zürich. [Google Scholar]
- Ramoni, M.; Anagnostou, G. The effect of consolidation on TBM shield loading in water-bearing squeezing ground. Rock Mech. Rock Eng. 2011, 44, 63–83. [Google Scholar] [CrossRef][Green Version]
- Zhao, C.; Zhang, Z.; Lei, Q. Role of hydro-mechanical coupling in excavation-induced damage propagation, fracture deformation and microseismicity evolution in naturally fractured rocks. Eng. Geol. 2021, 289, 106169. [Google Scholar] [CrossRef]
- Eberhardt, E. The Hoek–Brown failure criterion. Rock Mech. Rock Eng. 2012, 45, 981–988. [Google Scholar] [CrossRef]
- Priest, S.D. Determination of shear strength and three-dimensional yield strength for the Hoek-Brown criterion. Rock Mech. Rock Eng. 2005, 38, 299–327. [Google Scholar] [CrossRef]
- Hoek, E.; Brown, E.T. The Hoek–Brown failure criterion and GSI–2018 edition. J. Rock Mech. Geotech. Eng. 2019, 11, 445–463. [Google Scholar] [CrossRef]
- Fairhurst, C. On the validity of the ‘Brazilian’test for brittle materials. Int. J. Rock Mech. Min. Sci. Geomech. Abstr. 1964, 1, 535–546. [Google Scholar] [CrossRef]
- Carter, B.J.; Duncan, E.S.; Lajtai, E.Z. Fitting strength criteria to intact rock. Geotech. Geol. Eng. 1991, 9, 73–81. [Google Scholar] [CrossRef]
- Cai, M. Practical estimates of tensile strength and Hoek–Brown strength parameter mi of brittle rocks. Rock Mech. Rock Eng. 2010, 43, 167–184. [Google Scholar] [CrossRef]
- Bésuelle, P.; Desrues, J.; Raynaud, S. Experimental characterisation of the localisation phenomenon inside a Vosges sandstone in a triaxial cell. Int. J. Rock Mech. Min. Sci. 2000, 37, 1223–1237. [Google Scholar] [CrossRef]
- Charlez, P.A. Rock Mechanics; Petroleum Applications; Éditions Technip: Paris, France, 1997; Volume 2. [Google Scholar]
- Detournay, E.; Cheng, A.H.-D. Poroelastic response of a borehole in a non-hydrostatic stress field. Int. J. Rock Mech. Min. Sci. Geomech. Abstr. 1988, 25, 171–182. [Google Scholar] [CrossRef]
- Fjaer, E.; Holt, R.M.; Raaen, A.M.; Horsrud, P. Petroleum Related Rock Mechanics, 2nd ed.; Elsevier: Amsterdam, The Netherlands, 2008. [Google Scholar]
- Cai, M. Rock mass characterization and rock property variability considerations for tunnel and cavern design. Rock Mech. Rock Eng. 2011, 44, 379–399. [Google Scholar] [CrossRef]
- Ji, J.; Zhang, Z.; Wu, Z.; Xia, J.; Wu, Y.; Lü, Q. An efficient probabilistic design approach for tunnel face stability by inverse reliability analysis. Geosci. Front. 2021, 12, 101210. [Google Scholar] [CrossRef]
- Fattahi, H.; Varmazyari, Z.; Babanouri, N. Feasibility of Monte Carlo simulation for predicting deformation modulus of rock mass. Tunn. Undergr. Space Technol. 2019, 89, 151–156. [Google Scholar] [CrossRef]
- Lü, Q.; Xiao, Z.P.; Ji, J.; Zheng, J. Reliability based design optimization for a rock tunnel support system with multiple failure modes using response surface method. Tunn. Undergr. Space Technol. 2017, 70, 1–10. [Google Scholar] [CrossRef]
- Martini, C.D.; Read, R.S.; Martino, J.B. Observations of brittle failure around a circular test tunnel. Int. J. Rock Mech. Min. Sci. 1997, 34, 1065–1073. [Google Scholar] [CrossRef]
Publisher’s Note: MDPI stays neutral with regard to jurisdictional claims in published maps and institutional affiliations. |
© 2021 by the author. Licensee MDPI, Basel, Switzerland. This article is an open access article distributed under the terms and conditions of the Creative Commons Attribution (CC BY) license (https://creativecommons.org/licenses/by/4.0/).