Article

Fabrication of Circadian Light Meter with Non-Periodic Optical Filters to Evaluate the Non-Visual Effects of Light on Humans

1
Department of Chemistry, Kookmin University, Seoul 02707, Korea
2
School of Electrical Engineering, Kookmin University, Seoul 02707, Korea
3
Circadian ICT Research Center, Kookmin University, Seoul 02707, Korea
*
Authors to whom correspondence should be addressed.
These authors equally contributed to this manuscript.
Appl. Sci. 2021, 11(18), 8283; https://doi.org/10.3390/app11188283
Submission received: 6 June 2021 / Revised: 8 August 2021 / Accepted: 3 September 2021 / Published: 7 September 2021
(This article belongs to the Special Issue Advances in Human-Centric Lighting)

Abstract

:
Given that light is known to function as a zeitgeber, having the greatest influence on the human circadian rhythm, it is necessary to assess the effects of light on humans with the goal of maintaining the circadian rhythm. Herein, we fabricated a simple circadian light meter that directly measures the non-visual effects of light using optical filters that mimic the non-visual action spectrum. The fabricated light meter was calibrated and verified through the values obtained from a conventional illuminance spectrophotometer. Furthermore, during 24 h of everyday life, 11 participants wore hats equipped with the developed light meter so that we could investigate the effects of the light environment to which they were exposed to, both indoors and outdoors. For comparison, natural outdoor illumination was also measured with the same light meter. Based on the considerable difference between the light exposure levels during the daytime and nighttime, it is possible that the participant’s melatonin levels would be impacted by the light exposure measured by the light meter. Consequently, based on the light exposure measurements made in this study, the proposed circadian light meter would be a valuable tool for real world circadian lighting studies that require actual light dose to the eyes of the test subjects.

1. Introduction

It can be considered that the wavelength range of sunlight detectable by the human eye has been evolutionarily adapted to distinguish objects from backgrounds, the see sights, to perceive the colors of objects, and intentionally or unintentionally to recognize day and night, thereby allowing humans to survive on Earth. Because human sight has evolved to operate under sunlight, people have attempted to generate light for many millennia to maintain conscious awareness of their surroundings in a dark environment [1,2]. Consequently, a prototype of modern-day electrical lighting was invented approximately 140 years ago. To improve the energy performance and for greater convenience in everyday life, white light-emitting diodes (LEDs) were recently developed as efficient, stable, long-life solid-state lamps [3,4]. With the mass production and supply of low-cost and high-efficiency artificial lighting, our lives are filled with bright light more than ever before; however, more light than we need can cause light pollution, which affects the ecosystem and in turn affects us [5]. Disturbances in the circadian rhythm affect the secretion of endogenous melatonin, thus increasing the likelihood of a sleep disorder, cardiovascular disease, and even cancer [6,7,8]. Therefore, it is necessary to check and track whether the circadian rhythm is disturbed or is likely to be disturbed.
We are already using defined indicators to quantify light brightness, such as the illuminance and luminance indicators. Visual illuminance (VIL), dominated by the photopic spectral luminous efficiency function (V(λ)), can be measured with a simple instrument such as a light meter. However, VIL is only used to express how bright and dark it is [9]. For example, a high-VIL lighting environment can be used to counter visible threats, such as in hazardous machinery operation, and if necessary, illumination simulations can also be performed to optimize the environment [10,11]. Nevertheless, exposure to light with a high VIL value does not mean that the light has more of an impact on our body; other properties such as the spectral power distribution (SPD) of the light must also be considered. Therefore, the use of separately quantified indicators is inevitable to determine if we are being exposed to inappropriate light. In particular, interest in the non-visual effects of light has increased since Brainard et al. [12] and Thapan et al. [13] published that a new type of photoreceptor was related to melatonin suppression. Rea et al. established circadian light (CLA) and continued to refine this concept [14,15]. CLA is affected by all five known photoreceptors and is a two-state model with different curves used, depending on the blue-yellow (b-y) balance. Oh et al. introduced circadian illuminance (CIL), for which the calculation method is similar to that used for VIL [16]. Instead of V(λ), CIL is calculated using a circadian spectral luminous efficiency function (C(λ)) obtained in clinical trials related to human melatonin suppression according to light exposure [12,13]. Lucas et al. proposed α-opic illuminances according to the intrinsically photosensitive retinal ganglion cell (ipRGC)-influenced light (IIL) responses [17]. Ultimately, based on α-opic illuminances, a new standard of the Commission Internationale de l’Eclairage (CIE) was established [18]. According to this standard, all five known photoreceptors can contribute to the IIL responses, and the influence of the photoreceptors on light can be quantified into the α-opic irradiance or the α-opic equivalent daylight illuminance (EDI). In particular, it is expected that this standard will be widely used because non-visual effects have become increasingly important in artificial lighting environments.
The amount of light needed to affect the circadian rhythm should also be monitored as a function of the inter- and intra-daily times to maintain the circadian rhythm of all biological systems and for healthy living. Due to circadian rhythm concerns, measurements of the circadian light intensity using a circadian light meter have been increasingly become important in workplaces, homes, and intensive care units (ICU) during the day and night. In this regard, a light meter developed by Bierman et al. can be used to measure the intensity of non-visual effects [19,20]. This device works on the same principle as a visual light meter by selectively transmitting light based on the spectral response of the human circadian system by Rea et al. [21]. In the present study, we developed a facile circadian light meter by simply combining an optical filter, a photodiode sensor, and an analysis circuit similar to the previously developed hardware. Notably, it was designed to cover a wide illuminance range (0.1 to tens of thousands lx) from a single gain resistor using a log-scale amplifier, and to measure visual and non-visual effects at the same time. The output values were calibrated and verified through values obtained and calculated from a conventional light meter. In addition, intra-daily non-visual effects were measured by monitoring the light that reaches the circadian light meter when installed on the hats of 11 voluntary participants. The measured values can be used to suggest how badly people are affected by artificial lighting during the day and night in terms of the circadian rhythm. In the near future, through the further development and distribution of the circadian light meter, it will likely be essential to maintain healthy lifestyles in line with the daily biological rhythm.

2. Materials and Methods

2.1. Preparation of the Optical Filter

All of the optical filters were designed to be made into a stack of one-dimensional (1D) multilayers on the front and rear of conventional glass substrates with a thickness of 0.145 mm [22,23]. The materials used in the filter design were SiO2, with a low refractive index of 1.46, and TiO2, with a high refractive index of 2.23. All simulations were conducted using the Essential Macleod software. In total, 25, 32, and 29 layers for the photopic filter (V-filter), melanopic action filter (Mel-filter), and circadian filter (C-filter), respectively, were used on the front side of the glass substrates so that light could be transmitted according to V(λ), the melanopic action spectrum (smel(λ)), and the C(λ) curves, respectively. In addition, 41 layers on the rear side of the substrate were introduced to block the infrared (IR) region of the incident light. Meanwhile, a refinement process to remove unwanted baseline ripple-shape transmittance was conducted using the aforementioned software. Based on the simulated and refined results, each layer was deposited using an e-beam evaporator. Ultraviolet (UV)-visible spectroscopy (LAMBDATM 365, PerkinElmer, Inc., Waltham, MA, USA) was used to confirm that the fabricated filters matched the corresponding values of V(λ), smel(λ), and C(λ). The thickness of each layer of the fabricated filters was confirmed by FE-SEM (JSM-7610F, JEOL Ltd., Tokyo, Japan).

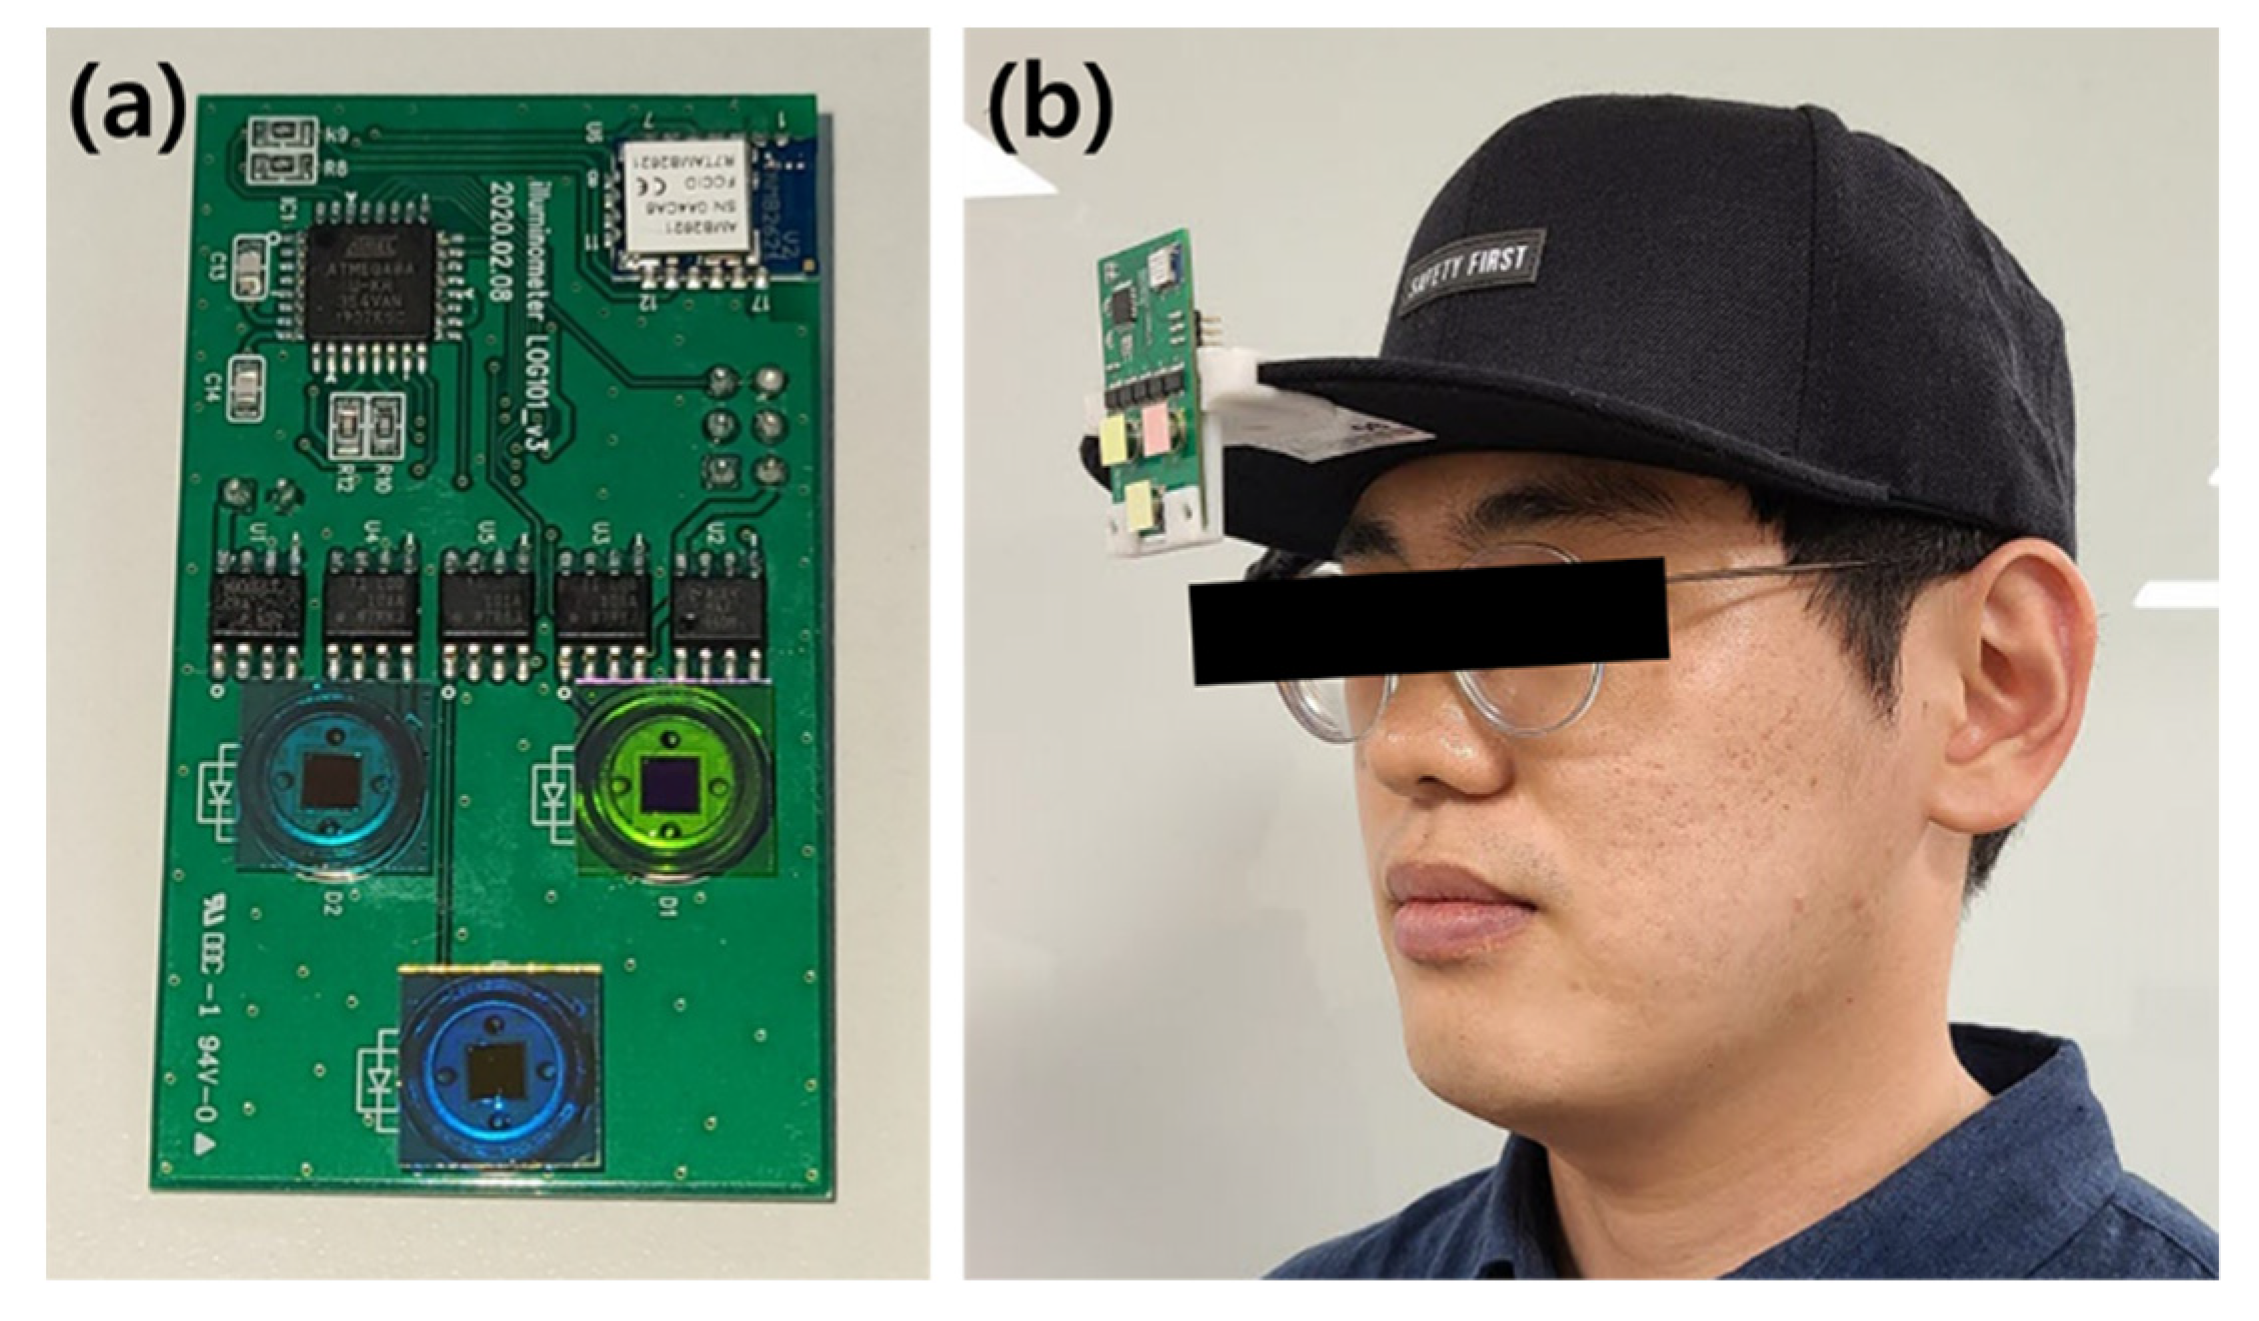
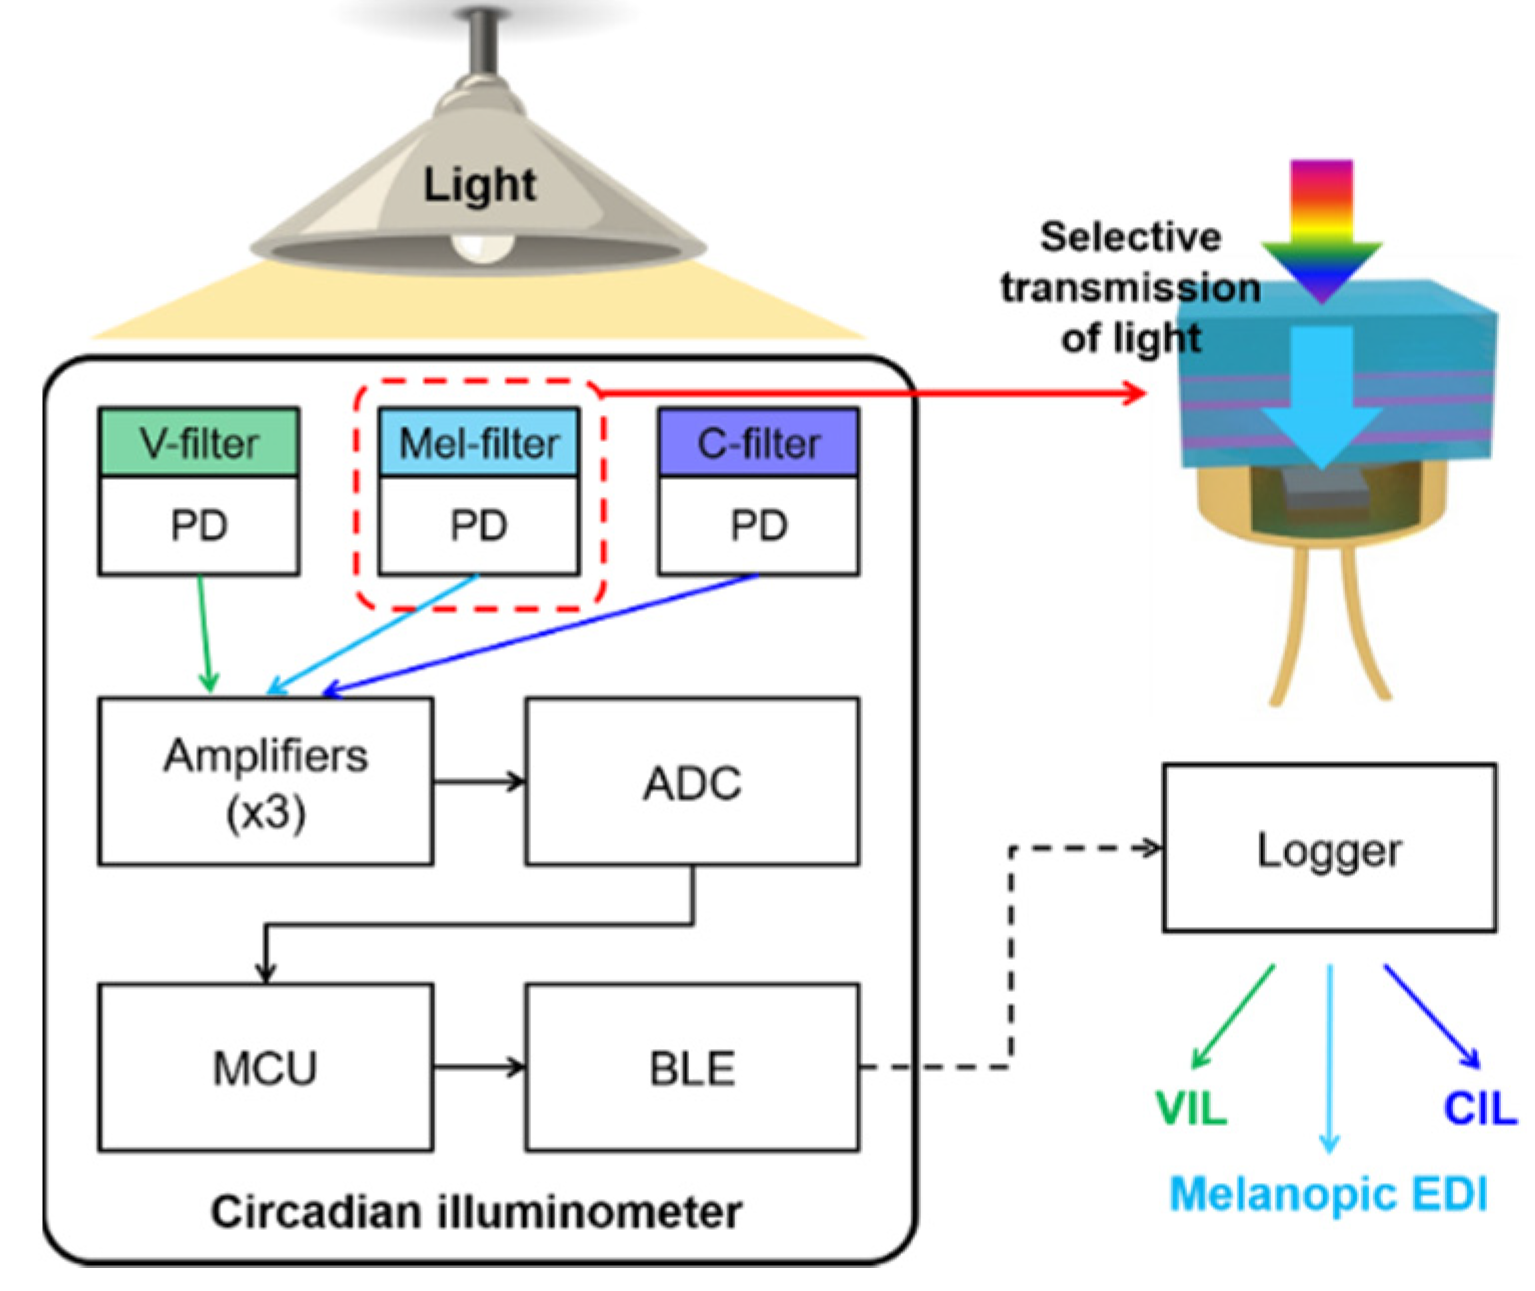
2.2. Fabrication of the Circadian Light Meter

The circadian light meter consists of photodiode as the light receiver, log-ratio amplifier, resistor, and capacitor. The characteristics of the Si-based photodiode (MT03-022, Marktech Optoelectronics, Lantham, NY, USA) used in the circadian light meter can be found in Table S1 and Figure S1 of the Supplementary Materials. The prepared V-, Mel- and C-filters, all 1 × 1 cm2 in size, were attached to the individual photodiodes using the UV-cured resin Norland Optical Adhesive 61 (NOA61, Norland Products Inc., East Windsor, NJ, USA) under UV light for 20 min. A log-ratio amplifier (LOG101, Texas Instruments, Dallas, TX, USA) was used to adjust the log ratio of the input current generated by the photodiodes, which selectively receive light from the filters to the reference current as the output voltage. In addition, a chip resistor of 10 MΩ and a capacitor of 10 nF were used to control the reference current and capacitance, respectively, for compensation. A four-channel, 16-bit sampling analog-to-digital converter (ADC; AD974, Analog Devices Inc., Norwood, MA, USA) was used to acquire the values of the three output voltages generated by the three log-ratio amplifiers. The three types of digitized data generated every second were transmitted to a microcontroller unit (MCU; ATmega8A, Microchip Technology, Chandler, AZ, USA) through the serial interface and were then transmitted through a Bluetooth Low Energy (BLE) module (AMB2621, Würth Elektronik, Waldenburg, Germany) to a smartphone, which is a data logger (Figure 1).

2.3. Evaluation of the Circadian Light Meter

To evaluate the performance of the fabricated circadian light meter, cross checks with a conventional illuminance spectrophotometer (CL-500A, Konica Minolta, Inc., Tokyo, Japan) were conducted under sunlight on the rooftop of the Science Building at Kookmin University in Seoul, Korea (GPS coordinates: Lat. 37°36′42.06″ N, Long. 126°59′56.91″ E). The melanopic EDI and CIL values were calculated using the measured VIL values from the conventional light meter. Briefly, three types of illuminance values were calculated by weighting each corresponding function from the SPD of light obtained from the conventional light meter (VIL is immediately provided by the measuring instrument). The adjusted C(λ) used as a function to calculated CIL is shown in Figure S2 of the Supplementary Materials. The definitions of the metric terms, including each type of illuminance, are summarized in Table S2. Correlations between the voltages generated from the filter/photodiode, measured VIL, and calculated melanopic EDI and CIL values were obtained using an orthogonal distance regression method. In addition, general V(λ) mismatch index (f1’) and directional response index (f2) of the fabricated circadian light meter were verified [24]. The reproducibility of fabricated circadian light meter was verified under a white LED with a correlated-color temperature (CCT) of 6500 K and a halogen lamp environment.

2.4. Measuring the Light Exposure of the Participants

Eleven healthy participants (mean age ± SD: 24.3 ± 1.91 years) were recruited from the students at Kookmin University (Seoul, Korea). To record the light illuminance to which the participants were exposed for 24 h from midnight, the light meter and data logger were delivered to the participants the day before. The participants were unconstrained in terms of behavior and spent the day as usual while wearing the hat with the light meter. The light meter was positioned parallel to the eye line to the greatest extent possible. When it was inevitably necessary for the participants to remove the hat, such as when they were sleeping or showering, the hat was removed and placed nearby. The light meter recorded the VIL, melanopic EDI, and CIL every two seconds and simultaneously measured the level of sunlight using another light meter to compare the illuminance of light exposure over time. To measure sunlight illuminance, the light meter was installed horizontally so as not to face sunlight directly, such as when a person was standing facing south on the rooftop of the Science Building at Kookmin University. This study was conducted from 20 March to 30 April 2020; data analysis was performed by averaging the raw data obtained from the participants and the level of sunlight every hour. Some of the data from four participants were missing due to communication errors. However, there were no problems during other time periods, and all remaining data were used in the data analysis. The study protocol was approved by the Kookmin University Institutional Review Board (KMU-202001-HR-226).

3. Results

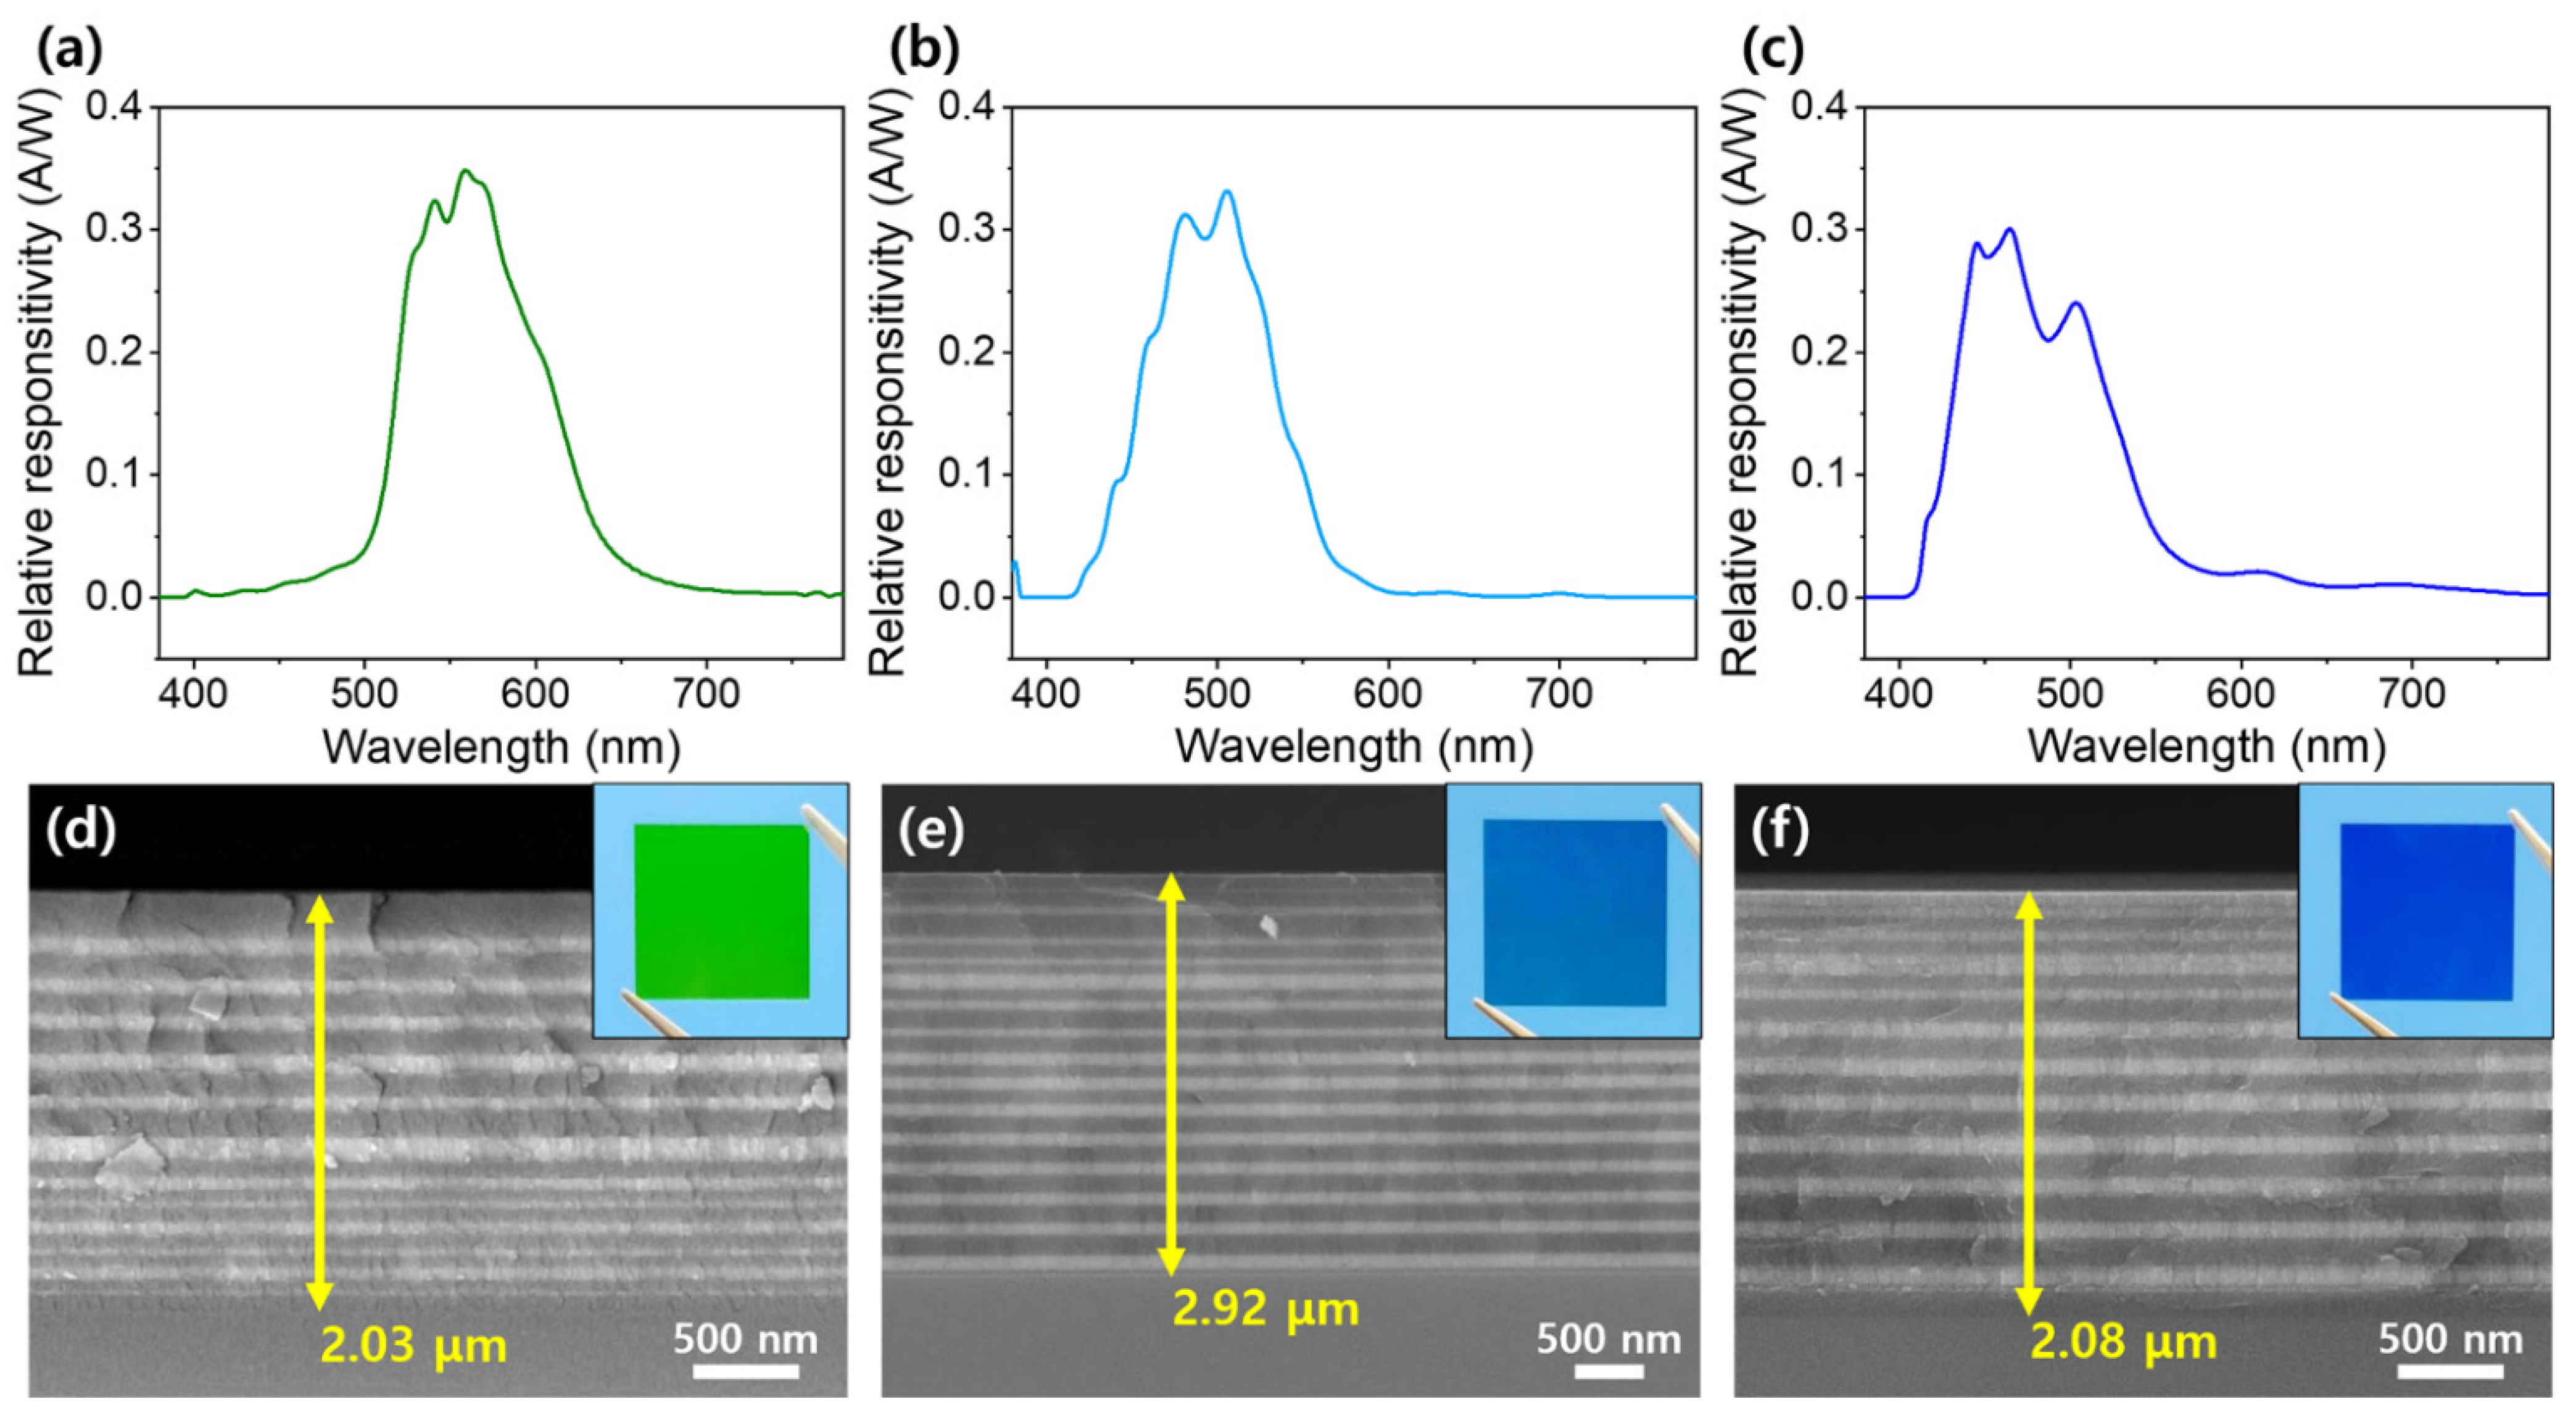
3.1. Optical Filters Capable of Selective Light Transmission

The calculated and actual thicknesses of both the high- and low-index layers of the V-filter (Table S3) and Mel-filter (Table S4) are summarized in Supplementary Materials. In addition to the aforementioned filters, thickness information of another filter, called a C-filter, produced based on published physiological results, is also summarized in Table S5. Although C(λ), newly expressed as multiple Gaussian functions, is non-standard, it was introduced to allow a simple comparison with smel(λ) (Figure S2). In an identical process, a multilayer that blocked the IR of the incident light on the rear side of the substrate was also introduced; these data are summarized in Table S6. Figure S3 shows the transmission spectrum of the filter that was completely manufactured by mimicking one of the actual action spectra, in this case, V(λ), smel(λ), and C(λ). In the transmission spectrum, a high transmittance level (>84%) of the action spectra was observed at the peak wavelengths. Figure 2a–c show the responsivity of the photodiode to which the fabricated filter is attached. The Si-based photodiode used as the light receiver has a peak sensitivity wavelength of 950 nm, but the responsivity of photodiode can be tuned to mimic the desired action spectrum by optical filters that can selectively transmit light. We also analyzed the morphologies of the manufactured films through FE-SEM. As shown in Figure 2d–f, the cross-sectional views of backscattered electron (BSE) FE-SEM images indicated that the measured stacking orders and thicknesses of all filters nearly matched the calculated values of the alternating SiO2 and TiO2 films. Actual BSE images were used to confirm that the basic structures of the V-, Mel-, and C-filters consisted of 25, 32, and 29 layers of the nano-multilayered film, respectively. Likewise, the BSE images of the rear sides of the filters also clearly verified that the structure of the IR-cut layer consisted of 41 layers of film (Figure S4). The insets in Figure 2d–f confirm that the manufactured optical filters show the blue and green colors of the transmitted images, as expected for the action spectrum.

3.2. Verification and Reproducibility of the Circadian Light Meter

Through the ADC in the circadian light meter, the amplified voltage is converted into a digital electrical signal, which is transmitted to a data logger (a smartphone was used in this study), via the BLE module. To convert the voltage of the amplifier into the corresponding illuminance value, we established a conversion equation by matching the VIL, melanopic EDI, and CIL values obtained by the conventional light meter from the level of intra-daily sunlight exposure. Figure S5 shows the relationship between the actual illuminance and the amplified voltage from each photodiode. All fittings were performed using an orthogonal distance regression method to minimize the error between the actual illuminance and the illuminance estimated from the voltage by the circadian light meter. The voltage generated by the light incident on the photodiode took the form of the logarithmic function because a logarithmic amplifier was used. The circadian light meter used the fitted formula of the inverse function (exponential function) to express the illuminance levels according to voltage. In this process, because the lower measurement limit of the VIL of the conventional light meter was 0.1 lx, any illuminance that was captured by the light meter and had a value below 0.1 lx was treated as 0.1 lx. The dynamic range of the system designed using a single gain resistor is very wide, from approximately 0.1 to 50,000 lx.
Instruments designed and used for optical radiation measurements have several specific parameters [24]. The f1′ of the V-filter attached photodiode was 13.1% (Figure 2). However, the f1′ values for the Mel- and C-filter attached photodiode were 166.3% and 176.8%, respectively, it is natural that a greatly large error occurs because the f1′ value is calculated using V(λ); the f1′ values of the melanopic EDI and CIL channels calculated using their corresponding action spectrum rather than V(λ) are 19.5% and 25.3%, respectively. In addition, because the three types of filters used in this study are interference filters, the greatest effect can be seen only when light passes through the filter perpendicularly. In other words, the interference filters can have unintended consequences in off-axis irradiance [22]. As shown in Figure 3, it can be seen that the relative amplitude of the off-axis irradiance is lower than the cosine distribution. The f2 of VIL, melanopic EDI, and CIL measurement channels were 24.4%, 22.2%, and 25.9%, respectively.
To evaluate the reproducibility of the circadian light meter, we used a conventional white LED with a CCT of 6500 K and a halogen lamp. Table 1 summarizes the illuminance values obtained by ten iterations of the circadian light meter and conventional illuminance spectrophotometer (CL-500A). When repeatedly measuring the white LED with a CCT of 6500 K using the conventional light meter and the proposed light meter, the measured VILs (mean ± SD) were 985.2 ± 0.7 lx and 983.5 ± 2.8 lx, respectively. Meanwhile, the average VIL values, measured repeatedly, of the halogen lamp were 113.7 ± 0.5 lx (conventional light meter) and 122.0 ± 0.6 lx (circadian light meter). The melanopic EDI and CIL values measured with our circadian light meter were 19.9 ± 0.3 lx and 20.7 ± 0.3 lx, respectively, which are not very different from the melanopic EDI (17.6 ± 0.3 lx) and CIL values (19.1 ± 0.3 lx) calculated from the VIL and SPD of light measured with the conventional illuminance spectrophotometer. Especially in the halogen lamp environment, the melanopic EDI and CIL values are much lower than the VIL value because there is very little blue light in the SPD of the lighting (Figure S6).

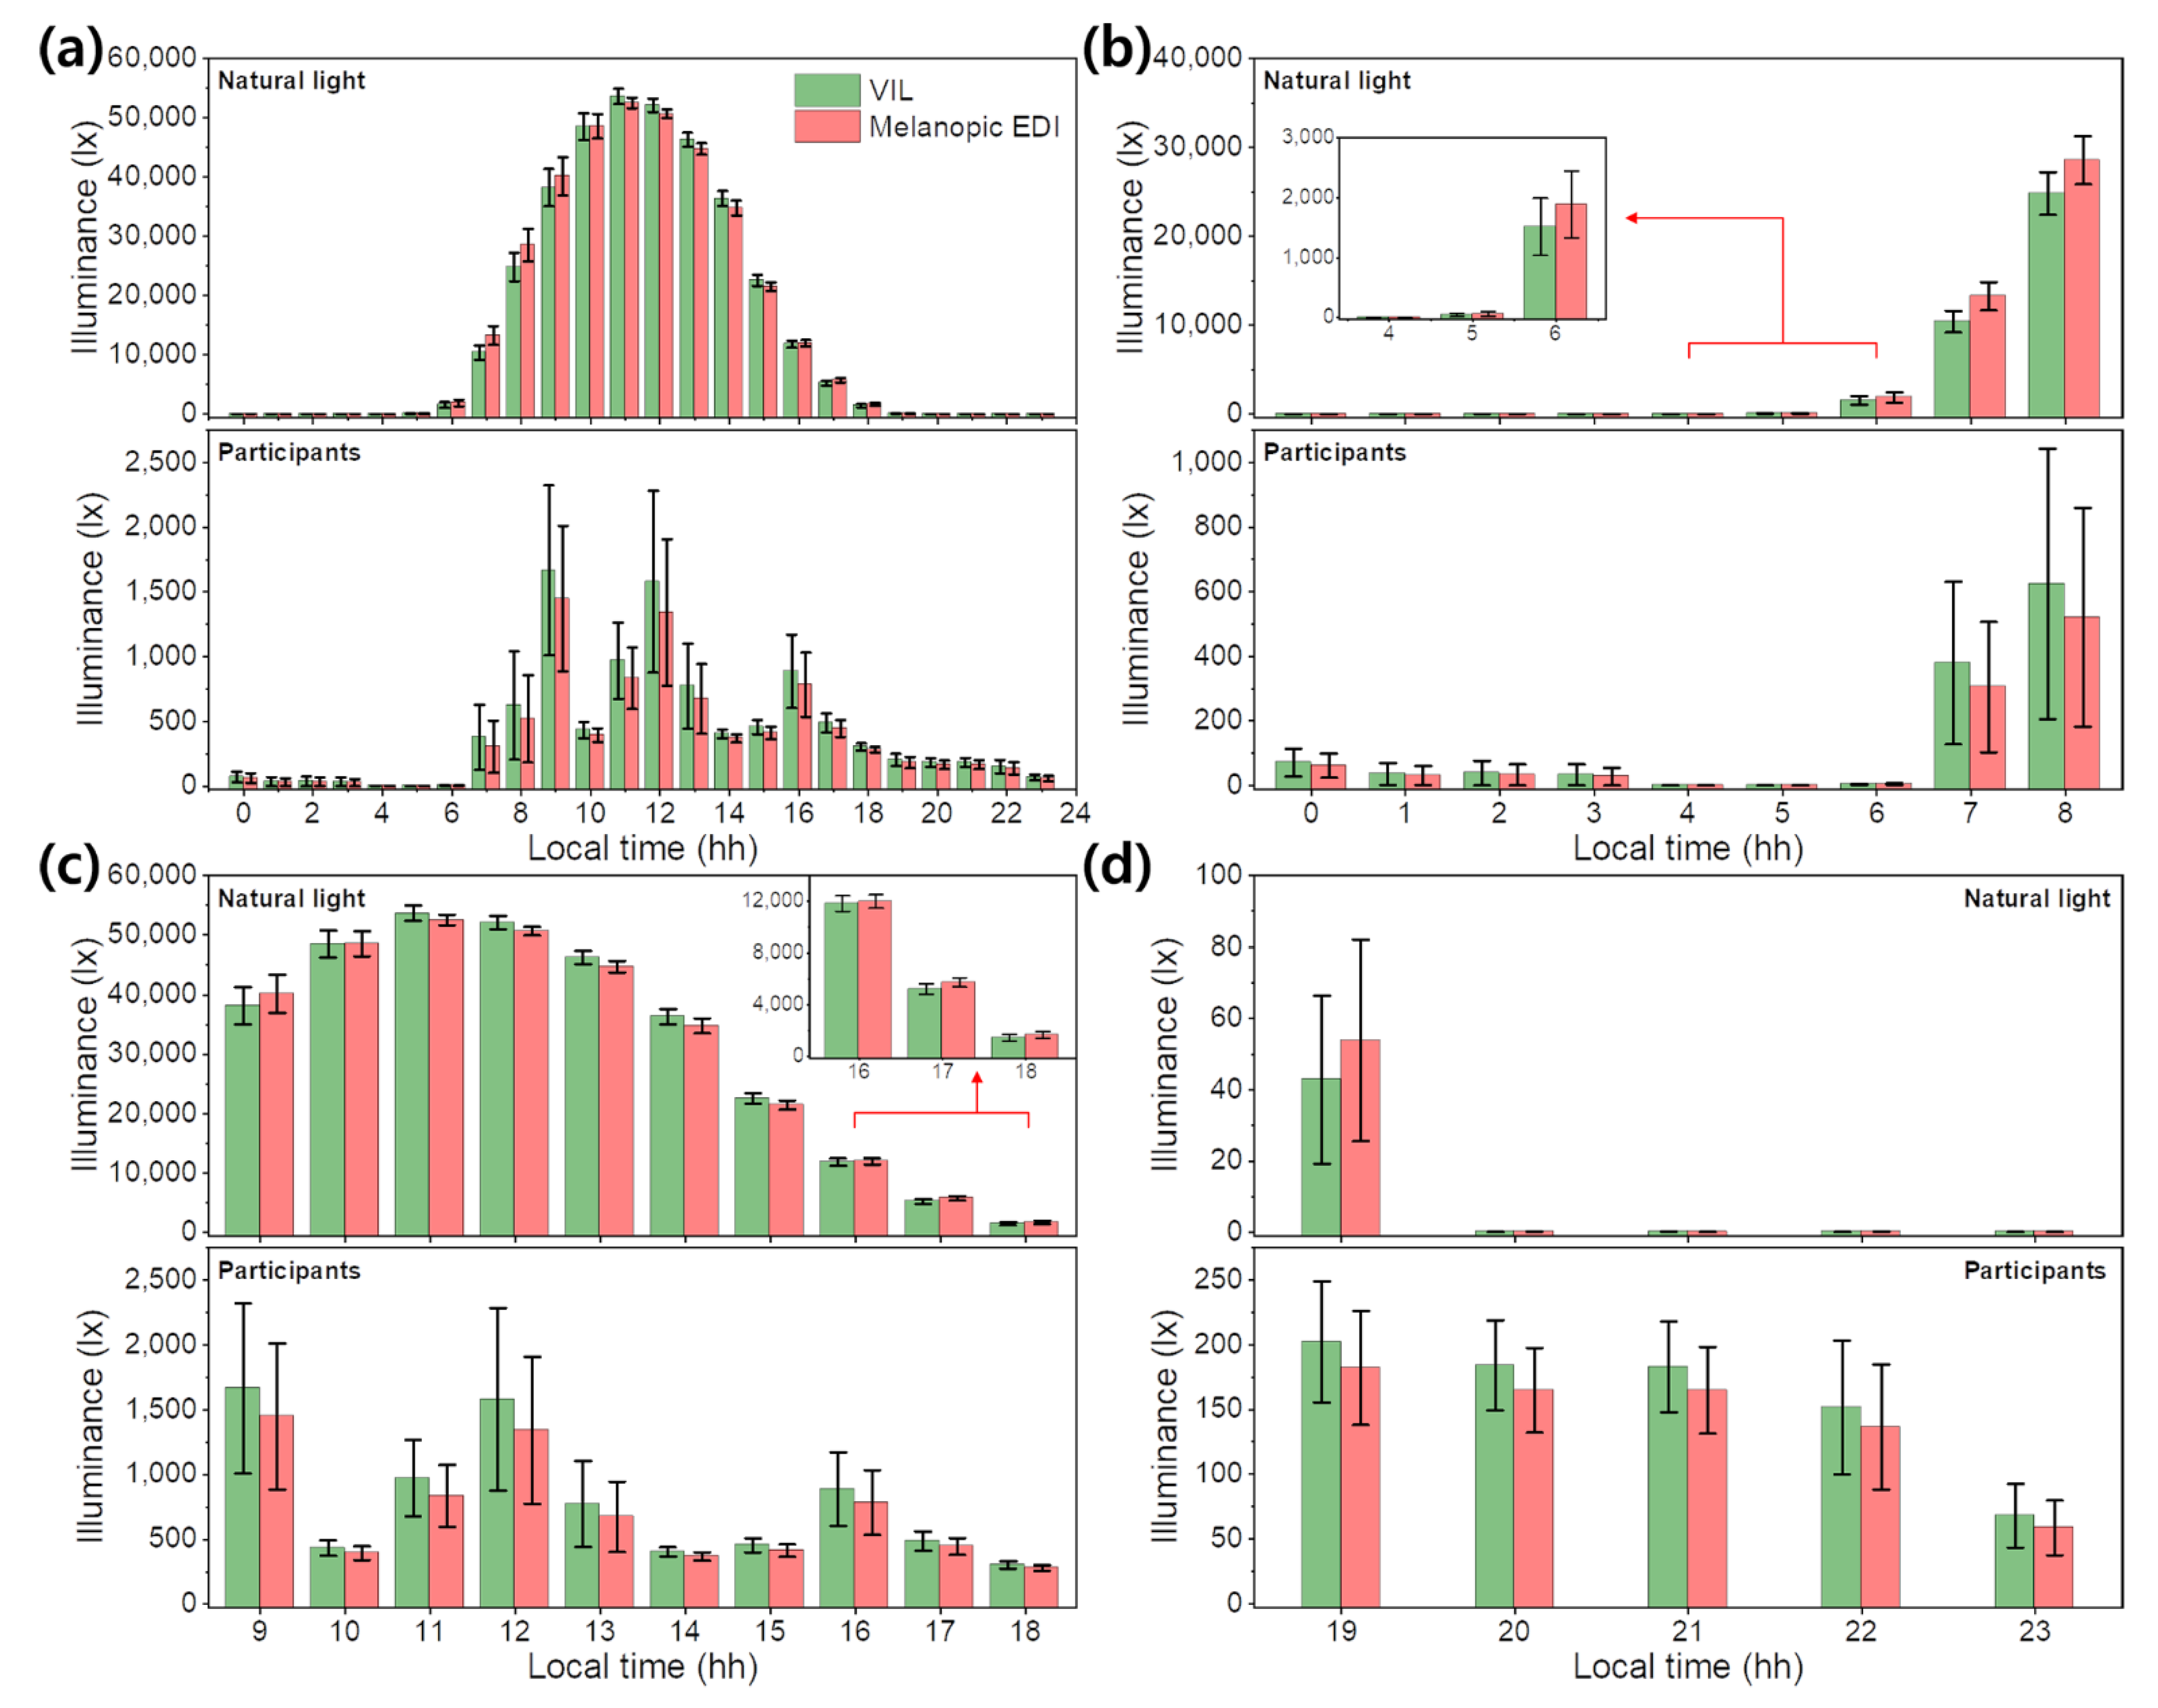
3.3. Analyzing Illuminance Levels to Which the Participants Were Exposed

Figure 4 shows photographs of the fabricated circadian light meter. To analyze the illuminance to which participants were exposed, the circadian light meter was fixed to the visor of their hats through a fixture printed by a 3D printer. The weights of the fixture and the circadian light meter were 12 g and 17 g, respectively, and they were not bothersome to the participants while wearing the hat. Figure 5 shows the results of the intra-daily light exposure of the participants and sunlight measurements for the corresponding time, both obtained using the developed circadian light meter. Figure S7 also shows the melanopic irradiance corresponding to the melanopic EDI in Figure 5. Outdoor measurements of sunlight exposure were conducted on the rooftop of a five-story building. It is possible to measure tens of thousands of lx of sunlight during the daytime, and it is feasible to measure an exceedingly low VIL of ~0.1 lx at night. Although the proposed circadian light meter was able to measure the VIL, melanopic EDI, and CIL simultaneously, the non-standard CIL was excluded from the analysis because human factors research on the slight difference between the melanopic EDI and CIL were not conducted. The maximum VIL and melanopic EDI values during outdoor measurements were 53,609 ± 1280 lx and 52,511 ± 888 lx, respectively. However, the VIL and melanopic EDI values derived from the participants were 1580 ± 702 lx and 1342 ± 567 lx on average at noon, respectively. The participants were exposed to light with an average VIL of 158 lx and melanopic EDI of 141 lx after sunset (nighttime; 19:00–23:00). Even at midnight, they were also exposed to light with an average VIL of 70 lx and melanopic EDI of 61 lx. The ratio between the melanopic EDI and VIL of natural light and the light the participants were exposed to over time is shown in Figure S8 of the Supplementary Materials.

4. Discussion

To design the optical structure of the V-, Mel-, and C-filters, we adjusted certain structural parameters, in this case the refractive index difference, thickness, number, and stacking order of the high- and low-index film. As expected, the full width at half maximum (FWHM) of the passing region of the optical filters was closely related to the difference between the refractive indices of the stacked film structures [22,23]. Although there are some small mismatched transmission spectra between the simulated and fabricated filters, it is acceptable to use a fabricated filter separately attached to the photodiodes because the percentage spectral mismatches of the V-, Mel-, and C-filters were 7.27%, 7.67%, and 7.74%, respectively [25]. Consequently, illuminance values can be measured directly from the photocurrent generated by the photodiodes, and the output values of the photodiodes are proportional to the intensity of the incident light. Instead of using complex calculations to determine the non-visual effects values, the circadian light meter was designed to allow direct measurements of non-visual effects values when using appropriate optical filters, just as ordinary light meters measure VIL values. This concept can be extended to measure and respond to melanopic EDI and other α-opic EDI values of light.
The proposed circadian light meter was fabricated by combining three types of filter-attached photodiodes as light sensors, amplifying units, and other electronic components. Each sensor operates as an independent channel, and to generate a photocurrent, each photodiode accepts only the light derived from a specific region on the attached filter. In particular, the log-ratio amplifier was introduced to identify more sensitively the illuminance within the range of interest at the level of indoor lighting and to use it even at outdoor lighting levels of tens of thousands of lx. The relationships between the voltage-dependent illuminance of each light sensor established by the orthogonal distance regression method appears to form a single curve well; however, a slight mismatch between the measured value and the fitted curve can be seen in the 1.8–2.0 V range, which is considered to be affected by the natural light illuminance at sunrise and sunset times. Meanwhile, the relatively high f1′ and f2 clearly need improvement. According to DIN 5043 standard, the maximum tolerance of the f1′ for a class C instrument is 9.0% [26]. However, although this condition is not satisfied, many devices for the purpose of circadian rhythm studies have been developed and commercialized. For example, the light meter, developed by the Light Research Center, contains a red-green-blue solid-state photosensor package, and the f1′ value of the photosensor is 25% [20]. In addition, the Actiwatch 2 (Philips Healthcare, Best, Netherlands), a commercial tool for recording the VIL and activity, has a relatively high f1′ value of 62% [25]. Although the proposed circadian light meter does not satisfy the class C grade, it is expected to be of sufficient value as a circadian research tool like the other cases mentioned above. To decrease f1′, it will be necessary to reduce the error resulting from the difference between the simulated and fabricated optical filter, and to continuously provide refractive index feedback for the materials used (SiO2 and TiO2). In addition, a separate diffuse lens system can be introduced above the optical filter to reduce f2 [24]. In terms of reproducibility, the repeatedly measured values of the circadian light meter are slightly different from those of commercially available products, but not at a level that is highly recognizable. Therefore, with small measurement deviations, the melanopic EDI and CIL values can be determined immediately without complicated calculations.
Nevertheless, the CIL values were not included in the intra-daily analysis using the fabricated circadian light meter. As shown in Figure 2, the filters for melanopic EDI and CIL were prepared to mimic their action spectrum, but it was not clear whether the spectral resolution of the filters could properly discriminate the difference between the melanopic EDI and CIL. Similarly, as summarized in Table 1, there were small differences between the melanopic EDI and CIL under the identical lighting environment, but their effects on the human body were not verified. Meanwhile, the intra-daily illuminance according to the time of exposure of the participants tended to differ from that of natural light. This difference occurs because the sleep onset time of the participants was 00:48 ± 01:08, and they mostly spent their personal time indoors, typically in their homes, until they fell asleep. In addition, their wake-up time was 08:51 ± 00:51, but the VIL increased before that time as sunlight affected the room after sunrise. This trend is also confirmed in the melanopic EDI value because that illuminance is proportional to VIL under a light environment with an equivalent SPD. Furthermore, the melanopic irradiance expressed as a radiometric quantity show the identical trend as the melanopic EDI. Participants were free to move as they wished outdoors; however, they were exposed to very low levels of light compared to the level of sunlight. In other words, during the daytime, the participants spent most of their time indoors, and so their melatonin levels may therefore be significantly upregulated, which can lead to increased subjective sleepiness or decreased attention, even when their rooms were sufficiently bright [27,28].
Here, it is important to note that after sunset, the participants were exposed to artificial lighting that was hundreds of times brighter than natural light. Specifically, the participants were exposed to artificial lighting thousands of times brighter than the natural light illuminance at midnight. In fact, participants were exposed to light at midnight with average VIL and melanopic EDI values of 70 lx and 61 lx, respectively, which may have suppressed their melatonin levels, resulting in poor sleep or affecting their circadian rhythms [29,30]. This trend is natural because the average activity time of a person has increased due to artificial lighting, even at night and without sunlight, ever since artificial lighting was invented. Furthermore, we mostly have at least one display device, such as a personal computer, a laptop, or a smartphone, and we can use them whenever desired, even at night. A survey from the National Sleep Foundation found that 90% of Americans report using their devices an hour before falling asleep [31]. General white artificial lighting sources, such as fluorescent lamps that do not allow changes in the CCT or brightness, can disturb human circadian rhythms by the blue light contained in them. In particular, blue light is known to suppress melatonin at nighttime, and thus night workers may see an increased incidence of melatonin-related diseases, such as insomnia, depression, breast cancer, and even heart disease [6,32,33].
We checked the VIL values and non-visual effects of light exposed to participants using a designed circadian light meter. However, there are several limitations to this study: first, the circadian light meter was fixed to a hat and placed in front of the eyes in this case. Hence, the light entering the eyes is partially obscured, and the participants may have been exposed to less light than was actually present. The second limitation is that the light received by the circadian light meter does not reflect the movements of the eyeballs of the participants. In other words, if the participant looks at the surroundings rather than looking forward, there may be a difference between the illuminance measured by the circadian light meter and the actual illuminance because the light meter is installed on the hat and not on the lens of the eye. Another limitation is that the actual lens transmittance according to the age of the participants was not taken into account. The mean age of participants was 24.3 ± 1.91 years, and it was estimated that the blue region transmittance of their lenses is higher than that of the blue region defined in the standard (32-years-old). In other words, the melanopic EDI values obtained from the participants may have been underestimated. Nevertheless, the circadian light meter can be used simply as a tool to evaluate the current lighting environment and how it affects our circadian rhythm. An inappropriate lighting environment interferes with melatonin secretion and suppression, increasing the possibility of a disruption of the circadian rhythm [34,35,36]. However, it can be assumed that many people, including the participants here, have fairly normal and regular lives, even when exposed to insufficient light during the daytime and to overflowing light at night. During the 100 years since artificial lighting was invented, we may have adapted to cope with artificial lighting instead of natural light. Although further research is needed, we believe that the illuminances of light to which an individual is exposed can easily be checked with the simple circadian light meter as needed, which may help its users maintain a normal circadian rhythm.

5. Conclusions

In this study, we fabricated a simple circadian light meter that can simultaneously measure visual effects (VIL) and non-visual effects (melanopic EDI and CIL) of light using optical filters that selectively transmit light. The circadian light meter was verified and calibrated in a natural light environment with a wide illuminance range. Finally, the light environment to which the participants were exposed was recorded for 24 h and compared with a natural light environment. The conclusions are as follows:
  • To directly measure the three types of illuminance values, optical filters that mimic the corresponding functions were simulated and fabricated. The percentage spectral mismatches of the V-, Mel-, and C-filters were 7.27%, 7.67%, and 7.74%, respectively. Because the transmittance spectra of the optical filters mimic the respective action spectrum, an identical method can be applied to measure other types of illuminance not mentioned in this study.
  • The circadian light meter was manufactured using a simple circuit with a single gain resistor and a log-scale amplifier, and can measure illuminance over a wide range from approximately 0.1 to 50,000 lx. However, the f1′ of the VIL measurement channel recorded 13.1%. In particular, the f2 of the VIL, melanopic EDI, and CIL channel were 24.4%, 22.2%, and 25.9%, respectively, so further improvement of off-axis irradiance is required.
  • The measured melanopic EDI and CIL values differed only slightly depending on the optical filter used. While a non-standard CIL was used in this study to allow a simple comparison with the CIE standard melanopic EDI, but it was not clear whether the spectral resolution of the filters used could distinguish the difference between the two illuminances. In other words, the circadian light meter can be further simplified and miniaturized to measure only the melanopic EDI.
  • Using the circadian light meter, it was quantitatively confirmed that the participants lived in a light environment with very low illuminance levels compared to natural light during the daytime: the maximum VIL and melanopic EDI values of natural light were 53,609 ± 1280 lx and 52,511 ± 888 lx, respectively, while those values of the light exposed to the participants were 1580 ± 702 lx and 1342 ± 567 lx, respectively. These considerable differences have the potential to disturb the circadian rhythm.
  • Although additional tightly controlled clinical and physiological studies on the non-visual effects of light and circadian rhythm are necessary, nevertheless, the circadian light meter has a potential to be a useful tool to enhance and maintain an individual’s circadian rhythm. In addition, if the circadian light meter is commercialized at a reasonable price, it may be valuable in large-scale field studies considering the individual’s sensitivity to blue light and its effects on melatonin levels and changes.

Supplementary Materials

The following are available online at https://www.mdpi.com/article/10.3390/app11188283/s1, Table S1: Electrical and optical characteristics of photodiode, Figure S1: Photodiode dimensions and responsivity, Figure S2: Optimized circadian spectral luminous efficiency function, Table S2: Formulas for calculating visual, melanopic, and circadian metric values, Table S3: Simulated and actual thicknesses of photopic filter, Table S4: Simulated and actual thicknesses of melanopic filter, Table S5: Simulated and actual thicknesses of circadian filter, Table S6: Simulated and actual thicknesses of IR-blocking filter, Figure S3: Optical characteristic of the fabricated filters, Figure S4: Optical characteristic of the rear side IR cut filter, Figure S5: Relationship between the voltage generated by the filter-attached photodiode and the illuminance, Figure S6: Normalized irradiance of white LED with CCT of 6500 K and halogen lamp, Figure S7: Melanopic irradiance of the natural and light exposure of participant, Figure S8: Intra-daily melanopic daylight efficacy ratio of light.

Author Contributions

Conceptualization, Y.J.E., S.K., S.M.L. and Y.R.D.; methodology, Y.J.E. and S.K.; software, S.K.; validation, Y.J.E. and K.N.L.; formal analysis, C.K.; investigation, S.K.; writing—original draft preparation, Y.J.E. and S.K.; writing—review and editing, D.H.K., C.K., S.M.L. and Y.R.D.; visualization, K.N.L.; supervision, S.M.L. and Y.R.D.; project administration, D.H.K., C.K., S.M.L. and Y.R.D. All authors have read and agreed to the published version of the manuscript.

Funding

This work was supported by the National Research Foundation of Korea (NRF) grant funded by the Korea government (MSIT) (no. 2016R1A5A1012966 and 2019M3C7A1032579).

Institutional Review Board Statement

The study was conducted according to the guidelines of the Declaration of Helsinki, and approved by the Kookmin University Institutional Review Board (KMU-202001-HR-226 and 18 February 2020).

Informed Consent Statement

Informed consent was obtained from all subjects involved in the study.

Data Availability Statement

The data presented in this study are available upon request from the corresponding author.

Conflicts of Interest

The authors declare no conflict of interest.

References

  1. Roorda, A.; Williams, D.R. The arrangement of the three cone classes in the living human eye. Nature 1999, 397, 520–522. [Google Scholar] [CrossRef]
  2. Macros, S.; Moreno, E.; Navarro, R. The depth-of-field of the human eye from objective and subjective measurements. Vis. Res. 1999, 39, 2039–2049. [Google Scholar]
  3. Nakamura, S.; Senoh, N.; Iwasa, N.; Nagahama, S. High-brightness InGaN blue, green and yellow light-emitting diodes with quantum well structure. Jpn. Appl. Phys. 1995, 34, L797–L799. [Google Scholar] [CrossRef]
  4. Weisbuch, C.; Piccardo, M.; Martinelli, L.; Iveland, J.; Peretti, J.; Speck, J.S. The efficiency challenge of nitride light-emitting diodes for lighting. Phys. Status Solidi A 2015, 212, 899–913. [Google Scholar] [CrossRef]
  5. Longcore, T.; Rich, C. Ecological light pollution. Front. Ecol. Environ. 2004, 2, 191–198. [Google Scholar] [CrossRef]
  6. Scheer, F.A.; Czeisler, C.A. Melatonin, sleep, and circadian rhythms. Sleep Med. Rev. 2005, 9, 5–9. [Google Scholar] [CrossRef] [PubMed]
  7. Khan, S.; Malik, B.H.; Gupta, D.; Rutkofsky, I. The role of circadian misalignment due to insomnia, lack of sleep, and shift work in increasing the risk of cardiac diseases: A systematic review. Cureus 2020, 12, e6616. [Google Scholar] [CrossRef] [Green Version]
  8. Stevens, R.G. Circadian disruption and breast cancer. Epidemiology 2005, 16, 254–258. [Google Scholar] [CrossRef]
  9. Dai, Q.; Cai, W.; Shi, W.; Hao, L.; Wei, M. A proposed lighting-design space: Circadian effect versus visual illuminance. Build. Environ. 2017, 122, 287–293. [Google Scholar] [CrossRef]
  10. Dupláková, D.; Flimel, M.; Duplák, J.; Hatala, M.; Radchenko, S. Ergonomic rationalization of lighting in the working environment. Part I.: Proposal of rationalization algorithm for lighting redesign. Int. J. Ind. Ergon. 2019, 71, 92–102. [Google Scholar] [CrossRef]
  11. Dupláková, D.; Hatala, M.; Duplák, J.; Knapčíková, L.; Radchenko, S. Illumination simulation of working environment during the testing of cutting materials durability. Ain Shams Eng. J. 2019, 10, 161–169. [Google Scholar] [CrossRef]
  12. Brainard, G.C.; Hanifin, J.P.; Greeson, J.M.; Byrne, B.; Glickman, G.; Gerner, E.; Rollag, M.D. Action spectrum for melatonin regulation in humans: Evidence for a novel circadian photoreceptor. J. Neurosci. 2001, 21, 6405–6412. [Google Scholar] [CrossRef] [Green Version]
  13. Thapan, K.; Arendt, J.; Skene, D.J. An action spectrum for melatonin suppression: Evidence for a novel non-rod, non-cone photoreceptor system in humans. J. Physiol. 2001, 535, 261–267. [Google Scholar] [CrossRef]
  14. Rea, M.S.; Figueiro, M.G.; Bierman, A.; Hamner, R. Modelling the spectral sensitivity of the human circadian system. Lighting Res. Technol. 2012, 44, 386–396. [Google Scholar] [CrossRef]
  15. Rea, M.S.; Nagare, R.; Figueiro, M.G. Modeling circadian phototransduction: Quantitative predictions of psychophysical data. Front. Neurosci. 2021, 15, 44. [Google Scholar] [CrossRef]
  16. Oh, J.H.; Yang, S.J.; Do, Y.R. Healthy, natural, efficient and tunable lighting: Four-package white LEDs for optimizing the circadian effect, color quality and vision performance. Light Sci. Appl. 2014, 3, e141. [Google Scholar] [CrossRef]
  17. Lucas, R.J.; Peirson, S.N.; Berson, D.M.; Brown, T.M.; Cooper, H.M.; Czeisler, C.A.; Figueiro, M.G.; Gamlin, P.D.; Lockley, S.W.; O’Hagan, J.B.; et al. Measuring and using light in the melanopsin age. Trends Neurosci. 2014, 37, 1–9. [Google Scholar] [CrossRef] [PubMed]
  18. CIE S 026/E:2018. CIE System for Metrology of Optical Radiation for ipRGC-Influenced Responses to Light; CIE: Vienna, Austria, 2018. [Google Scholar]
  19. Bierman, A.; Klein, T.R.; Rea, M.S. The Daysimeter: A device for measuring optical radiation as a stimulus for the human circadian system. Meas. Sci. Technol. 2005, 16, 2292–2299. [Google Scholar] [CrossRef]
  20. Figueiro, M.G.; Hamner, R.; Bierman, A.; Rea, M.S. Comparisons of three practical field devices used to measure personal light exposures and activity levels. Lighting Res. Technol. 2013, 45, 421–434. [Google Scholar] [CrossRef]
  21. Rea, M.S.; Bullough, J.D.; Figueiro, M.G. Phototransduction of human melatonin suppression. J. Pineal Res. 2003, 32, 209–213. [Google Scholar] [CrossRef] [PubMed]
  22. Yoo, G.R.; Azmi, R.; Kim, C.; Kim, W.; Min, B.K.; Jang, S.Y.; Do, Y.R. Stable and colorful perovskite solar cells using a nonperiodic SiO2/TiO2 multi-nanolayer filter. ACS Nano 2019, 13, 10129–10139. [Google Scholar] [CrossRef]
  23. Lee, S.; Yoo, G.Y.; Kim, B.; Kim, M.K.; Kim, C.; Park, S.Y.; Yoon, C.H.; Kim, W.; Min, B.K.; Do, Y.R. RGB-colored Cu(In,Ga)(S,Se)2 thin-film solar cells with minimal efficiency loss using narrow-bandwidth stopband nano-multilayered filters. ACS Appl. Mater. Interfaces 2019, 11, 9994–10003. [Google Scholar] [CrossRef]
  24. ISO/CIE 19476:2014. Characterization of the Performance of Illuminance Meters and Luminance Meters; ISO/CIE: Vienna, Austria, 2014. [Google Scholar]
  25. Price, L.L.A.; Lyachev, A.; Khazova, M. Optical performance characterization of light-logging actigraphy dosimeters. J. Opt. Soc. Am. A 2017, 34, 545–557. [Google Scholar] [CrossRef]
  26. DIN 5032-7. Photometry-Part 8: Classification of Illuminance Meters and Luminance Meters; DIN: Berlin, Germany, 2016. [Google Scholar]
  27. Lockley, S.W.; Evans, E.E.; Scheer, F.A.J.L.; Brainard, G.C.; Czeisler, C.A.; Aeschbach, D. Short-wavelength sensitivity for the direct effects of light on alertness, vigilance, and the waking electroencephalogram in humans. Sleep 2006, 29, 161–168. [Google Scholar] [PubMed]
  28. Gabel, V.; Maire, M.; Reichert, C.F.; Chellappa, S.L.; Schmidt, C.; Hommes, V.; Viola, A.U.; Cajochen, C. Effects of artificial dawn and morning blue light on daytime cognitive performance, well-being, cortisol and melatonin levels. Chronobiol. Int. 2013, 30, 988–997. [Google Scholar] [CrossRef] [Green Version]
  29. Garfinkel, D.; Laudon, M.; Nof, D.; Zisapel, N. Improvement of sleep quality in elderly people by controlled-release melatonin. Lancet 1995, 346, 541–544. [Google Scholar] [CrossRef]
  30. Redwine, L.; Hauger, R.L.; Gillin, J.C.; Irwin, M. Effects of sleep and sleep deprivation on interleukin-6, growth hormone, cortisol, and melatonin levels in human. J. Clin. Endocrinol. Metab. 2000, 85, 3597–3603. [Google Scholar] [CrossRef]
  31. Gradisar, M.; Wolfson, A.R.; Harvey, A.G.; Hale, L.; Rosenberg, R.; Czeisler, C.A. The sleep and technology use of Americans: Findings from the National Sleep Foundation’s 2011 sleep in America poll. J. Clin. Sleep. Med. 2013, 9, 1291–1299. [Google Scholar] [CrossRef]
  32. Partonen, T. Effects of morning light treatment on subjective sleepiness and mood in winter depression. J. Affect Disord. 1994, 30, 99–108. [Google Scholar] [CrossRef]
  33. Dowling, G.A.; Mastick, J.; Colling, E.; Carter, J.H.; Singer, C.M.; Aminoff, M.J. Melatonin for sleep disturbances in Parkinson’s disease. Sleep Med. 2005, 6, 459–466. [Google Scholar] [CrossRef] [PubMed]
  34. Zeitzer, J.M.; Dijk, D.J.; Kronauer, R.E.; Brown, E.N.; Czeisler, C.A. Sensitivity of the human circadian pacemaker to nocturnal light: Melatonin phase resetting and suppression. J. Physiol. 2000, 526, 695–702. [Google Scholar] [CrossRef] [PubMed]
  35. Lockley, S.W.; Brainard, G.C.; Czeisler, C.A. High sensitivity of the human circadian melatonin rhythm to resetting by short wavelength light. J. Clin. Endocrinol. Metab. 2003, 88, 4502–4505. [Google Scholar] [CrossRef] [PubMed]
  36. Kim, C.; Yoon, H.C.; Kim, D.H.; Do, Y.R. Spectroscopic influence of virtual reality and augmented reality display devices on the human nonvisual characteristics and melatonin suppression response. IEEE Photonics J. 2018, 10, 3900911. [Google Scholar]
Figure 1. Schematic diagram of the circadian light meter to simultaneously measure the visual illuminance (VIL), melanopic equivalent daylight illuminance (EDI), and circadian illuminance (CIL). PD, photodiode; ADC, analog-to-digital converter; MCU, microcontroller unit; BLE, Bluetooth low energy.
Applsci 11 08283 g001
Figure 2. Relative responsivity of the fabricated circadian light meter. (a) VIL measurement channel (V-filter/photodiode), (b) melanopic EDI measurement channel (Mel-filter/photodiode), and (c) CIL measurement channel (C-filter/photodiode). The responsivity of each channel was calculated by weighting the transmittance of each filter to the responsivity of the photodiode. Cross-sectional view FE-SEM image with the backscattered electron detection mode of (d) V-filter, (e) Mel-filter, and (f) C-filter. The light and dark layers of the SEM images are TiO2 and SiO2 layer, respectively. The insets in each SEM image provide the photographs of fabricated the V-, Mel-, and C-filters.
Applsci 11 08283 g002
Figure 3. Spatial sensitivity of each channel of the circadian light meter. (a) V-filter attached photodiode for VIL measurement, (b) Mel-filter attached photodiode for melanopic EDI measurement, and (c) C-filter attached photodiode for CIL measurement.
Applsci 11 08283 g003
Figure 4. (a) Photograph of the fabricated circadian light meter. The circadian light meter consists of three photodiodes with different filters attached (upper left: Mel-filter, upper right: V-filter, and lower: C-filter). (b) Photograph of a participant wearing the hat with the circadian light meter. The circadian light meter was attached to the hat visor through a parts output from a 3D printer.
Applsci 11 08283 g004
Figure 5. Illuminances of the natural light and light exposure of participants (N = 11), measured by the circadian light meter. (a) All 24 h, (b) dawn and morning (00:00–08:00), (c) daytime (09:00–18:00), and (d) nighttime (19:00–23:00) illuminances expressed at hourly intervals. The natural light illuminances were obtained from the roof of a five-story building. The participants acted according to their usual habits without any behavioral restrictions. The illuminance data of the natural light and light exposure of participants were simultaneously obtained from 20 March to 30 April 2020. All data represent mean ± SEM; all legends are identical, as shown in (a).
Applsci 11 08283 g005
Table 1. Illuminance values according to the lighting sources measured ten times repeatedly under equal conditions. All data represent mean ± standard deviation; values in parentheses represent coefficient of variation.
Conventional Light Meter
(CL-500A)
Circadian Light Meter
(This Work)
VIL
(lx)
Melanopic EDI 1
(lx)
CIL 1
(lx)
VIL
(lx)
Melanopic EDI
(lx)
CIL
(lx)
White LED
(6500 K)
985.2 ± 0.7
(0.0007)
847.6 ± 0.6
(0.0007)
880.2 ± 0.6
(0.0007)
983.5 ± 2.8
(0.0029)
841.5 ± 9.1
(0.0109)
874.5 ± 6.7
(0.0077)
Halogen lamp113.7 ± 0.5
(0.0041)
17.6 ± 0.3
(0.0151)
19.1 ± 0.3
(0.0141)
122.0 ± 0.6
(0.0053)
19.9 ± 0.3
(0.0144)
20.7 ± 0.3
(0.0143)
1 Calculated value from the measured VIL and SPD of light.
Publisher’s Note: MDPI stays neutral with regard to jurisdictional claims in published maps and institutional affiliations.

