Article

Mechanics Analysis of Rough Surface Based on Shoulder-Shoulder Contact

1
College of Mechanical and Electronic Engineering, Nanjing Forestry University, Nanjing 210037, China
2
College of Mechanical and Electronic Engineering, Jiangsu Vocational and Technical College of Finance and Economics, Huai’an 223001, China
*
Author to whom correspondence should be addressed.
Appl. Sci. 2021, 11(17), 8048; https://doi.org/10.3390/app11178048
Submission received: 29 July 2021 / Revised: 27 August 2021 / Accepted: 28 August 2021 / Published: 30 August 2021
(This article belongs to the Section Mechanical Engineering)

Abstract

:
Proper methods and models for mechanical analysis of rough surface can improve the theory of surface contact. When the topography parameters of two rough surfaces are similar, the contact should be considered shoulder-shoulder rather than top-top. Based on shoulder-shoulder contact and fractal characteristics, the geometric model for asperity and contact mechanics model for rough surfaces are established, and the deformation of asperity, the real contact area and contact load of sealing surface are discussed. The effects of contact pressure p and topography parameters (fractal dimension D and fractal roughness G) on the variation of porosity and contact area ratio Ar/A0 are achieved. Results show that with the increase of p, larger D and smaller G corresponds to larger initial porosity but faster and larger decrease of porosity; with the increment of D, porosity increases first and then decreases, and smaller G corresponds to larger porosity reduction; as G becomes bigger, porosity increases, and larger D corresponds to larger porosity difference and change. With the addition of p, Ar/A0 increases, and the variation of Ar/A0 is closer to linearity and less at smaller D and larger G; with the increase of D, Ar/A0 increases gradually, and the growth rate is bigger at smaller G and bigger p; as G becomes bigger, Ar/A0 declines, and it declines more gently at smaller D and p. The influence of D on Ar/A0 is greater than that of G. The results can provide the theoretical basis for the design of sealing surfaces and the research of sealing or lubrication technologies of rough surfaces.

1. Introduction

At a microscopic level, the rough surface consists of numerous asperities of different sizes which may be caused by form errors, waviness and roughness. Although the waviness affects the contact of surfaces [1], the influence of surface roughness is more significant for rough machined fractal sealing surfaces. When two contacting surfaces are under load, these asperities will deform, affecting the pressure bearing and sealing performance of the surfaces. Mechanical analysis of rough surface is the main content of surface contact theory, which involves real contact area, contact pressure and the relationship between them. A variety of contact mechanics models were established by predecessors, promoting the continuous development of the surface contact theory.
Hertz studied the contact mechanics of two spherical elastomers without friction and laid the theoretical foundation of modern contact mechanics [2]. Greenwood and Williamson combined the simulated surface with Hertz contact theory and established the GW model [3] based on statistical characterization parameters. Based on GW model, Greenwood [4] and Bush [5] further modified and improved the height distribution, shape and curvature radius of asperities. Assumed that all the asperities are purely plastic deformed, Pullen [6] established the corresponding plastic contact model of rough surfaces. On the principle of constant volume of asperities during plastic deformation, Chang [7] proposed the CEB model to analyze the elastic and plastic contact characteristics of rough surfaces. However, the CEB model did not consider the elastic-plastic deformation, so the results are discontinuous. Zhao et al. re-analyzed the deformation process of asperities under load [8,9] and put forward a contact model including the elastic, elastic-plastic and plastic deformation of asperities. Ciavarella [10], Vakis [11], Tian [12] and Song [13] took the asperity base deformation caused by the asperity deformation into consideration and established various statistical contact models for the interaction of asperities. In addition, many researchers established the loading-unloading contact model [14,15], rough surface contact stiffness model [16,17] and viscoelastic contact model [18,19] to meet various working requirements. Based on the GW statistical model and probability density function of height distribution for asperity, Xiao [20] established the total stiffness model of rough surface contact by considering the contact state of elastic, elastic-plastic and purely plastic deformation. Zhu proposed an unlubricated contact model for random rough surfaces [21] and analyzed the contact between equivalent rough surfaces and rigid planes based on statistical theory. Contact mechanical models of rough surface with statistical characterization were established under the premise that “The contact area is less than the cross-sectional area of the profile opening area”, however, this assumption is not consistent with the principle of volume conservation during deformation. Moreover, the statistical parameters in these models are greatly influenced by the sample length and resolution of the instrument, which is highly scale-dependent and not universal.
Majumdar and Bhushan [22] established the rough surface contact model (M-B model) based on fractal theory for the first time. They deduced the elastic and plastic contact deformation of the single asperity, but they did not consider the elastic-plastic contact problem. Wang and Komvoulos modified the M-B model by considering the effect of the expansion factor of the size distribution domain of the micro contact on the deformation of asperities [23]. Yan and Komvoulos initially put forward a three-dimensional rough surface contact model with fractal characteristics [24] and obtained the total contact load and contact area of the rough surface by derivation. Based on the modified M-B model, Zhu [25], Miao [26] and Tian [27] derived the relationship between the contact area of a single asperity and its normal deformation. Liu [28] thought that the contact area of a single asperity increases with the increment of its normal deformation, and when the contact area is less than the critical contact area the deformation is plastic, otherwise it is elastic, which is consistent with the deformation mechanism of the M-B model. Morag [29] and Liou [30] proposed using the opening size of asperity’s base to express the contour curve. They defined the index n of asperities at different levels to describe the deformation of asperity, and pointed out that under certain contact loads, the high-level asperity will transform to a low level. Huang [31] combined fractal theory with a finite element model to study the contact characteristics of three-dimensional rough surface under thermal-mechanical coupling. By deducing the W-M function in the spherical coordinate system and conducting numerical simulation, Liu [32] obtained the profile of rough spherical surface, established the fractal rough spherical contact model and analyzed the influence of fractal parameters on the relationship between contact load and contact area on rough spherical surface. According to the contact mechanism of spherical surface, Yuan [33] established the contact model of rough spherical surface, derived the analytical expression of real contact area and contact load, and obtained the contact pressure distribution of rough spherical contact area at different deformation stages. In the study of contact mechanics of rough surfaces based on fractal theory, fractal parameters are used to describe rough surfaces, it can overcome the influence of measuring instrument resolution and sampling length. However, the conclusion that “asperity appears plastic, elastic-plastic and elastic deformation in turn” is against reality.
Zhang [34] fully considered the influence of surface roughness and analyzed the contact characteristics of rough surface when establishing the contact model. Wang [35] established a loading–unloading contact analytical model between two cylindrical rough surfaces based on fractal theory and investigated the effect of parameters in the model on the loading–unloading contact performance. In addition, some scholars use the shoulder-shoulder contact model [36,37,38,39] rather than top-top contact model when studying the contact force, contact stiffness and friction heat of two surfaces. However, these models do not have explicit applications for shoulder-shoulder contact, and do not specifically study the fractal machined surface that conforms to the W-M function. Therefore, the research on the contact mechanics for rough surfaces, especially the shoulder-shoulder contact, needs in-depth investigation.
In the present paper, the contact state and porosity of rough sealing surfaces are analyzed; the geometric model for asperity and contact mechanics model for rough surfaces are established; and the deformation of asperity, the real contact area and contact load of rough sealing surfaces are discussed. Based on these, the effects of contact pressure and surface topography parameters (fractal dimension D and fractal roughness G) on the porosity and contact area of sealing surface are studied.

2. Contact Analysis of Rough Surface

2.1. Contact State of Rough Surface

For the research of contacting rough surfaces, the two surfaces are mostly simplified. The smoother surface is usually simplified as a smooth rigid plane, and the contact state of the two surfaces is shown in Figure 1. However, in reality the sealing interface is not completely smooth and there are many asperities on both surfaces, as shown in Figure 2.
The red areas in Figure 1 and Figure 2 represent the total volume of pores and skeletons between the two surfaces, and the skeleton volume can be obtained by function integral. Porosity ϕ is the proportion of pore volume in total volume, subscript r-f is the contact between rough and flat surfaces, and r-r is the contact between two rough surfaces. The porosity in these two cases is as follows:
ϕ r f = V p V 0 = V 0 V s V 0 ,   ϕ r r = V p V 0 = V 0 V s 1 V s 2 V 0
In contact analysis, the object of study is usually a single asperity or a pair of asperities. The surface contact shown in Figure 1 and Figure 2 can be represented by the largest asperity, as shown in Figure 3 and Figure 4.
According to the W-M function of fractal surface and the two different contact states, the initial contact state of two rough surfaces can be simulated by MATLAB (as shown in Figure 5), and then the initial porosity can be obtained to verify which contact state is more practical.

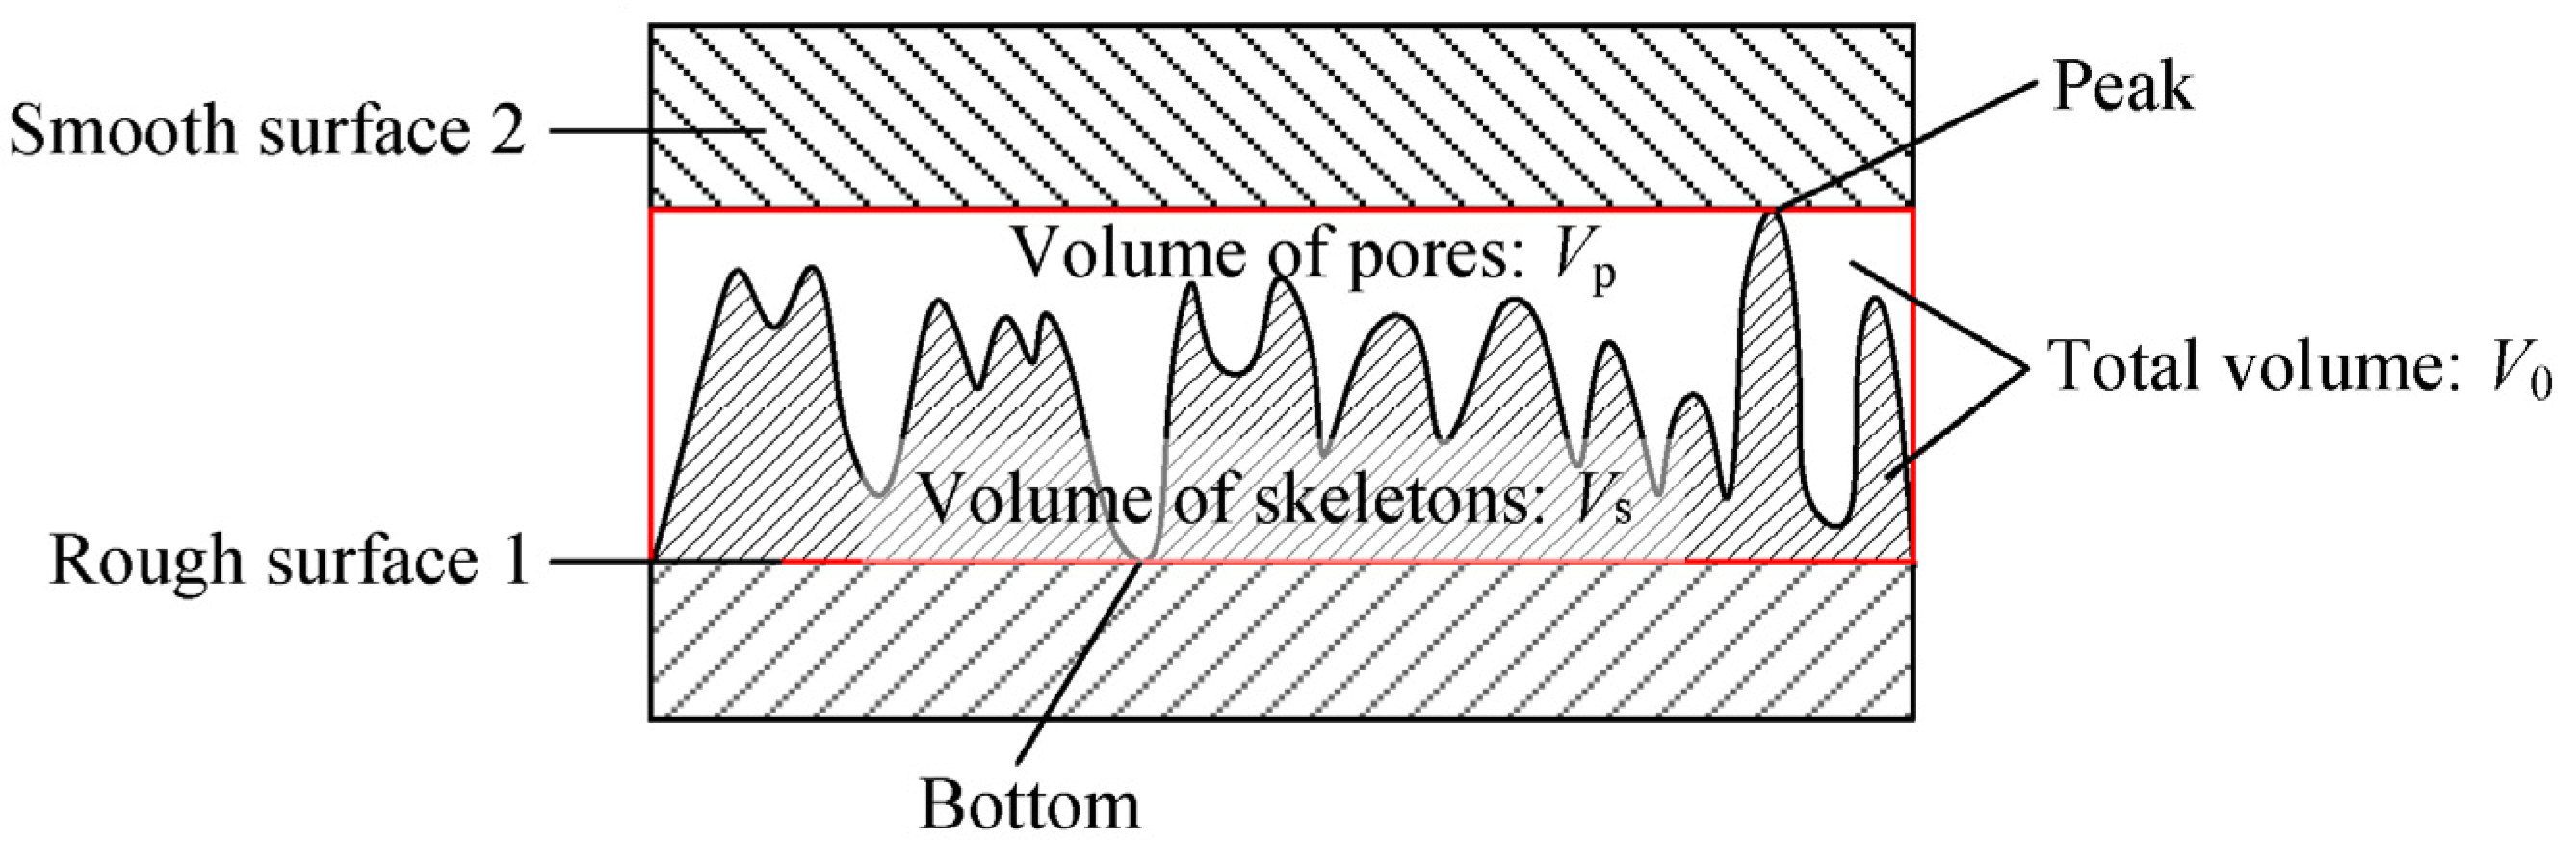
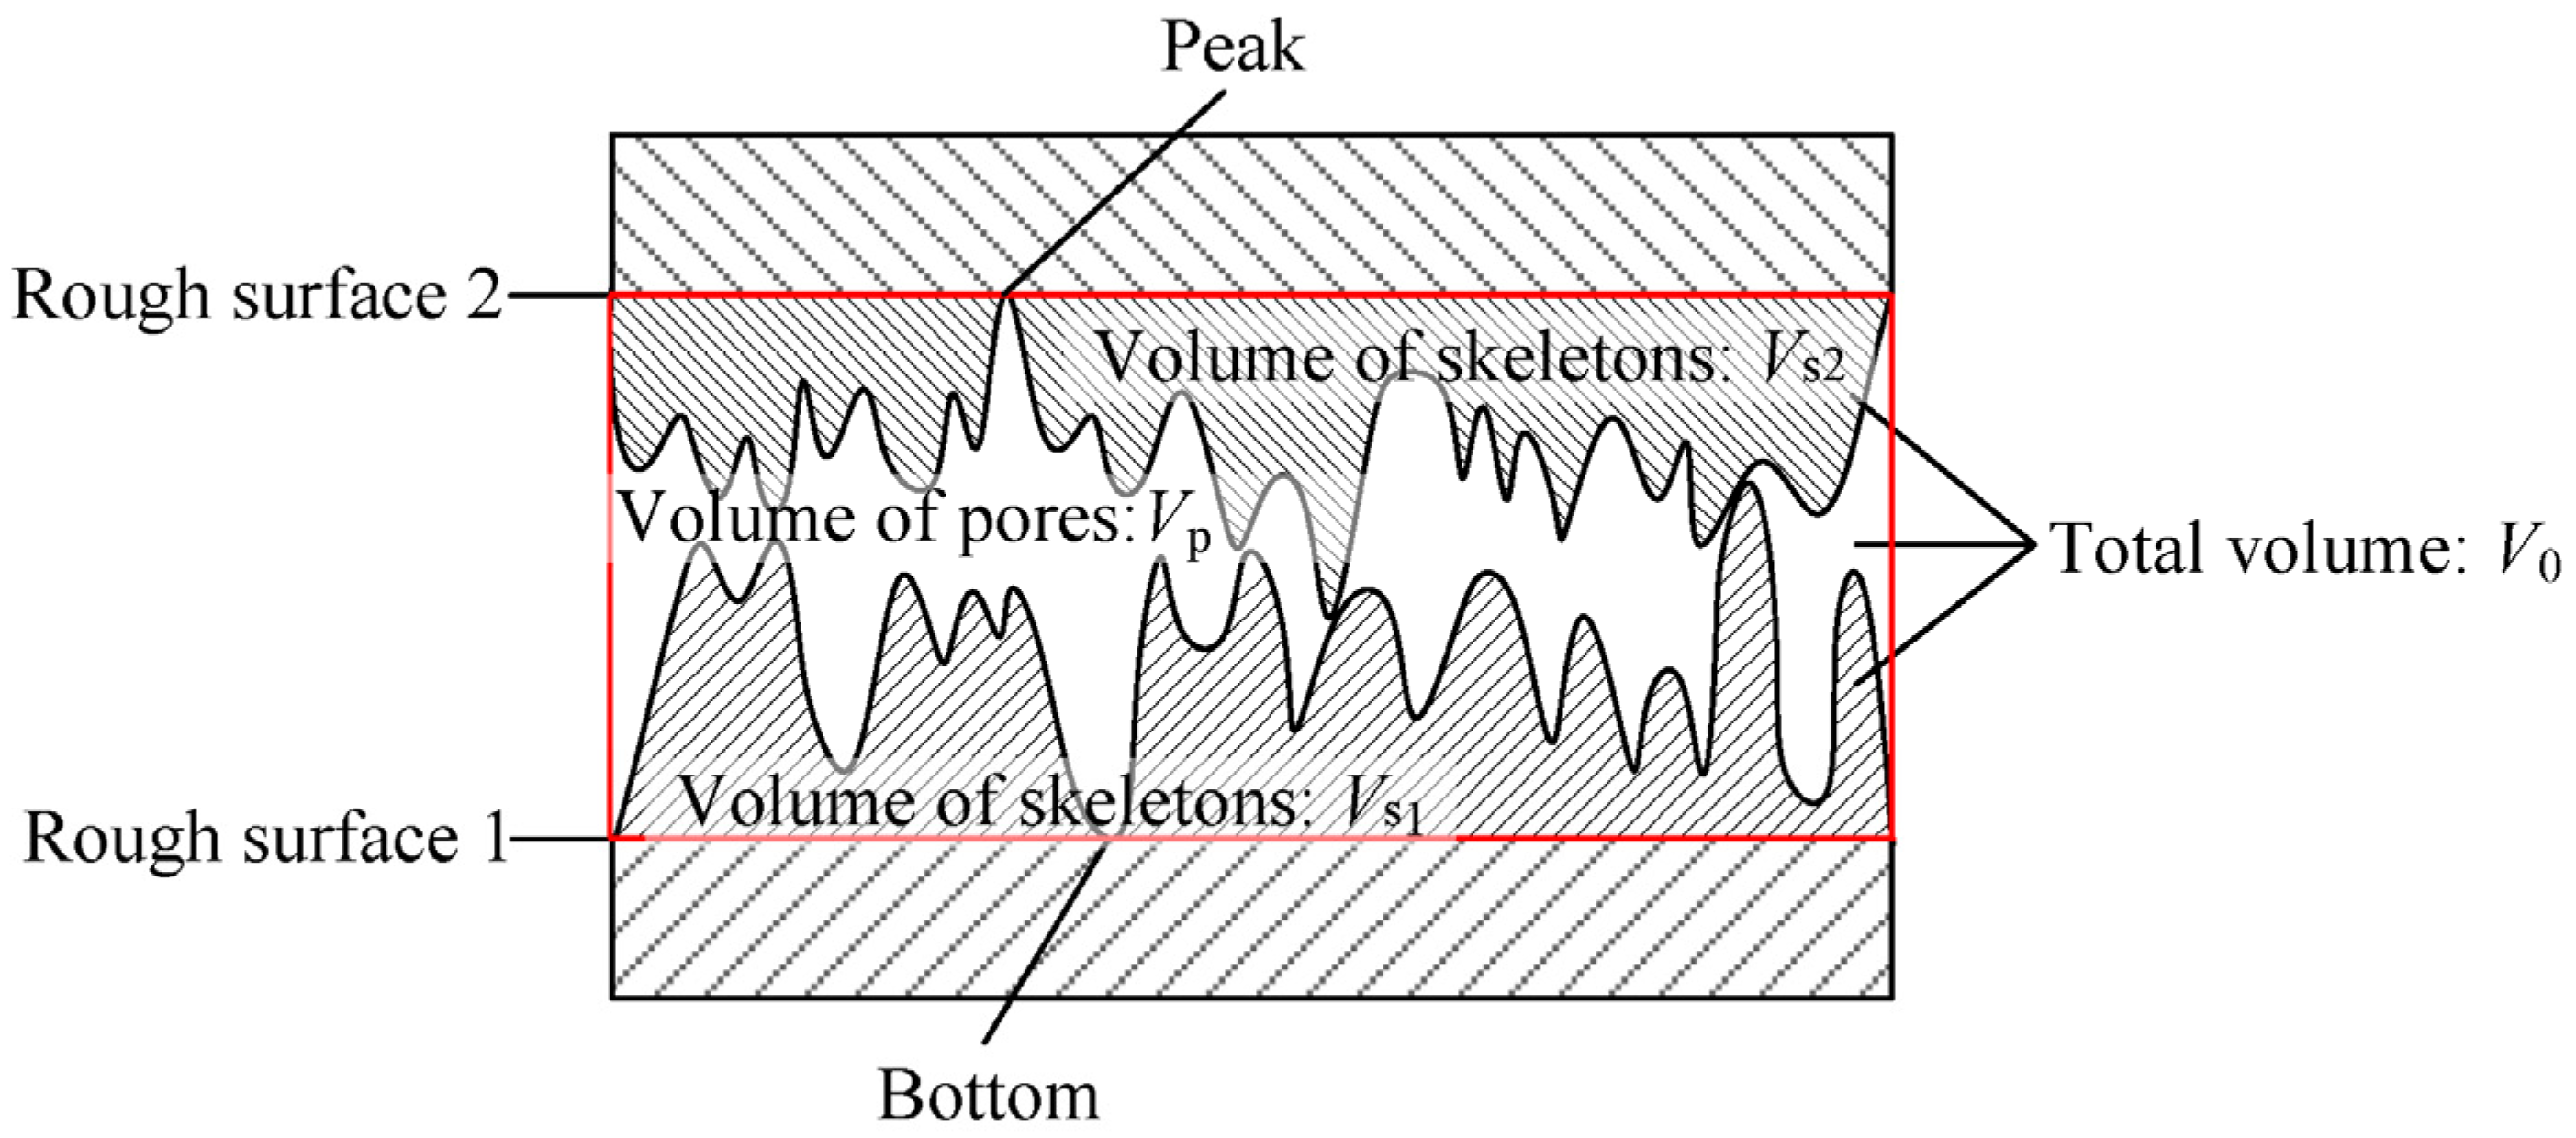
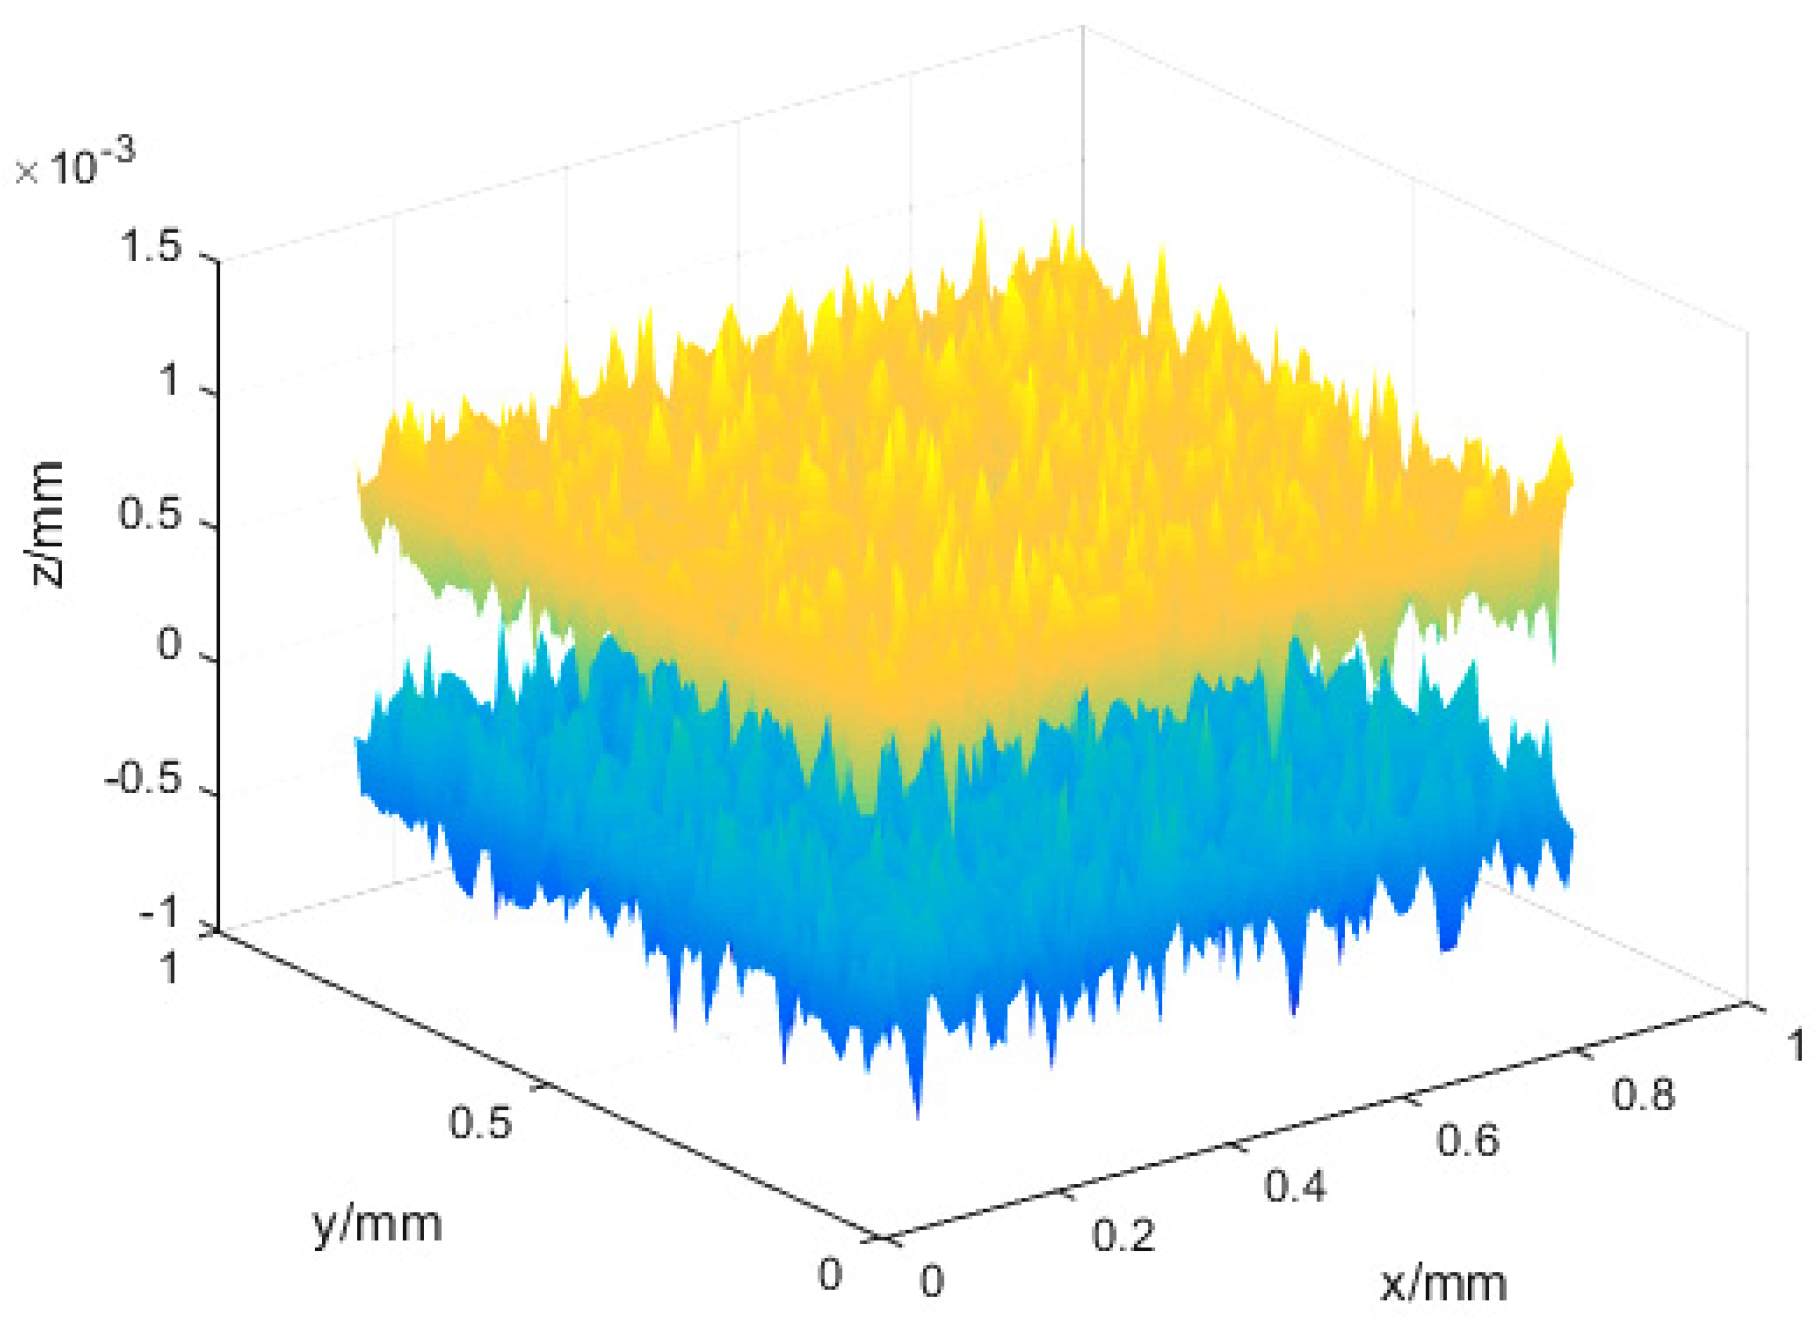
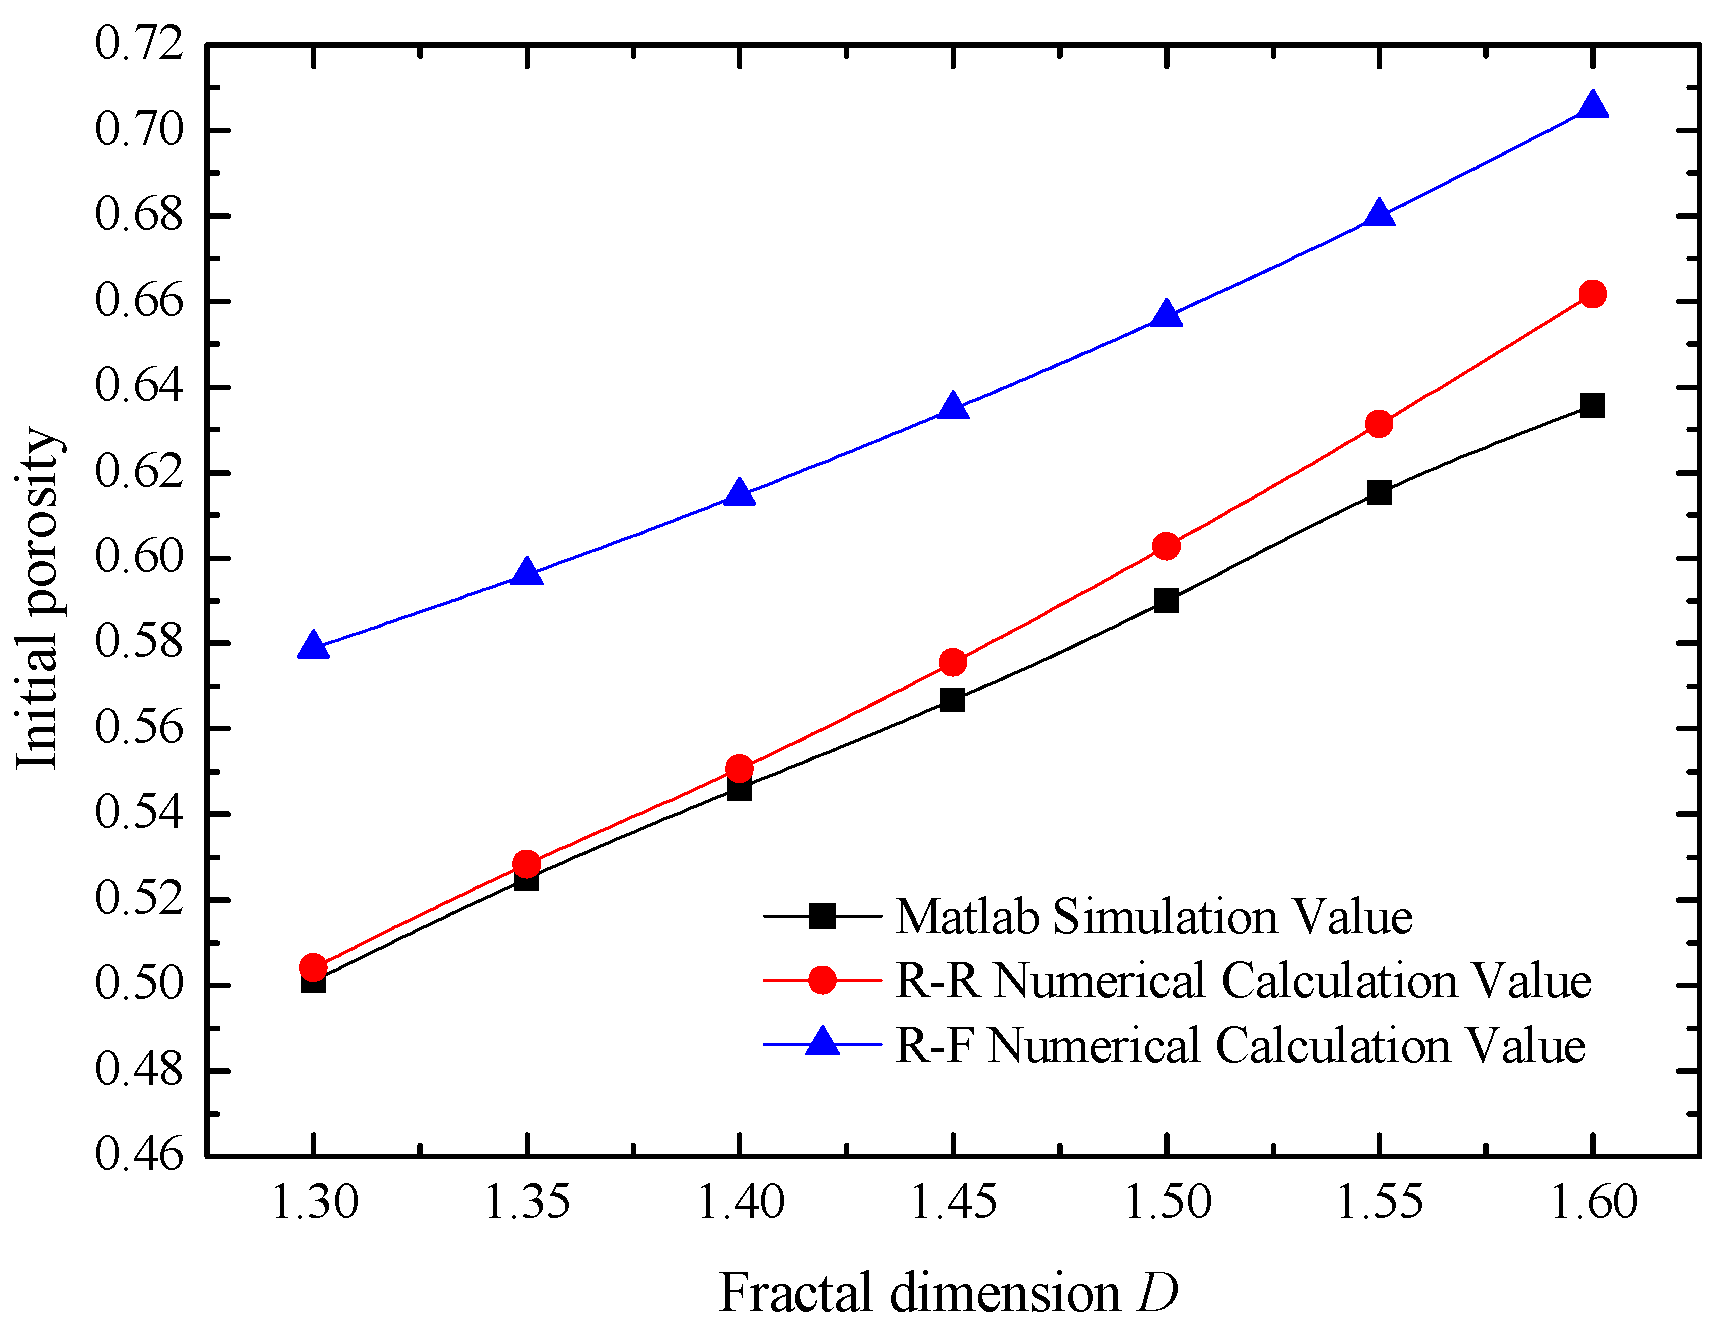
2.2. The Initial Porosity of Rough Sealing Surface

Zuo [40] used fractal parameters to describe rough surfaces and found they can comprehensively characterize the overall, local and internal structure of the surface. For the fractal machined rough surface, W-M function can be used to describe the contour curve of any asperity before deformation
z ( x ) = G D 1 l 2 D cos ( π x l ) , l 2 < x < l 2
where D is the fractal dimension of the surface, G is the fractal roughness, l is the base diameter of the asperity which can be given by l = 1/γn, γn is the spatial frequency of the asperity. When n = nmin, the base diameter of the largest asperity is l = 1/γnmin, when n = nmin + 1, the base diameter of the corresponding asperity is l = 1/γnmin+1, etc.
For the asperity satisfying Equation (1), its maximum height h = GD1l2−D corresponds to the maximum surface roughness, and the corresponding l is the base diameter of the maximum asperity.
The number of asperities on the sealing surface is related to the maximum contact area [23], which satisfies
n ( a ) 1 , 2 = D 1 , 2 2 ψ 2 D 1 , 2 2 a L D 1 , 2 2 a D 1 , 2 2 1
where n(a) is the distribution density function for the contact area, subscript 1 and 2 represents two rough surfaces, respectively, n(a) takes the smaller value of n(a)1 and n(a)2, a is the contact area of asperity, aL is the maximum area of micro contact, ψ is the correction factor of Ar/aL, which is the ratio of the real contact area to the maximum area of micro contact. This can be obtained from the transcendental equation [41]:
ψ ( 2 D ) / 2 ( 1 + ψ D / 2 ) ( D 2 ) / D ( 2 D ) / D = 1
For the sealing surface with known surface topography parameters, the nominal contact area A0 is equal to the sum of the cross-sectional area of the largest asperity and all other smaller asperities on the surface:
A 01 , 2 = 0 a L 1 , 2 a n ( a ) 1 , 2 d a = D 1 , 2 2 D 1 , 2 ψ 2 D 1 , 2 2 a L 1 , 2
where aL1,2 is the largest area of micro contact, aL1,2 = πl1,22/4, m2; A0 takes the larger value of A01 and A02.
So far, the numerical expression can be used to calculate the porosity for sealing surface under certain topography parameters. Equation (5) is the initial porosity when a plane contacts a rough surface, and Equation (6) is the initial porosity when two rough surfaces contact.
ϕ r f = 1 0 h n ( a ) a · a d z ( x ) A 0 h = 1 D a L D 2 π 0.5 0 a L a 1 D 2 sin π a l da 4 A 0 l
ϕ r r = 1 0 h 1 n ( a ) 1 a a d z ( x ) 1 A 0 h 0 h 2 n ( a ) 2 a a d z ( x ) 2 A 0 h = 1 D 1 h 1 a L 1 D 1 2 π 0.5 0 a L 1 a 1 D 1 2 sin π a l 1 da / l 1 + D 2 h 2 a L 2 D 2 2 π 0.5 0 a L 2 a 1 D 2 2 sin π a l 2 da / l 2 4 A 0 h
In Equation (5), h is the height of the largest asperity on the rough surface; in Equation (6), h’ is the maximum distance between asperities on two surfaces, h1 and h2 is the maximum height of asperity on two rough surfaces, respectively. Once the rough surface is determined, the specific value of fractal dimension D and fractal roughness G, h, h1 and h2 can be obtained through assigning or measurement. According to Equation (1), the corresponding l, l1 and l2 can be obtained, so aL, aL1 and aL2 can also be achieved, and then the initial porosity can be calculated.
Sealing surfaces with specific topography parameters (D: 1.3, 1.35, 1.4, 1.45, 1.5, 1.55, 1.6; G: 25 × 10−11 m) were selected to achieve the simulation value for initial porosity based on W-M function and MATLAB programming. Then these values were compared with the numerical calculation value obtained by Equations (5) and (6). The results are shown in Figure 6.
When the fractal parameters of the two rough surfaces are the same, the calculated value based on the rough-rough contact is closer to the simulated value; the maximum relative error is less than 5%, while the relative error between the calculated and simulated value based on the rough-flat contact is 10.5~15.5%. Therefore, when the topography parameters of two surfaces are the same or similar, the contact should be considered shoulder-shoulder rather than top-top. Shoulder-shoulder contact should be used for the modeling and mechanical analysis of the rough surface.

2.3. Porosity of Rough Sealing Surface after Loading

Under the action of contact pressure, the asperities on the rough surface will deform (i.e., produce the compression w’), which will change the porosity of the sealing interface. Taking the calculation unit of sealing interface (the total volume is V0 = L × L × h’, L is the length and width of the calculation unit, and h’ is the height of the calculation unit, namely the height of red area in Figure 2) as the research object, after loading the height of the sealing interface will change from h’ to h w’. Then, the volume of the calculation unit changes from V0 = L × L × h’ to V0’ = L × L × (h− w’). According to the principle that the skeleton volume remains unchanged before and after deformation, the skeleton volume is still Vs = (1 − ϕ0) × V0 and the pore volume is Vp’ = V0− Vs, then the porosity of sealing surfaces becomes:
ϕ = V p V 0 = L × L × ( h w ) ( 1 ϕ 0 ) × L × L × h L × L × ( h w ) = ϕ 0 h w h w
where ϕ0 is the initial porosity of the sealing interface.

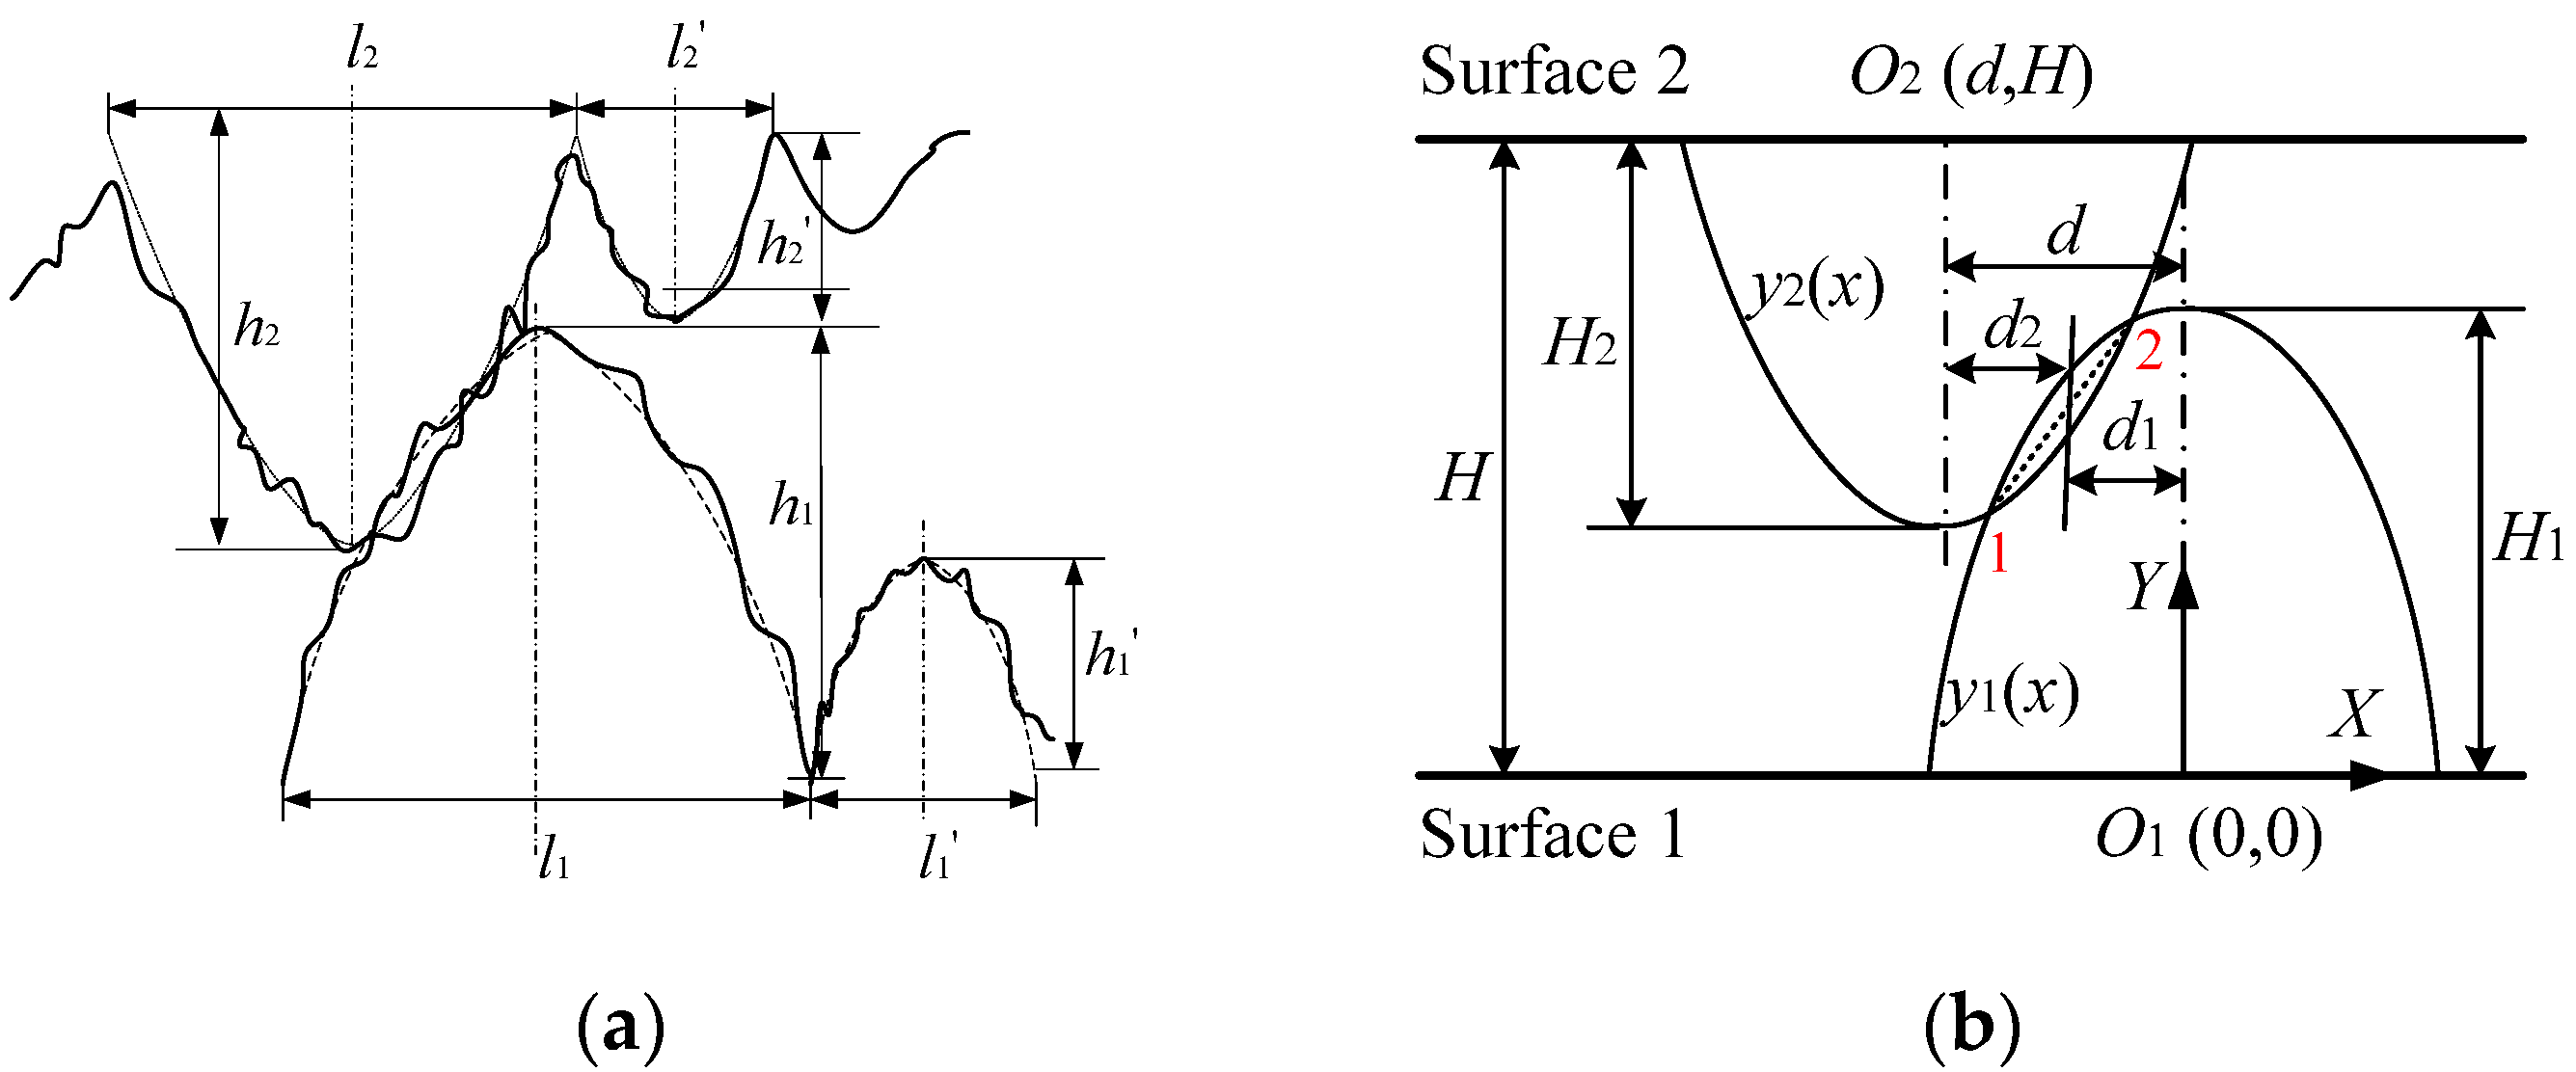
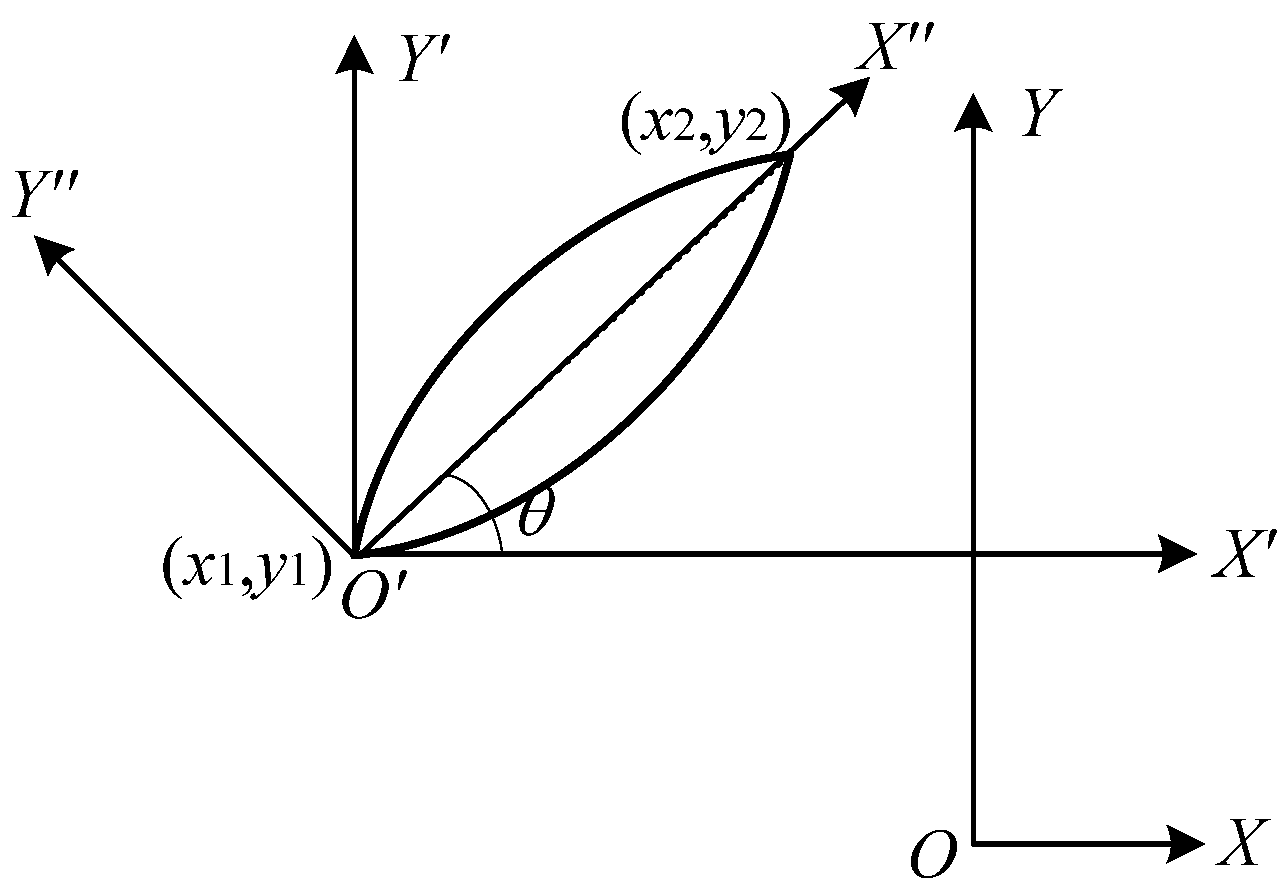
3. Geometric Model for the Shoulder-Shoulder Contact

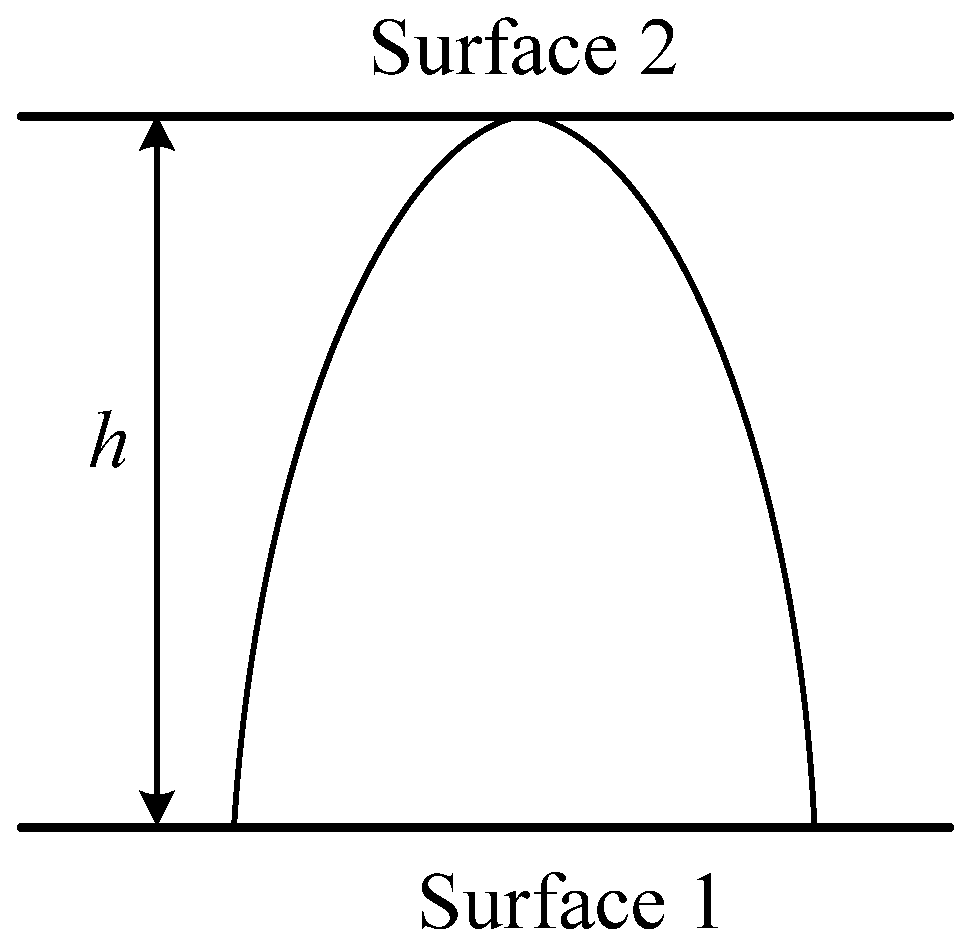
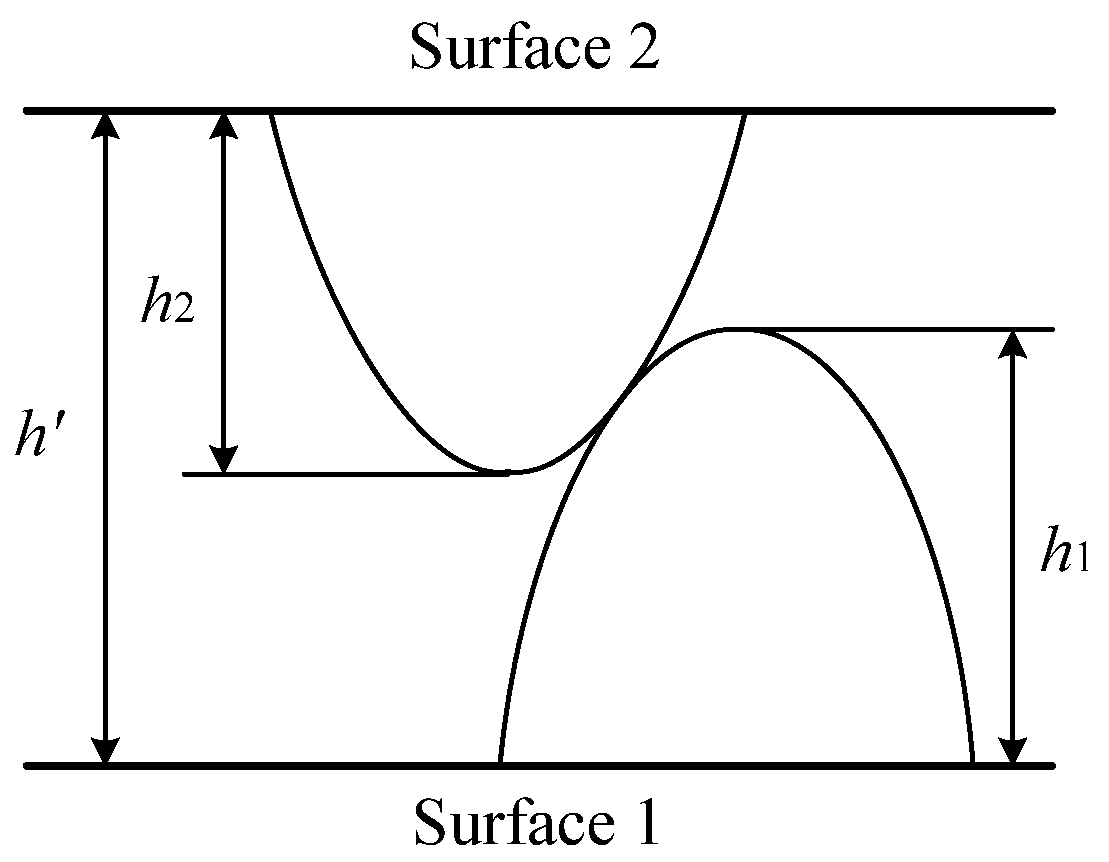
3.1. Model Simplification of the Shoulder-Shoulder Contact

When two rough surfaces contact, the actual contact situation is shown in Figure 7a, which can be simplified as the contact of the two largest asperities, as shown in Figure 7b.
For the single asperity, its contour curve satisfies Equation (1), and the curve equations of two asperities in Figure 7b can be expressed as:
y 1 ( x ) = G 1 D 1 1 l 1 2 D 1 cos ( π x l 1 )
y 2 ( x ) = G 2 D 2 1 l 1 2 D 2 cos ( π ( x + d ) l 2 ) + H
H is the distance between the two surfaces and d is the distance between the rotation axes of the two asperities.
The curvature radius of the two asperities can be obtained by:
R 1 = | [ 1 + ( d y 1 d x ) 2 ] 1.5 d 2 y 1 d x 2 | x = x c = | [ 1 + ( π l 1 h 1 sin ( π x l 1 ) ) 2 ] 1.5 π 2 l 1 2 h 1 cos ( π x l 1 ) | x = x c
R 2 = | [ 1 + ( d y 2 d x ) 2 ] 1.5 d 2 y 2 d x 2 | x = x c = | [ 1 + ( π l 2 h 2 sin ( π ( x + d ) l 2 ) ) 2 ] 1.5 π 2 l 2 2 h 2 cos ( π ( x + d ) l 2 ) | x = x c
xc represents the x coordinate value at the contact point.
The equivalent curvature radius at the contact point is R = 1/(1/R1 + 1/R2).
The stress analysis at the contact area is shown in Figure 8.
When Fn = Fa × cosθ, w = w′ × cosθ, the contact area perpendicular to the direction of Fn is equal to the contact area at inclined direction (1–2 direction) multiplied by cosθ.

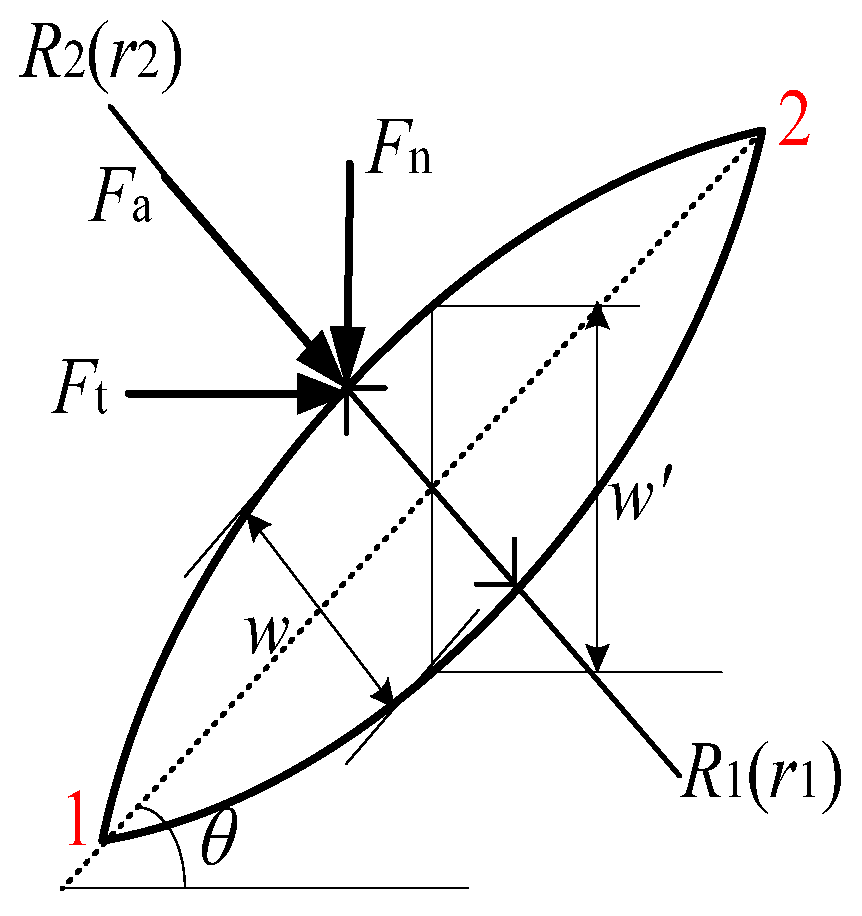
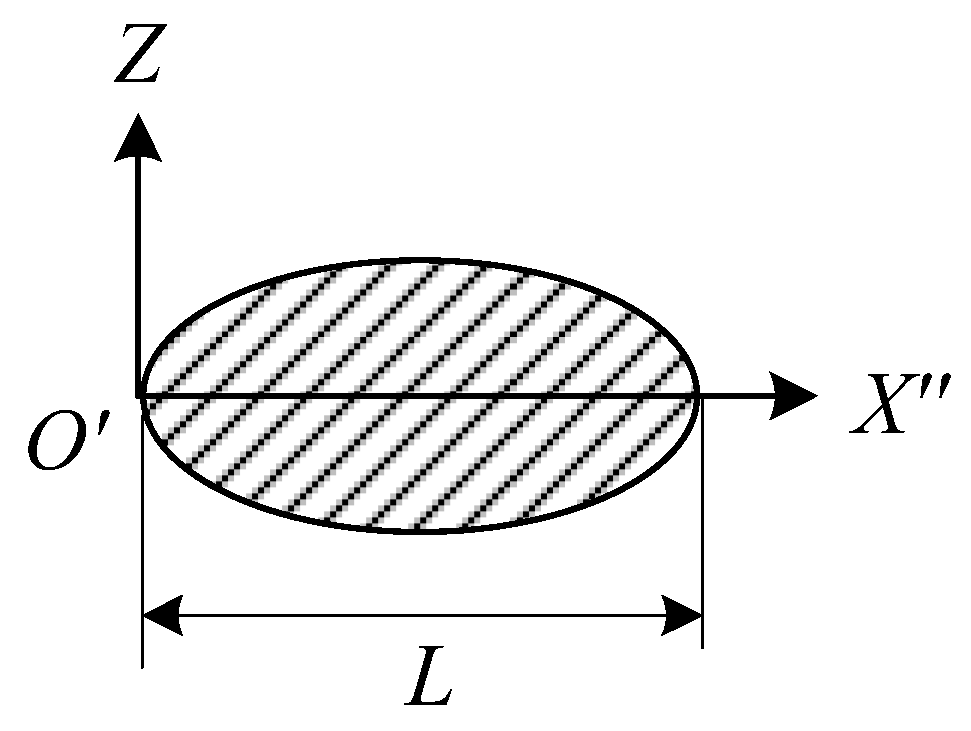
3.2. Area Solution for the Shoulder-Shoulder Contact

The coordinates of point 1 and point 2 in Figure 8 can be obtained by setting up the two curve equations of asperities simultaneously (x1 < x2 is the default condition),
sin θ = | y 1 y 2 | ( x 1 x 2 ) 2 + ( y 1 y 2 ) 2 ,   cos θ = | x 1 x 2 | ( x 1 x 2 ) 2 + ( y 1 y 2 ) 2
According to Figure 9, coordinate transformation is carried out, and finally the inclined plane contact part, as shown in Figure 10, is obtained and its area can be calculated.
① Taking O as the coordinate origin and moving coordinate system XOY to the point of (x1, y1) to form the new coordinate system X′O′Y′.
{ x = x x 1 y = y y 1 { x = x + x 1 y = y + y 1
② Taking O as the coordinate origin and rotating the coordinate system XOY at θ degree counterclockwise to form the new coordinate system XOY″.
{ x = x cos θ + y sin θ y = y cos θ x sin θ { x = x cos θ y sin θ y = y cos θ + x sin θ
Substituting ① and ② into the surface equation of asperity 1:
y = G 1 D 1 1 l 1 2 D 1 cos ( ± π l 1 x 2 + z 2 ) ,
Since y″ = 0 after transformation, then coordinate value of Z-axis is
z = ± 1 ( π l 1 ) 2 [ ar cos ( x sin θ + y 1 G 1 D 1 1 l 1 2 D 1 ) ] 2 ( x cos θ + x 1 ) 2
Therefore, the intersection area S equals to
S = 2 0 L d 1 ( π l 1 ) 2 [ ar cos ( x sin θ + y 1 G 1 D 1 1 l 1 2 D 1 ) ] 2 ( x cos θ + x 1 ) 2 d x
where Ld is the linear distance between point 1 and point 2, L d = ( x 1 x 2 ) 2 + ( y 1 y 2 ) 2 .

4. Establishment of Contact Mechanics Model

4.1. Analysis of Deformation State

With the increment of applied load, the deformation of asperity will increase, resulting in elastic, elastic-plastic and purely plastic deformation.
When analyzing the contact mechanics of asperities on rough surface, the assumptions are as follows:
① Deformations only occur on asperities on the rough surface, while the macro base does not deform. The volume of asperities remains unchanged before and after deformation.
② In the process of surface contact, there is no interaction between asperities, and neither surface material strengthens.
(1) Elastic deformation
According to Hertz theory, the contact force in the direction of Fa during elastic deformation is F a = 4 E R 0.5 w 1.5 3 . E represents the equivalent elastic modulus, which can be expressed as E = 1/[(1 ν12)/E1 + (1 ν22)/E2], ν1, ν2 and E1, E2 denotes the Poisson’s ratio and elastic modulus of surface 1 and 2, respectively. R is the equivalent curvature radius and w is the deformation in Fa direction.
The contact area perpendicular to the direction of Fa, namely the area of inclined plane is a a = π R w , it is same with the intersection area S in Equation (10).
The contact force in Fn direction is F n = F a cos θ = 4 E R 0.5 w 1.5 3 cos θ .
The contact area perpendicular to Fn direction is a n =π R w n θ .
When elastic contact occurs, the average contact pressure in Fn direction is
p n = F n a n = 4E a a 0.5 3 π 1.5 R
When the average contact pressure on the contact surface is less than the yield limit σy of the material, the asperities are in an elastic state. Under this condition, the elastic contact pressure can be expressed by pn. When pn equals to σy, the inception of yield occurs and the critical area aec can be given by
a ec = ( 3 π 1.5 R σ y 4 E ) 2
Purely plastic deformation
The asperity yields fully when the average pressure is equal to 3σy [42], in this condition
p n σ y = 2 3 { 1 + ln [ 1 3 ( E σ y ) ( r R ) ] } namely 3 = 2 3 { 1 + ln [ 1 3 ( E σ y ) ( a pc 0.5 π 0.5 R ) ] }
After simplification, the critical plastic deformation area apc can be expressed as
a pc = ( 3 e 3.5 σ y π 0.5 R E ) 2
(3) Elastic-plastic deformation
When aecaapc, the asperity has elastic-plastic deformation. In this contact state, the relationship between the contact area and contact pressure becomes extremely complex. Considering that variations of the contact area and contact pressure should be continuous and smooth at the critical point of initial yield and be fully plastic, a template function f(a) [8] can be constructed. The template function is only used to distribute the weight of elastic area and plastic area in the elastic-plastic interval and does not involve the derivation conditions and process of the model, so it does not affect the compatibility of the model.
f ( a ) = 2 ( a a ec a pc a ec ) 3 + 3 ( a a ec a pc a ec ) 2
Then the average contact pressure in the elastic-plastic stage is given by
p nep = p ne +( p np p ne ) f ( a ) = p ne + ( p np p ne )( 2 ( a a ec a pc a ec ) 3 +3 ( a a ec a pc a ec ) 2 ) = 4E a a 0.5 3 π 1.5 R +( 3 σ y 4E a a 0.5 3 π 1.5 R )( 2 ( a a ec a pc a ec ) 3 +3 ( a a ec a pc a ec ) 2 )

4.2. Real Contact Area and Contact Load of Rough Surface

For two rough surfaces in contact when the number of asperities on the interface satisfies Equation (2), its nominal contact area A0 can be expressed by Equation (4).
When aL < aec, all the contact asperities are in elastic deformation, therefore, the real contact area Ar is the elastic contact area Are and the contact force Fn is the elastic contact force Fne, which can be given by
A r 1 , 2 = A re 1 , 2 = 0 a L a n ( a ) 1 , 2 d a = D 1 , 2 2 D 1 , 2 k 1 , 2 a L
F n 1 , 2 = F ne 1 , 2 = 0 a L 1 , 2 p ne a n ( a ) 1 , 2 d a = 4 k E D 1 , 2 a e 1.5 3 ( 3 D 1 , 2 ) π 1.5 R
where k 1 , 2 = ψ 2 D 1 , 2 2 , aL is the contact area of the largest asperity; Ar is the larger value between Ar1 and Ar2; Fn takes the larger value of Fn1 and Fn2.
When aecaLapc, the contact asperities are in elastic-plastic deformation. In this scenario, the total contact area Ar is the sum of elastic contact area Are and elastic-plastic contact area Arep, and the total force Fn is the sum of elastic contact force Fne and elastic-plastic contact force Fnep
A r 1 , 2 = A re 1 , 2 + A rep 1 , 2 + A rp 1 , 2 = 0 a ec a n ( a ) 1 , 2 d a + a ec a L a n ( a ) 1 , 2 d a = D 1 , 2 2 D 1 , 2 k 1 , 2 a L
F n1,2 = F ne1,2 + F nep1,2 = 0 a ec p ne an (a) 1,2 da+ a ec a L p nep an (a) 1,2 da = 0 a ec 4E a a 0.5 3 π 1.5 R an (a) 1,2 da+ a ec a L ( 4E a a 0.5 3 π 1.5 R +( 3 σ y 4E a a 0.5 3 π 1.5 R )( 2 ( a a ec a pc a ec ) 3 +3 ( a a ec a pc a ec ) 2 ) )an (a) 1,2 da = 4kE D 1,2 a ec 3 D 1,2 2 3(3 D 1,2 ) π 1.5 R a L D 1,2 2 + k D 1,2 2 a L D 1,2 2 a ec a L ( 4E a a 0.5 3 π 1.5 R +( 3 σ y 4E a a 0.5 3 π 1.5 R )( 2 ( a a ec a pc a ec ) 3 +3 ( a a ec a pc a ec ) 2 ) ) a D 1,2 2 da
When aL > apc, the contact asperities are in plastic deformation. In this condition, the total contact area Ar is the sum of elastic contact area Are, elastic-plastic contact area Arep and plastic contact area Arp, and the total force Fn is the sum of elastic contact force Fne, elastic-plastic contact force Fnep and plastic contact force Fnp.
A r 1 , 2 = A re 1 , 2 + A rep 1 , 2 + A rp 1 , 2 = 0 a ec a n ( a ) 1 , 2 d a + a ec a pc a n ( a ) 1 , 2 d a + a pc a L a n ( a ) 1 , 2 d a = D 1 , 2 2 D 1 , 2 k 1 , 2 a L
F n 1 , 2 = F ne 1 , 2 + F nep 1 , 2 + F np 1 , 2 = 0 a ec p ne a n ( a ) 1 , 2 d a + a ec a pc p nep a n ( a ) 1 , 2 d a + a pc a L p np a n ( a ) 1 , 2 d a = 0 a ec 4 E a a 0.5 3 π 1.5 R a n ( a ) 1 , 2 d a + a ec a pc ( 4 E a a 0.5 3 π 1.5 R + ( 3 σ y 4 E a a 0.5 3 π 1.5 R ) ( 2 ( a a ec a pc a ec ) 3 + 3 ( a a ec a pc a ec ) 2 ) ) a n ( a ) 1 , 2 d a + a pc a L 3 σ y a n ( a ) 1 , 2 d a
Ar is the larger value between Ar1 and Ar2; Fn takes the larger value of Fn1 and Fn2.
Although the expressions of the real contact area Ar are the same in the three states, since the largest asperity has different deformation properties, aL in each formula is different, so the actual contact area is not the same. Therefore, when calculating the real contact area, it is necessary to determine the deformation properties of the largest asperity.

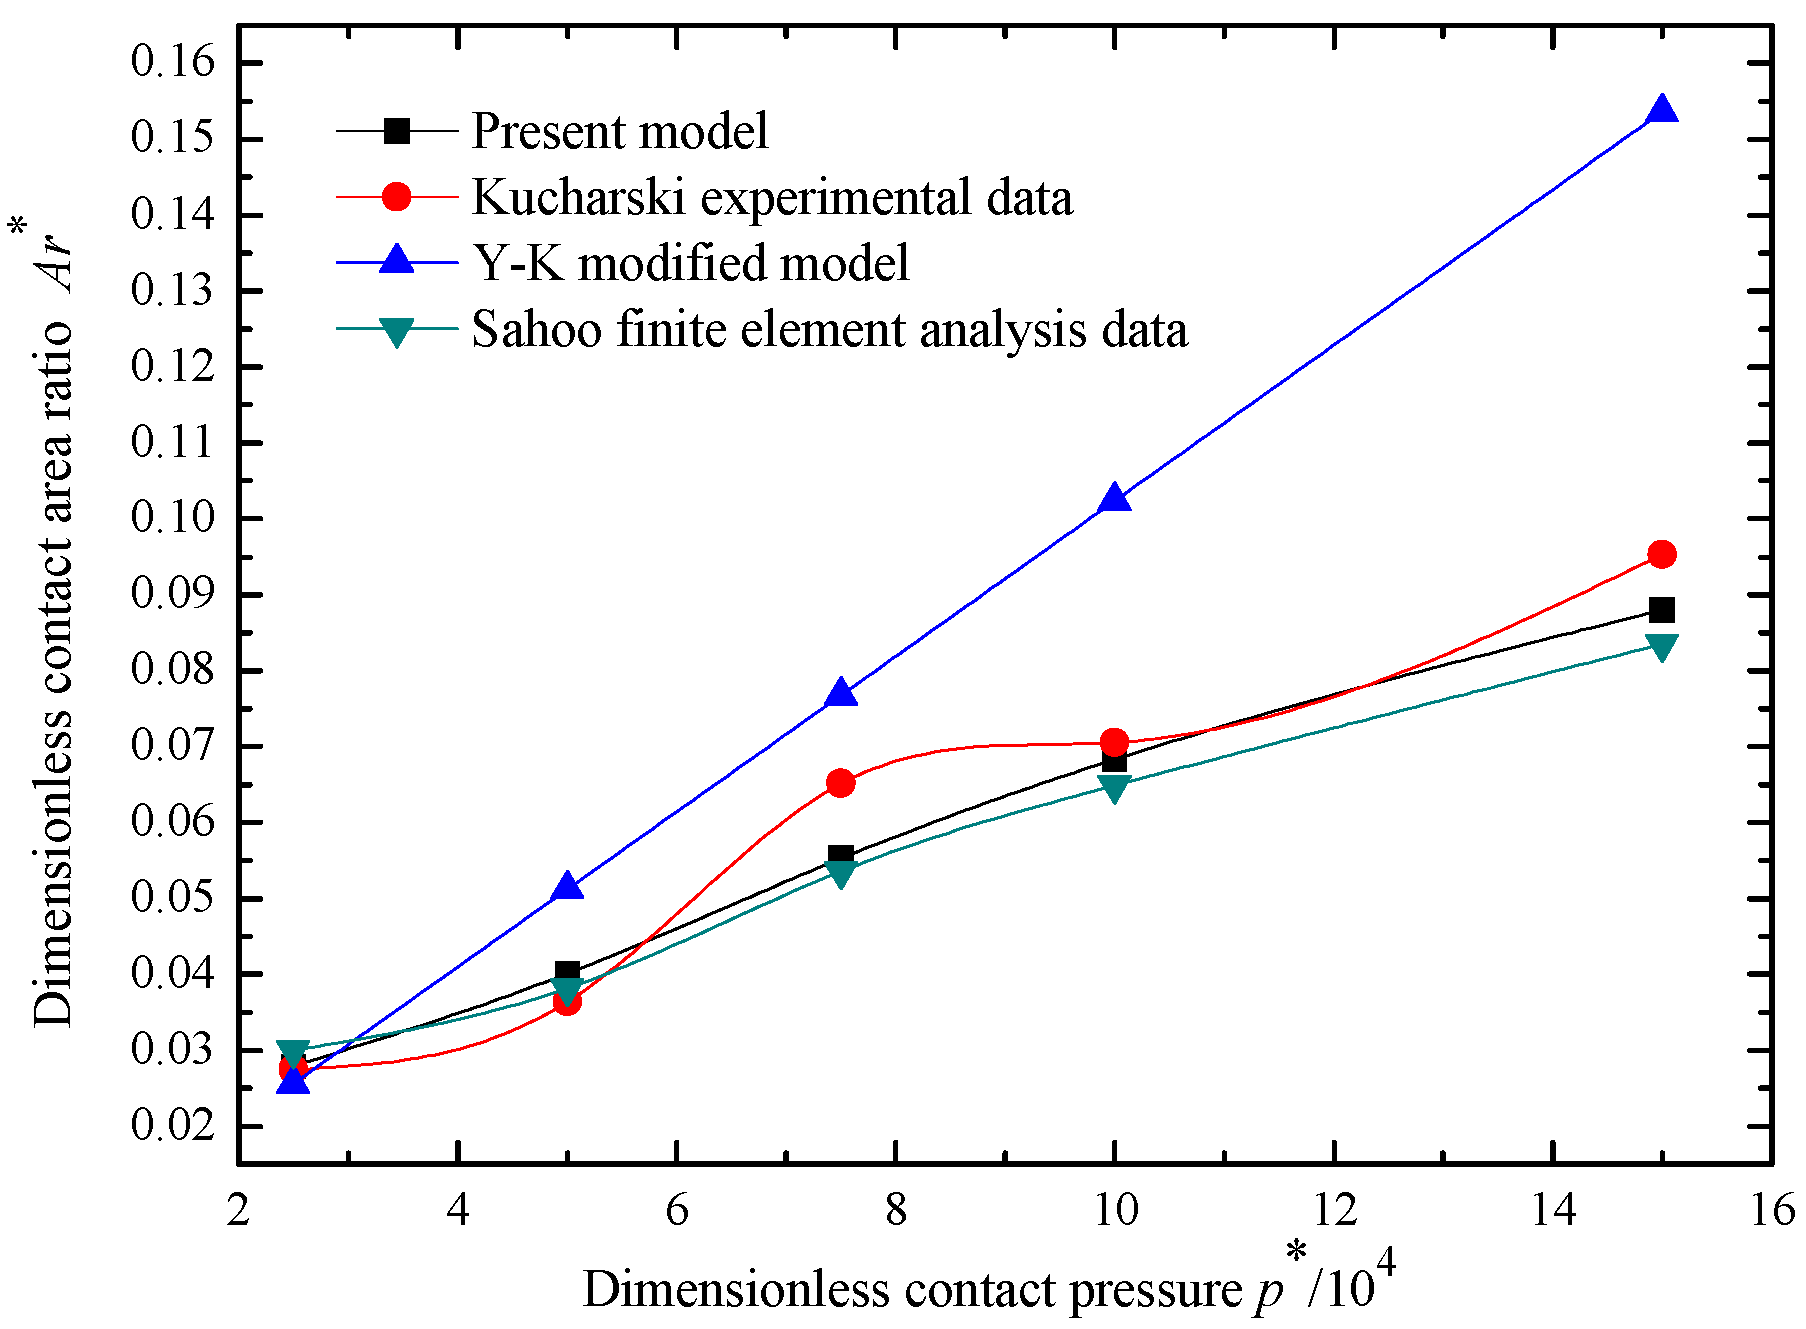
4.3. Model Validation

To verify the accuracy of the established model, results of Ar* − p* in Kucharski experiment [43], Y-K modified model [24] and Sahoo finite element analysis [44] were extracted, and the same material parameters and topography parameters were used in the present established model for calculation. These four sets of data were compared.
The material is steel, elastic modulus E = 200 GPa, Poisson’s ratio v = 0.3, yield strength of 400 MPa, Vickers hardness (HV) of 1.12 GPa, fractal dimension D = 1.3 and fractal roughness G = 1.36 × 10⁻¹¹ m. In the comparative analysis, dimensionless treatment is needed, dimensionless contact load p* = F/(E*A0), dimensionless contact area ratio Ar* = Ar/A0.
The relationship between Ar* and p* in different methods are shown in Figure 11. It can be seen that the data of this model is in good agreement with Kucharski experimental data and Sahoo finite element analysis data.

5. Solution of Porosity and Real Contact Area
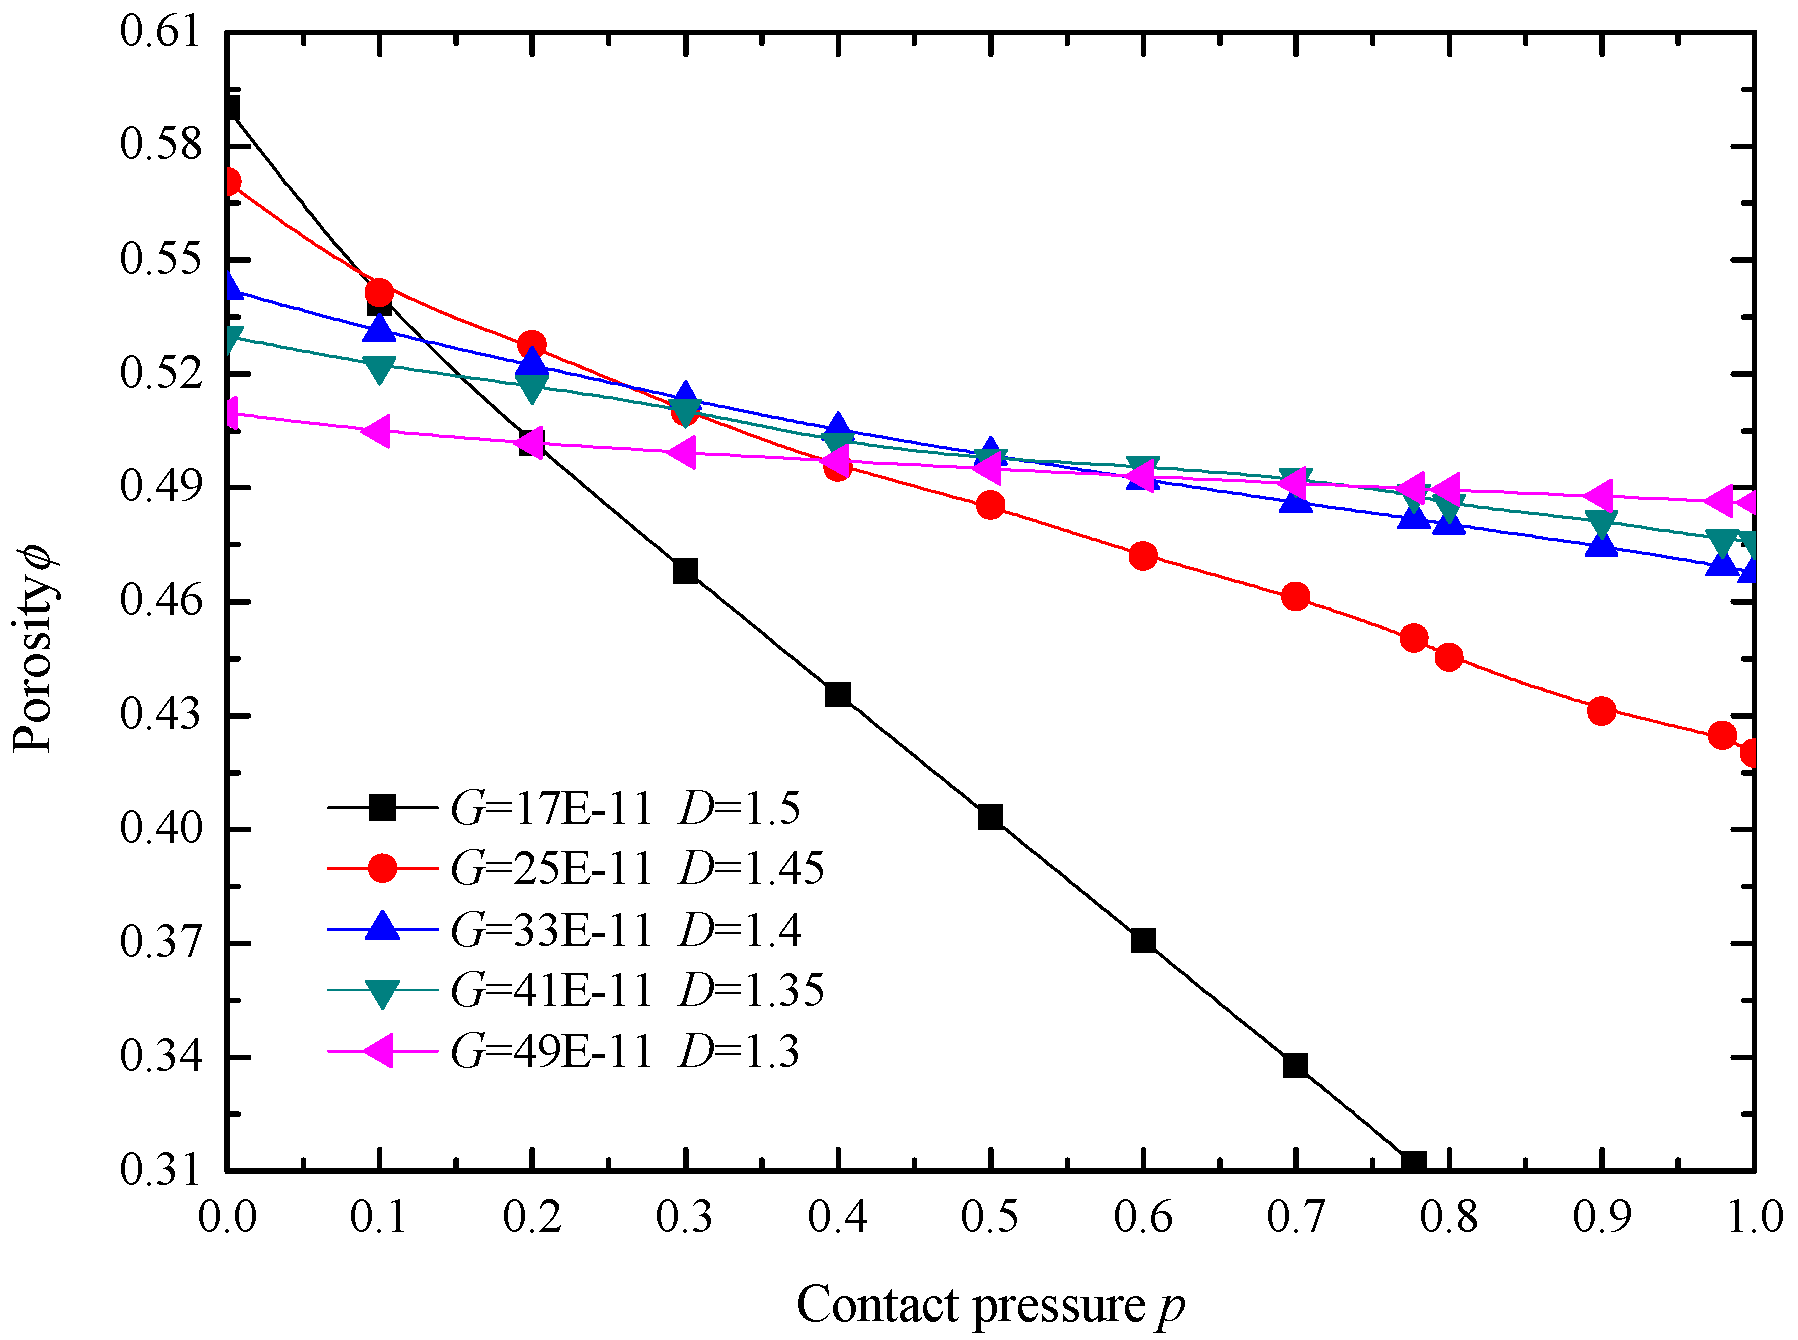
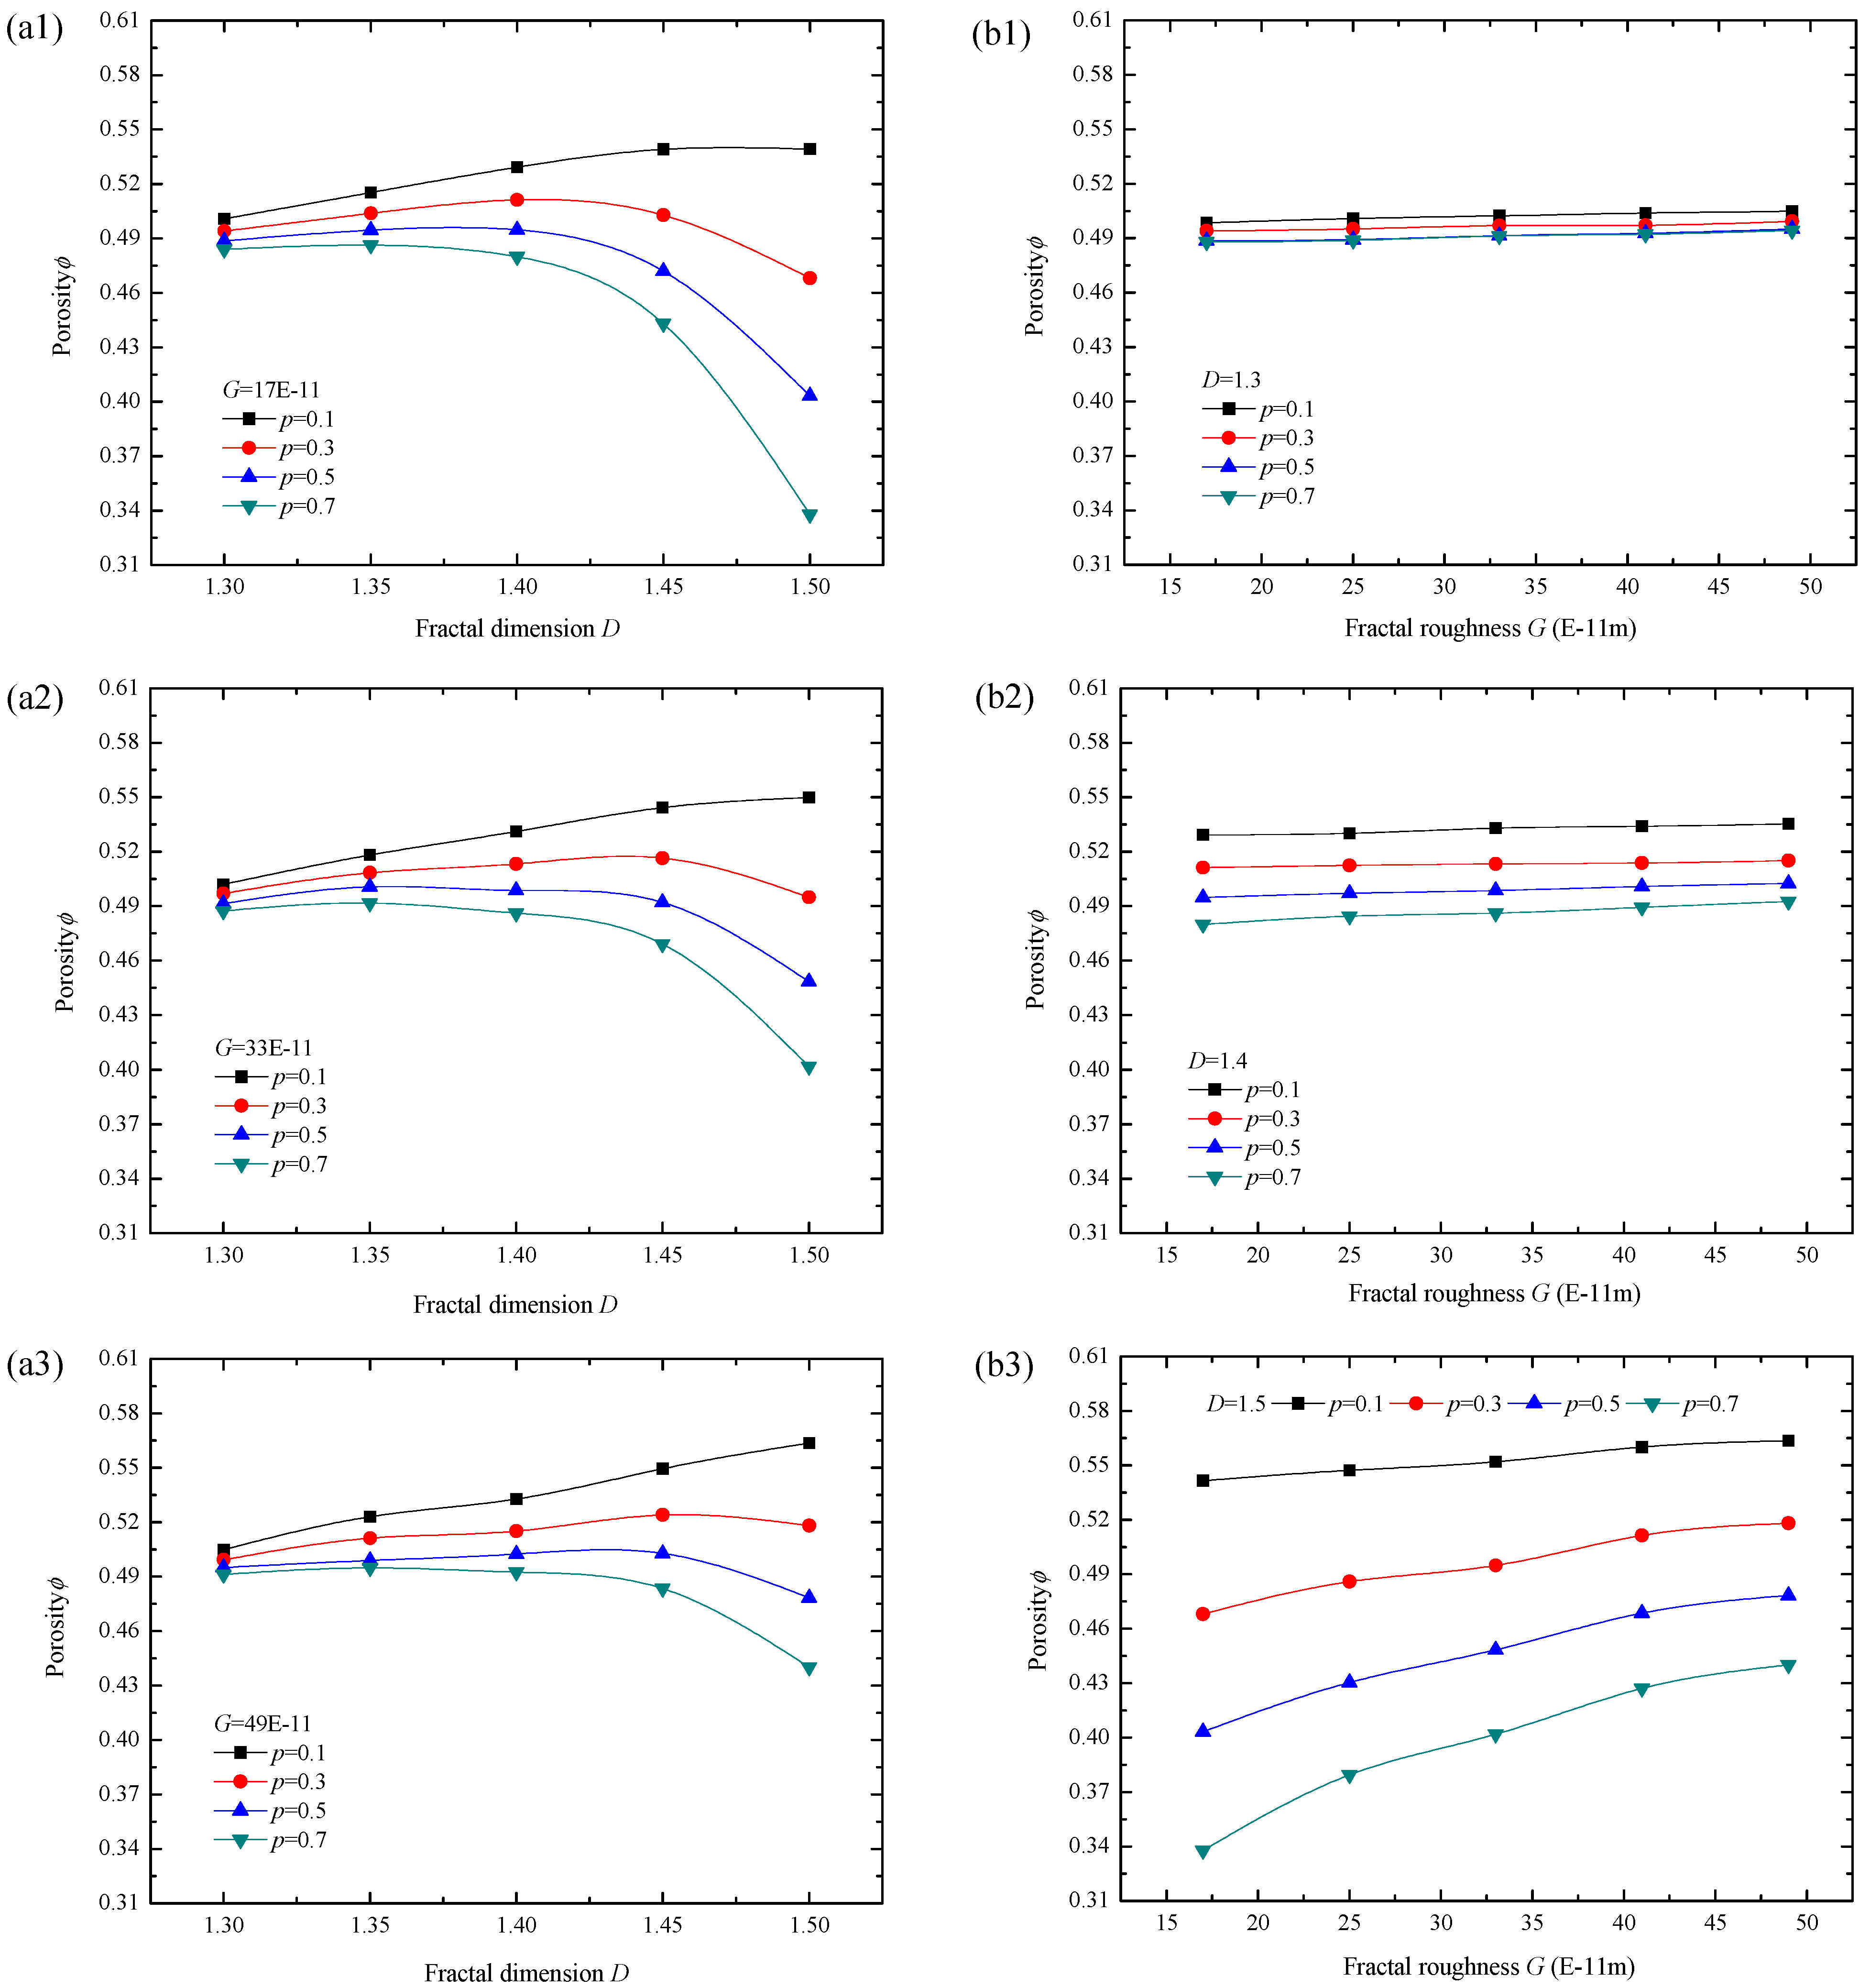
The calculation steps of porosity and real contact area are as follows:
(1) For the rough sealing surface, determine the comprehensive elastic modulus E and the yield strength σy of the softer surface.
(2) By assigning or measuring, the detailed value of fractal dimension D and fractal roughness G, the maximum distance h’ between the rough surfaces and the maximum height of the asperity on each rough surface h1 and h2 can be achieved. The corresponding l1 and l2 can be obtained according to Equation (1), A0 can be achieved through Equation (4), and the initial porosity can be gained by Equation (5). Under the action of contact pressure, there exists compression w’, and the porosity can be calculated by Equation (10).
(3) Calculate the critical elastic deformation aec and critical plastic deformation apc of the asperity through Equations (11) and (12), obtain the contact area aL of the largest asperity on the sealing surface by Equations (16), (18) and (20) according to the given specific pressure pc, then compare aL with aec and apc to determine the deformation properties of the asperity.
(4) Obtain the real contact area Ar according to Equations (15), (17) and (19), and then the specific value of Ar/A0 is achieved.
The parameters of the sealing surface are as follows:
Material: Graphite M106k
D: 1.3, 1.35, 1.4, 1.45, 1.5
G: 17 × 10−11 m, 25 × 10−11m, 33 × 10−11m, 41 × 10−11m, 49 × 10−11m.
D1 = D2, G1 = G2, E1 = E2 = 20 GPa, σy1 = σy2 = 117.6 MPa, ν1 = ν2 = 0.29.
The porosity and contact area ratio Ar/A0 of the above sealing surfaces were calculated, and the influence of contact pressure (the unit is MPa) and surface topography parameters D and G (the unit is 1011m) were analyzed.

5.1. Porosity

(1) Influence of contact pressure p on porosity
The change of porosity with contact pressure p is shown in Figure 12. Since asperities will be squeezed and filled into the pores of the sealing interface under the action of contact pressure, porosity decreases with the increase of p. Larger D and smaller G corresponds to larger initial porosity, but the corresponding decrease of porosity is faster and larger in amplitude with the increase of p. When the rough surface has large fractal dimension and small fractal roughness, the surface is smooth and the roughness is small, so the ratio of the initial pore volume to the total volume of the sealing surface is high. However, with the increase of the contact pressure and the deformation of the asperities, the decrease rate of the pore volume is greater than that of the total volume of the sealing surface, so the porosity continues to decline.
(2) Influence of topography parameters on porosity
Seen in Figure 13a1–a3, with the increase of fractal dimension D, the overall variation trend of porosity increased first and then reduced (when p = 0.1 MPa, all the porosity increases; the larger the p is, the earlier and faster the porosity decreases), and the smaller the G is, the larger the porosity decreases. At the beginning, with the increase of D, many small pores within the rough sealing surfaces are shown, so the porosity increases. With the further increase of D and p, it is easier for the asperities to deform and fill into the pores, so the porosity decreases. Seen in Figure 13b1–b3, with the increment of G, all the porosity increases, larger p corresponds to lower porosity and larger D corresponds to larger difference and amplitude of porosity change. Larger G means rougher surface and coarser asperity, and it is much more difficult for the asperity to deform and fill into the pores, so the porosity is bigger.

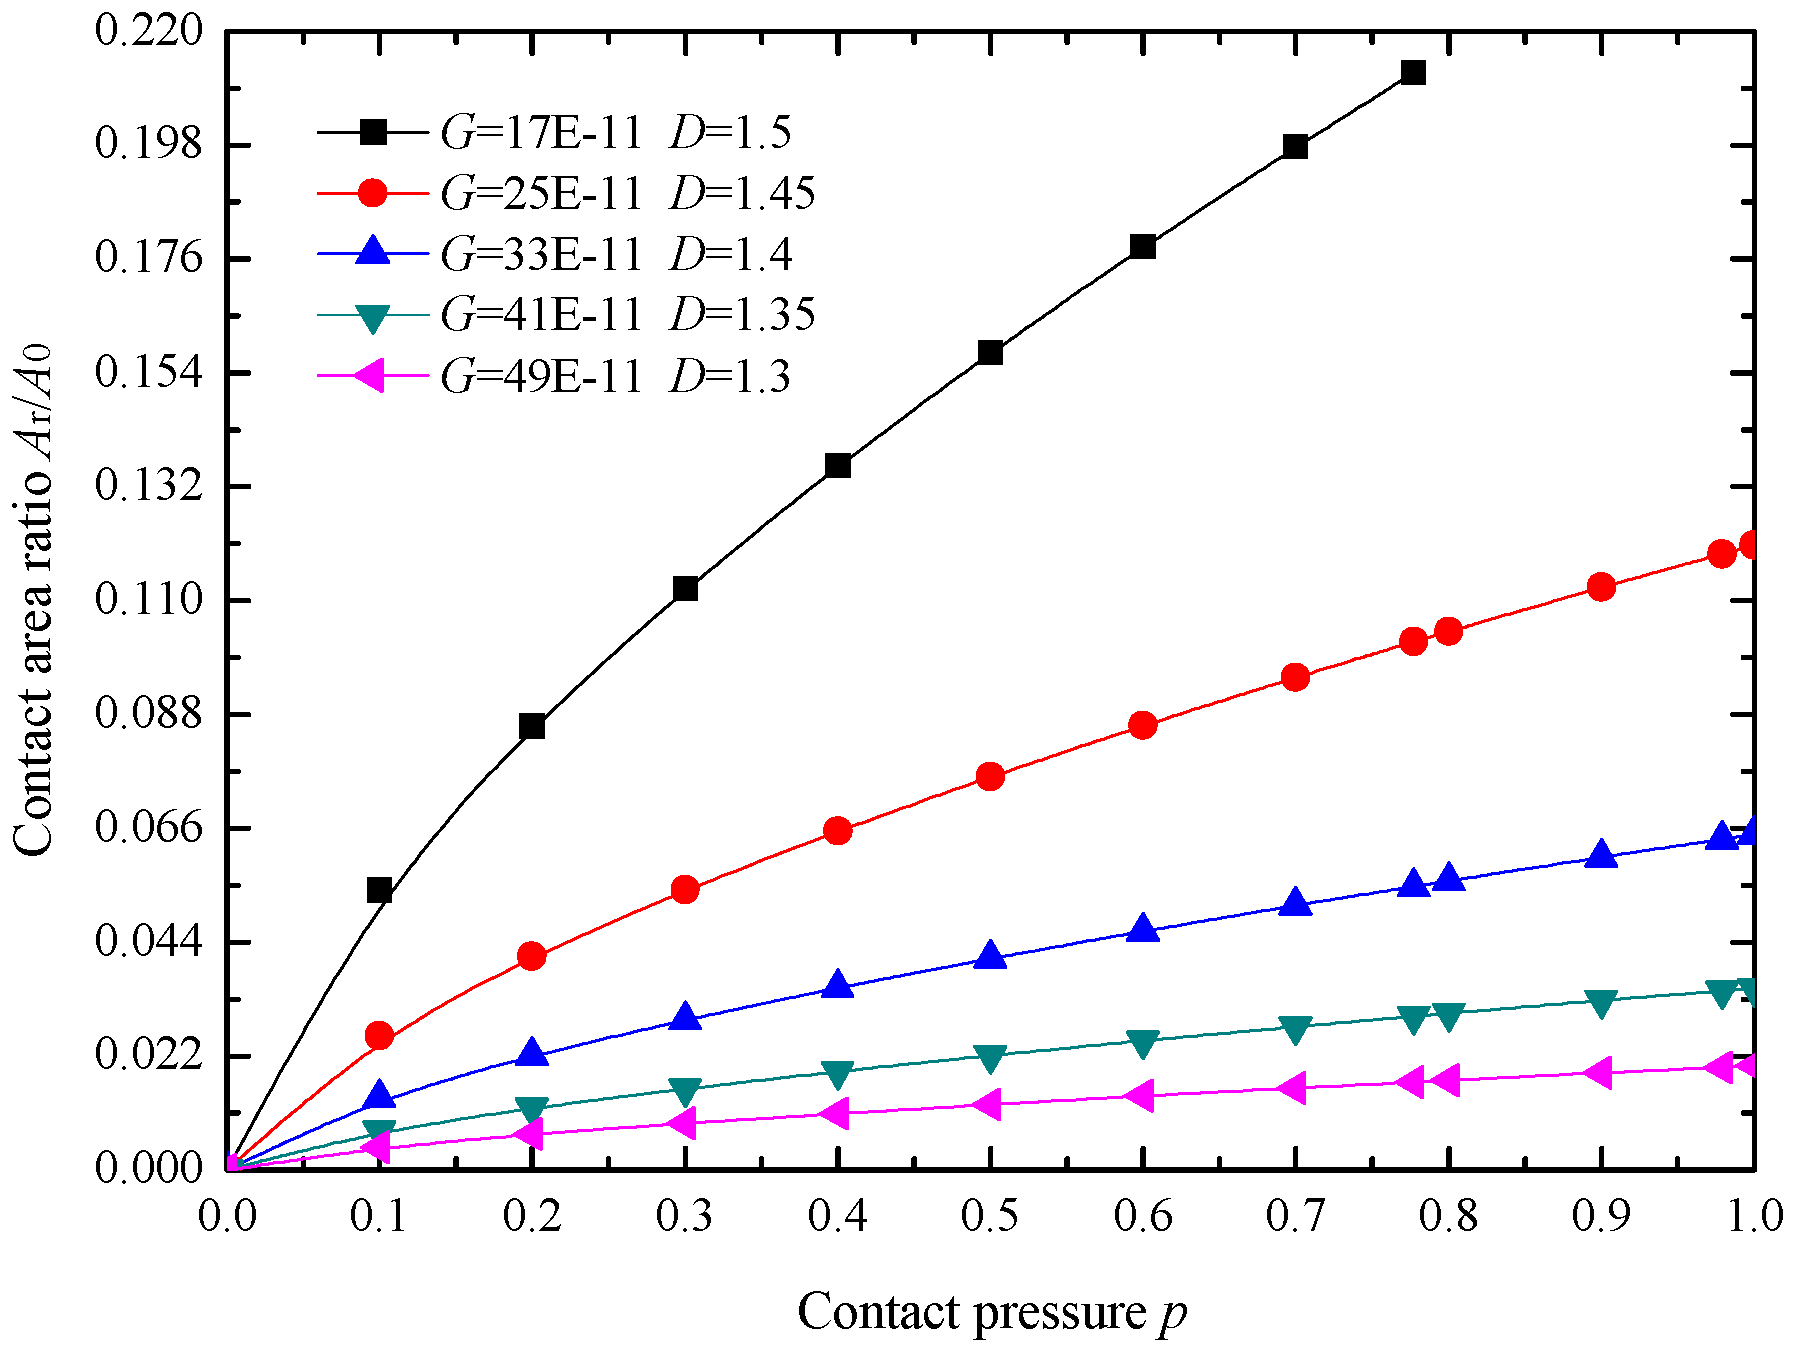
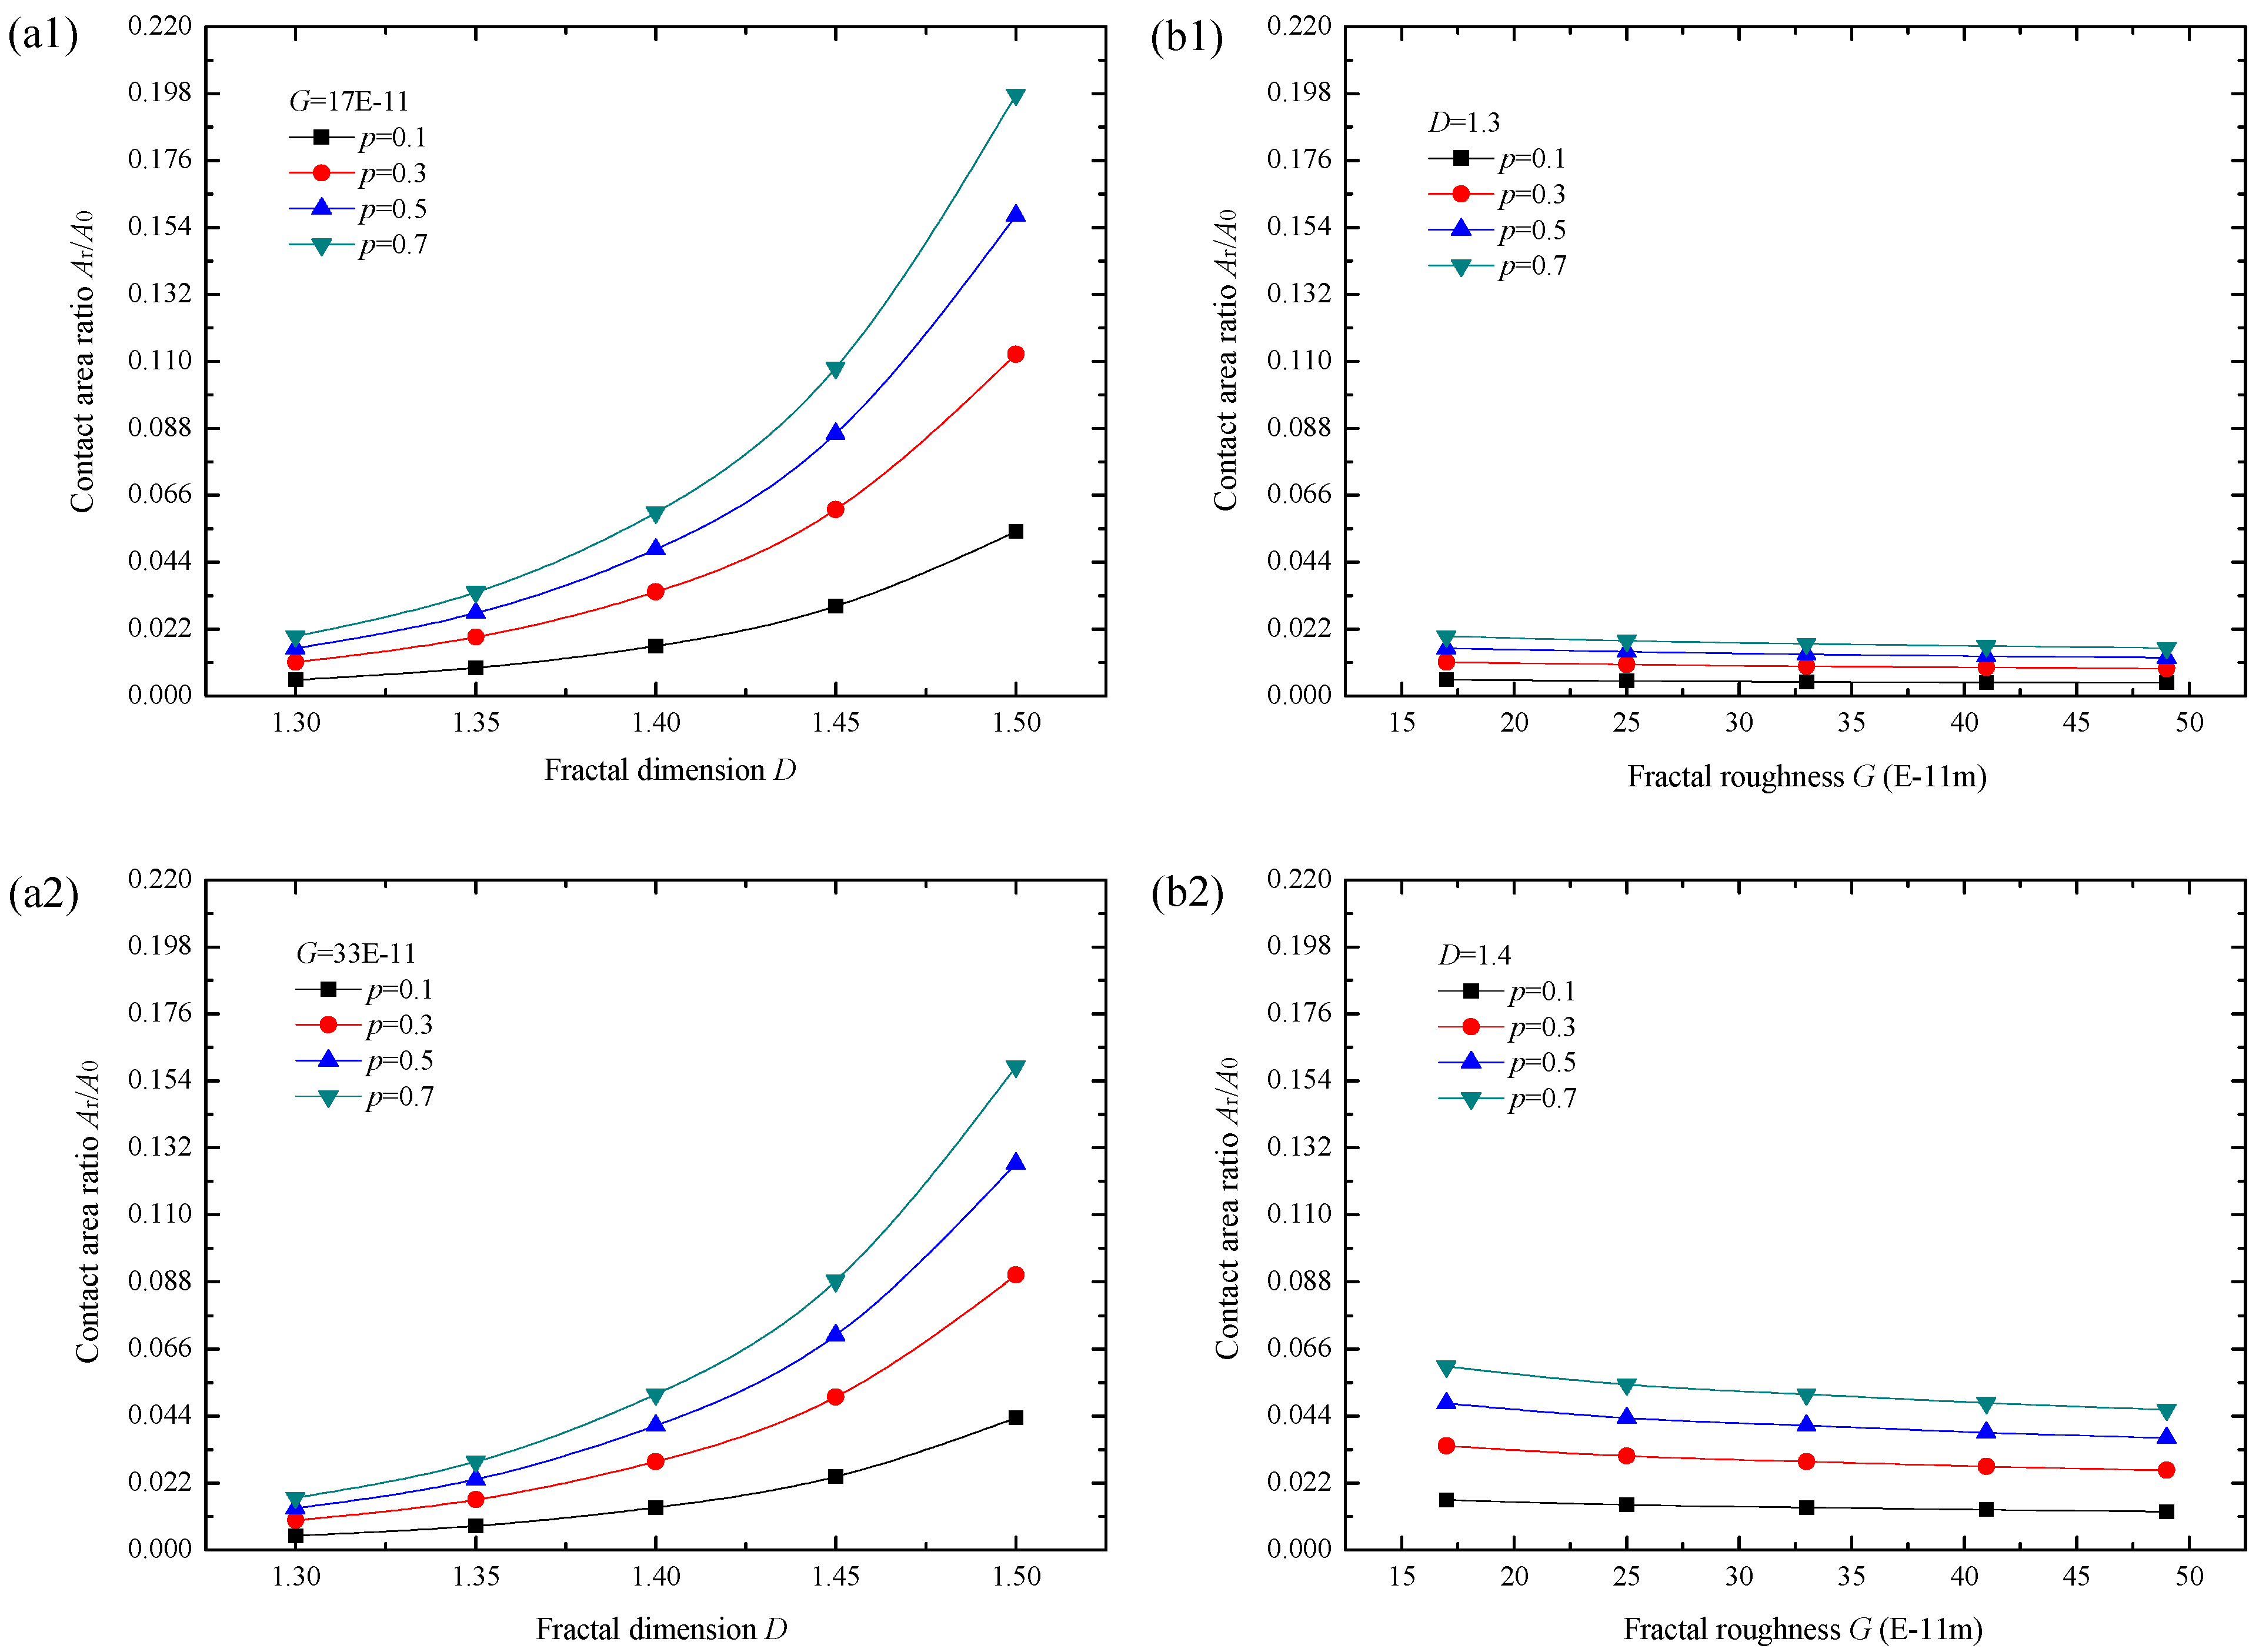
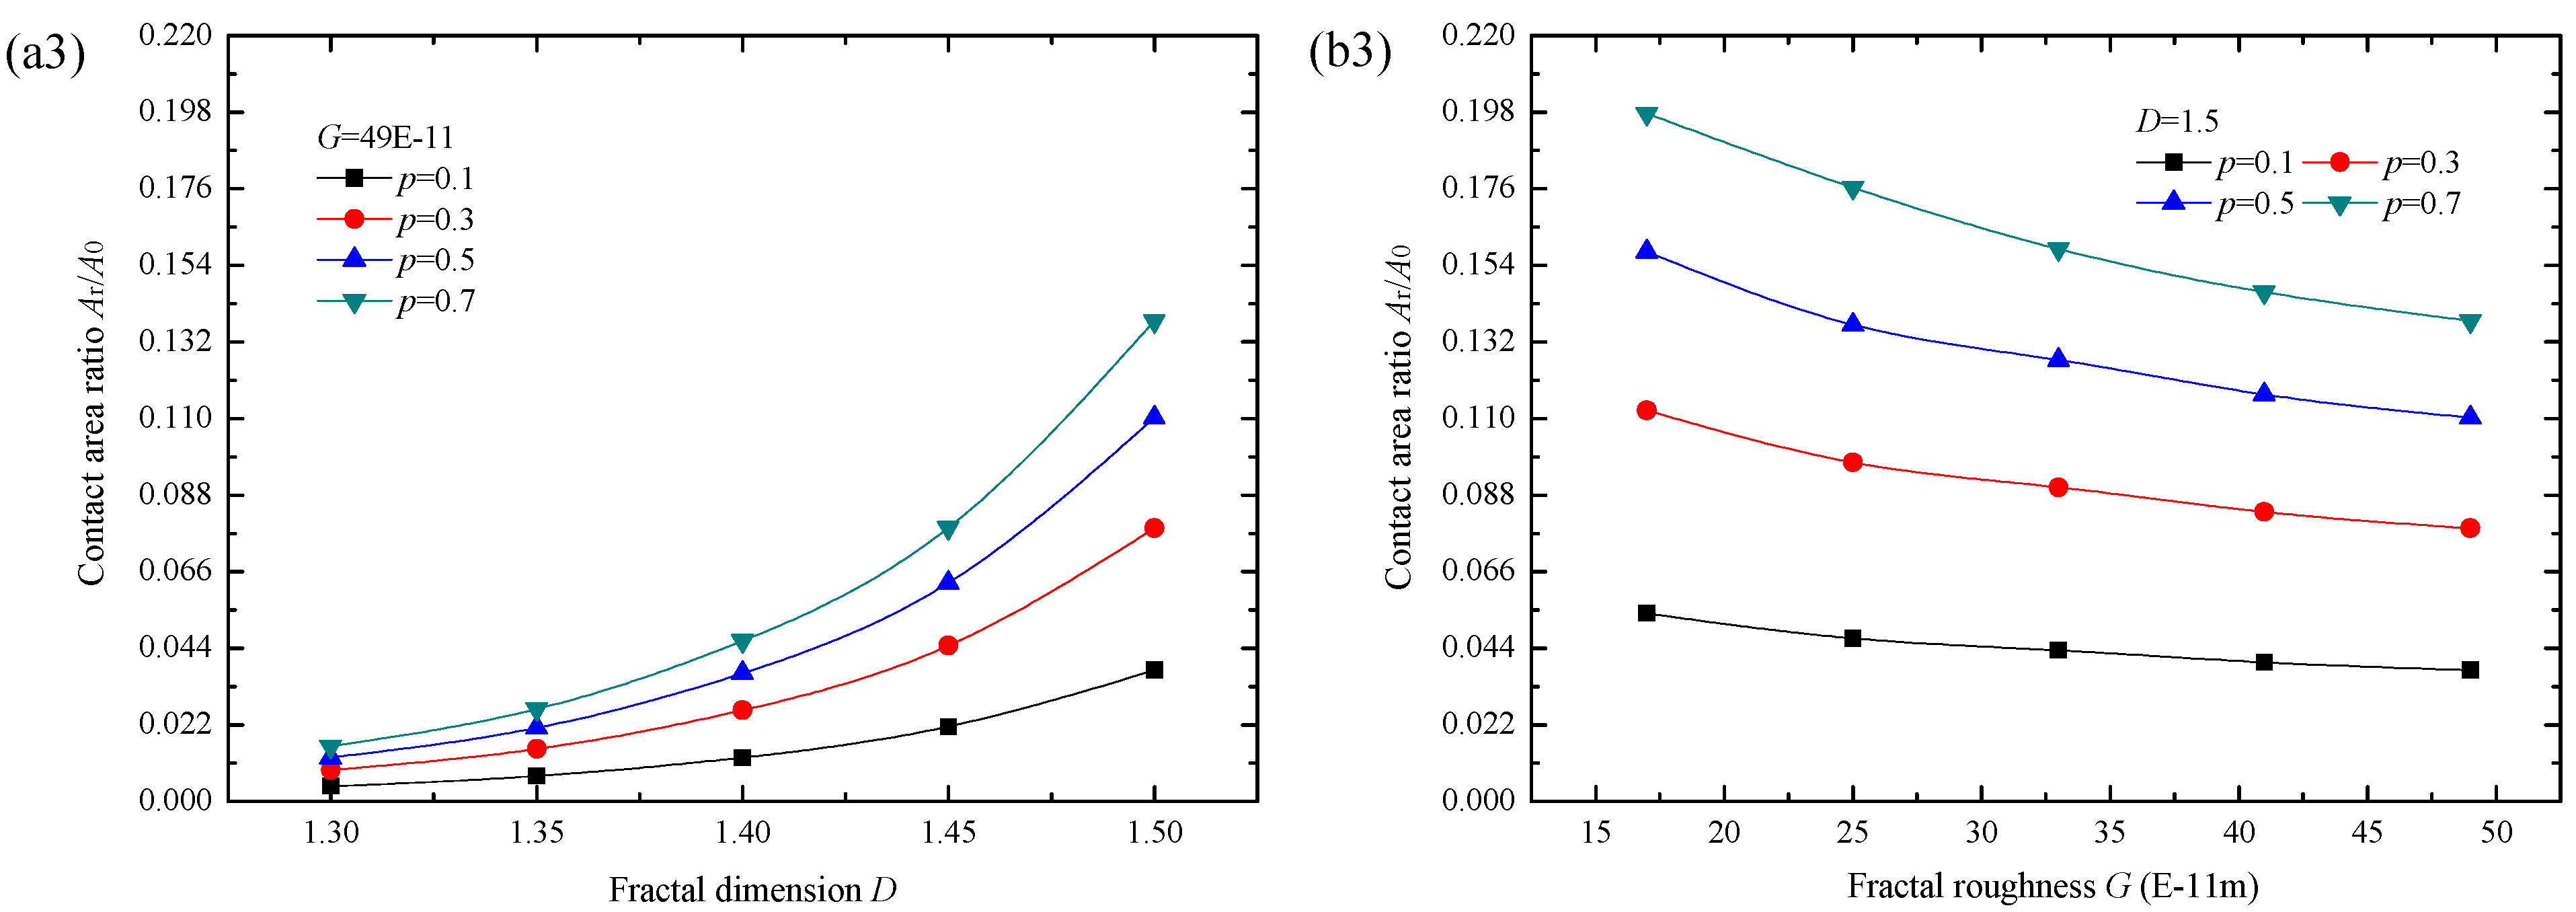
5.2. Contact Area Ratio

(1) Influence of contact pressure on Ar/A0
As shown in Figure 14, with the addition of contact pressure p, Ar/A0 increases, and the variation of Ar/A0 is closer to linearity with smaller changing amplitude at smaller fractal dimension D and larger fractal roughness G. With the increase of p, the deformation of the asperity increases, resulting in the augment of the real contact area. Smaller D and larger G means the asperity has smaller curvature radius, so the value and increment amplitude of real contact area after compression is smaller, therefore, the value and variation range of Ar/A0 is smaller.
(2) Influence of topography parameters on Ar/A0
As can be seen from Figure 15a1–a3, with the increase of D, Ar/A0 increases gradually, and the growth rate is bigger at smaller G and bigger p. Seen in Figure 15b1–b3, as G becomes bigger, Ar/A0 declines, and it declines more gently at smaller D and smaller p. The influence of surface topography parameters on Ar/A0 is mainly reflected by the curvature radius of surface asperity and the real contact area after deformation. From Figure 15 it is found that the influence of fractal dimension D on Ar/A0 is greater than that of fractal roughness G.
Through the research, the contact condition and porosity of rough sealing surface can be better understood. In practice, by combining these findings and the specific working requirements (better lubrication or lower leakage), we can choose a rougher or smoother surface so as to determine the corresponding surface processing method. On the basis of the given surfaces, by measuring the relevant parameters and calculating according to the established model, the contact pressure under which the sealing surface has no percolation or has appropriate lubrication can be calculated.

6. Conclusions

(1) The contact state and porosity of rough sealing surfaces were analyzed. Through numerical calculation and simulation, it was found that when the topography parameters of two rough surfaces are the same or similar, the contact should be considered shoulder-shoulder rather than top-top.
(2) The geometric model for the shoulder-shoulder contact and contact mechanical model for rough surfaces were established, and the deformation of asperity, the real contact area and contact load of rough sealing surface were discussed. By comparison with other methods, the present contact mechanics model was verified.
(3) The change rules of porosity ϕ with contact pressure p and topography parameters were obtained: Porosity decreases with the increase of p; larger fractal dimension D and smaller fractal roughness G correspond to larger initial porosity but faster and larger decrease of porosity; with the increment of D, porosity increases first and then decreases on the whole, and smaller fractal roughness G corresponds to larger porosity reduction; as the fractal roughness G becomes bigger, all the porosity increases, and larger D corresponds to a larger difference and change of porosity.
(4) The change rules of contact area ratio Ar/A0 with contact pressure p and topography parameters were achieved: With the addition of contact pressure p, Ar/A0 increase, and the variation of Ar/A0 is closer to linearity with smaller changing amplitude at smaller fractal dimension D and larger fractal roughness G; with the increase of D, Ar/A0 increases gradually, and the growth rate is bigger at smaller G and bigger p; as G becomes bigger, Ar/A0 declines, and it declines more gently at smaller D and p; the influence of fractal dimension D on Ar/A0 is greater than that of fractal roughness G.
(5) The findings of this paper could be further verified by comparing the porosity obtained by the established model with the results obtained by 3D reconstruction and finite element analysis, and the leakage or lubrication of sealing surface also could be studied, all which need further in-depth research.

Author Contributions

Conceptualization, Q.Y. and J.S.; data curation, Q.Y.; formal analysis, Q.Y. and Z.J.; funding acquisition, J.S. and Z.J.; investigation, Q.Y.; methodology, Q.Y. and J.S.; project administration, J.S.; resources, Z.J.; supervision, J.S.; validation, Q.Y.; writing-original draft, Q.Y.; writing—review & editing, Q.Y., J.S. and Z.J. All authors have read and agreed to the published version of the manuscript.

Funding

This work is financially supported by National Natural Science Foundation of China (No.52075268), National Key Research and Development Program of China (No.2018YFB2000800) and Project of Huai’an Science and Technology Bureau (No.HAB202069).

Data Availability Statement

Not applicable.

Conflicts of Interest

The authors declare no conflict of interest.

References

  1. Zmarzły, P. Multi-Dimensional Mathematical Wear Models of Vibration Generated by Rolling Ball Bearings Made of AISI 52100 Bearing Steel. Materials 2020, 13, 5440. [Google Scholar] [CrossRef] [PubMed]
  2. Hertz, H. Über die Berührung fester elastischer Körperü. J. Die Reine Angew. Math. 1882, 92, 156–171. [Google Scholar]
  3. Greenwood, J.A.; Williamson, J.B.P. Contact of nominally flat surfaces. Proc. R. Soc. Lond. 1966, 295, 300–319. [Google Scholar]
  4. Greenwood, J.A.; Tripp, J.H. The elastic contact of rough spheres. ASME J. Appl. Mech. 1967, 34, 153–159. [Google Scholar] [CrossRef]
  5. Bush, A.W.; Gibson, R.D.; Keogh, G.P. Strong anisotropic rough surface. ASME J. Tribol. 1979, 101, 15–20. [Google Scholar]
  6. Pullen, J.; Williamson, J.B.P. On the plastic contact of rough surfaces. Proc. R. Soc. Lond. 1972, 327, 159–173. [Google Scholar]
  7. Chang, W.R.; Etsion, I.; Bogy, D.B. An elastic-plastic model for the contact of rough surfaces. ASME J. Tribol. 1987, 109, 257–263. [Google Scholar] [CrossRef]
  8. Zhao, Y.W.; Chang, L. An model of asperity interactins in elastic-plastic contact of rough surfaces. ASME J. Tribol. 2001, 123, 857–864. [Google Scholar] [CrossRef]
  9. Zhao, Y.; Maietta, D.M.; Chang, L. An asperity microcontact model incorporating the transition from elastic deformation to fully plastic flow. J. Tribol. 2000, 122, 86–93. [Google Scholar] [CrossRef]
  10. Ciavarella, M.; Greenwood, J.A.; Paggi, M. Inclusion of "interaction" in the Greenwood and Williamson contact theory. Wear 2008, 265, 729–735. [Google Scholar] [CrossRef]
  11. Vakis, A.I. Asperity Interaction and substrate deformation in statistical summation models of contact between rough surfaces. J. Appl. Mech. Trans. ASME 2014, 81, 041012. [Google Scholar] [CrossRef]
  12. Tian, X.; Wang, W.; Fu, W.; Gao, Z.; Lou, L.; Wu, J.; Li, P. Contact Stiffness Model of Mechanical Joint Surfaces Considering the Asperity Interactions. J. Mech. Eng. 2017, 17, 149–159. [Google Scholar] [CrossRef]
  13. Song, H.; Vakis, A.; Liu, X.; Van der Giessen, E. Statistical model of rough surface contact accounting for size-dependent plasticity and asperity interaction. J. Mech. Phys. Solids 2017, 106, 1–14. [Google Scholar] [CrossRef] [Green Version]
  14. Etsion, I.; Kligerman, Y.; Kadin, Y. Unloading of an elastic-plastic loaded spherical contact. Int. J. Solids Struct. 2005, 42, 3716–3729. [Google Scholar] [CrossRef]
  15. Kadin, Y.; Kligerman, Y.; Etsion, I. Multiple loading-unloading of an elastic-plastic spherical contact. Int. J. Solids Struct. 2006, 43, 7119–7127. [Google Scholar] [CrossRef] [Green Version]
  16. Shi, J.; Cao, X.; Hu, Y.; Zhu, H. Statistical analysis of tangential contact stiffness of joint surfaces. Arch. Appl. Mech. 2015, 85, 1997–2008. [Google Scholar] [CrossRef]
  17. Xiao, H.F.; Sun, Y.Y. On the normal contact stiffness and contact resonance frequency of rough surface contact based on asperity micro-contact statistical models. Eur. J. Mech. A Solids 2019, 75, 450–460. [Google Scholar] [CrossRef]
  18. Song, Z.; Komvopoulos, K. Adhesive contact of an elastic semi infinite solid with a rigid roughsurface: Strength of adhesion and contact instabilities. Int. J. Solids Struct. 2014, 51, 1197–1207. [Google Scholar] [CrossRef] [Green Version]
  19. Jin, F.; Zhang, W.; Wan, Q.; Guo, X. Adhesive contact of a power law graded elastic half-space with arandomly rough rigid surface. Int. J. Solids Struct. 2016, 81, 244–249. [Google Scholar] [CrossRef]
  20. Xiao, H.F.; Sun, Y.; Xu, J.W. An elastoplastic contact model for rough surface contact with continuous, monotonous and smooth stiffness. J. Cent. South Univ. (Sci. Technol.) 2019, 50, 1343–1350. [Google Scholar]
  21. Zhu, S.G.; Ni, L.Y. A Static Friction Model for Unlubricated Contact of Random Rough Surfaces at Micro/Nano Scale. Micromachines 2021, 12, 368. [Google Scholar] [CrossRef]
  22. Majumdar, A.; Bhushan, B. Fractal model of elastic-plastic contact between rough surfaces. J. Tribol. Trans. ASME 1991, 113, 1–11. [Google Scholar] [CrossRef]
  23. Wang, S.; Komvopoulosk, K. A fractal theory of the interfacial temperature distribution in the slow sliding regime: Part I elastic contact and heat transfer analysis. ASME J. Tribol. 1994, 116, 812–823. [Google Scholar] [CrossRef]
  24. Yan, W.; Komvopoulos, K. Contact analysis of elastic-plastic fractal surfaces. J. Appl. Phys. 1998, 84, 3617–3624. [Google Scholar] [CrossRef]
  25. Zhu, Y.Q.; Ma, B.J.; Jiang, L.Y. The elastic elastoplastic and plastic fractal contact models for rough surface. J. Xi’an Inst. Technol. 2001, 21, 150–157. [Google Scholar]
  26. Miao, X.M.; Huang, X.D.; Yuan, H. Fractal Contact Model of Joint Interfaces Considering Elastic-plastic Deformation of Asperities. J. Agric. Mach. 2013, 1. [Google Scholar]
  27. Tian, H.; Yu, Y.; Chen, T.; Zheng, J.; Zhang, Y.; Zhao, C. Contact Problem Between Two Spheres Considering Surface Roughness and Geometrical Curvature. J. Xi’an Jiaotong Univ. 2016, 50, 1–7. [Google Scholar]
  28. Liu, P.; Zhao, H.; Huang, K.; Chen, Q. Research on normal contact stiffness of rough surface considering friction based on fractal theory. Appl. Surf. Sci. 2015, 349, 43–48. [Google Scholar] [CrossRef]
  29. Morag, Y.; Etsion, I. Resolving the contradiction of asperities plastic to elastic mode transition in current contact models of fractal rough surfaces. Wear 2007, 262, 624–629. [Google Scholar] [CrossRef]
  30. Liou, J.L.; Chi, M.T.; Lin, J.F. A microcontact model developed for sphere- and cylinder-based fractal bodies in contact with a rigid flat surface. Wear 2010, 268, 431–442. [Google Scholar] [CrossRef]
  31. Huang, J.; Gao, C.; Chen, J.; Zeng, X. Analysis of real contact area between an elasto-plastic rough body and an elasto-plastic flat body. Proc. Inst. Mech. Eng. Part J J. Eng. Tribol. 2014, 228, 1174–1179. [Google Scholar] [CrossRef]
  32. Liu, Y.; Wang, Y.; Chen, X.; Yu, H. A spherical conformal contact model considering frictional and microscopic factors based on fractal theory. Chaos Solitons Fractals 2018, 111, 96–107. [Google Scholar] [CrossRef]
  33. Yuan, Y.; Zhang, L.H.; Xu, Y.Q. Mechanical Model of Contact between a Sphere-Based Fractal Rough Surface and a Rigid Flat Surface. J. Xi’an Jiaotong Univ. 2019, 53, 176–186. [Google Scholar]
  34. Zhang, Y.; Si, L.; Zhang, X.; Li, J.; Wang, W. Investigations of the adhesive contact behavior of elastic layered media with surface roughness. J. Tribol.-Trans. ASME 2019, 141, 044504. [Google Scholar] [CrossRef]
  35. Wang, H.; Jia, P.; Wang, L.; Yun, F.; Wang, G.; Liu, M.; Wang, X. Modeling of the Loading–Unloading Contact of Two Cylindrical Rough Surfaces with Friction. Appl. Sci. 2020, 10, 742. [Google Scholar] [CrossRef] [Green Version]
  36. Sepehria, A.; Farhang, K. Closed-form Equations for three dimensional elastic-plastic contact of nominally flat rough surfaces. ASME J. Tribol. 2009, 131, 041402. [Google Scholar] [CrossRef]
  37. Zhuang, Y.; Li, B.T.; Hong, J.; Yang, G.Q.; Zhu, L.B.; Liu, H.J. A Normal Contact Stiffness Model of the Interface. J. Xi’an Jiaotong Univ. 2013, 47, 180–186. [Google Scholar]
  38. Zhu, L.B.; Zhuang, Y.; Hong, J.; Yang, G.Q. Elastic-Plastic Model for Contact of two Asperities Considering Shoulder-Shoulder Contact. J. Xi’an Jiaotong Univ. 2013, 11, 48–52+104. [Google Scholar]
  39. Hu, Q.; Sun, J.J.; Ma, C.B.; Yu, B. Theoretical Prediction of Mixed Frictional Heat of Mechanical Seals Based on Shoulder-shoulder Contact Model of Asperities. J. Mech. Eng. 2017, 53, 102–108. [Google Scholar] [CrossRef]
  40. Zuo, X.; Zhou, Y.; Ma, C.; Fang, H. Dynamic Identification of Wear State Based on Nonlinear Parameters. Fractals-Complex Geom. Patterns Scaling Nat. Soc. 2019, 27, 1950075. [Google Scholar] [CrossRef]
  41. Ge, S.R.; Zhu, H. Fractal in Tribology; China Machine Press: Beijing, China, 2005. [Google Scholar]
  42. Hill, R. The Mathematical Theory of Plasticity; Oxford University Press: London, UK, 1950. [Google Scholar]
  43. Kucharski, S.; Klimczak, T.; Polijaniuk, A.; Kaczmarek, J. Finite-elements model for the contact of rough surfaces. Wear 1994, 177, 1–13. [Google Scholar] [CrossRef]
  44. Sahoo, P.; Ghosh, N. Finite element contact analysis of fractal surfaces. J. Phys. D Appl. Phys. 2007, 40, 4245–4252. [Google Scholar] [CrossRef]
Figure 1. Contact diagram of smooth plane and rough surface.
Applsci 11 08048 g001
Figure 2. Contact diagram of two rough surfaces.
Applsci 11 08048 g002
Figure 3. Contact of smooth plane and rough asperity.
Applsci 11 08048 g003
Figure 4. Contact of two rough asperities.
Applsci 11 08048 g004
Figure 5. MATLAB simulation of the contact of two rough surfaces.
Applsci 11 08048 g005
Figure 6. Initial porosity obtained by different methods, where D1 = D2 and G1 = G2 = 25 × 10−11m.
Applsci 11 08048 g006
Figure 7. Contact of asperities on rough surface. (a) Actual contact of rough surfaces; (b) Simplified contact of asperities.
Applsci 11 08048 g007
Figure 8. Diagram for contact stress.
Applsci 11 08048 g008
Figure 9. Diagram of coordinate transformation.
Applsci 11 08048 g009
Figure 10. Schematic diagram of inclined plane contact area.
Applsci 11 08048 g010
Figure 11. Comparison of established model with other models.
Applsci 11 08048 g011
Figure 12. Change of porosity with contact pressure p.
Applsci 11 08048 g012
Figure 13. Change of porosity with (a1a3) fractal dimension D; (b1b3) fractal roughness G.
Applsci 11 08048 g013
Figure 14. Change of Ar/A0 with contact pressure p.
Applsci 11 08048 g014
Figure 15. Change of Ar/A0 with (a1a3) fractal dimension D; (b1b3) fractal roughness G.
Applsci 11 08048 g015aApplsci 11 08048 g015b
Publisher’s Note: MDPI stays neutral with regard to jurisdictional claims in published maps and institutional affiliations.

