Article

Synthesis and Application of the Magnetic Nanocomposite GO-Chm for the Extraction of Benzodiazepines from Surface Water Samples Prior to HPLC-PDA Analysis

by
Orfeas-Evangelos Plastiras
1,
Eleni Deliyanni
2 and
Victoria Samanidou
1,*
1
Laboratory of Analytical Chemistry, Department of Chemistry, Aristotle University of Thessaloniki, 541 24 Thessaloniki, Greece
2
Laboratory of Chemical and Environmental Technology, Department of Chemistry, Aristotle University of Thessaloniki, 541 24 Thessaloniki, Greece
*
Author to whom correspondence should be addressed.
Appl. Sci. 2021, 11(17), 7828; https://doi.org/10.3390/app11177828
Submission received: 30 June 2021 / Revised: 18 August 2021 / Accepted: 24 August 2021 / Published: 25 August 2021
(This article belongs to the Special Issue Advances in Magnetic Nanomaterials and Nanostructures)

Abstract

:

Featured Application

Authors are encouraged to provide a concise description of the specific application or a potential application of the work. This section is not mandatory.

Abstract

Nowadays, the interest in preparing new, cheap and simple adsorbents that are used in sample preparation is on the rise. Graphene oxide (GO) nanomaterials and nanocomposites have become increasingly popular due to the novel methods of syntheses that have been published. Owing to their vast specific surface area and their π-delocalized electron system they possess, they are appropriate for the adsorption of a variety of aromatic organic compounds, being utilized either as adsorbents in analytical methods or as filter materials for the removal of pollutants in water. Pharmaceutical compounds, such as benzodiazepines, end up in surface waters caused by consumption or their disposal through sewage, thus becoming pollutants. In the present study, an analytical method has been developed and validated for the determination of two model-analytes of benzodiazepines by HPLC-DAD and their sample preparation protocol which consists of the Stir bar magnetic solid phase extraction (SB-MSPE) method, evaluating therefore the nanocomposite material as a decent adsorbent. The separation took place with the usage of an analytical column C18 RP-HPLC in 10 min. For the alprazolam (ALP) and the flunitrazepam (FLT), the LODs and LOQs were 3 ng/mL and 10 ng/mL, respectively, while the relative recoveries ranged between 93.6–112.9% and the RSDs were 1.11–9.50%. Finally, the material was examined for its reusability and was found that it can be used for over eight cycles of extraction/elution.

1. Introduction

Benzodiazepines (BZs) belong in a category of pharmaceuticals that are used for their anxiolytic, hypnotic, antispasmodic and muscle relaxant properties. Since the 1960s, their use has increased, replacing both meprobamate and barbiturates that were used to treat stress, but they had different clinical effects in each organism and posed significant health risks. From 1977 onwards, diazepam (Valium) became the most commonly prescribed drug in the USA. Then, reports of abuse and addiction were reported that had a huge impact on their buying and selling. Therefore, a decrease in benzodiazepine consumption was seen in the 1980s and 1990s due to the side effects and the potential for the user to become addicted. [1,2] Alprazolam belongs to the group of triazolobenzodiazepines and it is the main component of Xanax® pills, which are used to treat general forms of stress, depression and panic, while flunitrazepam under the brand name Rohypnol is a potent sedative, hypnotic and amnestic drug that is used to treat insomnia and belongs to the 7-nitrobenzodiazepines group [3]. Both drugs interact with the receptors of γ-aminobutyric acid (GABA), enhancing their activity by opening a chloride ions channel that hyperpolarizes the neurons of the brain in the extracellular area [1,2,4].
After their consumption by humans, they are incompletely absorbed and metabolized. Thus, the portion that remains unabsorbed, or their metabolites, is exerted into the environment through feces or urine, ending up in sewage waters. Wastewater treatment plants (WWTPs) cannot fully remove their presence in water, hence some of them are detected in surface water samples [5]. Bisphenol A [6], hormones [7], polycyclic aromatic hydrocarbons [8] and benzodiazepines [9] are some of the compounds that are detected in surface water at concentrations of ng/L, posing many risks for aquatic organisms and their environment. Consequently, there is a need to develop new analytical methods with the utilization of novel and green microextraction techniques that use inexpensive and easily prepared materials [10,11].
Carbon-based nanomaterials and nanocomposites fulfill the requirements discussed above, while also being ideal for the extraction of small organic molecules, preferably aromatic compounds due to the π–π interactions that take place, and of metal ions because of their rich surface chemistry and the variety of functional groups they possess [12,13]. Therefore, they can be used as adsorbents in a variety of microextraction techniques, such as stir bar sorptive dispersive microextraction (SBSDME) [14] or magnetic solid phase extraction (MSPE) [15].
After the study of five different magnetic graphene oxide nanocomposite materials as adsorbents, considering all the above factors and the occurrence of benzodiazepines in environmental water samples, the nanocomposite of graphene oxide with magnetic chitosan (GO-Chm) was used due to the highest recoveries it achieved, and it was prepared in two forms (powder and beads) in this work for the stir bar magnetic solid phase extraction of alprazolam (ALP) and flunitrazepam (FLT), two model analytes that belong in two different groups, from surface water samples and their determination by HPLC-PDA. The main reason behind the use of magnetic chitosan with GO is the plethora of functional groups (carboxylic, hydroxyl and amino groups) that can be exploited to adsorb certain pharmaceutical compounds from water samples without the undesired swelling undergone by chitosan. Therefore, for the scope of this study, which was the development and validation of an HPLC-PDA analytical method by utilizing GO-Chm as an extraction media for the two benzodiazepines, we examined the parameters that affect them so as to obtain the optimum conditions and the highest possible recoveries, with high precision and high accuracy.

2. Materials and Methods

2.1. Materials and Reagents

Acetonitrile (ACN) for HPLC was purchased from ChemLab (Zedelgem, Belgium), Methanol (MeOH) for HPLC was from VWR (Gliwice, Poland), Xanax® of 1 mg of Alprazolam (ALP) was from Pfizer (Athens, Greece), Flunitrazepam (FLT), FeCl2∙4H2O, FeCl3∙6H2O, Chitosan of high molecular weight and glutaraldehyde were bought from Sigma-Aldrich (Steinheim, Germany), Sodium Alginate (SA) was from Panreac (Barcelona, Spain) and Calcium Chloride, Sodium Chloride, Acetic Acid (glacial) and Sodium Acetate were purchased from Merck KGaA (Darmstadt, Germany). Graphene oxide (GO) was synthesized using a modified Hummers method.

2.2. Instrumentaion and Chromatographic Conditions

An LC-09 AD pump by Shimadzu (Kyoto, Japan) was used for the delivery of the mobile phase to the analytical column at a flow rate of 0.8 mL/min. A system of solvent mixing FCV-9A by Shimadzu (Kyoto, Japan) and a set-up of their degassing with He by the system of DGU-2A by Shimadzu (Kyoto, Japan) was used. Chromatographic separation was achieved isocratically in a Kromasil 100-5C18 (250 × 4 mm, 5 μm) analytical column (Seibersdorf Labor GmbH, Seibersdorf, Austria) at room temperature with ACN/H2O at a volume ratio of 50:50% v/v as mobile phase. The samples were injected with the help of an autosampler SIL-9A by Shimadzu (Kyoto, Japan) and detection was achieved at the wavelength of 230 nm by a Photodiode Array Detector SPD-M6A by Shimadzu (Kyoto, Japan). The software of the computer that was used was Class-M10A by Shimadzu (Kyoto, Japan).

2.3. Preparation of the Adsorbents

2.3.1. Synthesis of Magnetic Graphene Oxide Nanocomposites for Their Comparison as Adsorbents in the Extraction of the Two Benzodiazepines

The synthesis of powdered magnetic graphene oxide (mGO), powdered magnetic graphene oxide with polystyrene (mGO-PS), powdered magnetic activated carbon (BAX), powdered magnetic graphene oxide with polyaniline (mGO-PANI) and powdered graphene oxide with magnetic chitosan (GO-Chm) was performed according to references [16,17,18,19,20]. These five nanocomposites were studied as a possible type of adsorbent for the extraction of ALP and FLT from surface water samples. GO-Chm gave the best results, so it was studied in two forms: powdered and in beads.

2.3.2. Synthesis of Graphene Oxide-Magnetic Chitosan Nanocomposite (GO-Chm)

The nanocomposite of GO-Chm in the form of powder was prepared by following the procedure suggested by Kyzas et al. [16]. In brief, 2 g of pure chitosan was dissolved in a solution of 100 mL 2% v/v acetic acid and the mixture was ultrasonicated for 30 min. Afterwards, 0.75 g of Fe3O4 magnetic nanoparticles were put into the chitosan solution, following its stirring for 2 h. Then, 15 mL of 50 w/w aquatic glutaraldehyde were added to the reaction flask, acting as a cross-linking agent, along with 1.5 g of GO. The pH value of the solution was adjusted to 9–10 and it was stirred for 1 h at 80 °C. The black precipitate was washed three times with ethanol and deionized water and dried in a vacuum oven at 50 °C. Lastly, the nanocomposite that was obtained was ground to a fine powder in a mortar, with a size of 75–125 μm after sieving.

2.3.3. Synthesis of Graphene Oxide-Magnetic Chitosan/Sodium Alginate Beads (GO-Chm@SA)

For the insertion of the GO-Chm powder nanocomposite in sodium alginate (SA) beads, the procedure of Lazaridis et al. [21] was followed. Quantity of 1 g of sodium alginate was added in 100 mL deionized water, preparing a solution of 1% w/v and heating it at 60 °C until all of the solid was dissolved and a gel was formed. Then, appropriate amounts of GO-Chm were added to the gel, according to the % w/w that was desirable. In this work, 0.5%, 1% and 2% w/w of beads were prepared by adding 0.5, 1 and 2 g of the nanocomposite. Then, with the use of a Pasteur pipette, with a diameter of 1.46 mm, the gel was sucked and dropped in the form of droplets in an aquatic medium of 250 mL 0.3 M CaCl2∙2H2O, at an ideal distance of 6 cm between the surface of the medium and the pipette tip. The formed beads (Figure 1) were stirred in the calcium bath for 24 h and before each application, they were washed three times with deionized water to remove any excess of calcium ions and were left to dry in a filter paper.

2.4. Preparation of Standard Solutions

Stock solutions of 100 ng/μL were prepared by dissolving appropriate amounts of ALP and FLT in methanol. Specifically for ALP, a pill of Xanax® containing 1 mg of ALP was ground in a mortar, dissolved in methanol and filtered through a common filter paper to remove suspended solids. Then, mixtures of ALP and FLT in methanol of 1 and 10 ng/μL were prepared for their usage in spiking deionized water and surface water samples with low amounts. Five calibration points were used at concentrations of 10–250 ng/mL. Stock solutions were stored at 4 °C.

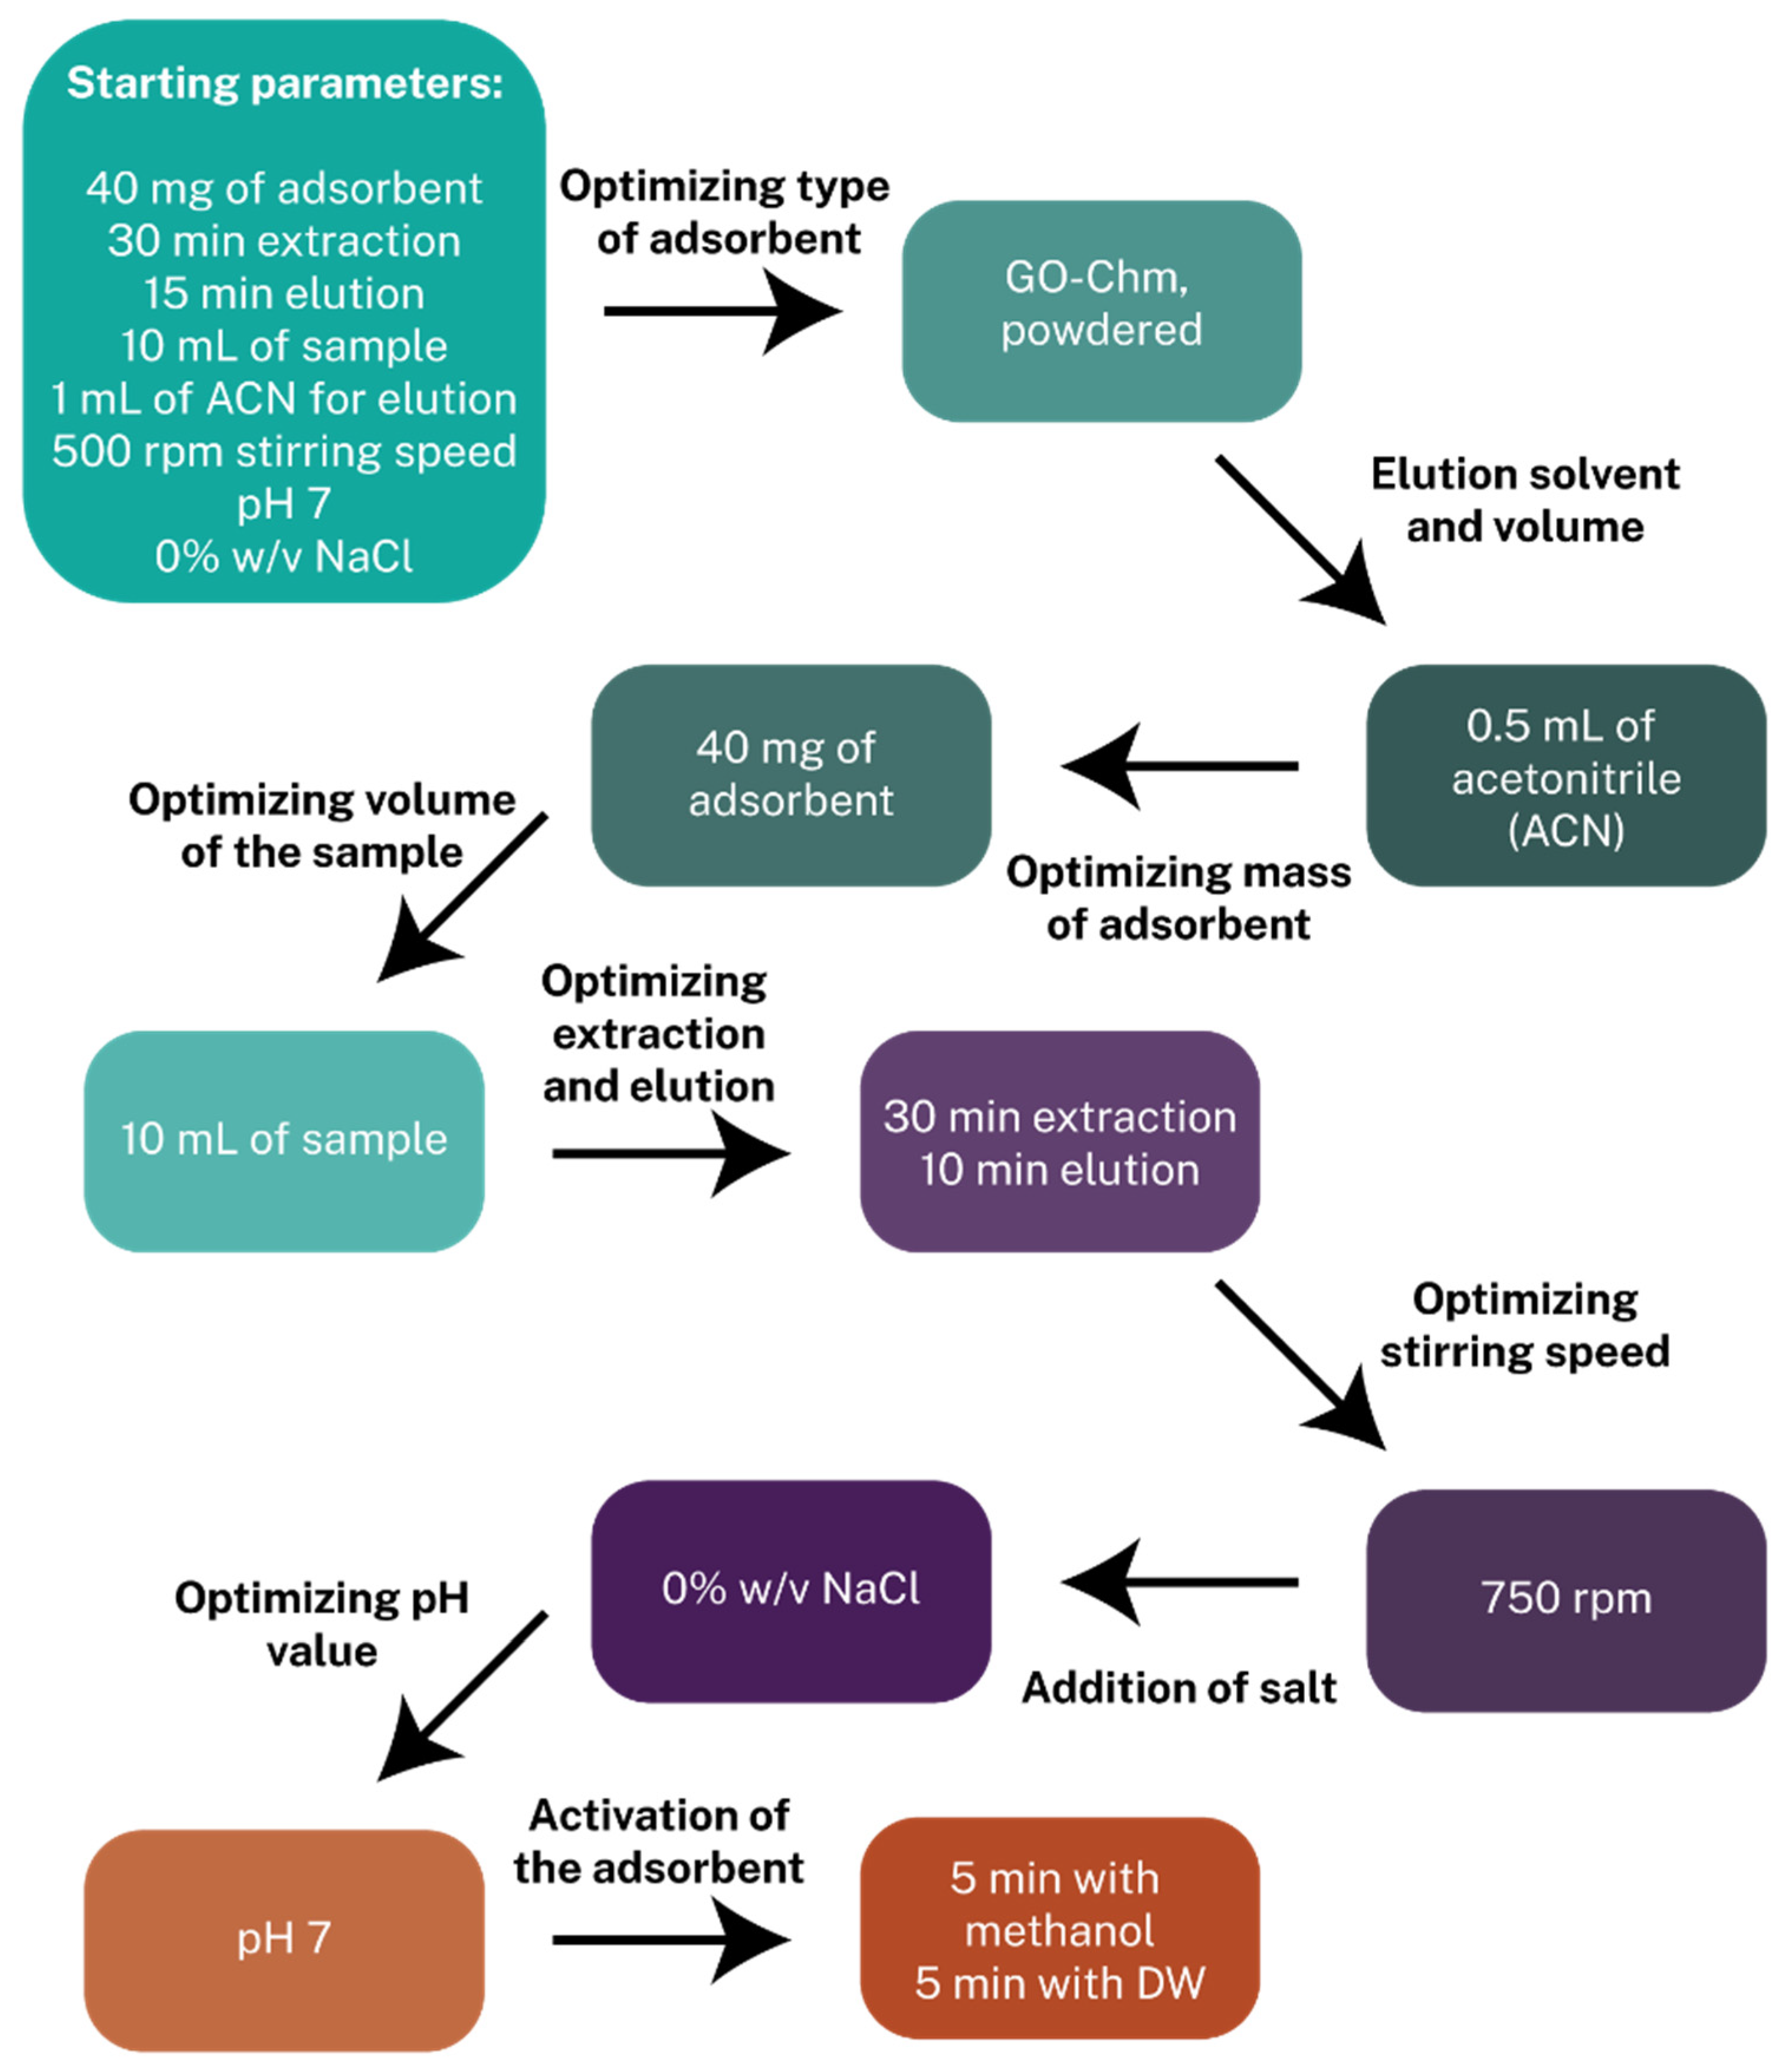
2.5. Optimization of the Stir Bar Magnetic Solid Phase Extraction Procedure

Prior to the extraction phase, 40 mg of the nanocomposite GO-Chm powder or beads were added in 2 mL of methanol for 5 min, under stirring with the help of a stir bar magnet inside the solution and a magnetic stirrer which was set at 750 rpm. Then, with the help of an external Nd magnet, the adsorbent was suspended while the liquid was decanted and 2 mL of deionized water were put for 5 min, under stirring, to remove any excess of the organic solvent that would impair the extraction. Once again, the magnetic separation took place and 10 mL of the surface water sample were added to the vial, along with the desirable amount of spiked stock solution (50–250 μL, depending on the concentration) for 30 min, under stirring. The external magnet was used for the decanting of the liquid sample and the avoidance of any loss of the adsorbent. Then, 0.5 mL of ACN was added to the vial for the elution for 10 min, under stirring. Lastly, the Nd magnet was used to acquire the eluent with the help of a microneedle of 1 mL and its filtration using a 0.22 μm membrane filter. The filtered eluent was put in the autosampler vials and injected to the column for the chromatographic separation and quantification of the two benzodiazepines.
A wide range of parameters were examined to maximize the extraction efficiency of the stir bar magnetic solid phase extraction (SB-MSPE) method, such as (i) the type of adsorbent, (ii) the volume and type of elution solvent, (iii) the mass of the adsorbent, (iv) the volume of the sample, (v) the duration of extraction and elution, (vi) the effect of stirring, its speed and the application of ultrasonication, (vii) the addition of salt, (viii) the value of pH and (ix) the effect of the activation of the adsorbent. Additionally, the reusability of the adsorbent was studied and was found that it can be applied at least 8 times.

2.6. Validation of the Analytical Method

The SB-MSPE-HPLC-PDA method was validated in terms of linearity, precision, accuracy, sensitivity and selectivity.
Linearity studies were performed by analyzing each concentration three times, covering the whole working range. The construction of the calibration curves of the two BZs was accomplished by plotting the peak area versus the concentration. For the calculation of the slopes, intercept and coefficients of determination, least square linear regression analysis was used. The limit of quantification (LOQ) was equal to the concentration of the first starting point of the calibration curve, while the limit of detection was calculated via the equation of LOQ = 3.3 LOD.
Accuracy and precision were studied in three different concentrations, 25, 50 and 100 ng/mL, in spiked water samples. Relative recoveries (Rrel%) were calculated by the formula of (mean concentration found/theoretical concentration spiked * 100). The precision was stated as the standard deviation (SD) between nominal and measured concentrations. Intraday or within-day experiments consisted of the triplicate analysis (n = 3) of each level of concentration in the duration of one day, while interday or between-day experiments were conducted by analyzing each level twice for four consecutive days.

2.7. Application to Real Samples

The method was used for the determination of ALP and FLT in five surface water samples that were collected from the rivers of Sperchios and Gorgopotamos of the province of Fthiotida, Greece on 27 March 2021 (River Water, RW 1 and RW 2, respectively), from the dock of Stylida and the sea of Karavomylos of the same province on 29 March 2021 (Sea Water, SW 1 and SW 2, respectively) and the sea of Aretsou of the Municipality of Kalamaria, Thessaloniki, Greece on 25 May 2021 (SW 3).
Each sample was vacuum filtered with a membrane filter of 0.22 μm for the removal of microorganisms and precipitates. Nine analyses were conducted for each sample, three without the addition of a stock solution, three with the spiking of 25 ng/mL and three times with the spiking of 50 ng/mL.

3. Results

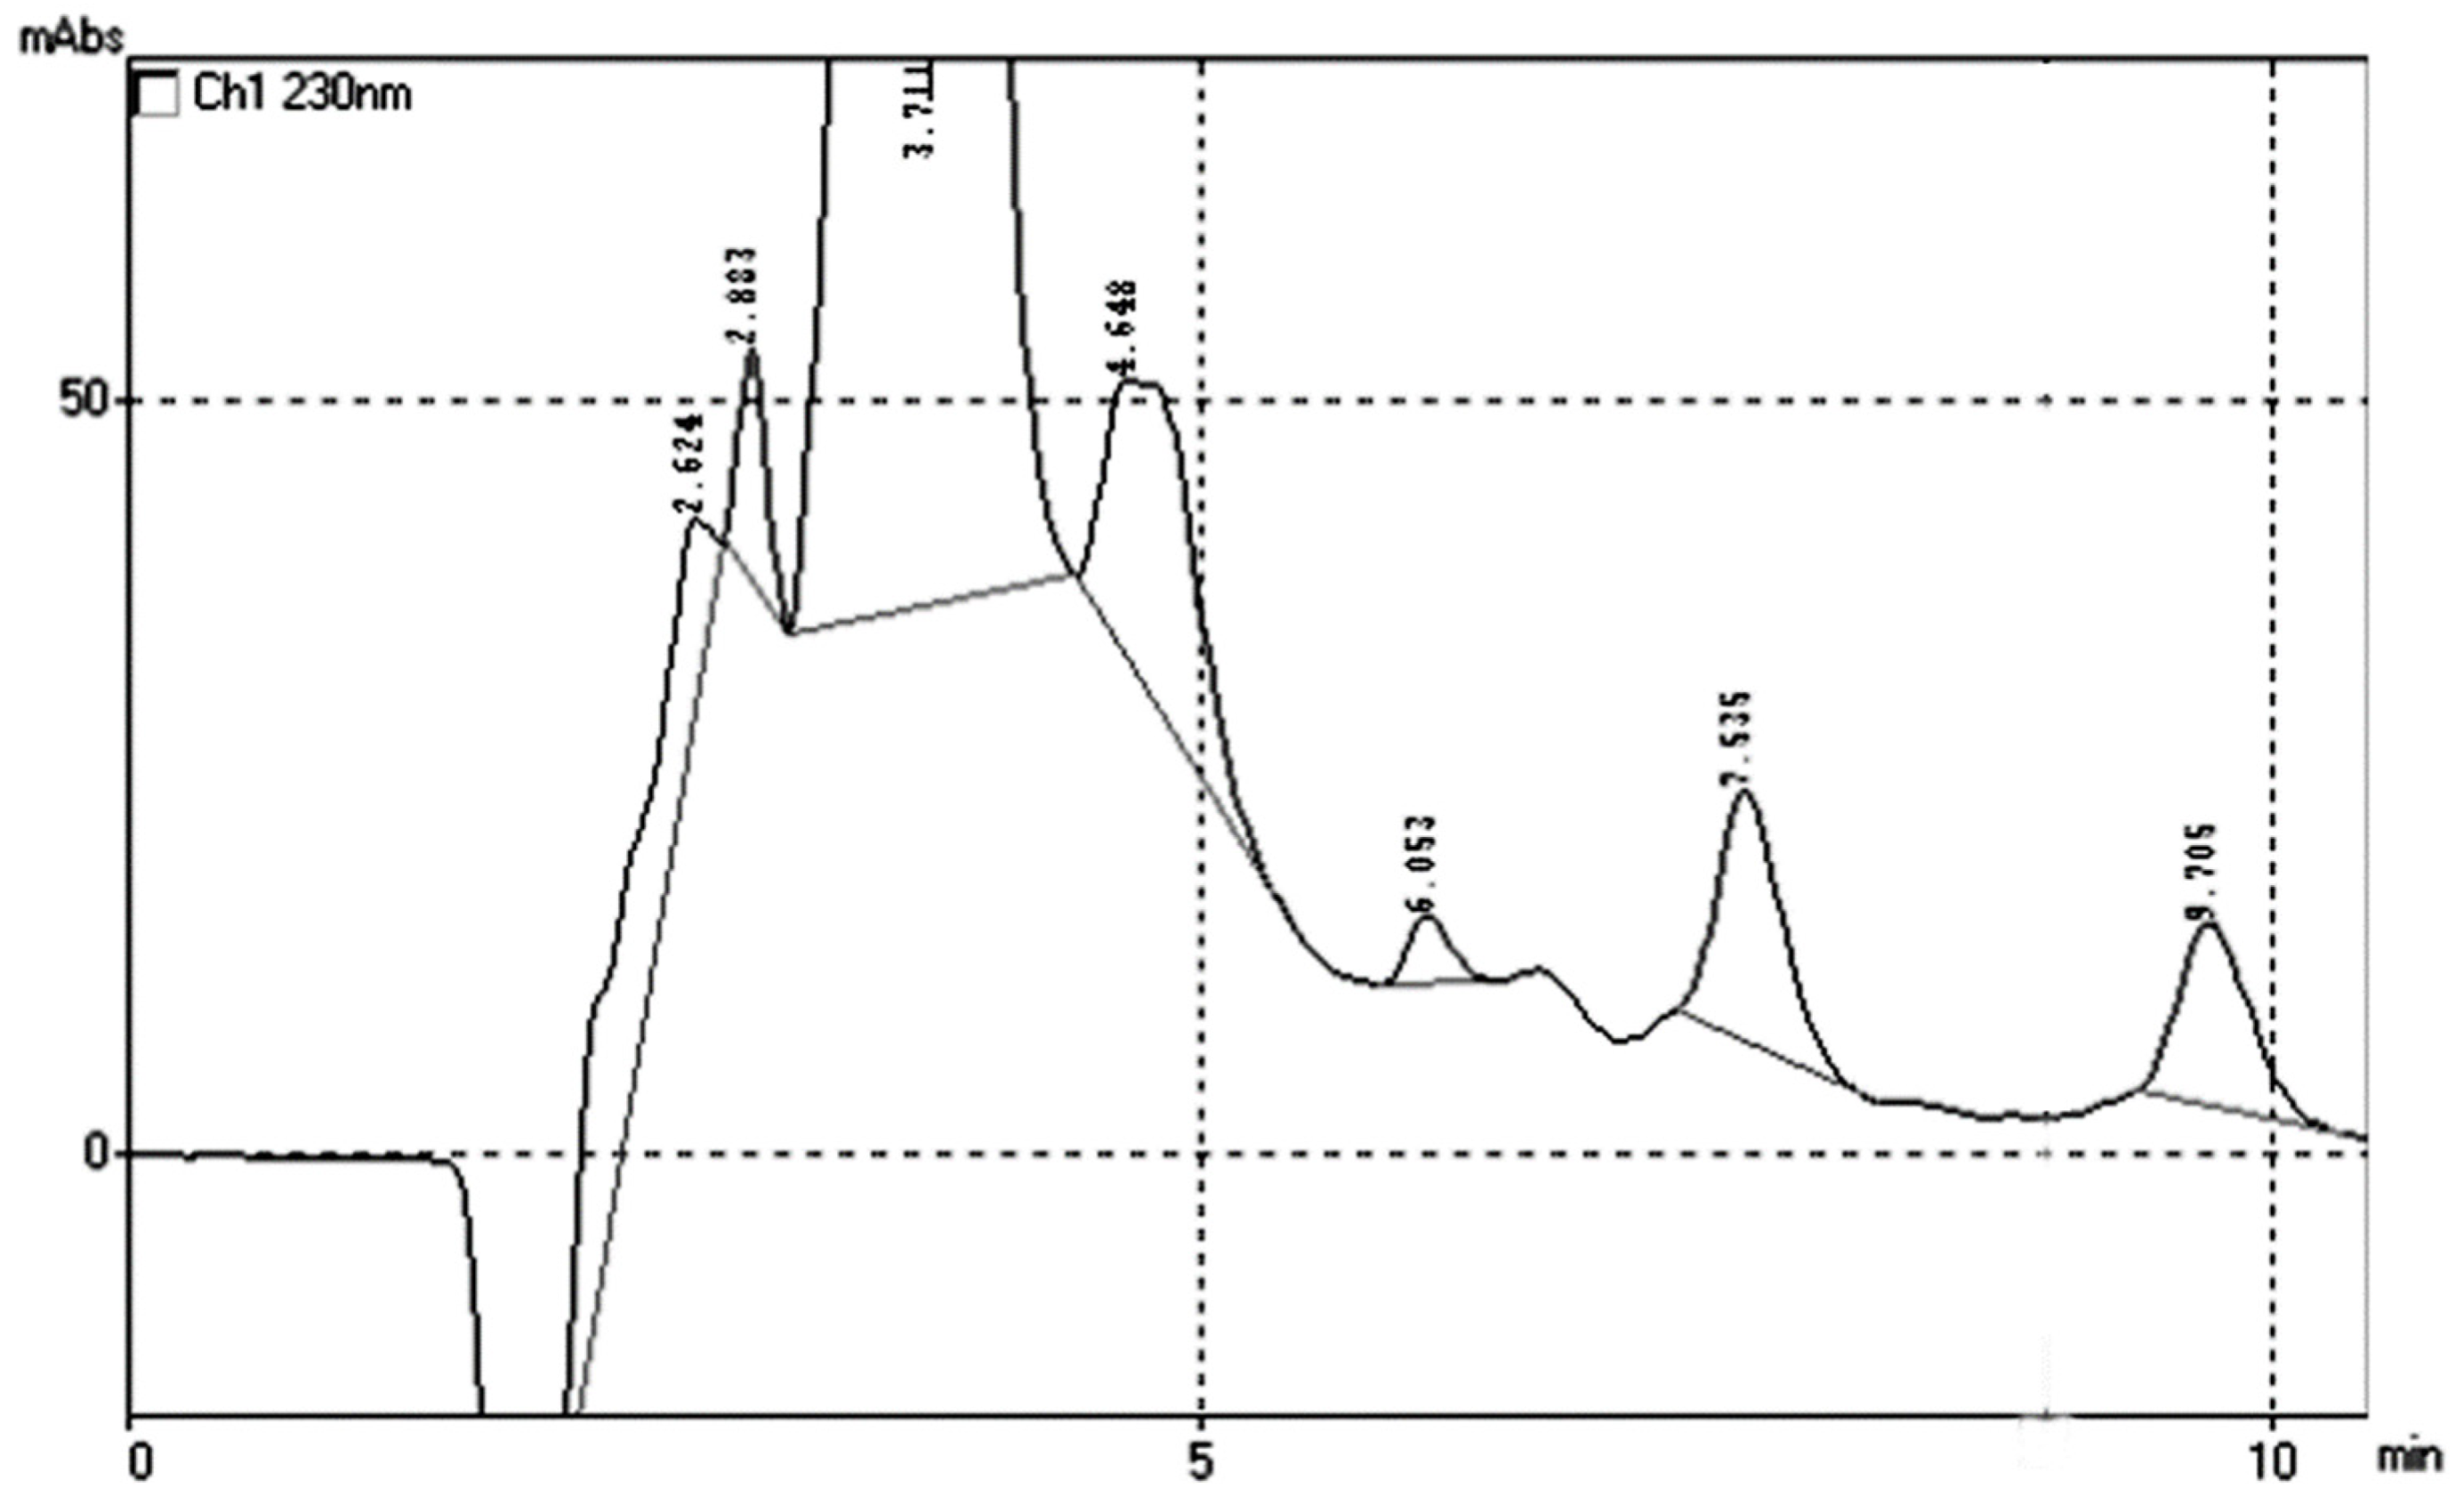
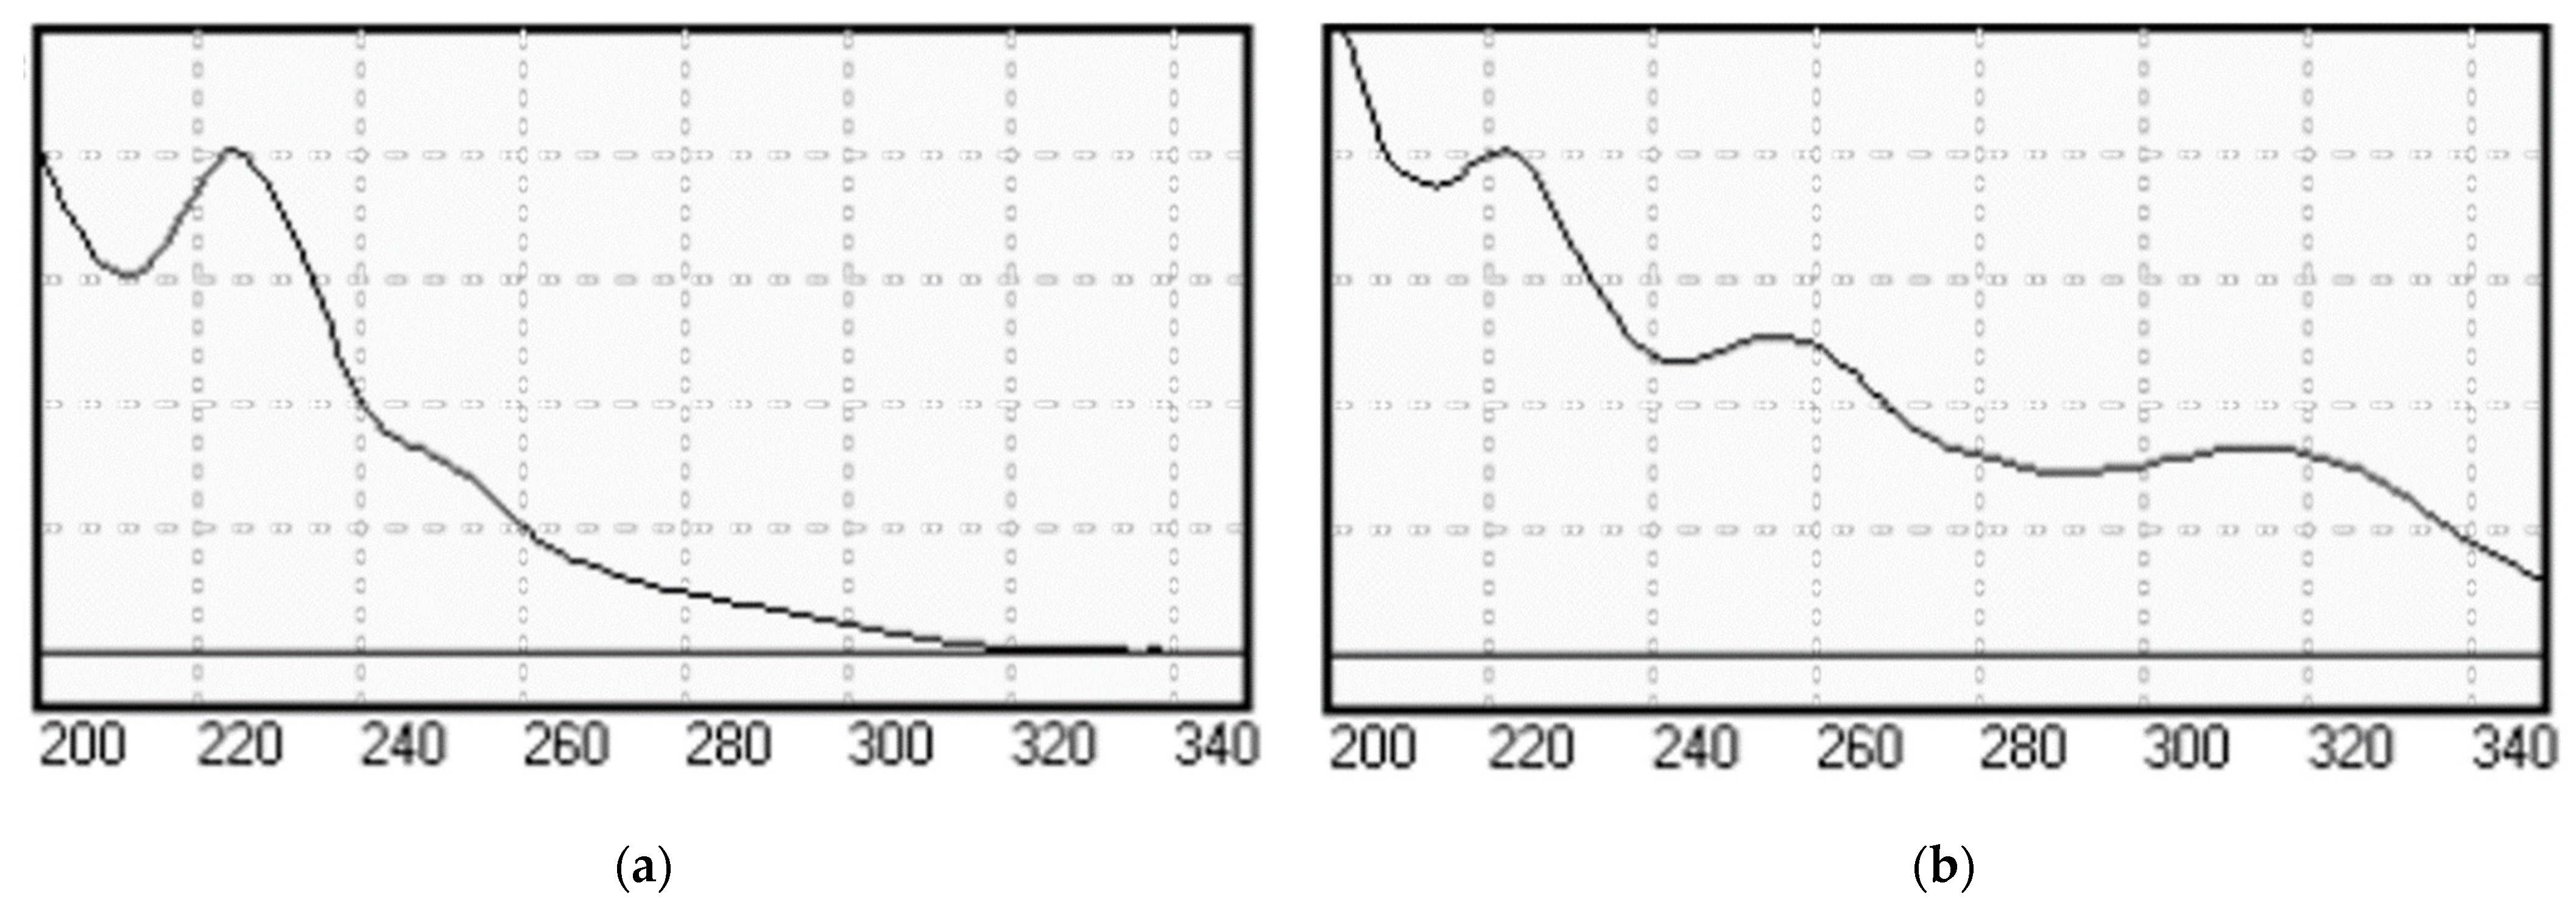
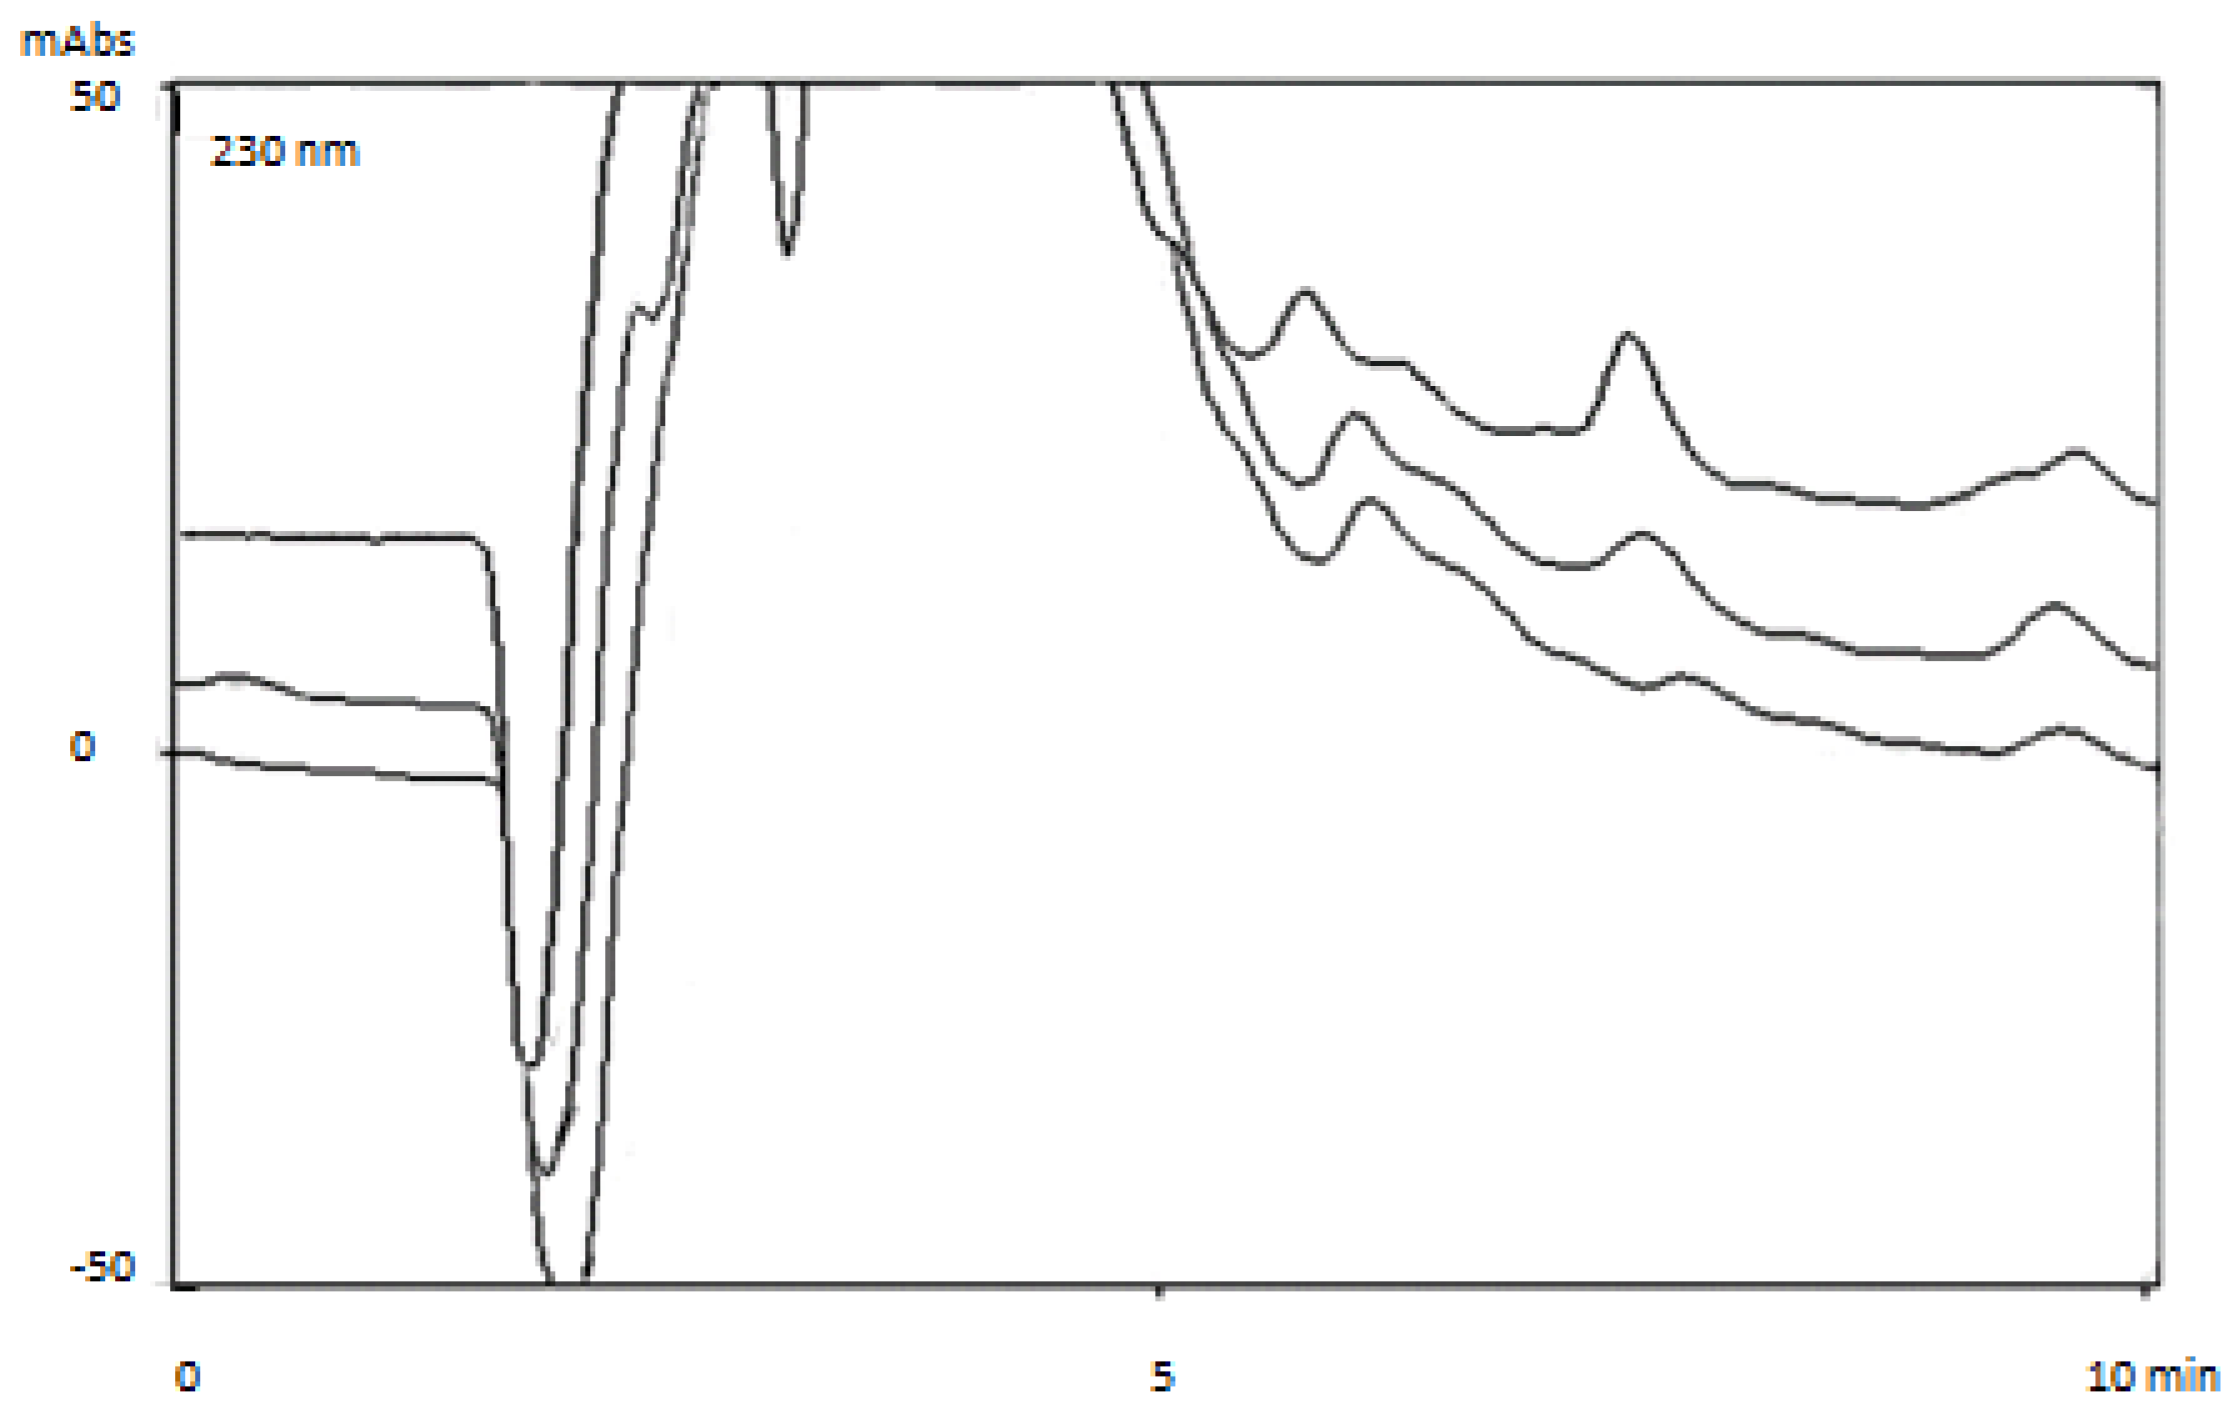
3.1. Chromatographic Separation

The separation of the benzodiazepines ALP and FLT was achieved isocratically with a mobile phase consisting of ACN/H2O 50:50% v/v within 10 min on an HPLC system coupled with a PDA detector at 230 nm and at a flow rate of 0.8 mL/min. The retention time for ALP was 7.535 and for FLT was 9.705.
A typical chromatogram of the two analytes is given in Figure 2. The peaks at the first 6 min are due to the matrix of the adsorbent. The UV spectra of the two BZs were also taken for the identification and verification of the peaks in the real samples, which are comparable and identical to those reported in the literature (Figure 3) [22,23].

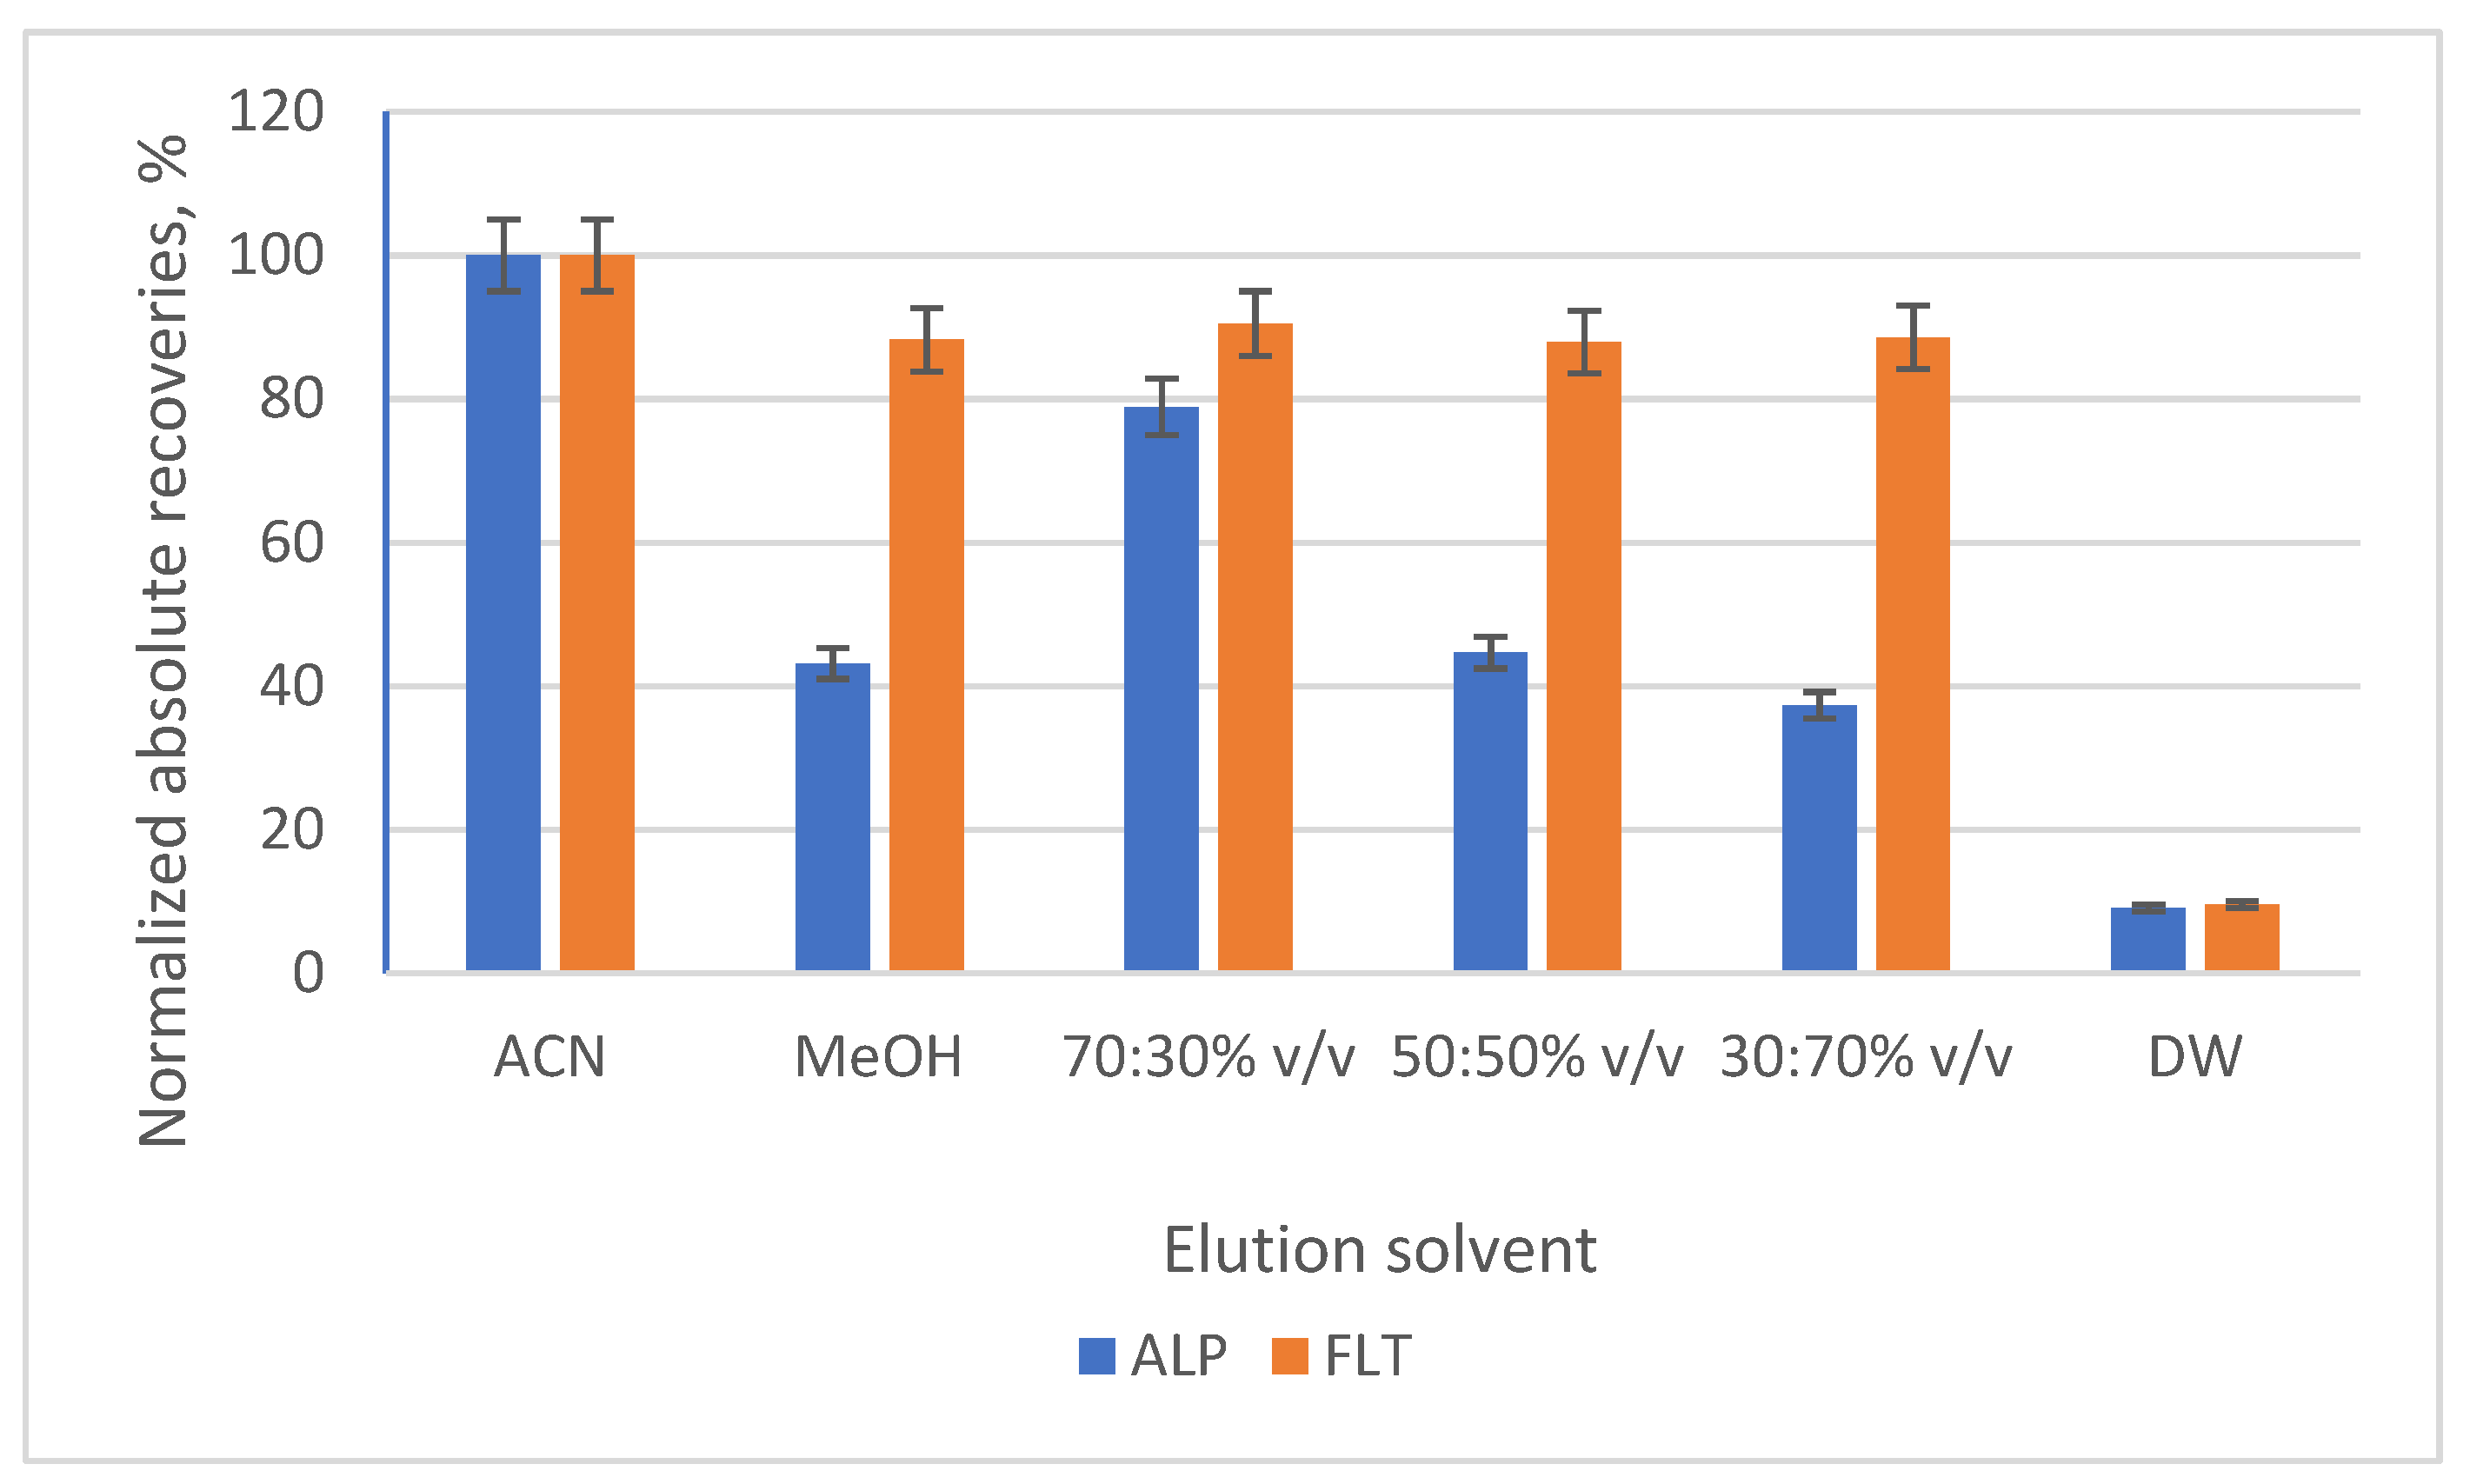
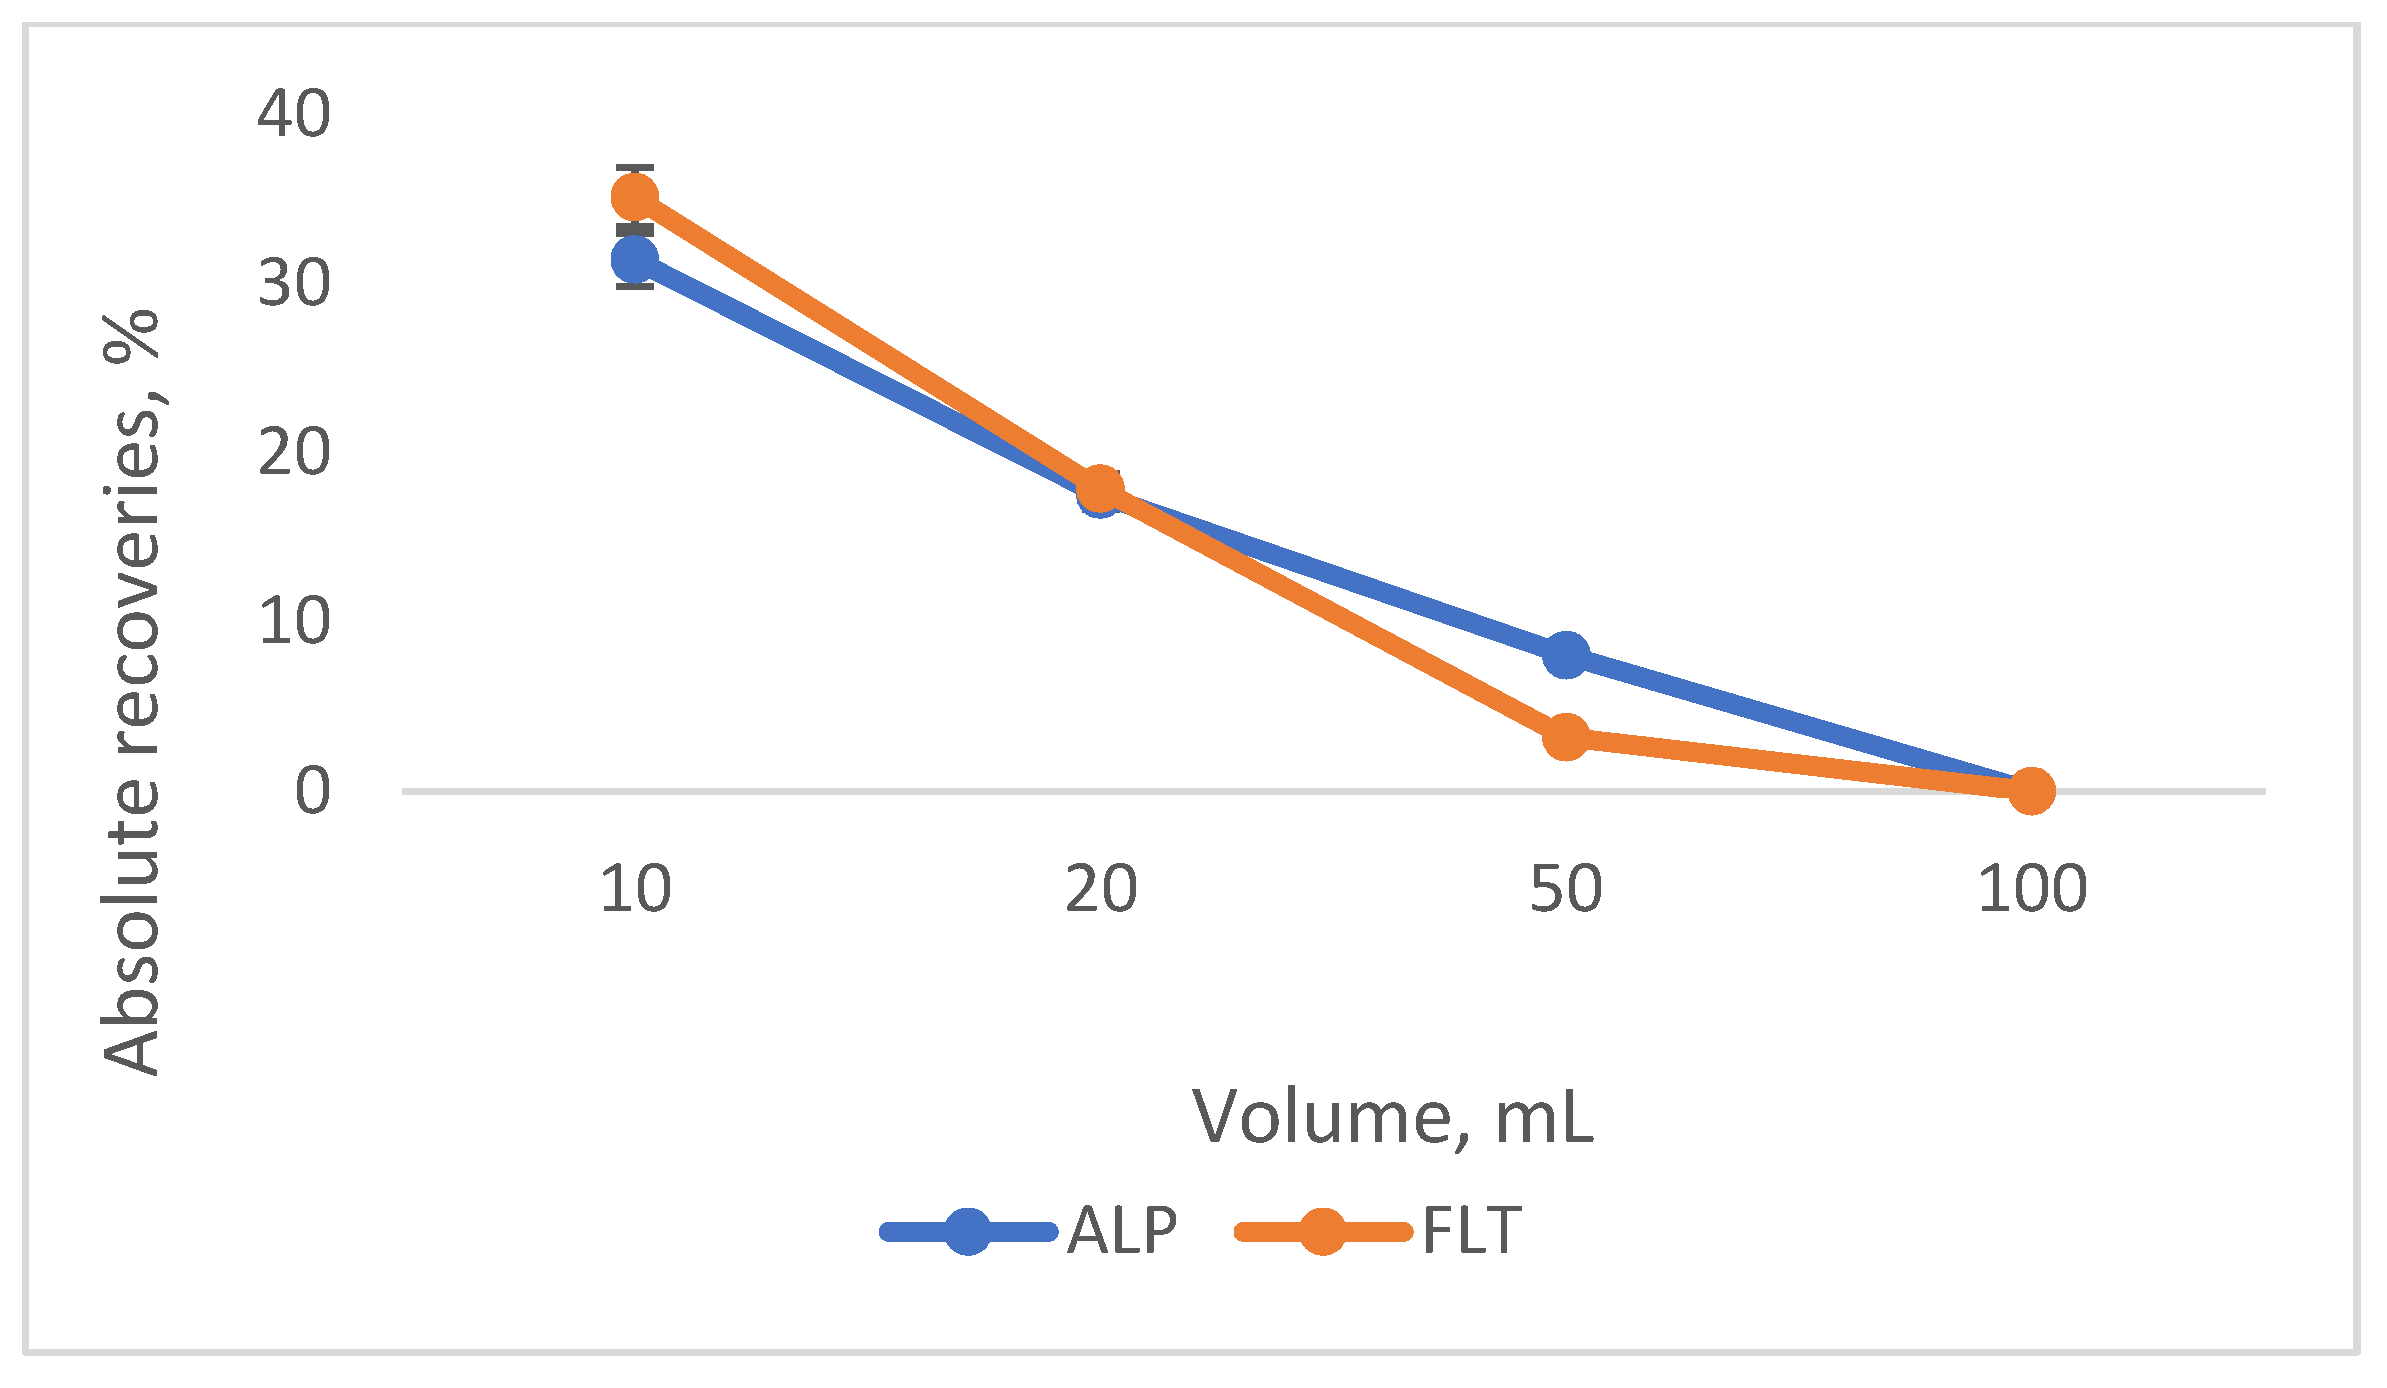
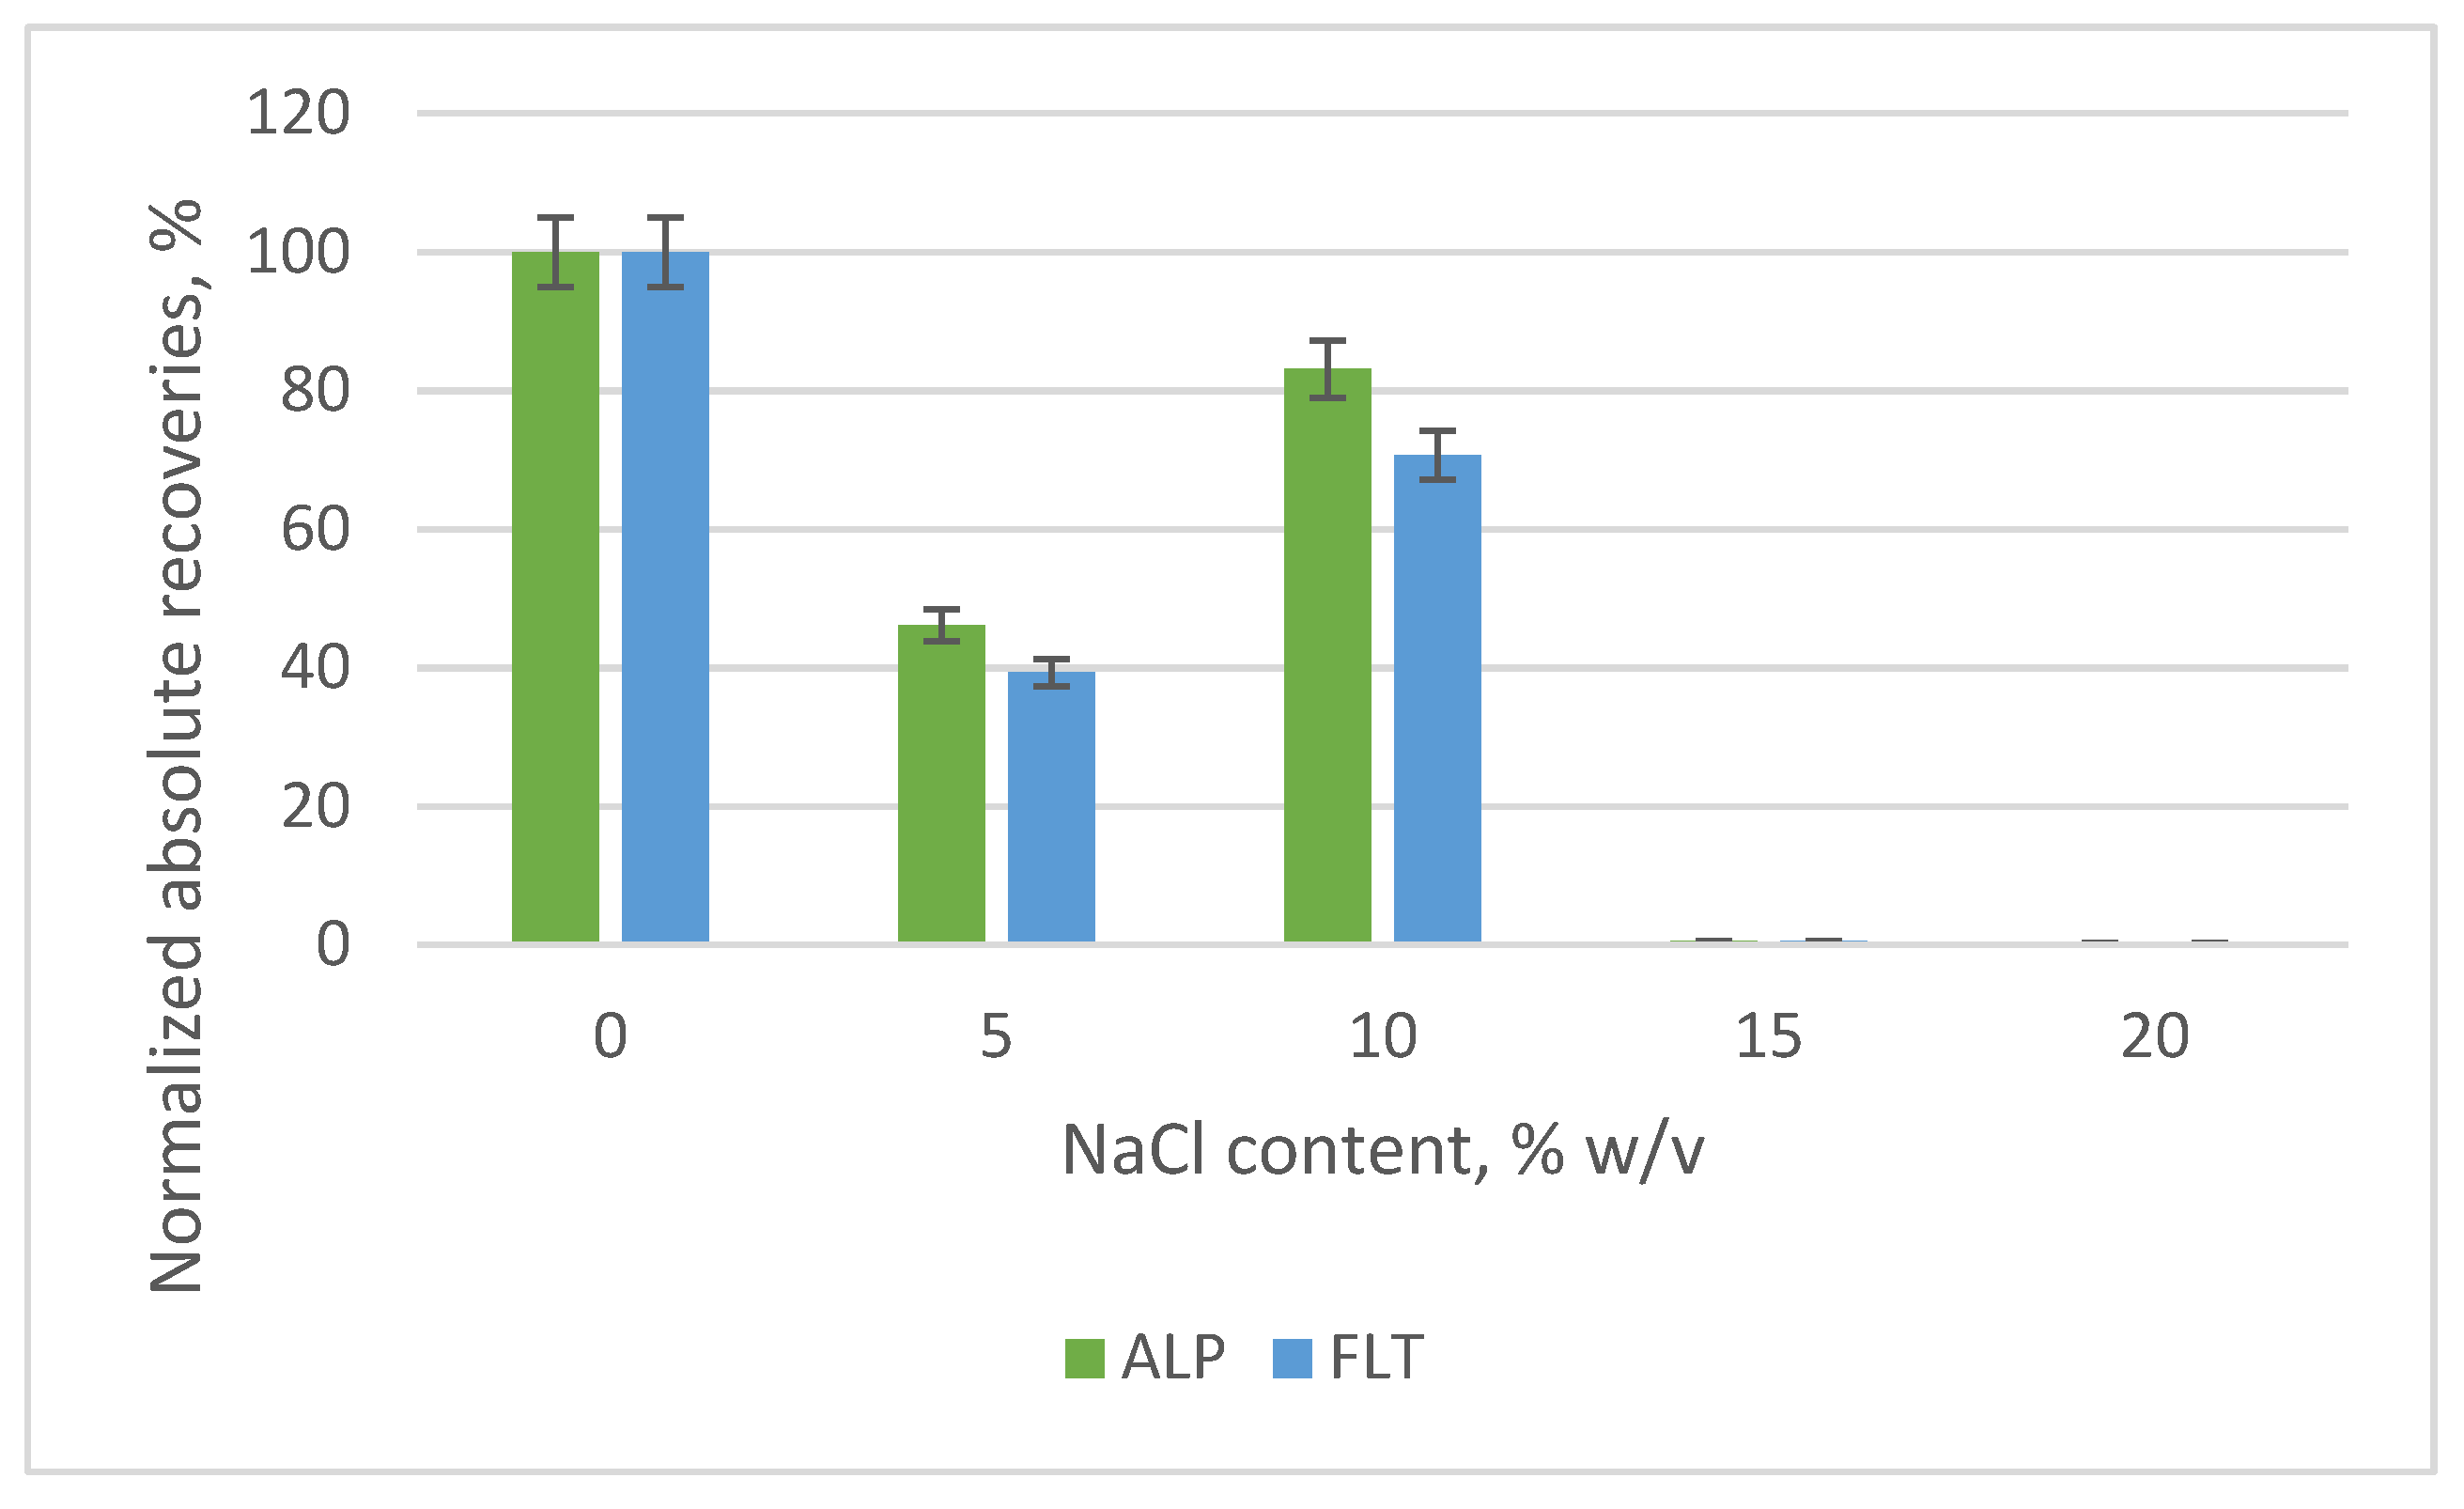
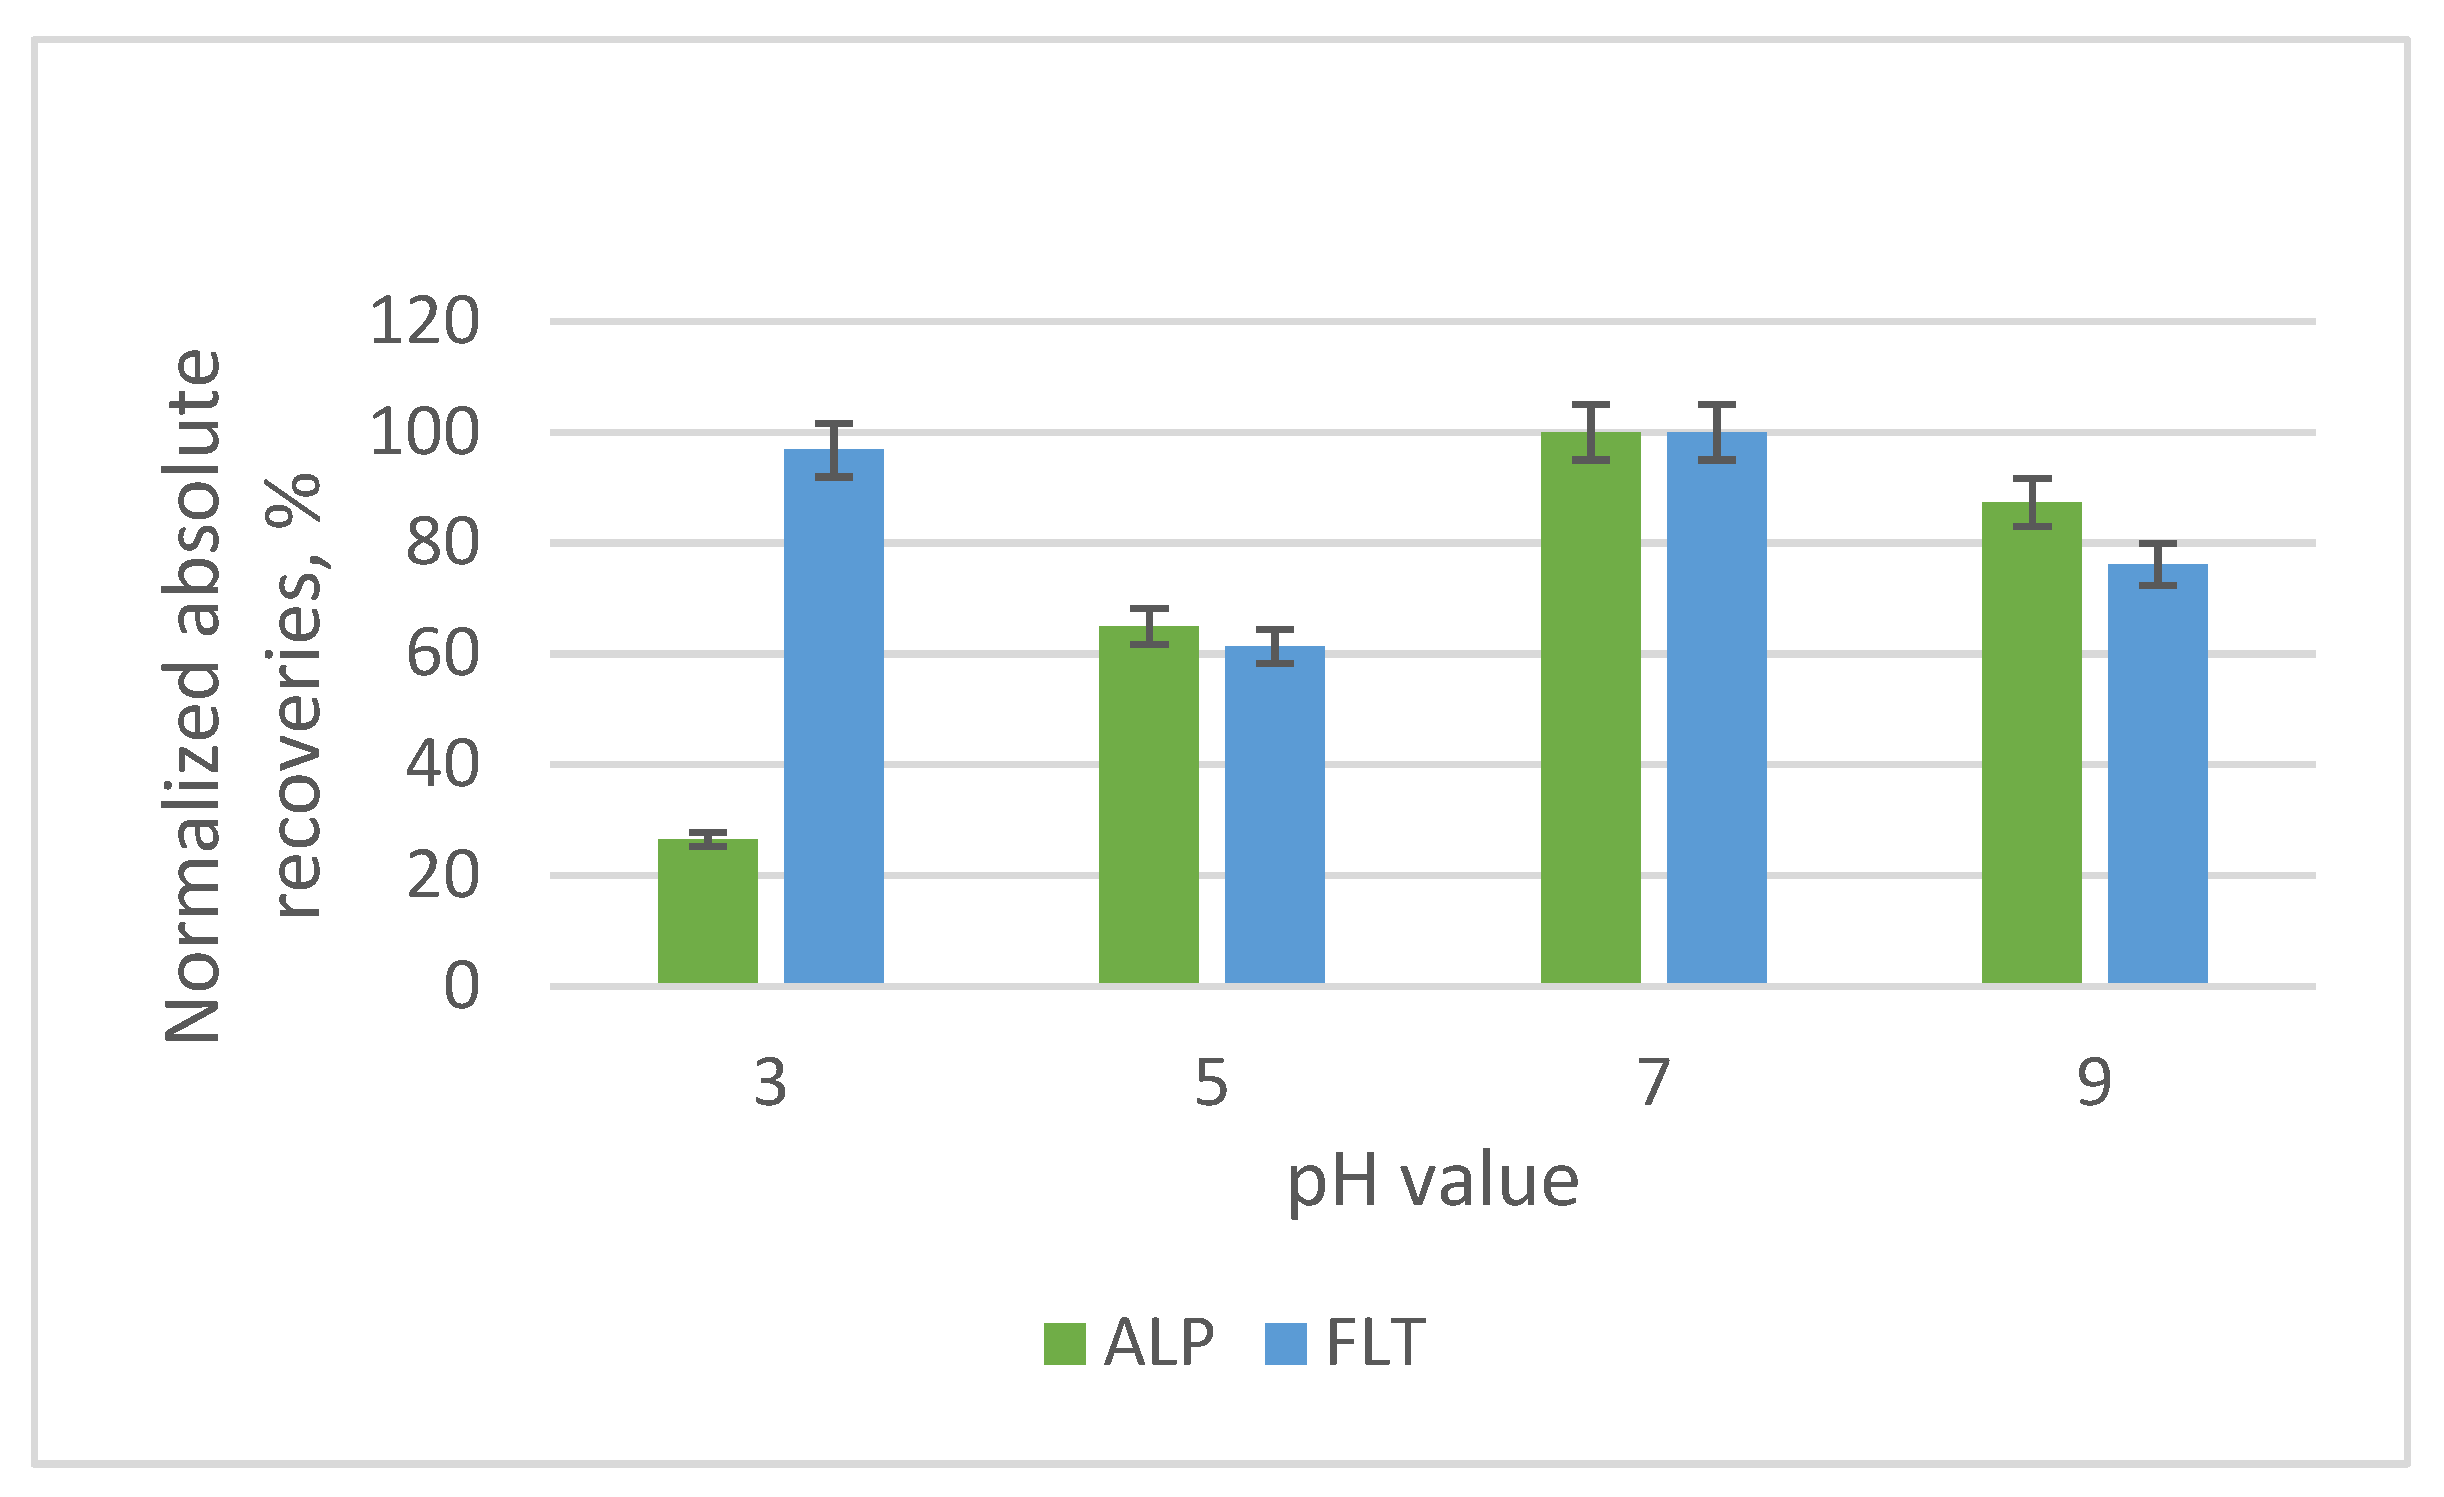
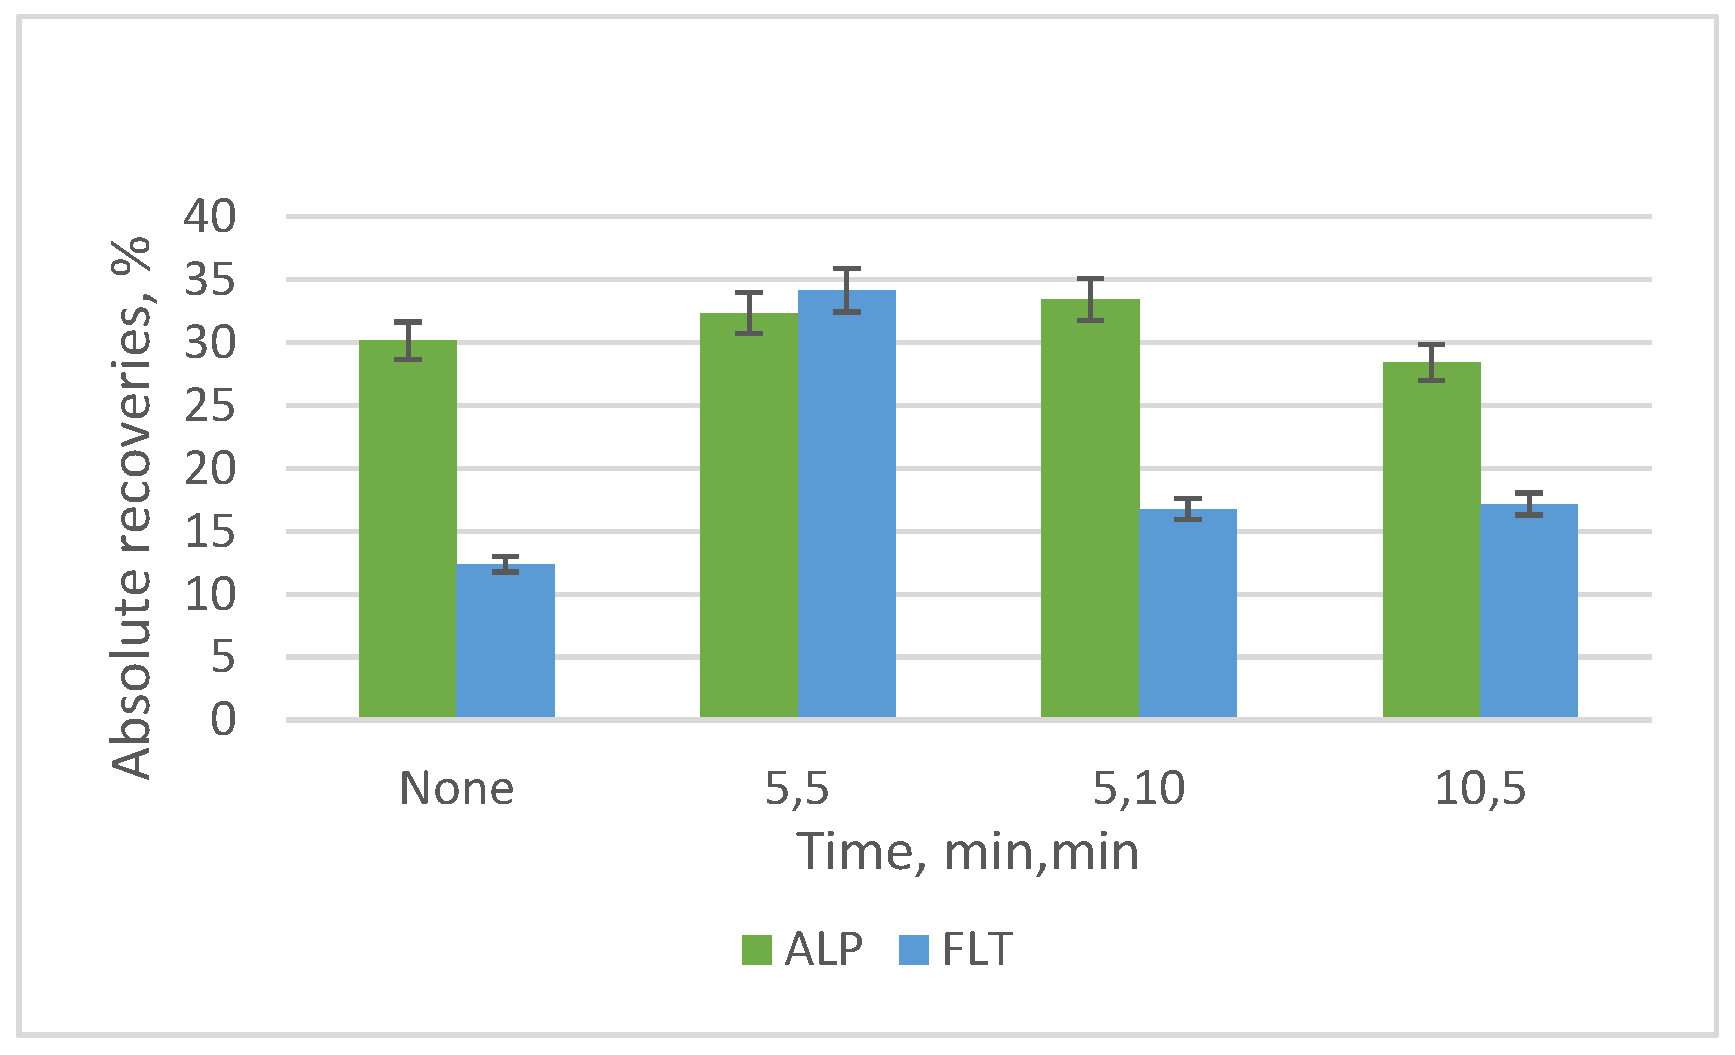
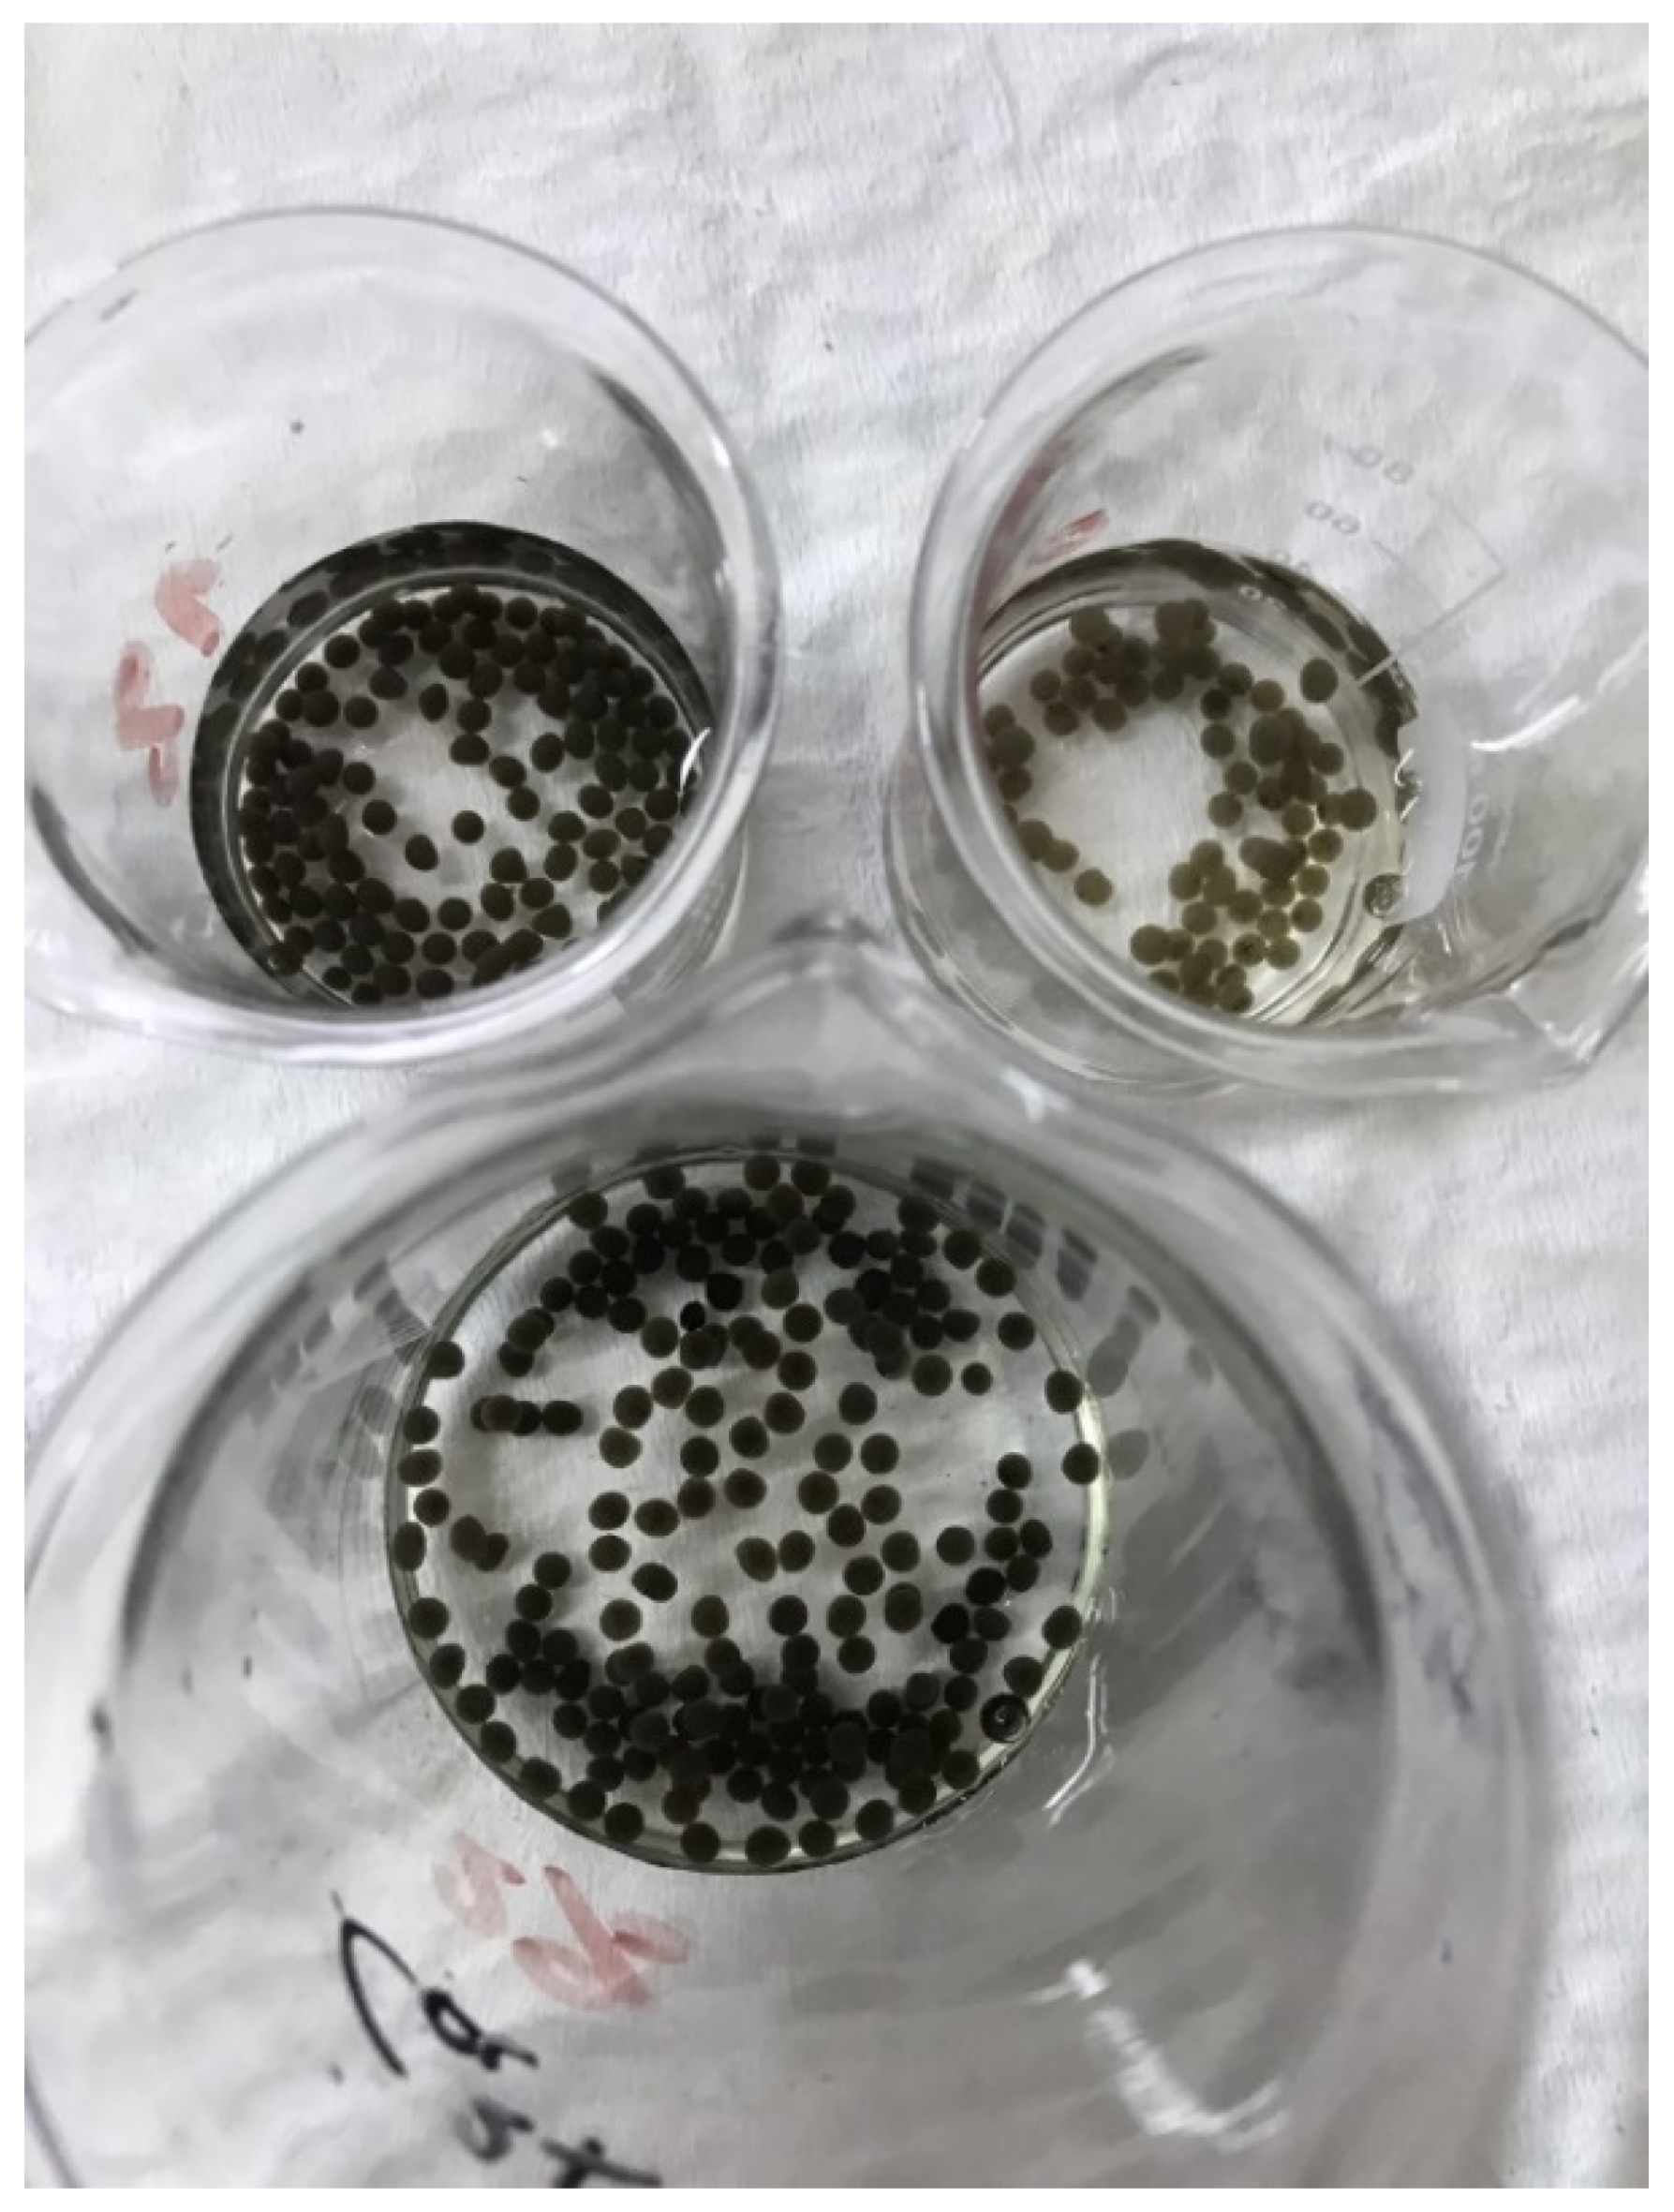
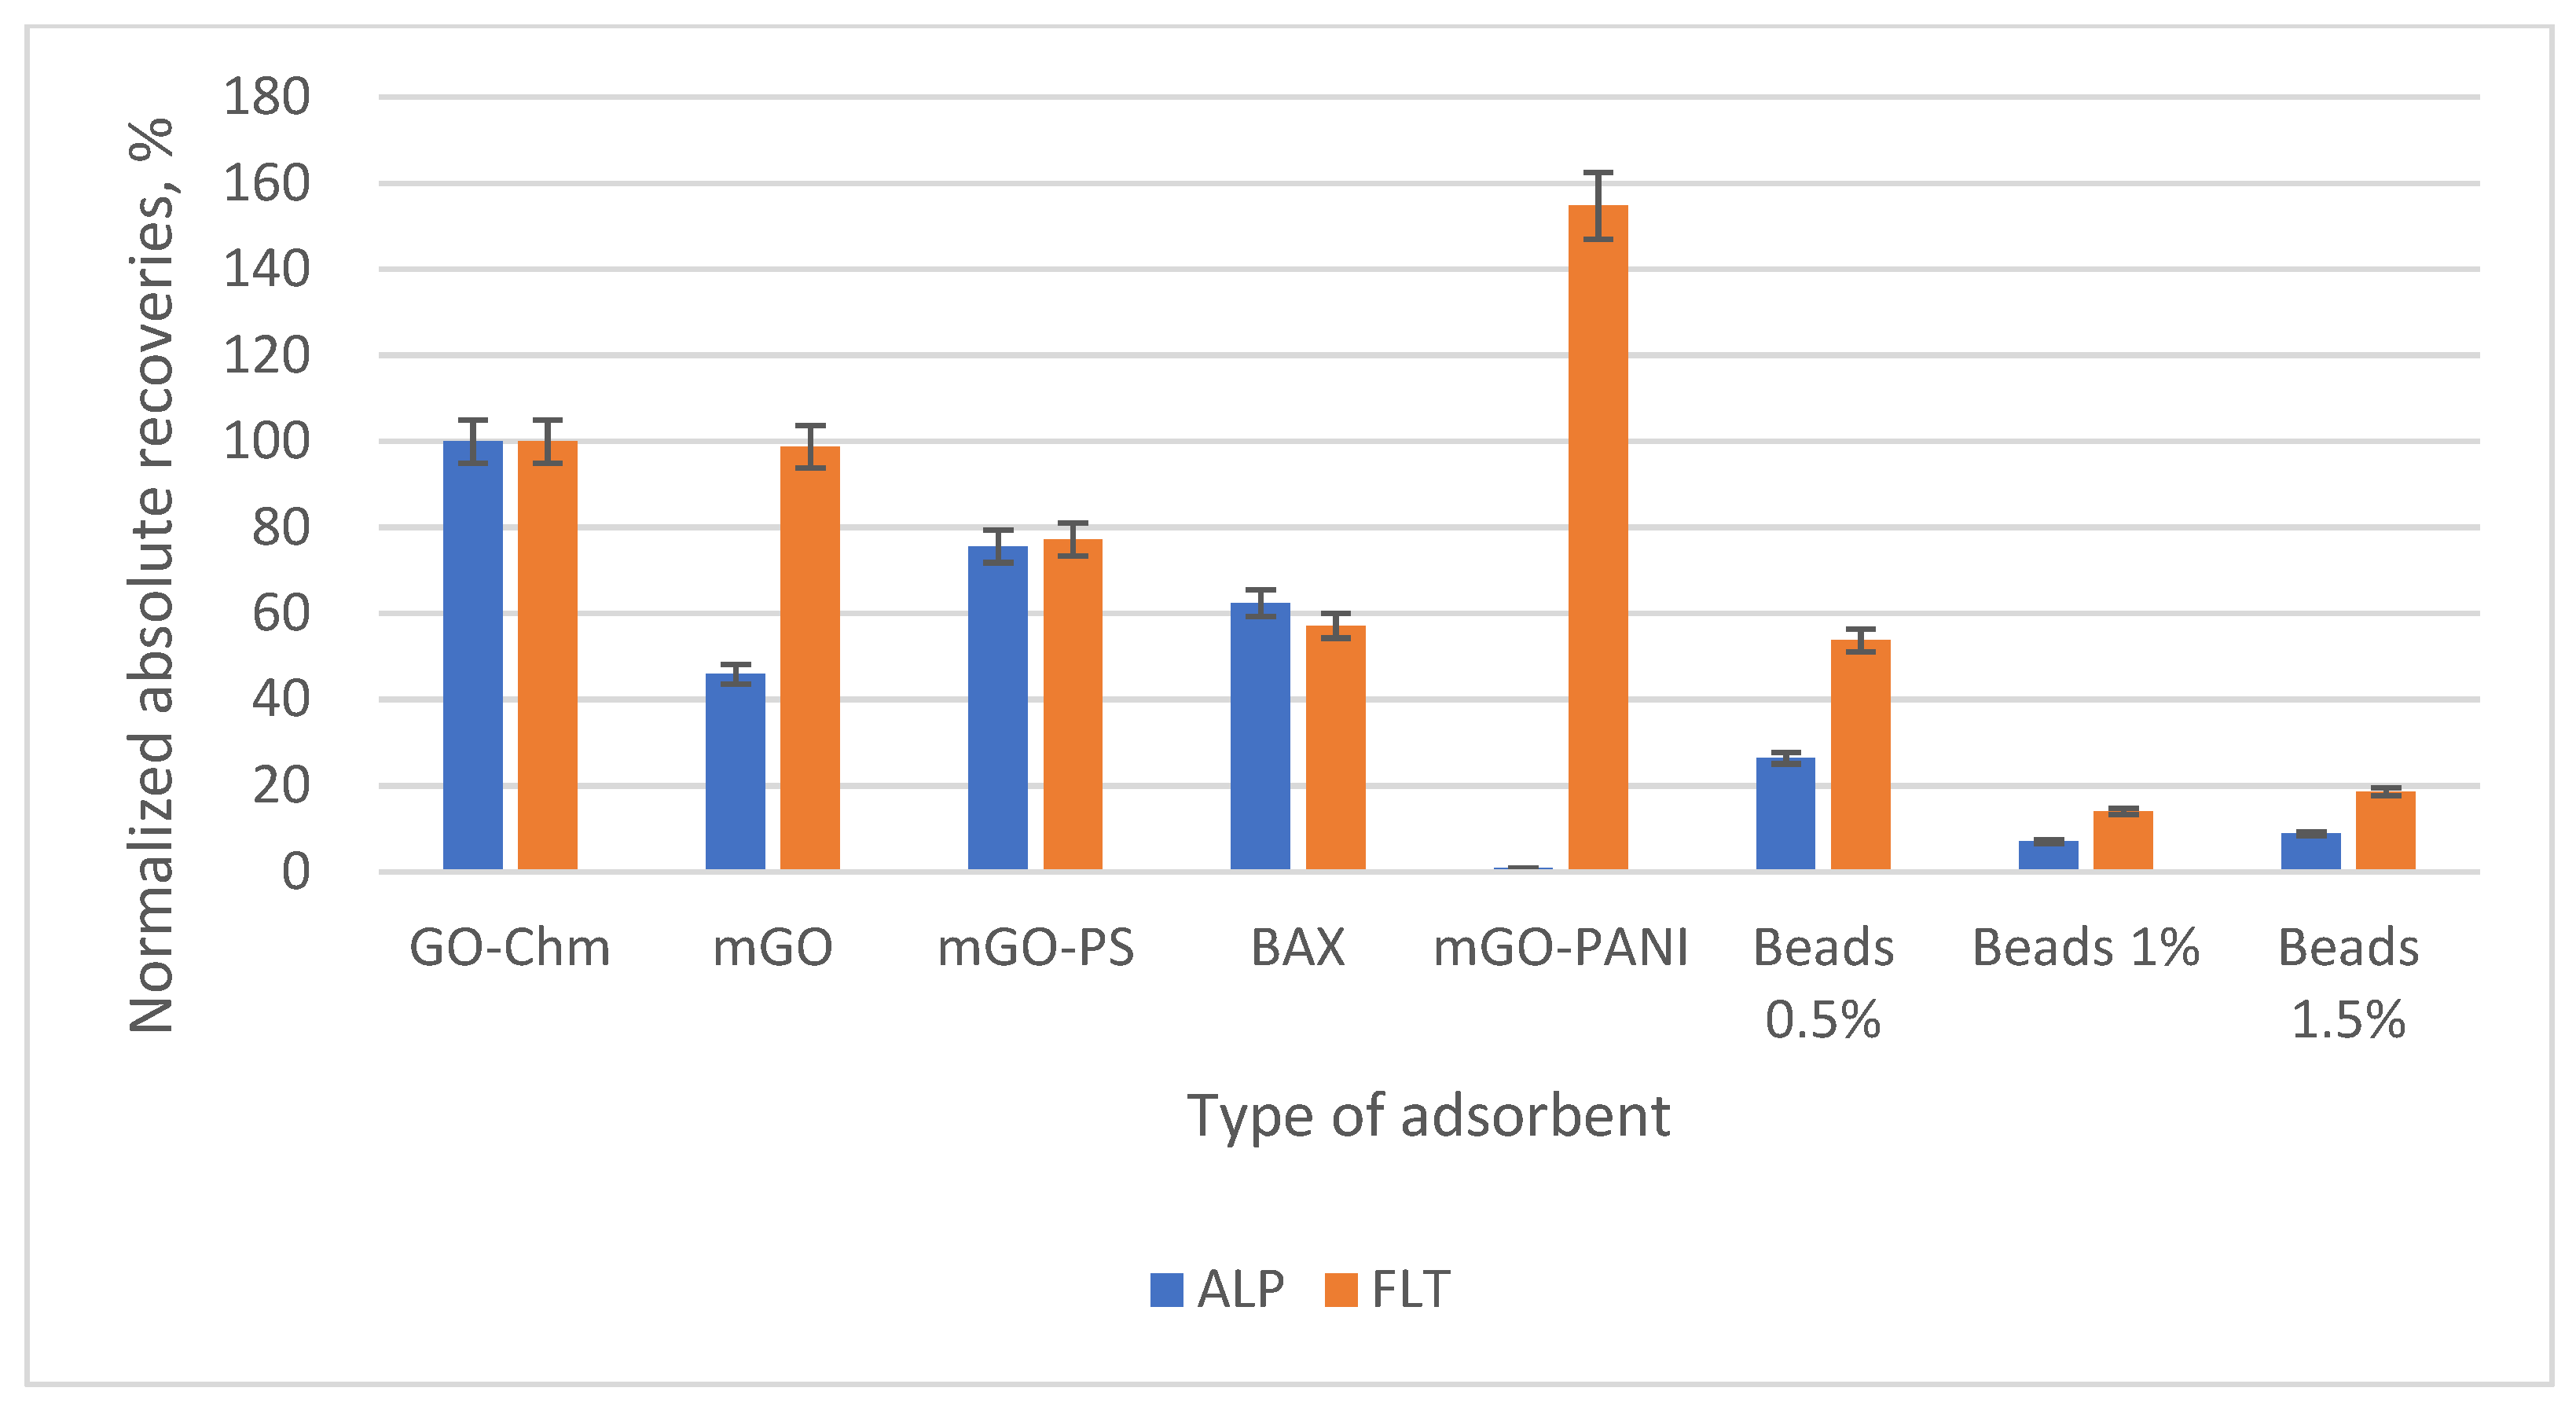
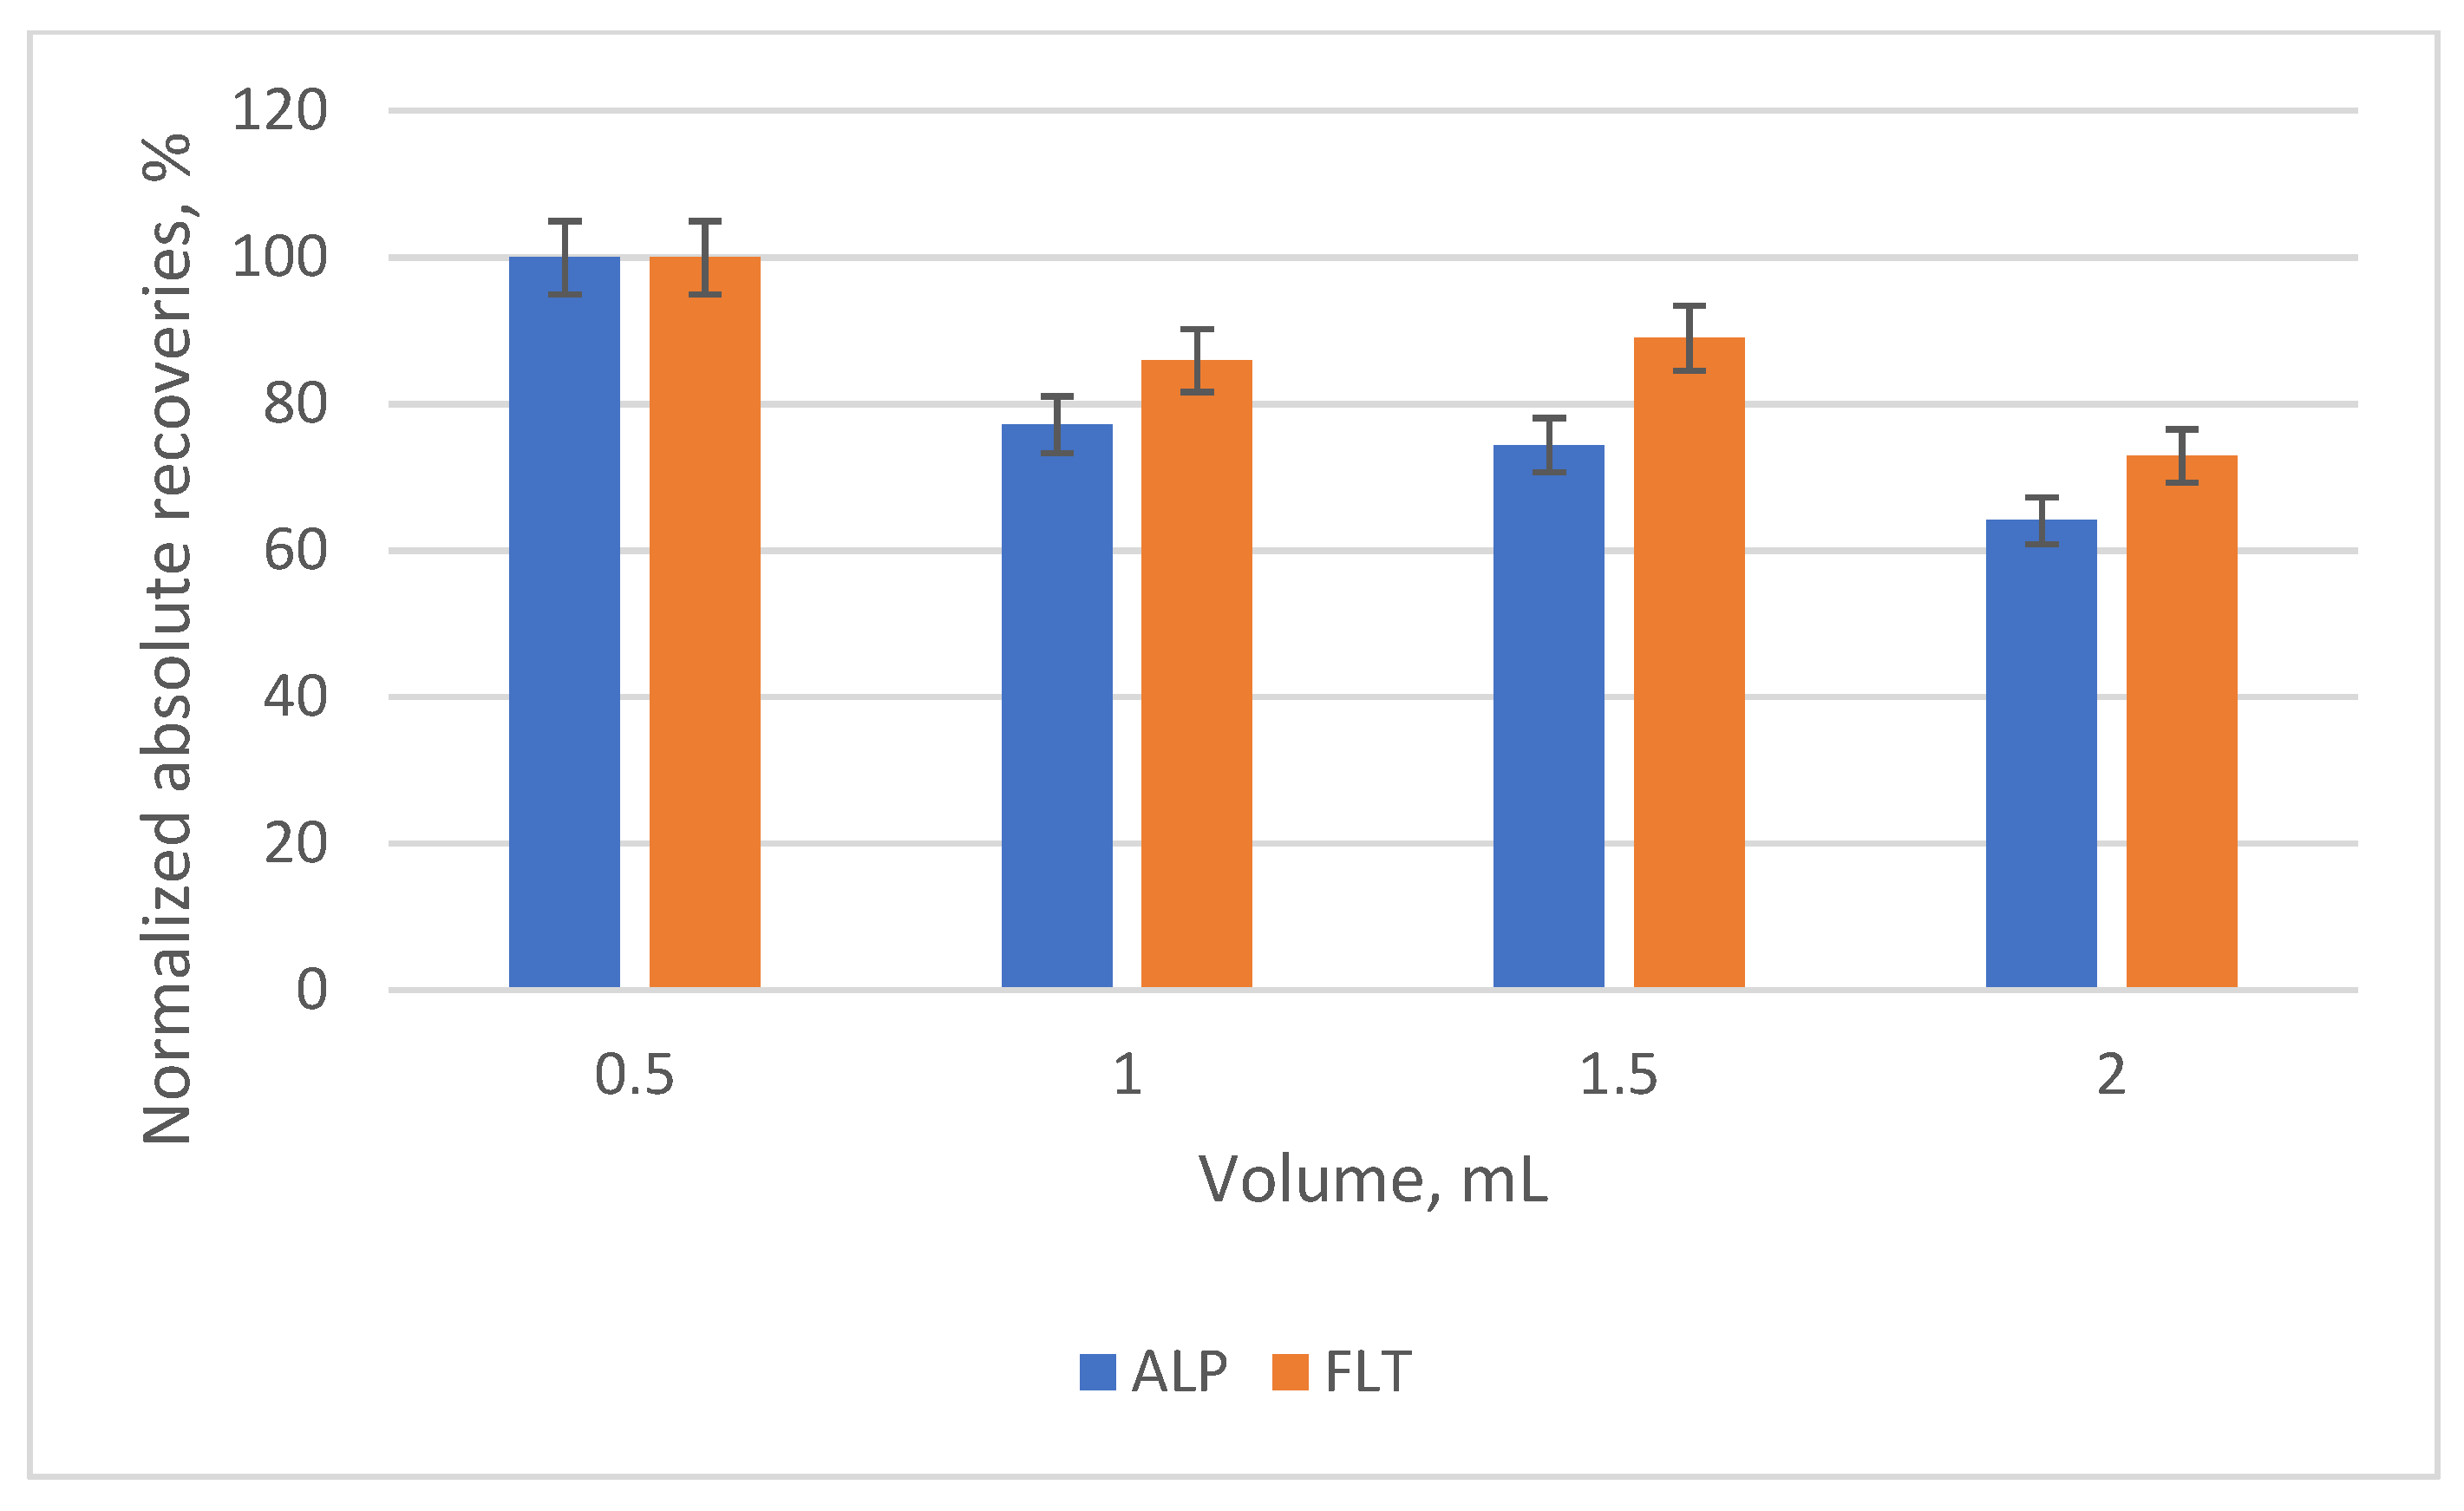
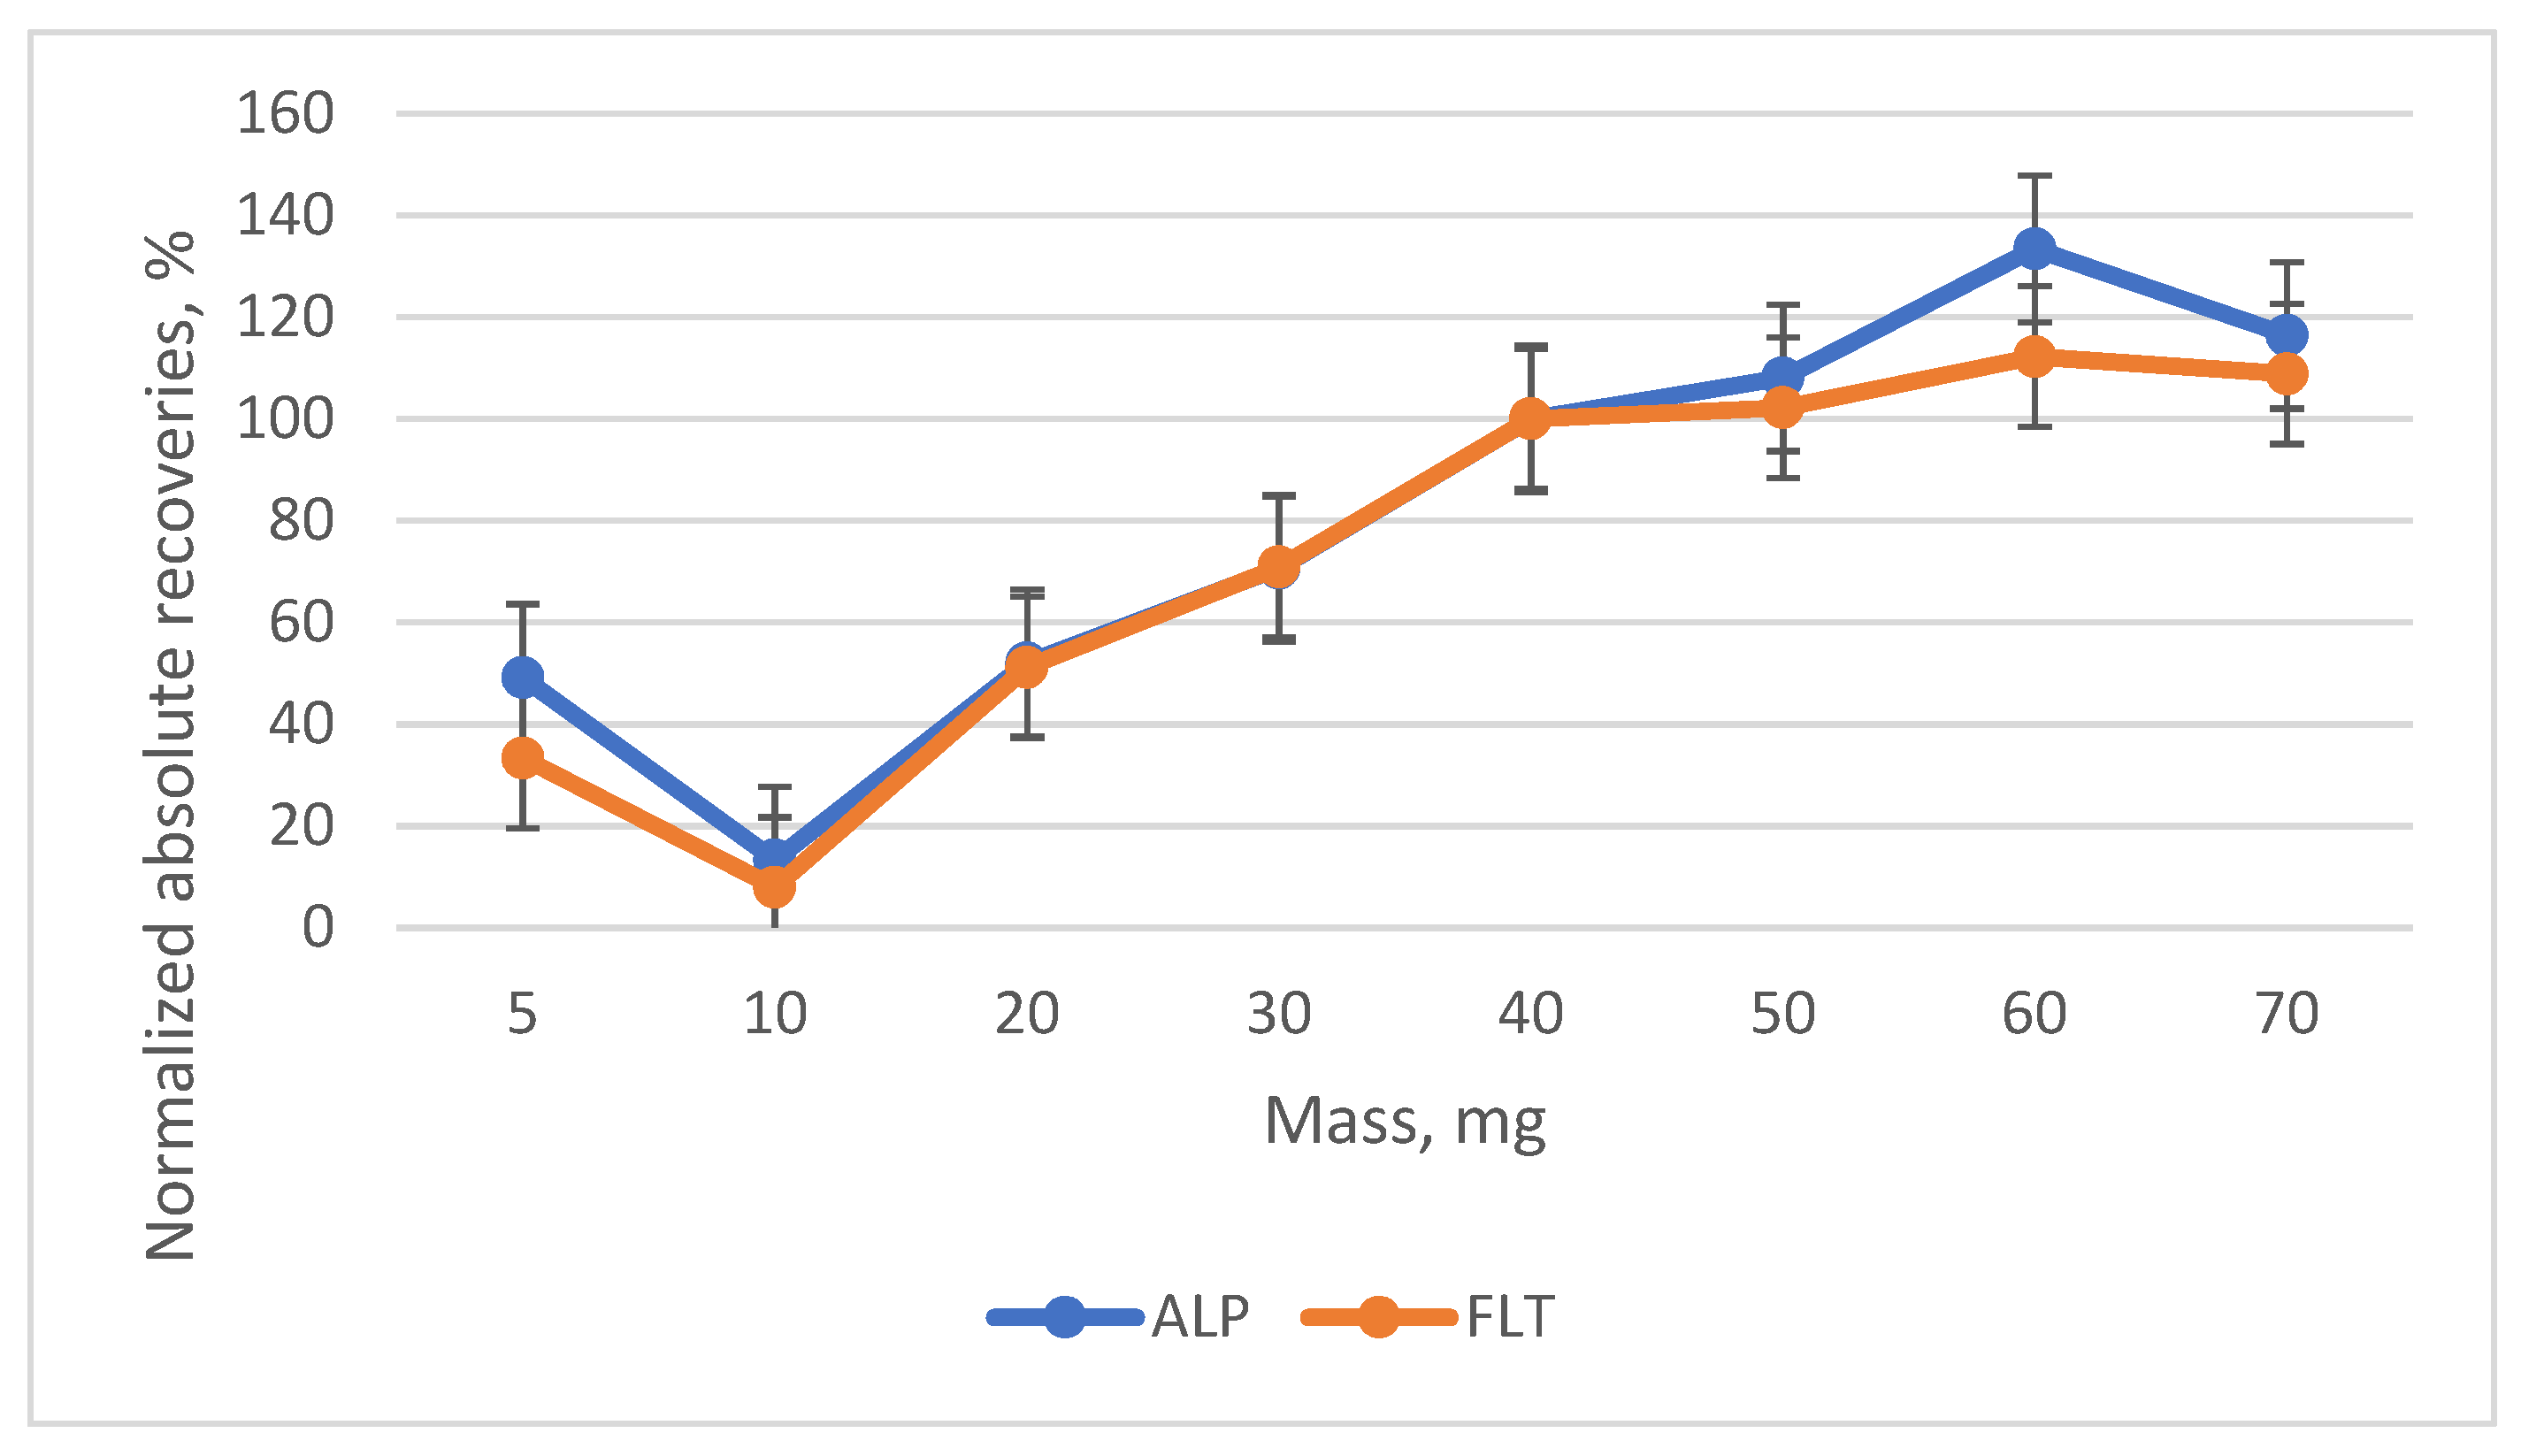
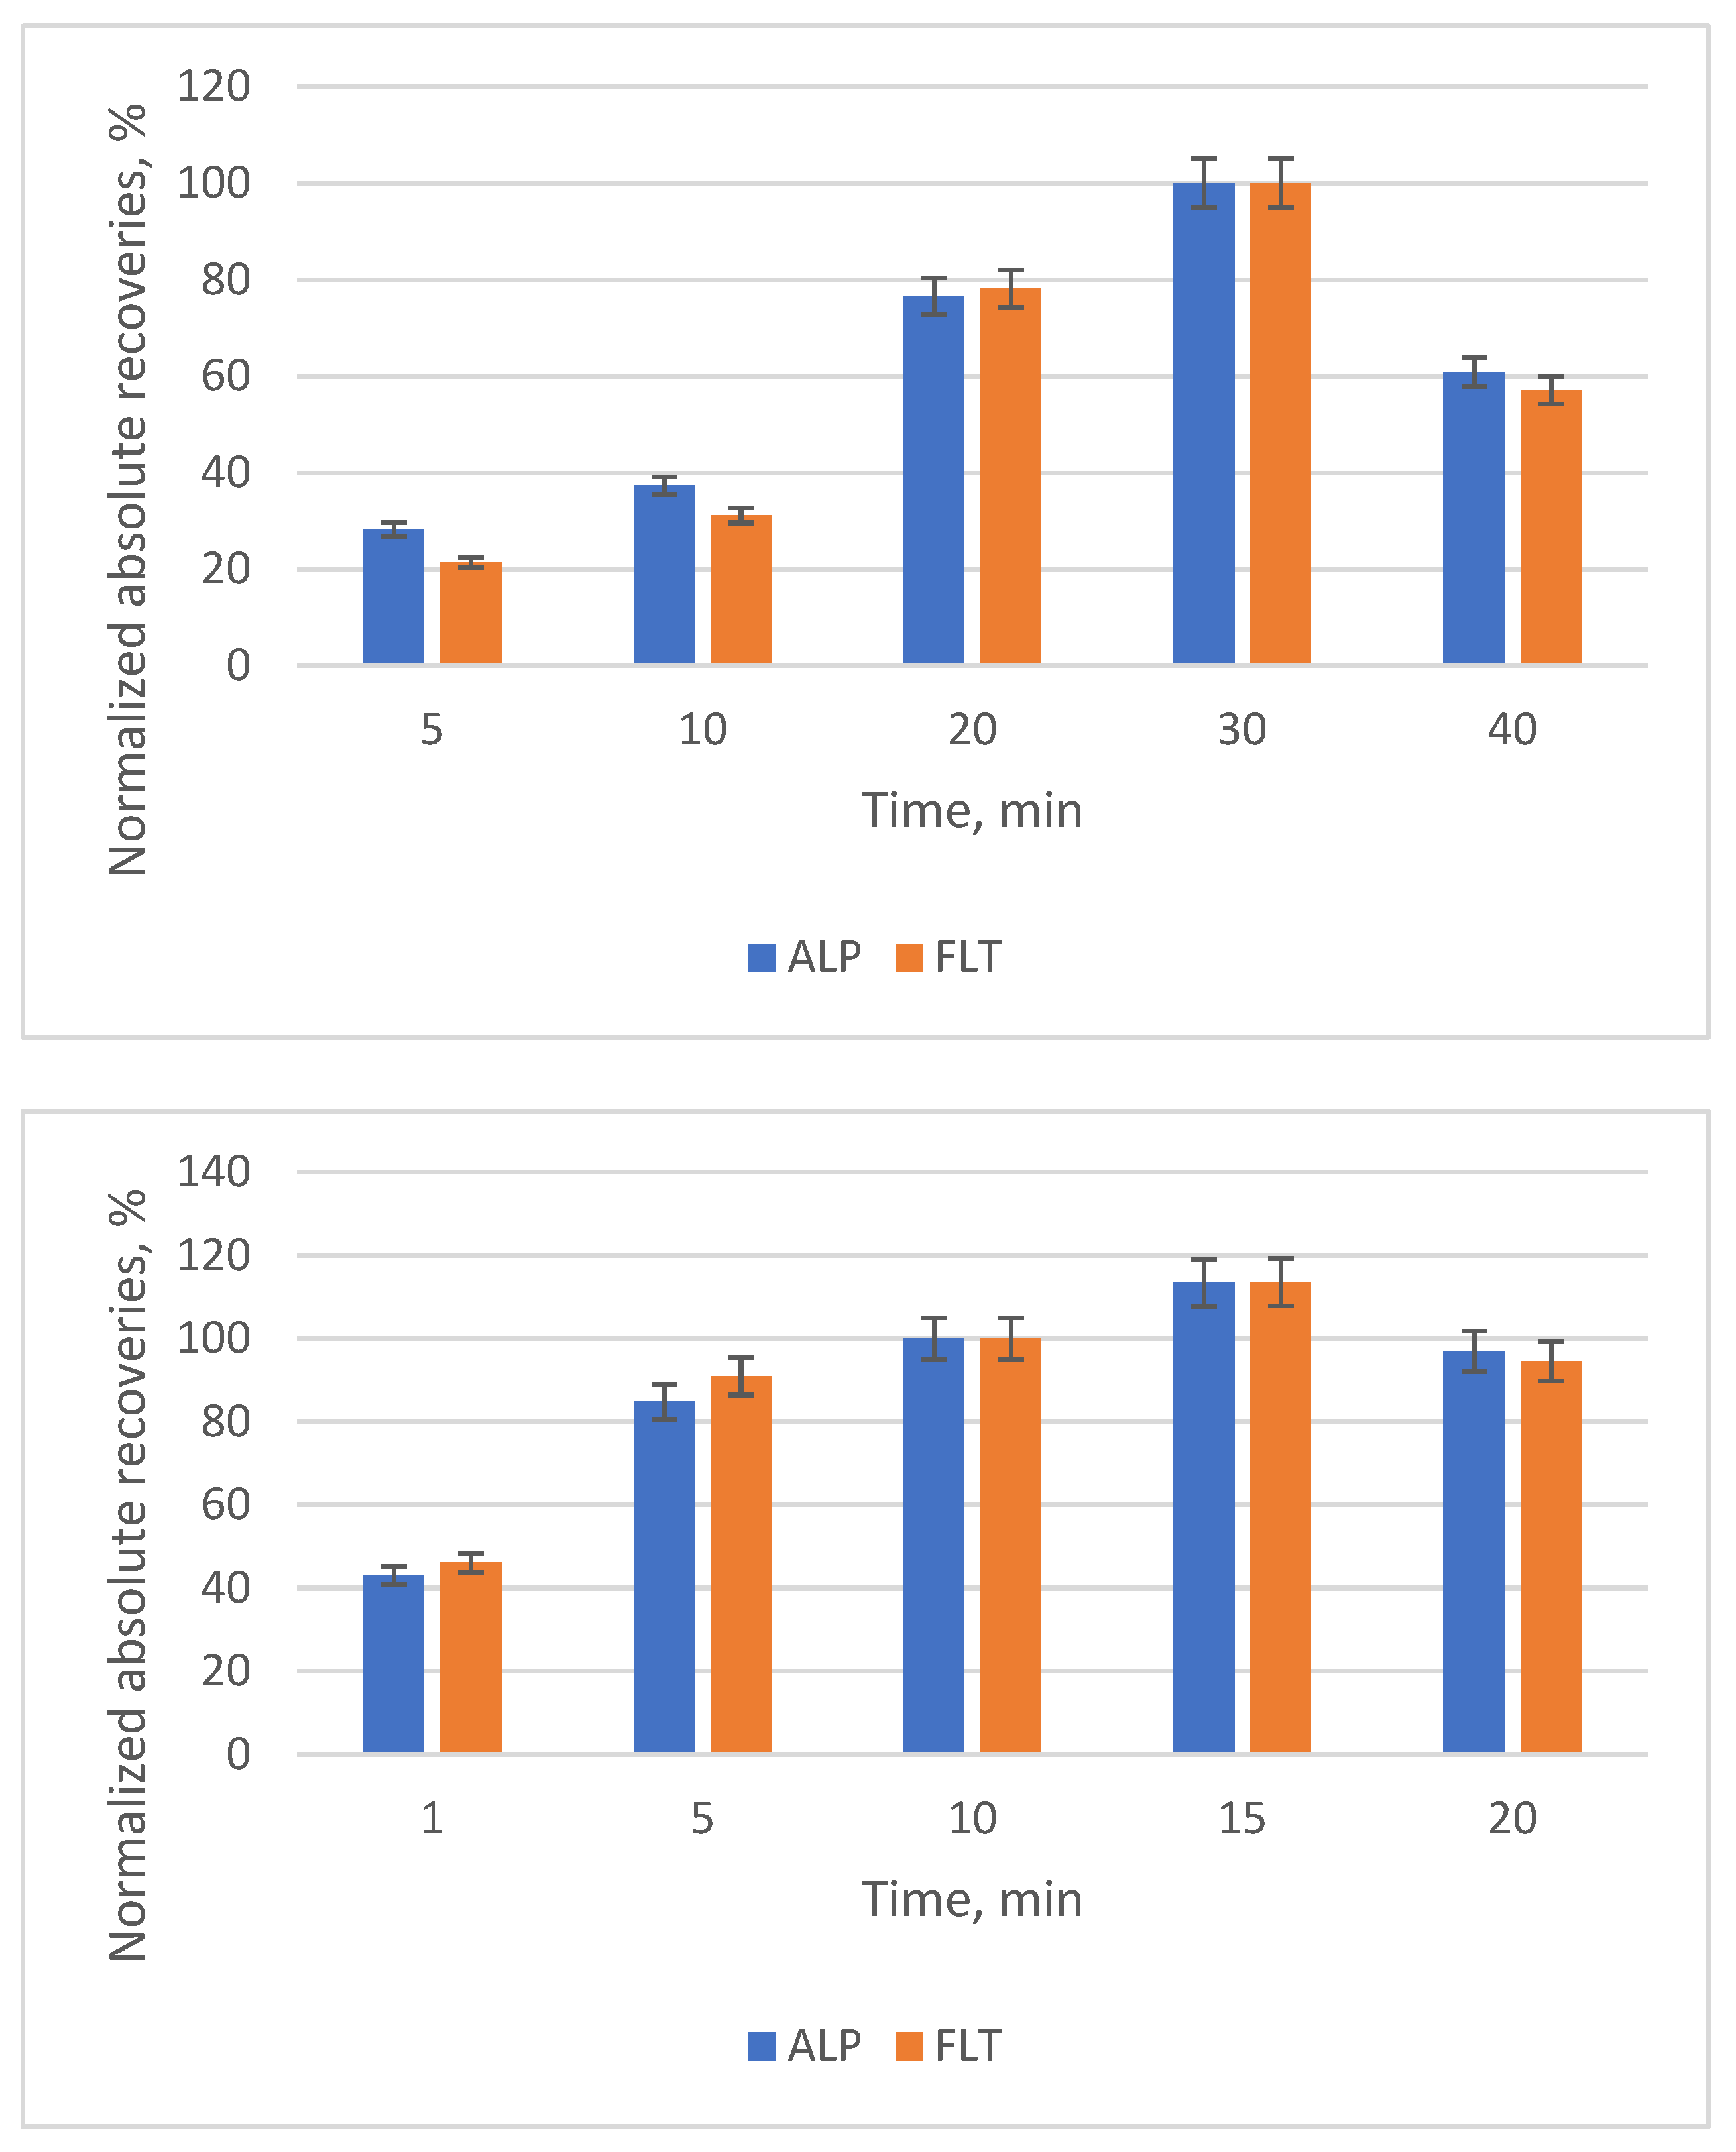
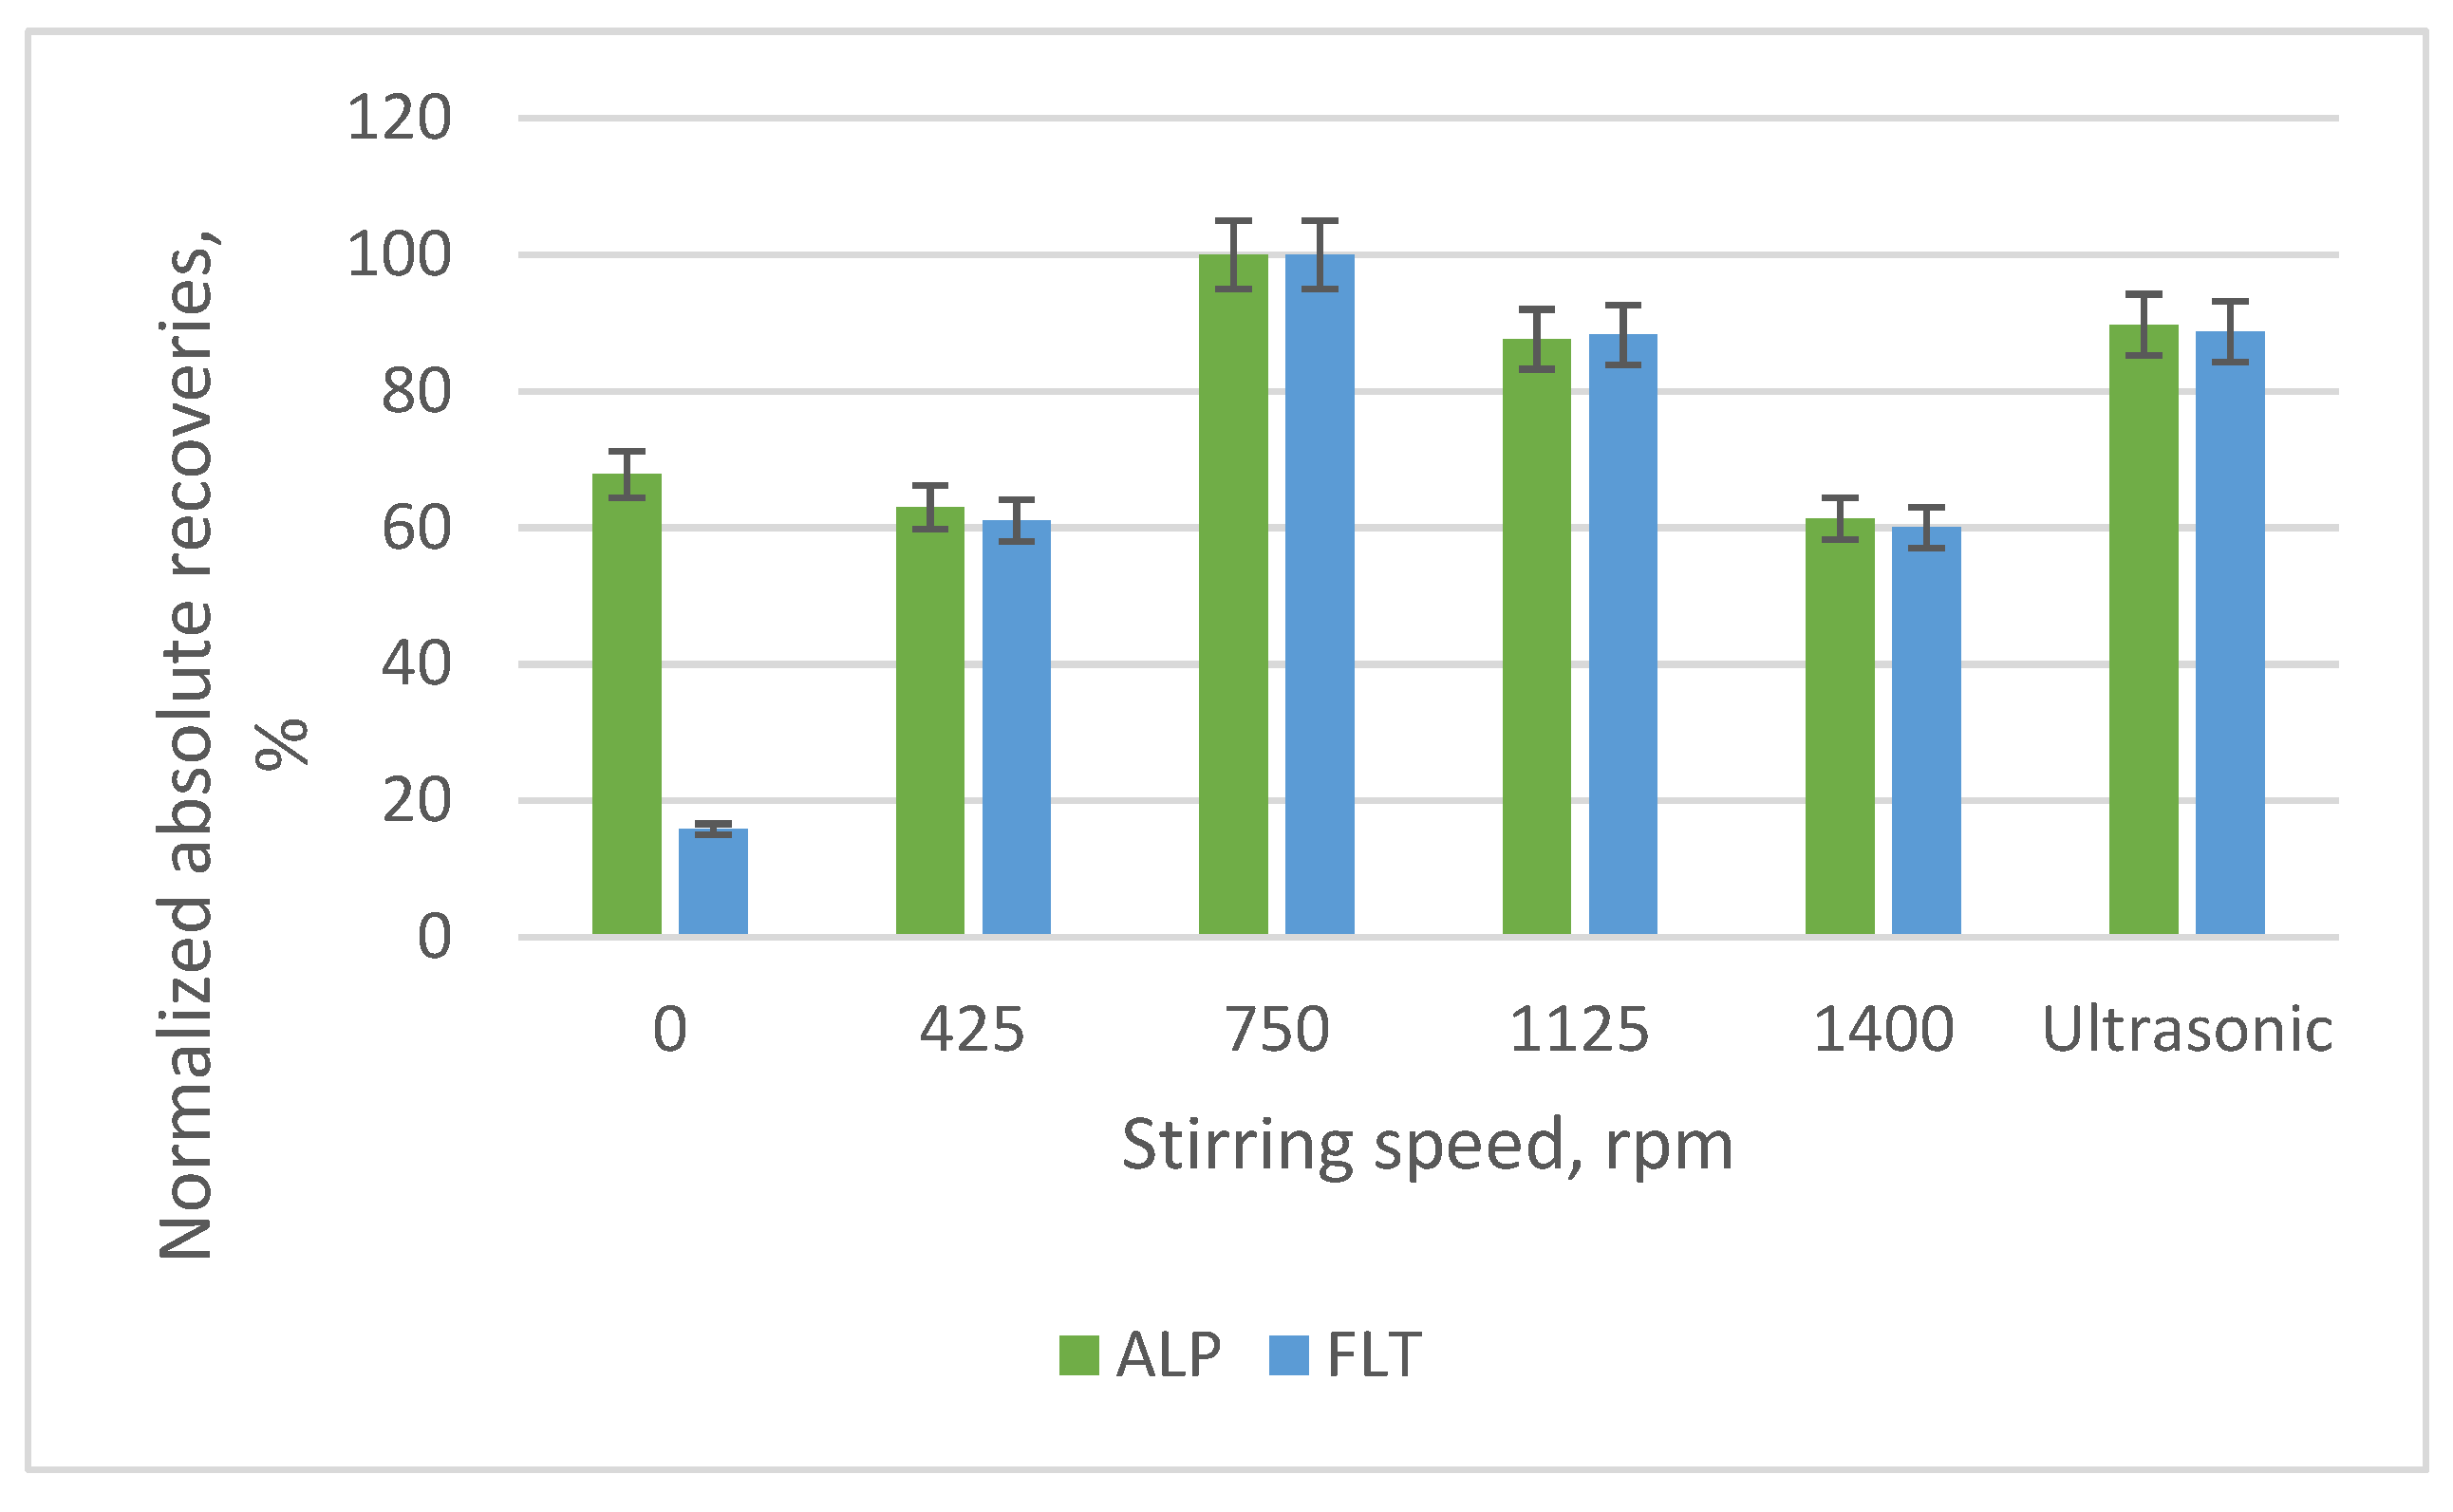
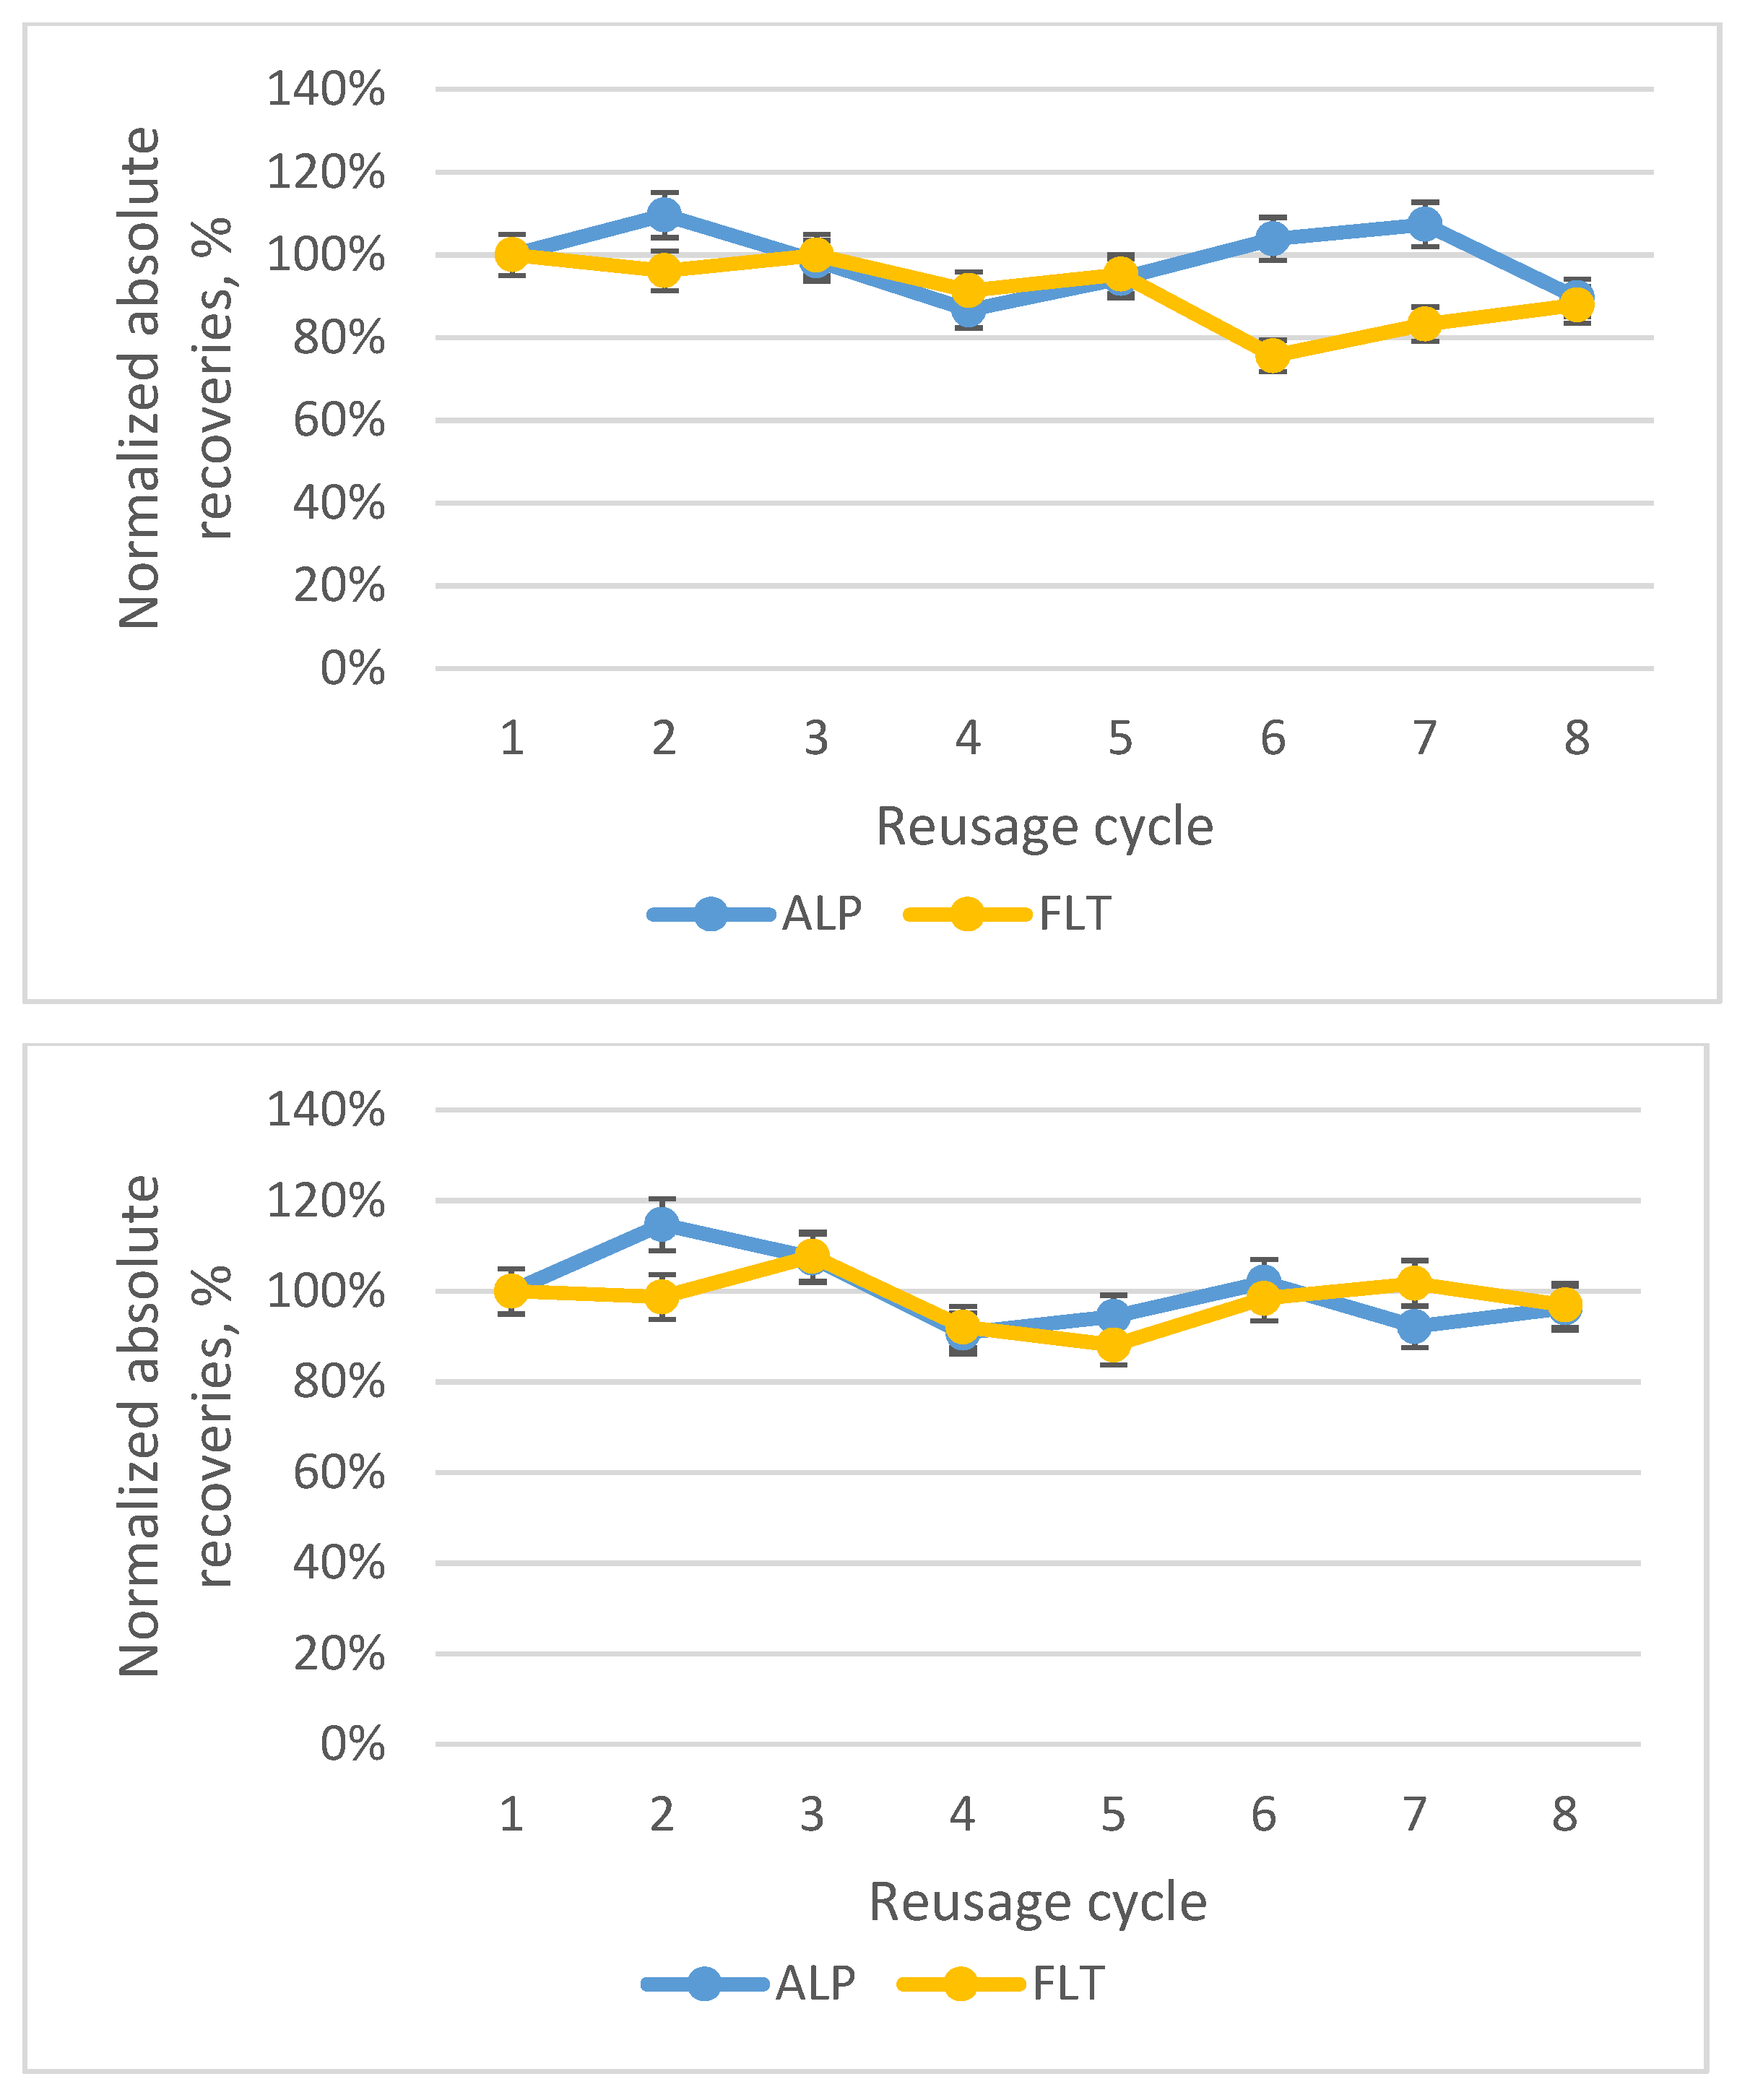
3.2. Optimization of the SB-MSPE Procedure

A set of parameters were studied for the optimization of the SB-MSPE protocol in the order that is described in Figure 4. For example, when the mass of the adsorbent was examined, the type of adsorbent was powdered GO-Chm, with ACN as an elution solvent and 0.5 mL as the eluent volume, with the duration of the extraction and elution being 30 min and 15 min, respectively, while the stirring speed was kept at 500 rpm and the sample volume being 10 mL, with a pH value of 7 and 0% w/v addition of NaCl.
The first parameter that was examined was the type of adsorbent that would be used. Preliminary experiments were conducted on magnetic graphene oxide (mGO), magnetic graphene oxide with polystyrene (mGO-PS), magnetic activated carbon (BAX), magnetic graphene oxide with polyaniline (mGO-PANI) and on the nanocomposite, both in powder (GO-Chm) and bead (GO-Chm@SA) form. In Figure S1, there are the five chromatographs obtained in superposition, and in Figure 5 a bar diagram of normalized absolute recoveries is given. In mGO-PANI, ALP could not be determined, while the GO-Chm@SA beads showed a decline in their extraction efficiency when the percentage of the GO-Chm content was increasing. Thus, GO-Chm in the form of powder was used as the adsorbent for the extraction of the two BZs. The powdered GO-Chm nanocomposite was characterized by Kyzas et al. [16], with the XRD, SEM, VSM, DTG, DTA, FT-IR and XPS techniques. Through the XRD and VSM techniques, the mean size of the magnetic nanoparticles Fe3O4 was calculated with the equation of Debye-Scherrer and found equal to 10.5 nm both in Chm and in GO-Chm, with a value of 9 emu/g for its saturated magnetization. The concentration of iron in the GO-Chm nanocomposite was approximately 12%, also having a rough surface, as indicated by SEM. Furthermore, with the DTG, DTA and FT-IR techniques, the identification of hydroxyl, carboxyl and amino groups was carried out, while the binding of chitosan onto the GO layer was confirmed.
The second parameter was the type and the volume of the elution solvent that would be used. ACN and MeOH were used in different volume ratios (100:0, 0:100, 70:30, 50:50, 30:70% v/v), while the possibility of adding a step of washing after the extraction and before the elution was studied with the addition of 1 mL of deionized water. The best results were shown with the pure ACN as a solvent, as it is a stronger eluent than MeOH, while the usage of deionized water showed a drop in the normalized absolute recoveries by 9–9.5% for the two analytes. Additionally, the elution volume that was selected was 0.5 mL, due to the increase in the preconcentration factor (or enrichment factor, EF) it provided. The prospect of using a nitrogen stream to evaporate the eluent and reconstitute it in a lower volume was also investigated, but the matrix effect would not allow their detection. Lastly, the EFs of the two compounds were calculated using the equation: EF = (Vsample/Veluent) × (Rabs%/100), where Rabs is the absolute recovery of each compound. In Figure 6 and Figure 7, the bar diagrams of normalized absolute recoveries are demonstrated for the type and the volume of eluent, respectively.
Another major parameter that affects the extraction efficiency is the mass of the adsorbent to be used. A variety of masses were examined (5, 10, 20, 30, 40, 50, 60 and 70 mg) and according to Figure 8, the optimum mass was 40 mg. When mass > 40 mg is used, a small increase is observed, while the use of <40 mg leads to a significant increase. Additionally, 40 mg was selected because it is considered a low mass, making the microextraction method greener.
Four volumes of the sample were assessed to obtain the greatest results. The former two volumes (10 and 20 mL) of the sample were added in a glass vial with the capacity of approximately 30 mL, while the latter two (50 and 100 mL) were put in glass beakers of 100 and 250 mL, respectively. The concentration of the analytes was the same in all four volumes, viz 10 ng/μL. In Figure 9, the diagram of the absolute recoveries is shown.
The effect of the duration of extraction and elution are two important factors that directly influence the extraction efficiency and the time needed for the whole method. Thus, different durations were investigated for the extraction (5, 10, 20, 30 and 40 min) and the elution (1, 5, 10, 15 and 20 min). The optimal durations are 30 min for the extraction, due to the vast gap between 20 and 30 min, and 10 min for the elution (Figure 10).
Another important parameter is the speed of stirring and the usage of ultrasonication. The speeds that were examined were 0, 425, 750, 1125 and 1400 rpm and the optimal was the 750 rpm, according to the bar diagram of Figure 11. For speeds > 750 rpm, a decline is observed, possibly since it was too fast and the interactions between the compounds and the adsorbent could not be established.
The addition of salt (namely NaCl) was investigated because the surface water samples, primarily the sea water samples, contain some dissolved salts. Besides trying to mimic the salinity of sea water samples, we wanted to check if the addition of extra NaCl would increase or not the recoveries of the extraction Hence, the addition of 0, 5, 10, 15 and 20% w/v of NaCl in the 10 mL of the sample volume was examined and it was noticed that the lower the percentage content, the better the absolute recoveries (Figure 12). Moreover, the phenomenon of precipitation of the nanocomposite was observed in high salt contents, rendering the analysis of surface water samples that have a high concentration of dissolved salts difficult.
The pH value affects the degree of ionization of the two benzodiazepines, so four values were studied. For this purpose, 10 mL of 1% v/v acetic acid, 10 mL of buffer solution of 0.5 M acetic acid—0.5 M sodium acetate, the addition of 10 mL deionized water and 10 mL of 1% w/v sodium acetate were prepared to reach the desired pH values of 3, 5, 7 and 9, respectively. The highest recoveries were acquired at a pH value of 7, where both ALP and FLT were 100% unionized and no extra reagents were used to change the pH value (Figure 13).
Finally, the effect of activating the functional groups of the adsorbent was examined by following the optimized thus far protocol. Two steps were added before the extraction, one step with the immersion of the adsorbent in 2 mL of MeOH and one step with the addition of 2 mL of deionized water. Three groups of durations were studied, and the best results were obtained with the duration of 5 min and 5 min of the two steps (Figure 14).
A factor that does not directly affect the extraction efficiency of the procedure but adds to its green character is the reusability of the adsorbent. Hence, two different vials were used, and the same protocol was followed for both of them. Eight cycles of extraction/elution were conducted within the same day, and the recoveries were found to be adequate at the 8th cycle. Therefore, the adsorbent could be used more than eight times. In Figure 15, the two diagrams of these vials are presented.

3.3. Optimal SB-MSPE Protocl

By following the optimized SB-MSPE procedure, the absolute recoveries (Rabs) of ALP and FLT are 32.37% and 34.15%, respectively, with enrichment factors (EF) of 6.47 and 6.83. In Table 1, the optimum conditions are given.

3.4. Validation of the Method

The calibration curves of the matrix curves were constructed with spiked water samples, following SB-MSPE. Linearity studies of extraction were performed, covering the whole working range. The data were processed by linear regression analysis of least squares of the peak area versus analyte concentration (ng/mL). The calibration curves were found to be linear up to 250 ng/mL, with coefficients of determination (r2) > 0.992, while LOD and LOQ values were determined as 3 ng/mL and 10 ng/mL, respectively, for ALP and FLT. The calibration results and obtained equations are demonstrated in Table 2.
Accuracy and precision were studied at three intermediate concentrations. Mean accuracy was expressed as the relative recovery (Rrel), which was between 98.0–104.1% for the two compounds, while intraday and interday precision was expressed via the relative standard deviation (RSD), which was lower than 11.9%. The results are summarized in Table 3.

3.5. Application to Real Samples

The surface water samples were taken from two rivers, Sperchios (RW 1) and Gorgopotamos (RW 2) at Fthiotida, Greece on 27 March 2021, and from three sea water samples, Port of Stylida (SW 1) and Karavomylos (SW 2) at Fthiotida, Greece on 29 March 2021 and from Aretsou (SW 3) of the municipality of Kalamaria at Thessaloniki, Greece on 25 May 2021. Neither ALP nor FLT was detected in the five samples without spiking appropriate amounts of stock solutions. Each concentration level (0, 25 and 50 ng/mL) was analyzed thrice to calculate the RSDs and the Rrel. A typical chromatograph of a lake water sample is shown at Figure 16, while the rest are shown in Figures S2–S5. Lastly, in Table 4 the results of the real surface water samples are demonstrated, where low RSDs were obtained along with high relative recoveries, highlighting that the proposed method is highly accurate and precise for its application to real surface water samples for the determination of ALP and FLT with the usage of the powdered nanocomposite GO-Chm as an extraction medium.

4. Discussion

A literature review for the determination methods of ALP and FLT was conducted and presented in Table 5 for the comparison of this method with old ones. It is evident that the new SB-MSPE method has a low duration of sample pretreatment, by utilizing a reusable sorbent which gives satisfying relative recoveries, rendering it highly precise. The advantages of the newly developed method are the low cost and the ease of synthesis of the nanocomposite GO-Chm and its simple and inexpensive instrumentation. The only drawback is the high LODs and LOQs achieved, due to the use of a PDA detector.
The preparation of a graphene oxide with magnetic chitosan (GO-Chm) nanocomposite has been successful and its characterization has taken place. Moreover, its application for the extraction of alprazolam (ALP) and flunitrazepam (FLT), two benzodiazepines, from surface water samples has been effective with the development and optimization of a stir bar magnetic solid phase extraction (SB-MSPE), following their chromatographic separation and quantification with a simple, accurate and precise method that was developed and validated. Precision and repeatability were expressed by RSD values, which were lower than 10% in the application of real samples. The relative recoveries that express its accuracy were in the range of 93.6–112.9% in river and sea water samples.
The new sample preparation technique that was used complies with the Green Analytical Chemistry (GAC) principles, because of the usage of small amounts of organic solvents that have a low toxicity and its swift duration. The low cost and ease of the preparation of the nanocomposite makes it ideal for an adsorbent of a variety of organic aromatic compounds and metal ions, thus purifying wastewater samples. Hence, the material can be both used as a filtration media and as an adsorbent in analytical chemistry.
The only disadvantage this method faced was the higher LODs and LOQs from the other methods reported in the literature, possibly due to the use of a PDA detector while most of the other authors used an MS/MS, increasing the sensitivity and decreasing the limits. However, the simplicity, the swiftness, the high accuracy and precision of the SB-MSPE-HPLC-PDA proposed method offers more advantages to the scientific area.

5. Conclusions

The synthesis of GO-Chm and its application as an adsorbent in the extraction of the two benzodiazepines proved important, as it can be used for their determination by the analytical method that was proposed, or for its cleaning properties, due to the adsorption of pharmaceutical compounds from water. The time of the extraction has been significantly lowered at 50 min, with the use of small quantities of organic solvents (2 mL of methanol and 0.5 mL of acetonitrile in each extraction cycle) and of the adsorbent (40 mg that can be reused for more than eight times) due to the microextraction technique that was utilized. The herein developed SB-MSPE-HPLC-PDA method is fully validated and proved to be accurate and precise for the determination of alprazolam and flunitrazepam in surface water samples, with relative recoveries ranging between 93.6–112.9% and RSDs lower than 10%, by using this nanocomposite as an adsorbent. It requires a rapid and easy sample preparation and the instrumentation involved is inexpensive and straightforward.

Supplementary Materials

The following are available online at https://www.mdpi.com/article/10.3390/app11177828/s1. In the supplementary materials file, 5 figures (Figures S1–S5) are presented, along with a quick 3D animation of the proposed SB-MSPE procedure: https://drive.google.com/file/d/1LP8cYSgnNR54WWnVbwzCTurCypcHzV8G/view?usp=sharing.

Author Contributions

Conceptualization, E.D. and V.S.; methodology, O.-E.P., E.D. and V.S.; software, O.-E.P.; validation, O.-E.P., E.D. and V.S.; formal analysis, O.-E.P., E.D. and V.S.; investigation, O.-E.P., E.D. and V.S.; resources, E.D. and V.S.; data curation, O.-E.P.; writing—original draft preparation, O.-E.P.; writing—review and editing, E.D. and V.S.; visualization, O.-E.P.; supervision, E.D. and V.S.; project administration, V.S.; funding acquisition, E.D. and V.S. All authors have read and agreed to the published version of the manuscript.

Funding

This research received no external funding.

Institutional Review Board Statement

Not applicable.

Informed Consent Statement

Not applicable.

Data Availability Statement

Available upon request.

Conflicts of Interest

The authors declare no conflict of interest.

References

  1. Sherma, J.; Zweig, G. History and introduction. Pap. Chromatogr. 1971, 1–5. [Google Scholar] [CrossRef]
  2. Gluck, M. Medicolegal considerations. Can. Med. Assoc. J. 1989, 141, 61–62. [Google Scholar] [CrossRef]
  3. Gláz, E.; Vecsei, P. Biological activity. Aldosterone 1971, 90–107. [Google Scholar] [CrossRef]
  4. Kraemer, T.; Maurer, H. Chapter 6 Sedatives and Hypnotics; Elsevier: Amsterdam, The Netherlands, 2007; Volume 6, pp. 243–286. [Google Scholar]
  5. Drillia, P.; Stamatelatou, K.; Lyberatos, G. Fate and mobility of pharmaceuticals in solid matrices. Chemosphere 2005, 60, 1034–1044. [Google Scholar] [CrossRef] [PubMed]
  6. Kalogiouri, N.P.; Tsalbouris, A.; Kabir, A.; Furton, K.G.; Samanidou, V.F. Synthesis and application of molecularly imprinted polymers using sol–gel matrix imprinting technology for the efficient solid-phase extraction of BPA from water. Microchem. J. 2020, 157, 104965. [Google Scholar] [CrossRef]
  7. Huerta-Fontela, M.; Galceran, M.T.; Ventura, F. Occurrence and removal of pharmaceuticals and hormones through drinking water treatment. Water Res. 2011, 45, 1432–1442. [Google Scholar] [CrossRef]
  8. Manousi, N.; Deliyanni, E.; Rosenberg, E.; Zachariadis, G. Ultrasound-assisted magnetic solid-phase extraction of polycyclic aromatic hydrocarbons and nitrated polycyclic aromatic hydrocarbons from water samples with a magnetic polyaniline modified graphene oxide nanocomposite. J. Chromatogr. A 2021, 1645, 462104. [Google Scholar] [CrossRef]
  9. Kosjek, T.; Perko, S.; Zupanc, M.; Hren, M.Z.; Dragičević, T.L.; Žigon, D.; Kompare, B.; Heath, E. Environmental occurrence, fate and transformation of benzodiazepines in water treatment. Water Res. 2012, 46, 355–368. [Google Scholar] [CrossRef]
  10. Plastiras, O.-E.; Andreasidou, E.; Samanidou, V. Microextraction techniques with deep eutectic solvents. Molecules 2020, 25, 6026. [Google Scholar] [CrossRef] [PubMed]
  11. Alampanos, V.; Samanidou, V. Current trends in green sample preparation before liquid chromatographic bioanalysis. Curr. Opin. Green Sustain. Chem. 2021, 31, 100499. [Google Scholar] [CrossRef]
  12. Manousi, N.; Plastiras, O.-E.; Deliyanni, E.; Zachariadis, G. Green bioanalytical applications of graphene oxide for the extraction of small organic molecules. Molecules 2021, 26, 2790. [Google Scholar] [CrossRef]
  13. Plastiras, O.-E.; Deliyanni, E.; Samanidou, V. Applications of graphene-based nanomaterials in environmental analysis. Appl. Sci. 2021, 11, 3028. [Google Scholar] [CrossRef]
  14. Vállez-Gomis, V.; Grau, J.; Benedé, J.L.; Giokas, D.L.; Chisvert, A.; Salvador, A. Fundamentals and applications of stir bar sorptive dispersive microextraction: A tutorial review. Anal. Chim. Acta 2021, 1153, 338271. [Google Scholar] [CrossRef] [PubMed]
  15. Zeeb, M.; Farahani, H. Graphene oxide/Fe3O4@polythionine nanocomposite as an efficient sorbent for magnetic solid-phase extraction followed by high-performance liquid chromatography for the determination of duloxetine in human plasma. Chem. Pap. 2017, 72, 15–27. [Google Scholar] [CrossRef]
  16. Travlou, N.A.; Kyzas, G.Z.; Lazaridis, N.K.; Deliyanni, E.A. Functionalization of graphite oxide with magnetic chitosan for the preparation of a nanocomposite dye adsorbent. Langmuir 2013, 29, 1657–1668. [Google Scholar] [CrossRef] [PubMed]
  17. Kyzas, G.Z.; Travlou, N.A.; Kalogirou, O.; Deliyanni, E.A. Magnetic graphene oxide: Effect of preparation route on reactive black 5 adsorption. Materials 2013, 6, 1360–1376. [Google Scholar] [CrossRef] [Green Version]
  18. Rekos, K.; Kampouraki, Z.-C.; Sarafidis, C.; Samanidou, V.; Deliyanni, E. Graphene oxide based magnetic nanocomposites with polymers as effective bisphenol–A nanoadsorbents. Materials 2019, 12, 1987. [Google Scholar] [CrossRef] [Green Version]
  19. Filippou, O.; Deliyanni, E.A.; Samanidou, V.F. Fabrication and evaluation of magnetic activated carbon as adsorbent for ultrasonic assisted magnetic solid phase dispersive extraction of bisphenol A from milk prior to high performance liquid chromatographic analysis with ultraviolet detection. J. Chromatogr. A 2017, 1479, 20–31. [Google Scholar] [CrossRef]
  20. Neelgund, G.M.; Bliznyuk, V.N.; Oki, A. Photocatalytic activity and NIR laser response of polyaniline conjugated graphene nanocomposite prepared by a novel acid-less method. Appl. Catal. B Environ. 2016, 187, 357–366. [Google Scholar] [CrossRef] [Green Version]
  21. Lazaridis, N.; Charalambous, C. Sorptive removal of trivalent and hexavalent chromium from binary aqueous solutions by composite alginate–goethite beads. Water Res. 2005, 39, 4385–4396. [Google Scholar] [CrossRef]
  22. Ali, S.N.; Sultana, N.; Arayne, M.S.; Qayoom, A. Liquid chromatographic determination of alprazolam with ace inhibitors in bulk, respective pharmaceutical products and human serum. Sci. Int. (Lahore) 2016, 28, 3815. [Google Scholar]
  23. Pongampai, S.; Amornpitoksuk, P.; Kanatharana, P.; Rujiralai, T.; Suwanboon, S.; Leesakul, N. Detection of flunitrazepam through photocatalytic reaction of ZnO particles in coloured spirits by UV-Vis spectrophotometer. Sci. Asia 2011, 37, 320–326. [Google Scholar] [CrossRef]
  24. Jiménez, J.J.; Sánchez, M.I.; Muñoz, B.E.; Pardo, R. Persistence of alprazolam in river water according to forced and non-forced degradation assays: Adsorption to sediment and long-term degradation products. Drug Test. Anal. 2017, 9, 1204–1213. [Google Scholar] [CrossRef]
  25. Racamonde, I.; Quintana, J.B.; Rodil, R.; Cela, R. Application of polypropylene tubes as single-use and low-cost sorptive extraction materials for the determination of benzodiazepines and zolpidem in water samples. Microchem. J. 2015, 119, 58–65. [Google Scholar] [CrossRef]
  26. Bade, R.; Ghetia, M.; White, J.M.; Gerber, C. Determination of prescribed and designer benzodiazepines and metabolites in influent wastewater. Anal. Methods 2020, 12, 3637–3644. [Google Scholar] [CrossRef] [PubMed]
  27. Nunes, C.N.; Pauluk, L.E.; Dos Anjos, V.E.; Lopes, M.C.; Quináia, S.P. New approach to the determination of contaminants of emerging concern in natural water: Study of alprazolam employing adsorptive cathodic stripping voltammetry. Anal. Bioanal. Chem. 2015, 407, 6171–6179. [Google Scholar] [CrossRef]
  28. López-García, E.; Mastroianni, N.; Postigo, C.; Barceló, D.; de Alda, M.L. A fully automated approach for the analysis of 37 psychoactive substances in raw wastewater based on on-line solid phase extraction-liquid chromatography-tandem mass spectrometry. J. Chromatogr. A 2018, 1576, 80–89. [Google Scholar] [CrossRef]
  29. González-Mariño, I.; Castro, V.; Montes, R.; Rodil, R.; Lores, A.; Cela, R.; Quintana, J.B. Multi-residue determination of psychoactive pharmaceuticals, illicit drugs and related metabolites in wastewater by ultra-high performance liquid chromatography-tandem mass spectrometry. J. Chromatogr. A 2018, 1569, 91–100. [Google Scholar] [CrossRef]
Figure 1. Photo of the GO-Chm@SA beads with a percentage of 0.5% (right above), 1% (left above) and 2% w/w (below).
Applsci 11 07828 g001
Figure 2. Typical chromatograph of the two compounds in an aquatic stock solution after its sample pretreatment with the prepared nanocomposite GO-Chm.
Applsci 11 07828 g002
Figure 3. UV spectra of (a) Alprazolam, ALP and (b) Flunitrazepam, FLT.
Applsci 11 07828 g003
Figure 4. Methodological path of the optimization of the SB-MSPE procedure.
Applsci 11 07828 g004
Figure 5. Bar diagram of the normalized absolute recoveries of the different adsorbents according to GO-Chm.
Applsci 11 07828 g005
Figure 6. Bar diagram of the normalized absolute recoveries of the different types of elution solvent according to acetonitrile (ACN).
Applsci 11 07828 g006
Figure 7. Bar diagram of the normalized absolute recoveries of the different volumes of the elution solvent according to 0.5 mL.
Applsci 11 07828 g007
Figure 8. Diagram of the normalized absolute recoveries of the different masses of the adsorbent according to the 40 mg.
Applsci 11 07828 g008
Figure 9. Diagram of the absolute recoveries of the different sample volumes that were examined.
Applsci 11 07828 g009
Figure 10. Bar diagram of the normalized absolute recoveries of the different durations of extraction (above) and of the elution (below) according to 30 min and 10 min, respectively.
Applsci 11 07828 g010
Figure 11. Bar diagram of the normalized absolute recoveries of the different speeds of stirring and the application of ultrasonication according to 750 rpm.
Applsci 11 07828 g011
Figure 12. Bar diagram of the normalized absolute recoveries of the different percent content (% w/v) of salt according to the optimal 0%.
Applsci 11 07828 g012
Figure 13. Bar diagram of the normalized absolute recoveries of the different pH values according to pH 7.
Applsci 11 07828 g013
Figure 14. Diagram of the absolute recoveries that depend on the activation of the adsorbent. The first duration refers to the first step of immersion in methanol and the second duration to the second step of the addition of deionized water.
Applsci 11 07828 g014
Figure 15. Diagram of the normalized absolute recoveries of the two vials until the eighth cycle, according to the first cycle.
Applsci 11 07828 g015
Figure 16. Typical chromatographs in superposition of RW 2 in three different spiked concentrations (0, 25 and 50 ng/mL).
Applsci 11 07828 g016
Table 1. Optimal conditions for achieving the highest recoveries.
Examined ParameterValue
Elution SolventCH3CN (ACN)
Adsorbent Mass40 mg
Volume of Elution Solvent0.5 mL
Volume of Sample10 mL
Stirring Speed750 rpm
Addition of Salt0% w/v
pH7
Activation Time with MeOH5 min
Activation Time with DW 15 min
Duration of Extraction30 min
Duration of Elution10 min
Total Duration50 min
1 Deionized Water.
Table 2. Calibration curves and linearity data of the two analytes.
BenzodiazepineRegression Equation 1R2
Alprazolam (ALP)Y = 3826.3 X + 55280.992
Flunitrazepam (FLT)Y = 3043.6 X + 4838.20.9999
1 Y = peak area, X = ng/mL.
Table 3. Precision and Accuracy data of the two analytes at three concentration levels.
Precision and AccuracySpiked ng/mLRSD% (ALP, FLT)Rrel% (ALP, FLT)
Intra-day (n = 3)
repeatability
252.2, 2.2102.1, 103.9
501.7, 3.9103.8, 100.2
1005.9, 9.1103.0, 102.0
Inter-day (n = 2 × 4)
precision
257.3, 11.998.0, 104.1
507.7, 10.3103.7, 103.5
1009.4, 9.6100.7, 100.8
Table 4. Results from the application of the method in surface water samples for ALP and FLT.
Spiked ng/mLSampleFound ALP, FLTRSD% (ALP, FLT)Rrel% (ALP, FLT)
Xaverage ± s
0RW 1N/D 1, N/D--
RW 2N/D, N/D--
SW 1N/D, N/D--
SW 2N/D, N/D--
SW 3N/D, N/D--
25RW 124.0 ± 1.4, 25.3 ± 1.45.8, 5.496.1, 101.0
RW 224.7 ± 1.2, 26.0 ± 0.84.8, 2.998.9, 104.1
SW 124.2 ± 1.9, 26.0 ± 0.87.8, 6.296.6, 95.9
SW 225.8 ± 1.7, 26.9 ± 1.46.6, 5.4103.1, 107.5
SW 323.4 ± 0.9, 28.2 ± 2.73.8, 9.593.6, 112.9
50RW 147.2 ± 2.0, 48.5 ± 0.84.2, 1.694.3, 97.0
RW 250.9 ± 2.0, 49.5 ± 2.44.0, 4.9101.8, 98.9
SW 148.8 ± 2.7, 48.1 ± 2.05.6, 4.197.6, 96.3
SW 248.8 ± 3.4, 45.8 ± 0.57.0, 1.197.6, 91.7
SW 348.5 ± 1.5, 48.2 ±3.73.0, 7.797.0, 96.3
1 Not Detected.
Table 5. Comparison of method’s characteristics with other studies in literature.
CompoundsSample Pretreatment TechniqueDetermination TechniqueTime of Sample PretreatmentTime of DeterminationLOD (ng/L)LOQ (ng/L)Rrel%Reference
ALPSPEUPLC-MS/MS~40 min6.5 min205097[24]
17 BZs (ALP + FLT)Single use PP TubesLC-MS/MS~14 h29 min1, 33, 1087–117[25]
22 BZs (ALP + FLT)SPEUPLC-MS/MSN/R 120 min0.25, 21, 480–120[26]
ALPN/RPD-AdsCSV 2N/R120 s10040093–120[27]
9 BZs (ALP)On-line SPELC-MS/MSSome minutes47 min0.61.980–120[28]
8 BZs (ALP)SPEUHPLC-MS/MS~40 min6.5 minN/R0.965–134[29]
ALP + FLTSB-MSPEHPLC-PDA50 min10 min300010,00093.6–112.9This study
1 Not Reported. 2 Differential Pulse Adsorptive Cathodic Stripping Voltammetry.
Publisher’s Note: MDPI stays neutral with regard to jurisdictional claims in published maps and institutional affiliations.

